Article

Quantifying the Impact of the Billion Tree Afforestation Project (BTAP) on the Water Yield and Sediment Load in the Tarbela Reservoir of Pakistan Using the SWAT Model

by
Muhammad Shafeeque
1,2,†,
Abid Sarwar
1,*,†,
Abdul Basit
1,
Abdelmoneim Zakaria Mohamed
3,
Muhammad Waseem Rasheed
4,5,
Muhammad Usman Khan
6,
Noman Ali Buttar
7,
Naeem Saddique
1,
Mohammad Irfan Asim
1 and
Rehan Mehmood Sabir
1
1
Department of Irrigation and Drainage, University of Agriculture, Faisalabad 38000, Pakistan
2
Institute of Geography, University of Bremen, 28359 Bremen, Germany
3
Division of Agriculture and Natural Resources—Kearney Agricultural Research and Extension Center, University of California, Parlier, CA 93648, USA
4
Key Laboratory of Mountain Surface Processes and Ecological Regulation, Institute of Mountain Hazards and Environment, Chinese Academy of Sciences, Chengdu 61004, China
5
University of Chinese Academy of Sciences (UCAS), Beijing 100049, China
6
Department of Energy Systems Engineering, University of Agriculture Faisalabad, Faisalabad 38000, Pakistan
7
Department of Agricultural Engineering, Khawaja Fareed University of Engineering and Information Technology, Rahim Yar Khan 64200, Pakistan
*
Author to whom correspondence should be addressed.
These authors contributed equally to this work.
Land 2022, 11(10), 1650; https://doi.org/10.3390/land11101650
Submission received: 30 August 2022 / Revised: 20 September 2022 / Accepted: 22 September 2022 / Published: 24 September 2022
(This article belongs to the Section Soil-Sediment-Water Systems)

Abstract

:
The live storage of Pakistan’s major reservoirs, such as the Tarbela reservoir, has decreased in recent decades due to the sedimentation load from the Upper Indus Basin, located in High Mountain Asia. The government of Khyber Pakhtunkhwa took the initiative in 2014 and introduced the Billion Tree Afforestation Project (BTAP). They planted one billion trees by August 2017, mostly in hilly areas. In 2018, the Government of Pakistan also launched a project of 10 billion trees in five years. We assessed the effect of different land-use and land-cover (LULC) scenarios on the water yield and sediment load in the Tarbela reservoir of Pakistan. The soil and water assessment tool (SWAT) model was used to predict the impacts of the LULC changes on the water yield and sediment load under three distinct scenarios: before plantation (2013), after planting one billion trees (2017), and after planting ten billion trees (2025). The model calibration and validation were performed from 1984 to 2000 and 2001 to 2010, respectively, using the SUFI2 algorithm in SWAT-CUP at the Bisham Qila gauging station. The statistical evaluation parameters showed a strong relationship between observed and simulated streamflows: calibration (R2 = 0.85, PBIAS = 11.2%, NSE = 0.84) and validation (R2 = 0.88, PBIAS = 10.5%, NSE = 0.86). The validation results for the sediment load were satisfactory, indicating reliable model performance and validity accuracy (R2 = 0.88, PBIAS = −19.92%, NSE = 0.86). Under the LULC change scenarios, the water yield’s absolute mean annual values decreased from 54 mm to 45 mm for the first and second scenarios, while the third scenario had an estimated 35 mm mean annual water yield in the Tarbela reservoir. The sediment load results for the second scenario (2017) showed a 12% reduction in the sediment flow in the Tarbela reservoir after 1 billion trees were planted. In the third scenario (2025), following the planting of 10 billion trees, among which 3 billion were in the Tarbela basin, the sediment load was predicted to decrease by 22%. The overall results will help to inform the water managers and policymakers ahead of time for the best management and planning for the sustainable use of the water reservoirs and watershed management.

1. Introduction

The world’s water resources are adversely affected by rising temperatures, abrupt rainfall patterns, and human interventions, e.g., land-use and land-cover (LULC) changes [1,2,3]. The unpredictable rainfall patterns and increased temperatures result from unmeasured manmade industrial progress that is causing climate change [3,4]. Developing nations are paying the price for global climate trends [5]. Pakistan is a developing country that has hilly areas in the north, flat areas in the middle, and a sea in the south. The storage capacity of reservoirs reduces due to heavy rainfall and snow melting in northern areas, resulting in heavy sediment flow with surface runoff from north to south [6], creating flood situations in the middle areas. The reduced storage capacity of reservoirs in the Indus River Basin will limit the 20% water supplies for agricultural land in the Rabi season by 2050 [7]. There is an imminent need for appropriate catchment management for water reservoirs in Pakistan, and such sustainable measures require precise predictions of the water yield and sediment load from the catchment.
Sediments flow with surface runoff due to soil erosion. Soil erosion and surface runoff depend upon the precipitation (snowfall and rainfall) and land cover [8]. In the recent decade, deforestation in the northern region of Pakistan has increased soil erosion and runoff [9]. Urbanization increases runoff, which results in an increase in the flow of sedimentation and reduces the infiltration [10]. One of the past studies [11] suggested that sediments in the river flows of the Indus basin were significantly reduced over the past three decades. However, they highlighted that this reduction was due to rainfall reduction and the Karakoram anomaly. The barren topography could pose serious environmental concerns regarding water yield and soil erosion in arid and semi-arid catchments [12]. Therefore, LULC changes could play a major role in controlling the surface runoff and the sediment load in river flows.
In the Tarbela reservoir, surface runoff has the most significant and substantial positive relationship with sedimentation [13]. Thus, a seasonal link between the surface runoff and the bulk of the sediment was discovered while observing sedimentation trends. As a result, the entering sediment rate is also high during the monsoon season, which is when the flow is most significant because of higher liquid precipitation and meltwater [14,15]. It was determined that the sedimentation rate of the Tarbela reservoir varies seasonally, with the highest rate occurring during a monsoon. Among the three independent variables of temperature, rainfall, and inflow, inflow had the most substantial impact on the sedimentation of the Tarbela reservoir. By global standards, the flow regime of the Indus is relatively stable from year to year, with a prominent peak in the annual hydrograph occurring between June and September due to regular snowmelt inputs from the upper rains on the lower catchment [16]. Due to sediment flow, the storage capacity of the Tarbela reservoir is reduced and the flood level is raised [17]. In the four provinces of Pakistan, thousands of people died or migrated due to floods between 1950 to 2015. Every year, a decrease of 1 to 2% of the total storage capacity occurs in the reservoirs of Pakistan [6].
Afforestation and reforestation greatly impact the flow of runoff and sediments by changing the LULC [18]. Pakistan’s forestation has decreased from about 3.3% to 1.9% since 1990 [19]. To meet the country’s water requirement and provide a step toward climate change mitigation and adaptation, the provincial government of Khyber Pakhtunkhwa (KPK) took the initiative and introduced the Billion Tree Afforestation Project (BTAP) in 2014 and claimed they would plant one billion trees by 2017 [20,21]. In this project, a 350,000 ha area was covered with forestation. Over different topographies, suitable species of trees were planted [19]. The project was divided into three phases: the first phase was started in 2014 and completed in 2015, covering the southern region of the KPK; the duration of phase 2 was from 2015 to 2016, covering the Hazara region; and the third phase was completed in 2017 and covered the Malakand region. In the BTAP, 88.75% of the planted trees grow properly [22]. On 3 September 2018, the Prime Minister of Pakistan announced the planting of ten billion trees countrywide, from which three billion will be planted in the upper Indus basin area. The Ten BTAP project is expected to be completed by the end of 2024 [23]. We hypothesized that plantations in the BTAP project would create a positive impact by reducing the sediment load in the Indus River flow and consequently lower the sedimentation in the Tarbela reservoir.
Hydrological modeling is a suitable tool to assess such impacts of plantation on sedimentation. The SWAT (Soil and Water Assessment Tool) model is one of the best models for evaluating the hydrological response due to LULC changes in watersheds with various soil, climate, and management conditions [24]. The SWAT evaluates long-term watershed components at monthly and daily scales [25]. With little information, the SWAT model did well at locating hydrological components worldwide [16]. Many studies were conducted using the SWAT model to assess the fluctuation in sedimentation load and surface runoff in Pakistan’s critical reservoirs by considering changes in the slope, soil type, climate data, and grassland [26]. Before the BTAP, the SWAT model was used to assess the sedimentation load in the Tarbela reservoir [14,27]. Ijaz et al. [12] applied the SWAT model in the Gomal River catchment to investigate the water yield and sediment load. They assessed the impact of different precipitation datasets on simulations. However, they did not consider the impact of LULC changes. Hosseini and Khaleghi [28] investigated sediment load uncertainties under climate change. They did not consider LULC changes in their simulations. Similarly, Ali et al. [29] did not investigate the effect of forest cover changes while investigating the runoff and sediment load in Upper Indus Basin using the SWAT model. Despite the certain socioeconomic implications of the BTAP project, none of the published studies examined the surface runoff and sedimentation flow at the Tarbela reservoirs after the BTAP plantation. Saddique et al. [18] applied the SWAT model to quantify the impacts of the LULC in an adjacent catchment. However, they mainly focused on the snow cover changes. Therefore, in this work, we used the SWAT model to calculate the effect of the LULC on the sediments and streamflow.
We investigated the study’s hypothesis of whether and how much increasing the plantation size would impact the water yield and reduce the Tarbela reservoir’s sediment load. The main objective was to quantify the impacts of the grown plantations under the BTAP on the water yield and sediment load in the Tarbela reservoir of Pakistan. We developed three simulation scenarios with different LULC datasets and used the SWAT model. In the first case, the LULC data before the BTAP planting was used to determine the sedimentation and streamflow. The second scenario used LULC data after the planting of 1 billion trees. We used projected LULC changes data in the third scenario with the planting of 3 billion trees in our study area. This research will greatly impact the socioeconomic conditions of Pakistan. This is important because studying the water storage capacity of the Tarbela reservoir is imperative to providing the data needed for its management. Proper management of the Tarbela reservoir would allow for sustainable water supplies to support the growing population and conservational flows under climate change. The quantitative impacts of BTAP plantations on runoff and sedimentation were assessed in this study. Based on our findings, recommendations were drawn for proactive policymaking and management strategies.

2. Materials and Methods

2.1. Study Area

The drainage basin of the Tarbela Dam was the research’s study area (Figure 1); it is one of Pakistan’s largest reservoirs, with an installed capacity of 3478 MW [30]. Pakistan’s Tarbela Dam Project (TDP) is the backbone of the country’s hydropower resources. It is the largest dam in the world in terms of structural volume and landfill. Sedimentation has reduced the massive body of water generated behind the dam [14]. In the mid-1960s and 1970s, feasibility and engineering studies that investigated Tarbela Dam noted the possible sedimentation concerns that would undoubtedly arise a few years after the dam’s construction. Its live storage capacity was 11.96 BCM after construction. Now its capacity is reduced to 7.64 BCM due to sedimentation [23]. Tarbela Dam is located on the Indus River in Haripur and Swabi district and is situated at 34°05′23” N and 72°41′54” E. Its height is 143 m above sea level.
The highest temperatures of up to 40 °C occur during the summer and temperatures as low as 3 °C occur in winter. Relative humidity plays a part during the monsoon season and can reach up to 50%. The annual precipitation is 593 mm/yr in the Upper Indus Basin [31], which is the catchment area for the Tarbela reservoir. The information on meteorological stations is provided in Table 1.

2.2. SWAT Model

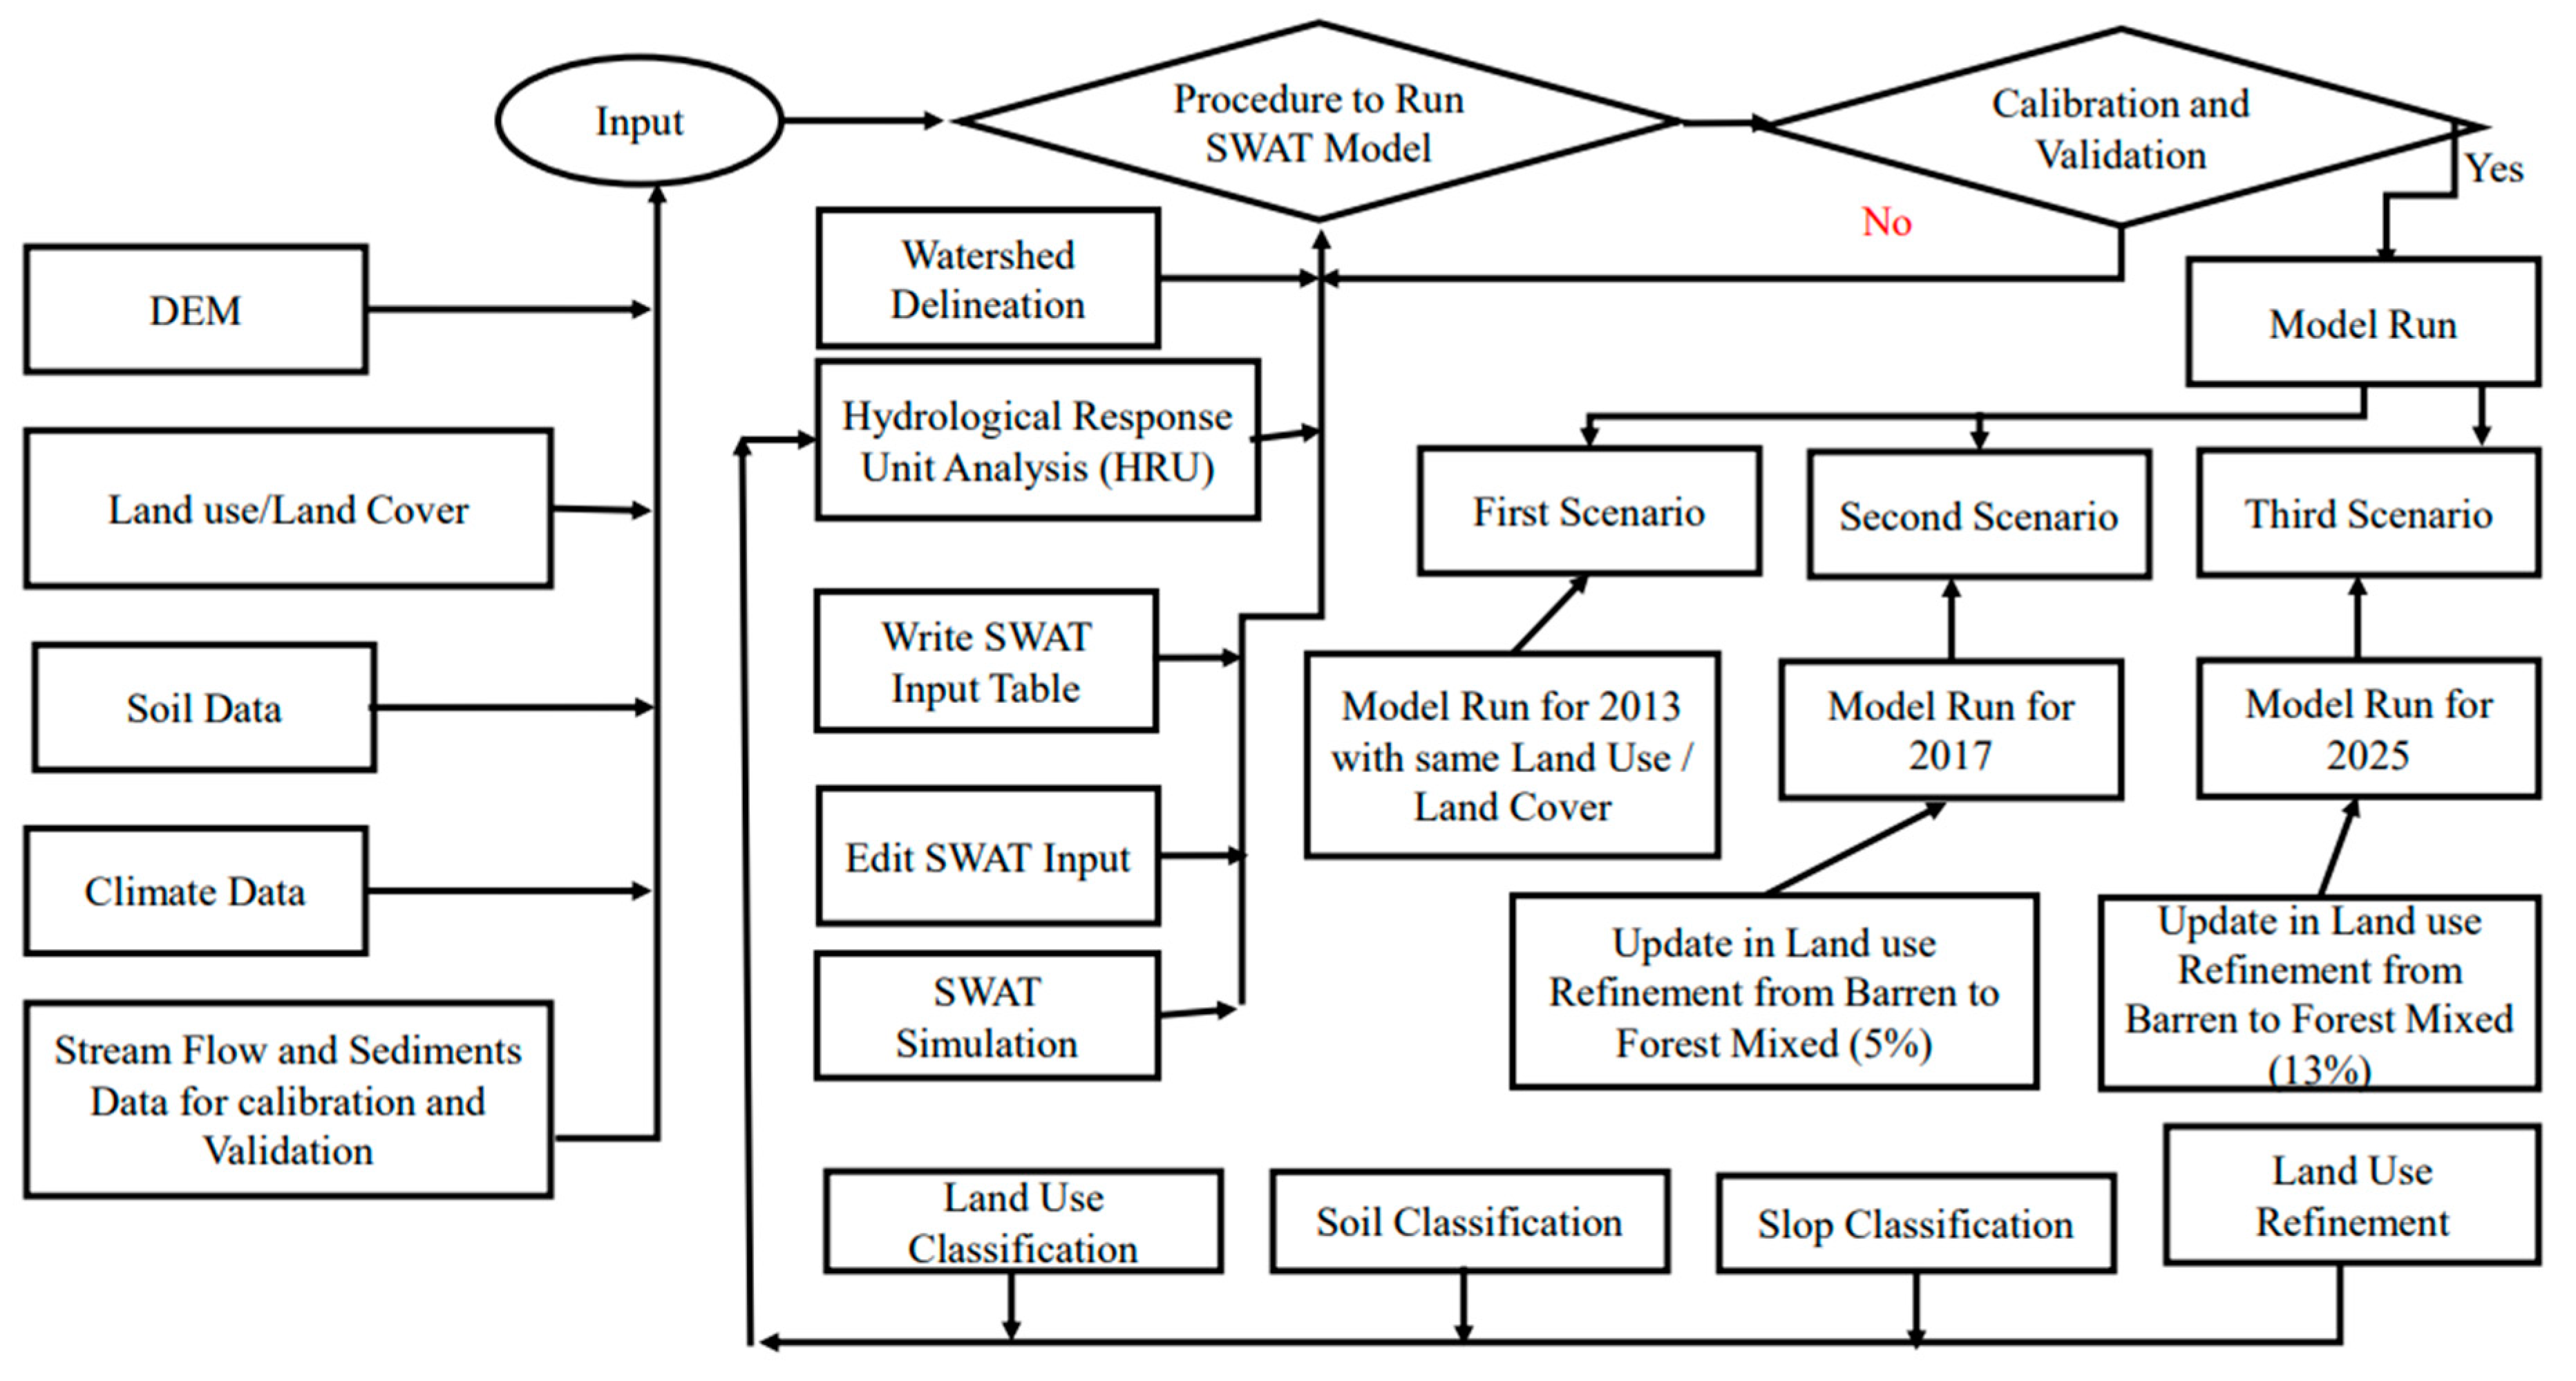
To simulate hydrological processes, the SWAT requires precise data, such as climate variables, LULC, geography, and river basin management [32]. Because similar qualities within sub-basins can be merged into hydrological response units, this makes the model easier to use. The replication results were immediately added to the sub-basins throughout the basin’s length, and the HRUs were separated. The SWAT can be discretized depending on the grid or aggregated, in addition to the commonly used HRU discretization [33]. In this study, we used an HRU-based discretization scheme. A flowchart of the methodology is presented in Figure 2.

2.3. Data Preparation

2.3.1. Digital Elevation Model (DEM), Land Use, and Soil Data

The SWAT primarily uses hydrologic response units (HRUs) that are created based on slope parameters, soil maps, and LULC maps [34]. The digital elevation model (DEM) was acquired from the Advanced Spaceborne Thermal Emission and Reflection Radiometer (ASTER) (https://earthexplorer.usgs.gov (accessed on 20 December 2021)). The DEM was used to delineate the basin into sub-basins and river networks. The DEM was used to extract sub-basin parameters (such as the slope grade and length of the terrain’s slope) and features of the river network (such as the length, breadth, and slope of the channel). There were 449 sub-basins created for this study.
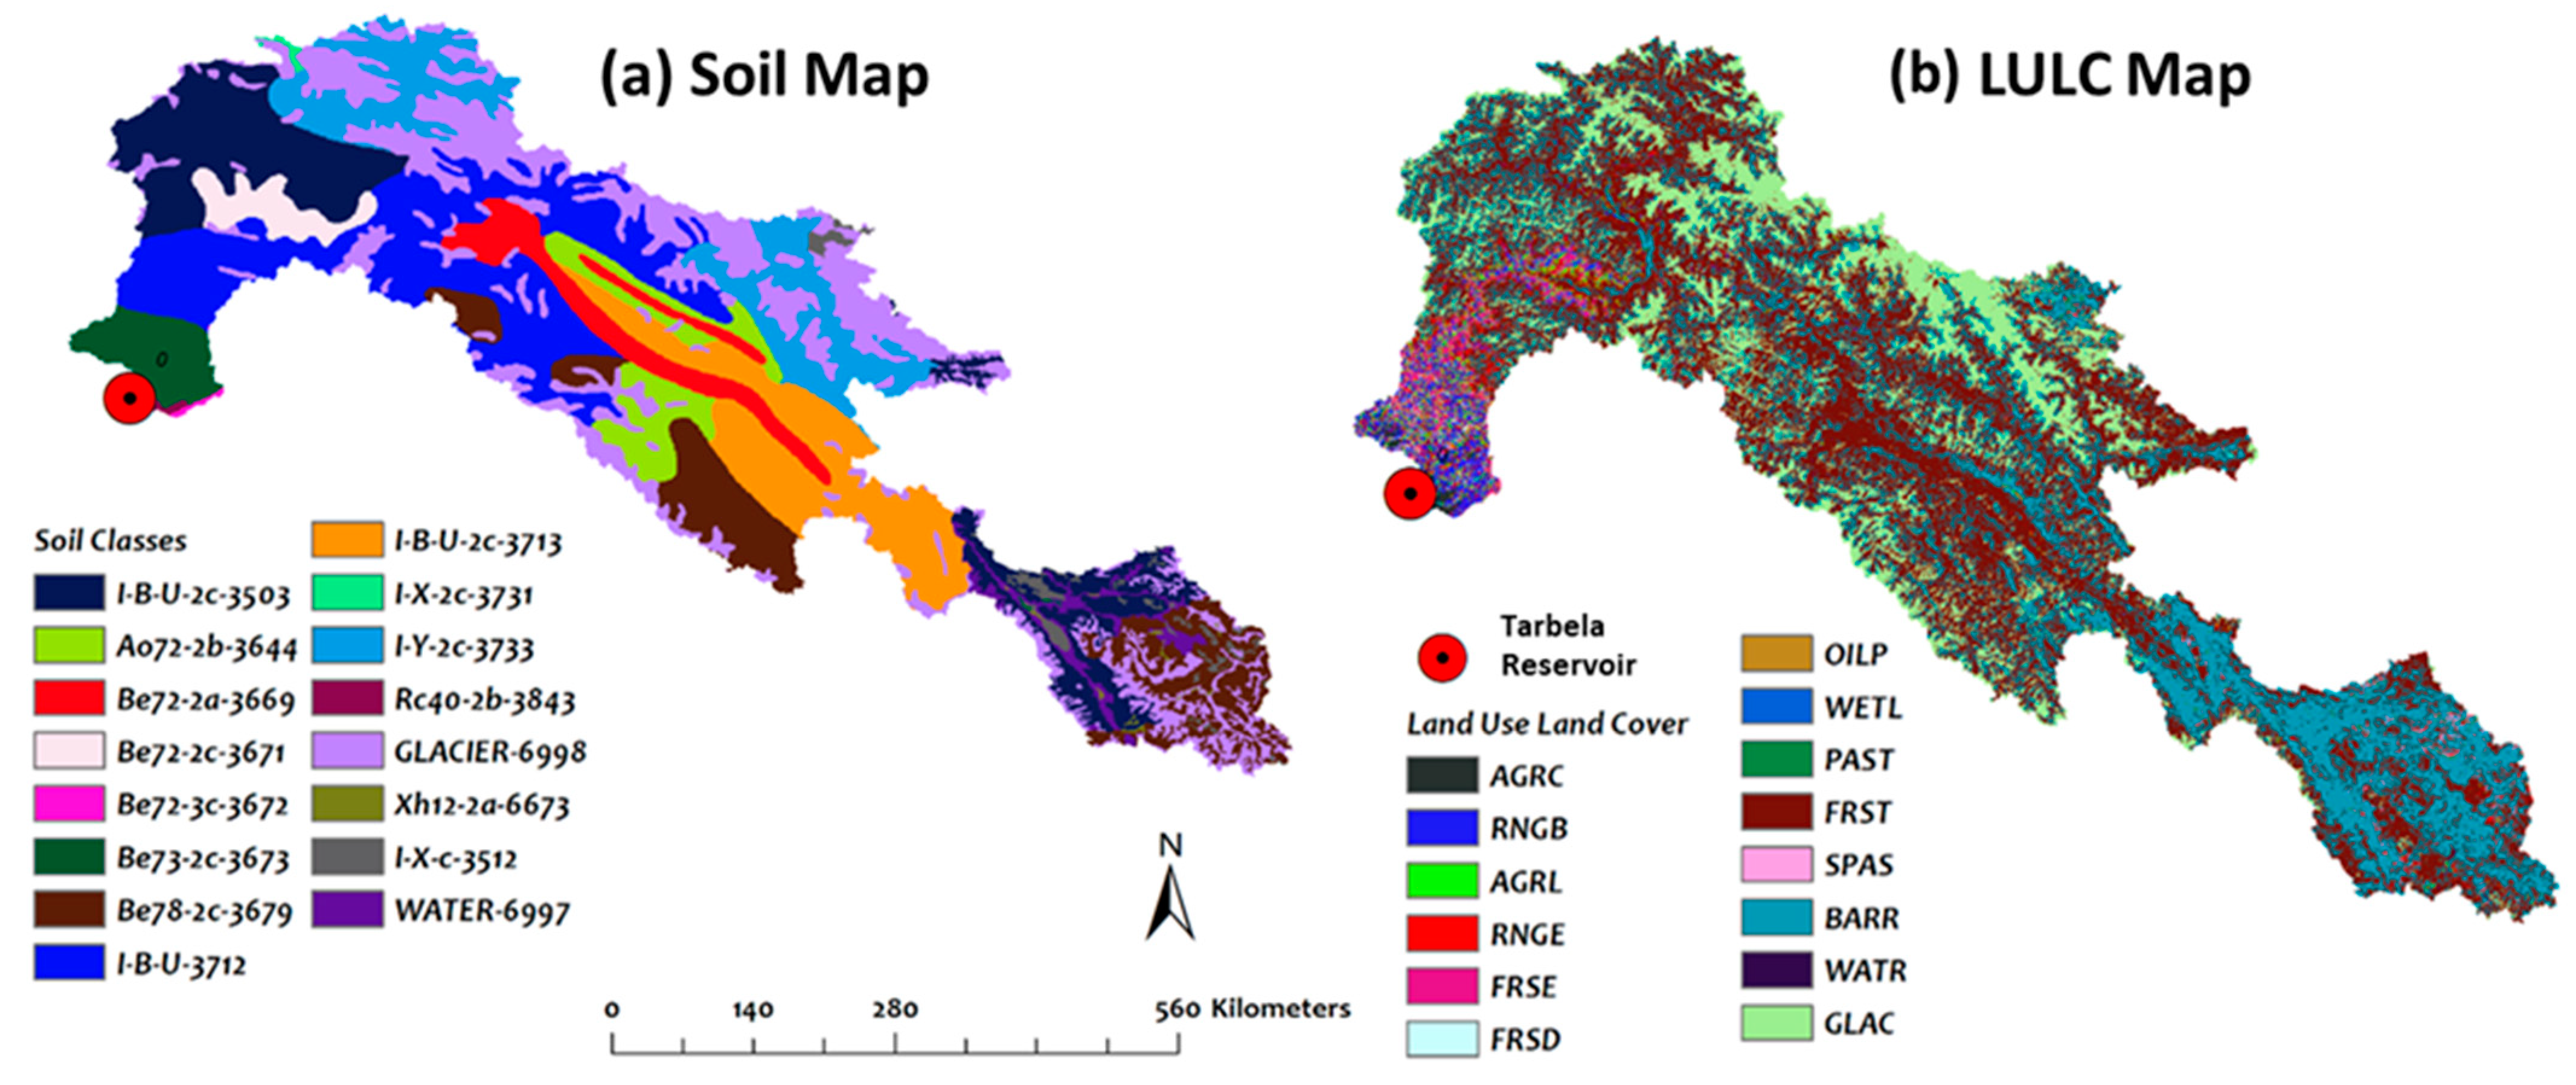
The LULC is an essential parameter that affects runoff, sediment flow, and evapotranspiration [35]. There were three LULC scenarios in our catchment area; (a) before planting trees (in 2013), (b) after 1 billion trees were planted (in 2017), and (c) after 3 billion trees were planted (in 2025). The initial LULC data were downloaded from the United State Geological Survey (USGS) (https://www.usgs.gov/core-science-systems/science.../land-cover-data-download (accessed on 20 December 2021)). The SWAT showed the different land cover types in each sub-basin. The primary land-use class in the watershed was forest-mixed, whereas the second most prominent class was barren, which covered most of the watershed area (Figure 3).
Soil data is also essential for runoff measurements, sediment flows, and defining HRUs [36]. It includes information on the soil’s texture, moisture content, hydraulic conductivity, density, and organic content, among other physical and chemical characteristics. The Food and Agricultural Organization’s (FAO) website (www.fao.org/soils-portal/soil-survey/soil-maps-and-databases (accessed on 20 December 2021)) was used to retrieve the soil information.

2.3.2. Climate Data, Streamflow, and Sediments Flow Data

At all stations in the research area, climate information, including the precipitation and maximum and minimum temperature data, was acquired from the Pakistan Metrological Department (PMD). The daily data was collected from 1984 to 2017 from the PMD. The third scenario predicted climate data for 2025 based on data downloaded from the Coupled Model Intercomparison Project (CMIP6) (https://pcmdi.llnl.gov/search/esgf-llnl/ (accessed on 20 December 2021)). Daily streamflow and sedimentation flow data at Basham Qila gauge station and inflow for the Tarbela reservoir (from 1981 to 2010) were collected from the Project Director SWHP (WAPDA). These data were used for model validation and calibration.

2.4. LULC Scenarios

Regarding the land-use refinement, land-use classes were updated according to changes in the study area, where the land cover was updated from percent barren to percent forest cover. After recreating the HRUs, the entire forest in the study area increased as the percentage of land use. This tool updated the land use from barren to forest in the second and third scenarios. The second scenario was considered after the planting of 1 billion trees by 2017; planting mainly occurred in the Tarbela catchment area [22]. In the third scenario, the planting of 10 billion trees is in progress; it will be completed by 2024. It is predicted that 3 billion trees will be in our study area [23].
The LULC map of the first scenario (2013) and second scenario (2017) was downloaded from the USGS. After processing those maps, attribute tables of both maps were created. Attributes tables of both LULC maps were compared to examine the change in the study area.
The second scenario, i.e., after the planting of 1 billion trees, showed the following land-use and land-cover updates: (a) 5% barren (BARR) land changed to 5% forest-mixed (FRST), (b) 15% range-shrub (RNGB) was updated to 15% forest evergreen (FRSE), and (c) 35% agricultural land-close-grown (AGRC) was updated to 35% agricultural land-generic (AGRC) (Figure 4). Regarding the third scenario, i.e., after the planting of 10 billion trees, the current amount of 3 billion in our study area suggested that the planting will be completed by 2024.
Forest-mixed, which made up about 46.51% of the watershed in the first scenario, was the dominant class there. Barren areas were the second most prevalent, making up about 30.51% of the watershed area. In the second scenario, the forest-mixed (FRST) increased from 46.51% to 48.56% in the catchment area, barren land reduced from 30.51% to 28.53% in the catchment area, AGRL increased from 1.36 to 1.39%, and FRSE increased from 0.68 to 1.03%. In the third scenario, the land-use classification forest-mixed (FRST) increased from 46.51% to 53.02% in the catchment area, and barren land reduced from 30.51% to 24.05% in the catchment area.

2.5. SWAT Model Parametrization and Simulations

Regarding its simulation capabilities, the SWAT model must be calibrated and verified to produce reasonable and confident forecasts. The parameter estimate approach, in this case, looked at the relative sensitivity levels. Therefore, 22 streamflow and sediment concentration factors were considered to be sensitive to relative sensitivity levels (Table 2). The overall impact of each chosen parameter was classified using SWAT’s total sensitivity tool. Furthermore, adequate parameter calibration is usually necessary for a hydrological model to properly simulate streamflow and silt concentration.
The SWAT calibration, validation, and uncertainty analyses were performed using the standalone computer application SWAT Calibration and Uncertainty Programs (SWAT-CUP). We utilized Regular Uncertainty, which is the SUFI-2 correspondent algorithm, for the calibration and uncertainty analyses in this study [37]. SUFI-2 is a mechanism for assessing sensitivity, calibrating several locations, and investigating uncertainty. It can simultaneously examine many factors and data from multiple meteorological observation stations. According to [38], SUFI-2 needs the fewest number of model requirements to conduct calibration ambiguity choices and projections relative to four other systems.
The SWAT model was calibrated for 17 years (1984–2000) and validated for the next ten years (2001–2010). The monthly base streamflows and sediment flows were used for calibration and validation.
PBIAS measures the tendency of the measured value, along with the observed value. It is calculated using Equation (1) [39]; its range is from −20 to 20, while the optimal value is 0.0. R2 represents the proportion of the variance for the simulated water yield or sediment load (dependent variable) that is explained by the observed water yield or sediment load (independent variable). It is calculated using Equation (2) [39]; its best fit line ranges from 0 to 1, and more than 0.5 is considered an acceptable value. NSE is used to predict the relative amount of noise compared with information. It is calculated using Equation (3) [40]; its range is from 0 to 1, where greater than 0.5 is considered an acceptable value.
P BIAS   =   ( Y t obs Y t sim Y t obs × 100 )
R 2   =   ( [ Y t obs   Y t obs ] [ Y t sim   Y t sim ] ) 2 ( Y t obs   Y t obs ) 2   ( Y t sim   Y t sim ) 2   .  
NSE   =   1     ( ( Y t obs   Y t sim ) 2 ( Y t obs   Y t obs ) 2 )
RSR   =   ( ( Y t obs Y t sim ) 2 ( Y t obs   Y t obs ) 2 )
Y t obs is the observed value,   Y t obs is the average of the observed values, Y t sim is the computed value, and Y t sim is the average of the computed values.

3. Results

3.1. Calibration and Validation

For this study, the SWAT model was calibrated and validated for stream and sediment flows at Bisham Qila. The calibration was undertaken using 1984 to 2000 data, while the validation was performed using 2001 to 2010 data on a monthly scale. The calibration results followed the execution of the SWAT-CUP SUFI2 method. The SUFI2 sensitivity analysis found that runoff curve number (CN2.mgt), moist bulk density (SOL_BD.sol), snowfall temperature (SFTMP.bsn), snowmelt base temperature (SMTMP.bsn), baseflow alpha factor (ALPHA_BF.gw), groundwater delay (GW_DELAY.gw), effective hydraulic conductivity (CH_K2.rte), and available water capacity of the soil layer (CH_N2.rte) were among the top most sensitive parameters (Table 2).
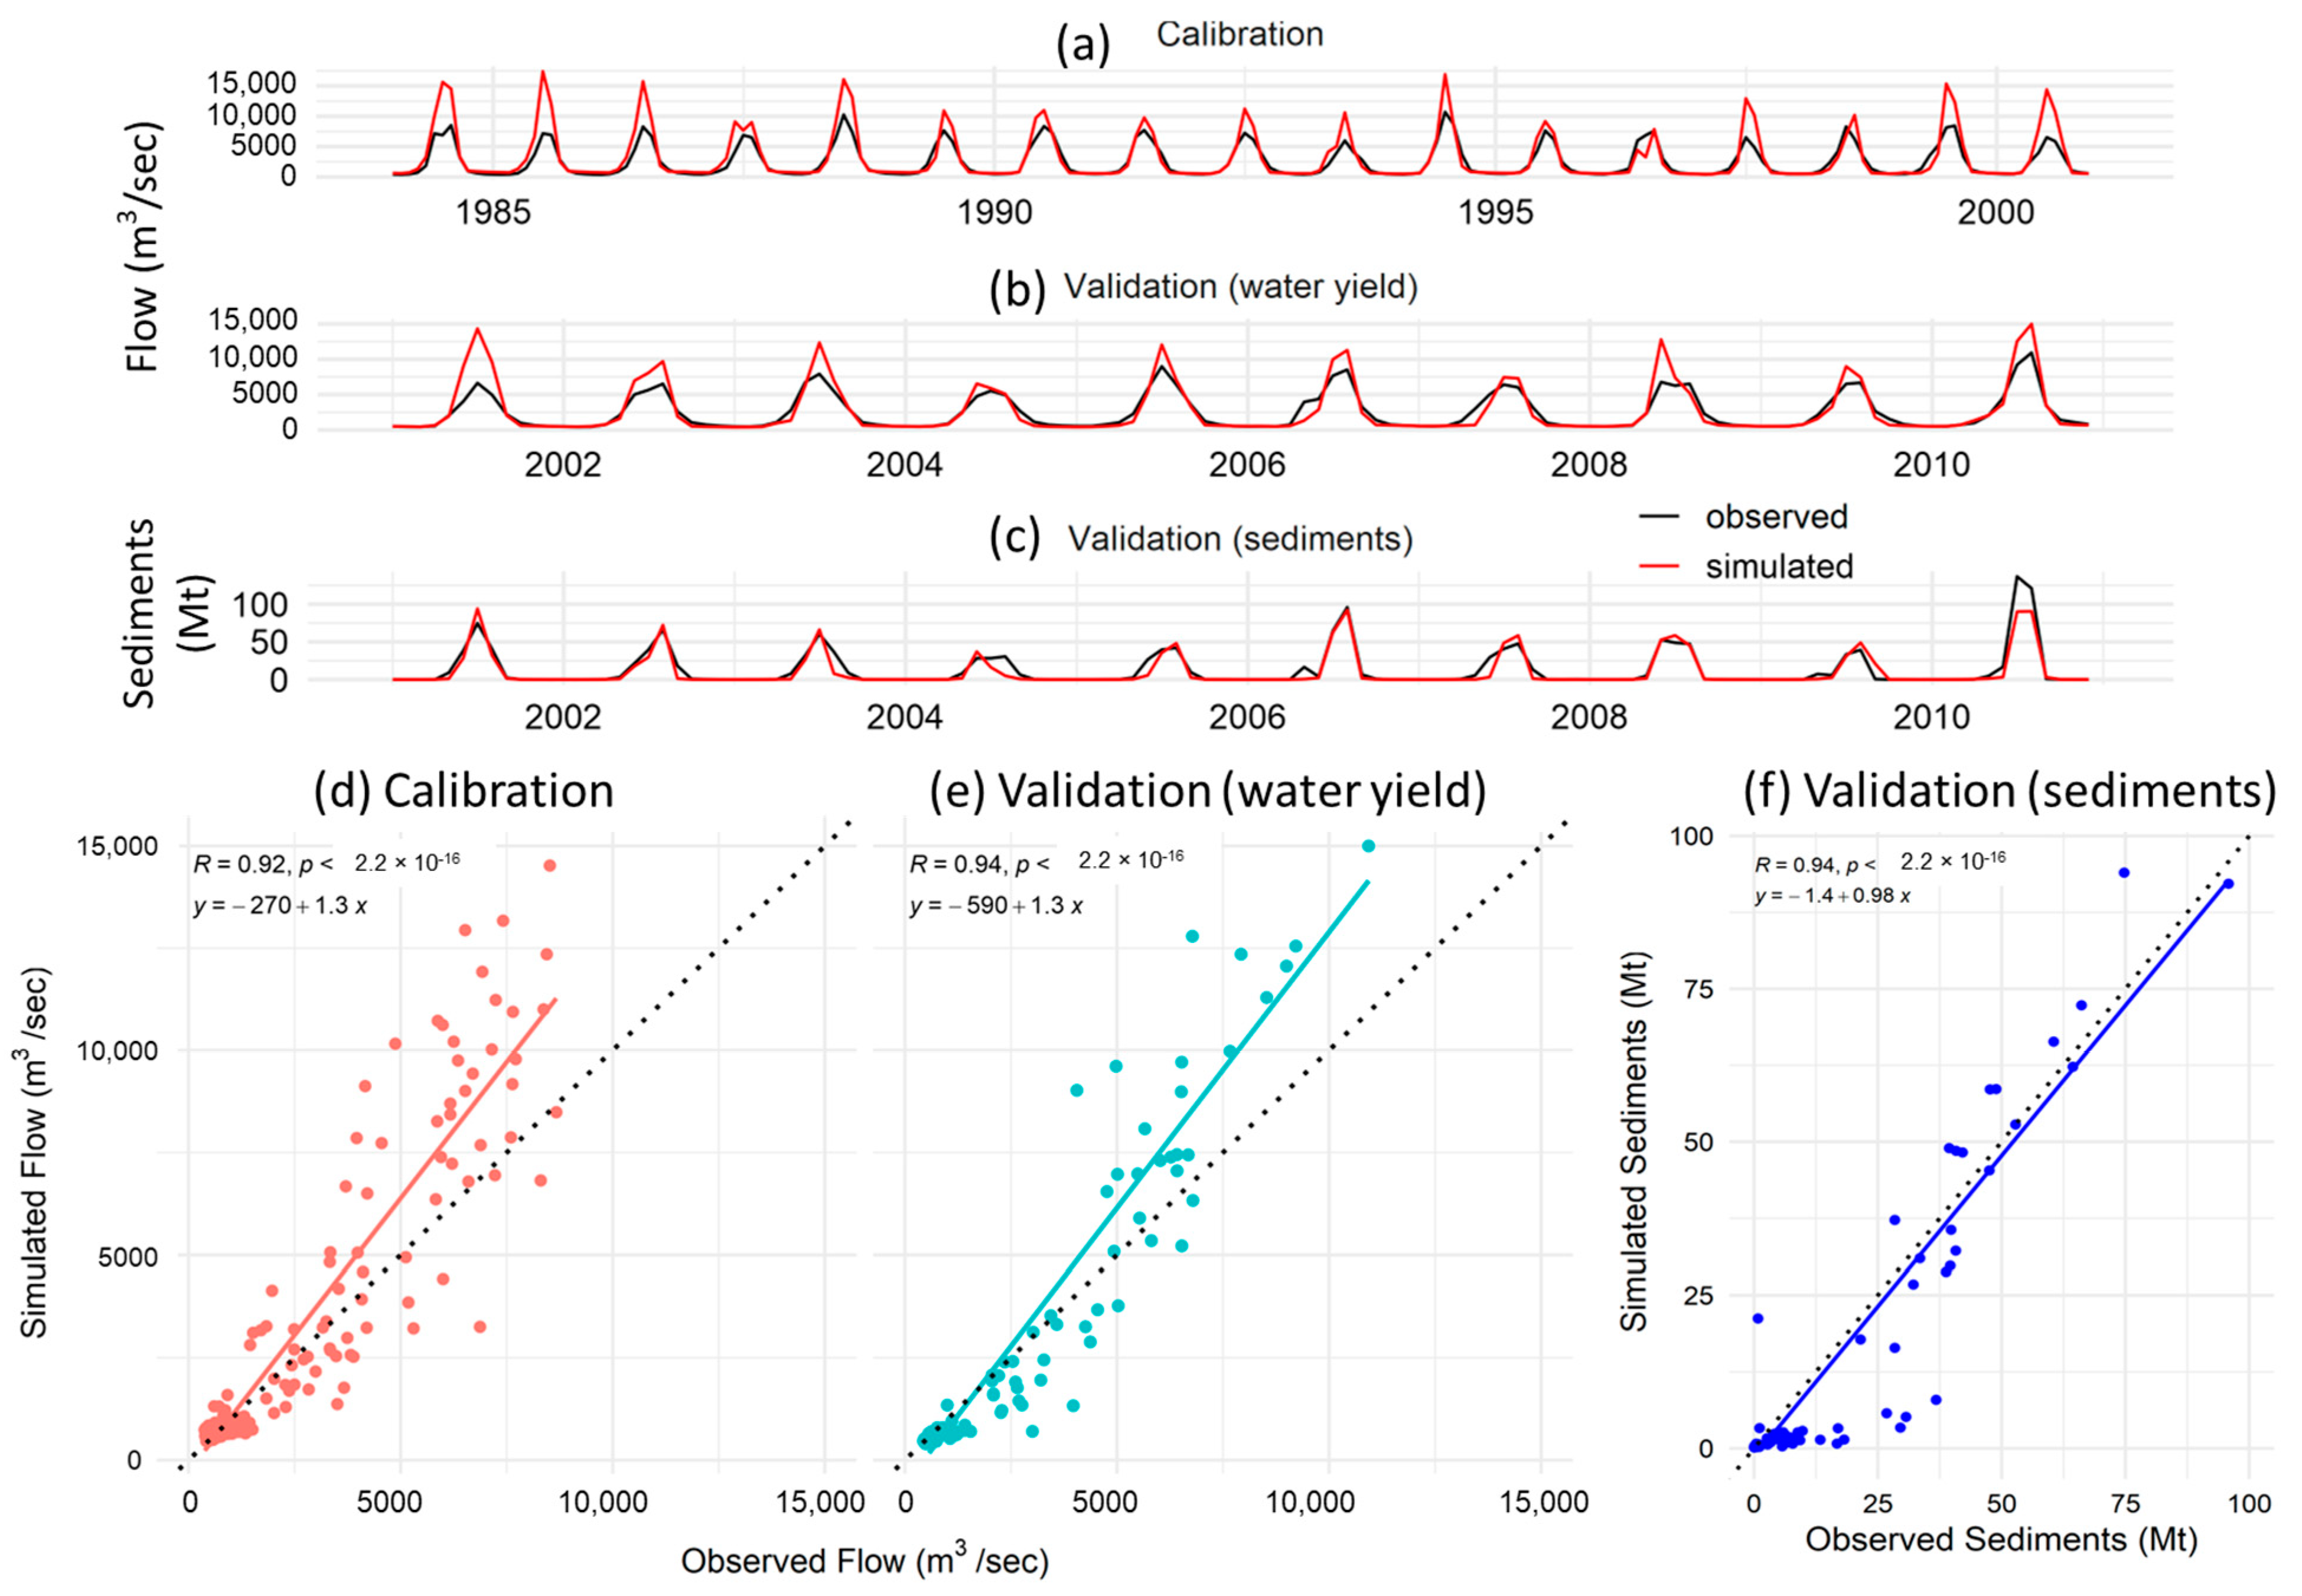
The calibration findings were promising [40,41,42,43], indicating a high model performance that may be used to examine the effects of the LULC on sediments and streamflows. The results of the calibration and validation are shown in Figure 5. There was a significant correlation (p < 2.2 × 10⁻¹⁶) between the observed data (flow and sediment load) and the simulated flows and sediment load. The R2 for the calibration and validation ranged between 0.82 and 0.88, and the NSE ranged between 0.82 and 0.86 (Table 3).

3.2. Impacts of the BTAP on the Water Yield

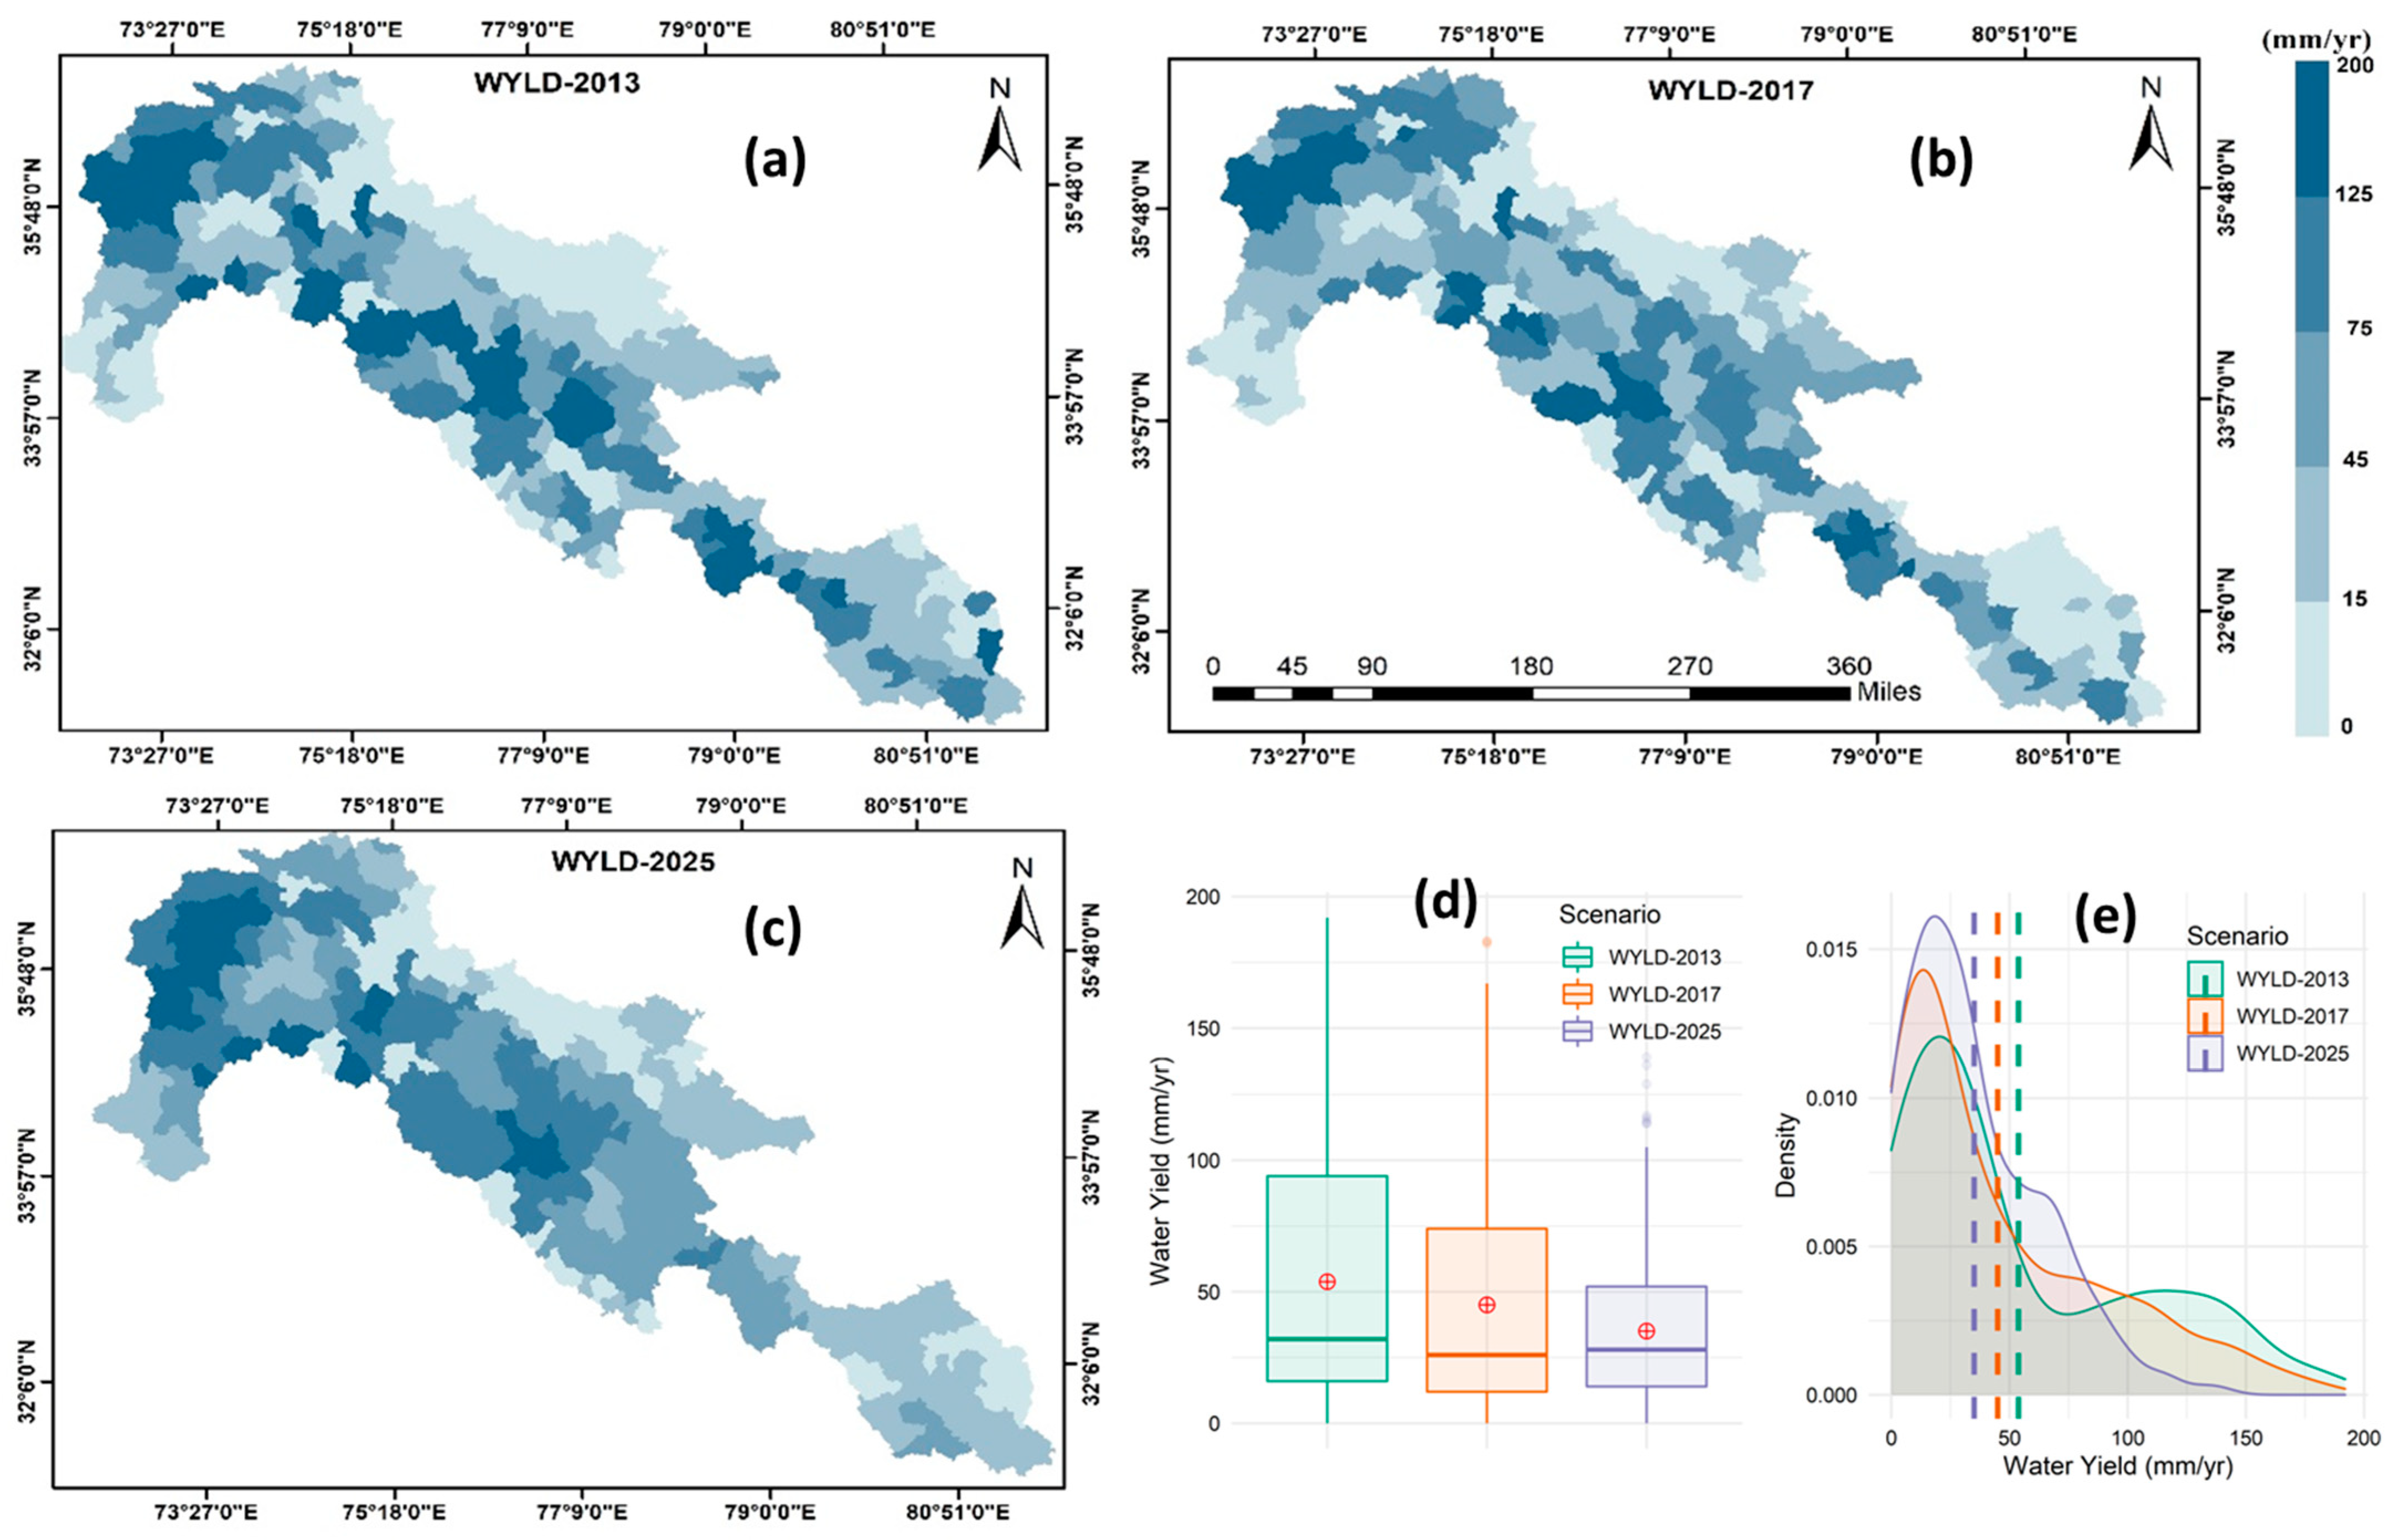
One of the study’s objectives was to quantify the impacts of the BATP on the water yield. The results of the SWAT model simulations for three scenarios (before planting—2013, after planting one billion trees—2017, and after planting 3 billion trees in our study area—2025) were quantified and compared. Figure 6 represents the SWAT results of the water yields for 2013, 2017, and 2025 in the sub-basins. It contains all components of the water yield developed in the model. The annual mean water yields were 54 mm, 45 mm, and 35 mm for the first, second, and third scenarios in the sub-basins (Figure 6d). The sub-basins located in the Hindukush and Himalaya regions contributed more than the Karakoram region (Figure 6a–c) under all scenarios. The spatial distributions of the water yield showed that contributions were more diverse among the sub-basins for the third scenario in the Hindukush and Himalaya regions (Figure 6c). In the Karakoram region, the Hunza basin contributed the highest water yield. However, the quantity of water yield was lower in the second and third scenarios compared with the first.
The variability in water yield outputs was higher in the first scenario compared with the second and third scenarios (Figure 6d). The lower 50% of water yield amounts were not much different (the median values were very close); however, the main differences between the scenarios occurred for high flows (the upper 50%). The mean values fell within the third quartile, which meant that the main differences among scenarios were more significant for high flows (peaks of hydrographs). The water yield was reduced in the third scenario (2025); therefore, the variability among the spatial distribution of water yield contributions was also decreased. The mean and median values were closer to each other than in other scenarios (Figure 6d). Increasing the plantation size impacted the water yield. It stabilized the flows in the catchment area of the Tarbela reservoir.
The significance of the differences between the impacts of LULC scenarios on the water yield was tested using statistical analysis of the outputs. The density distribution plots suggested that the mean values of the simulated water yield were different and fell slightly away from the main cluster of low flows (Figure 6e). The main effect of the LULC scenarios on water yield was statistically significant (F (2, 1344) = 22.22, p < 0.001; η2 = 0.03, 95% CI [0.02, 1.00]) (Table 4, ANOVA). Moreover, all the scenarios’ impacts were significantly different based on Tukey’s honestly significant difference (Tukey’s HSD) post hoc test for pairwise comparisons (95% family-wise confidence level). The difference was highest between the first and third scenarios (−18.76 mm/yr), followed by the difference between the second and third scenarios (−9.95 mm/yr) and between the first and second scenarios (−8.80 mm/yr) (Table 4, Tukey’s HSD). This highlighted the fact that increasing the plantation size caused increasing and more significant impacts on the water yield, as explained by the differences between the different scenario comparisons.
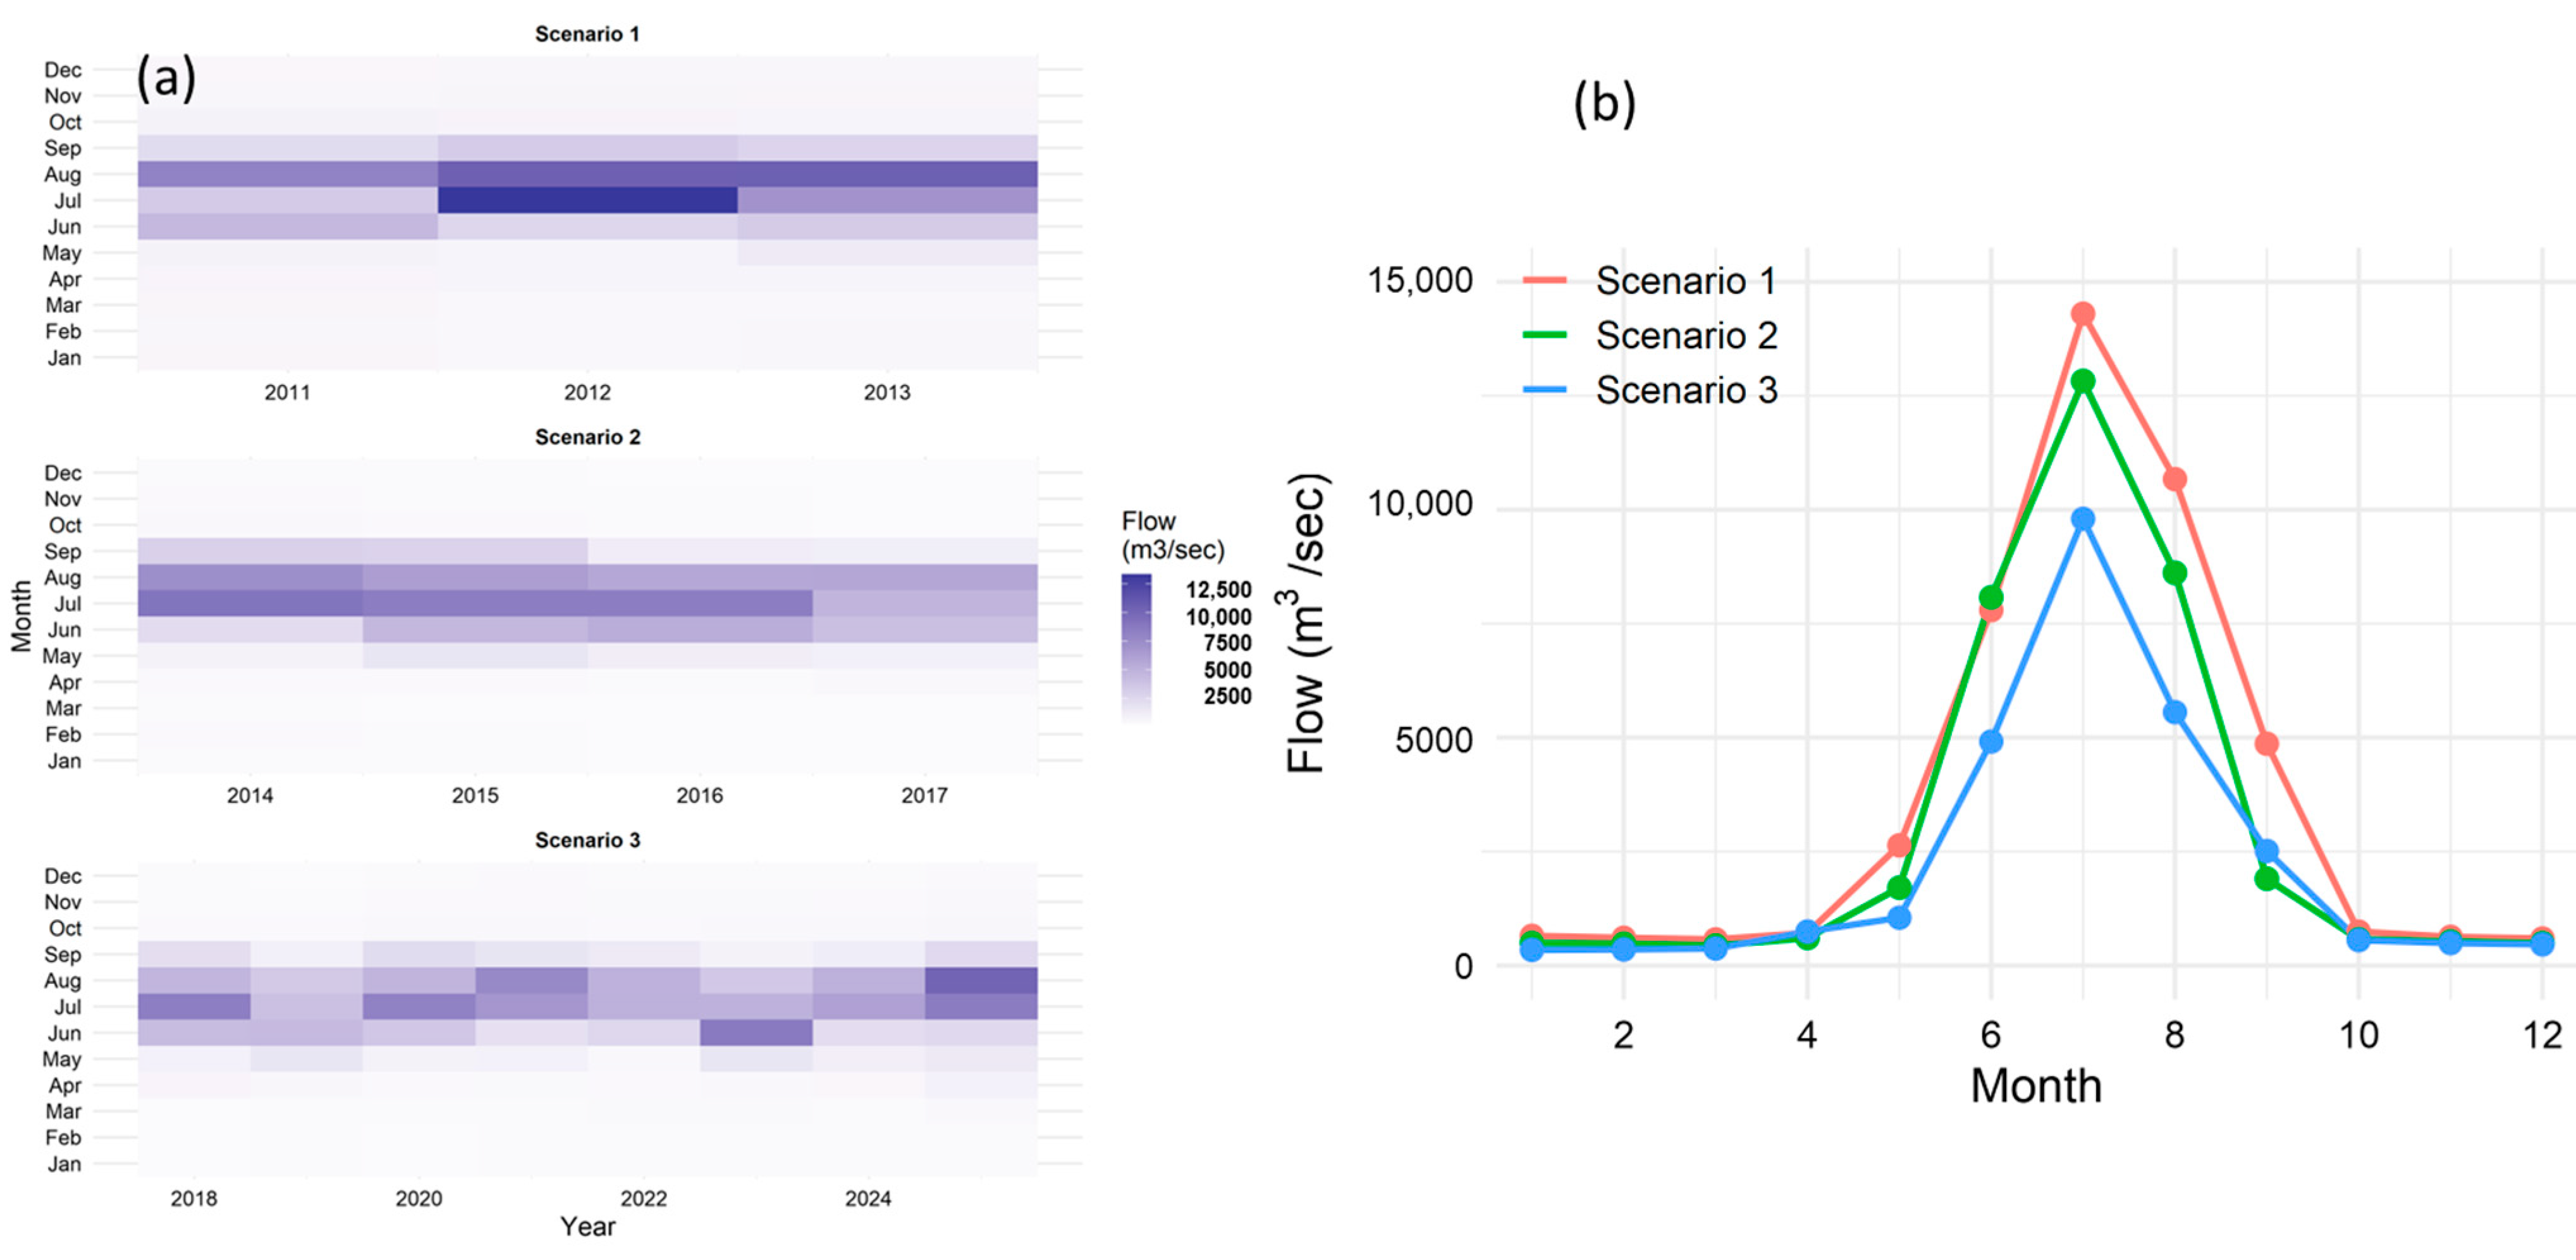
The model results for all scenarios (2013, 2017, and 2025) were compared regarding the accumulated water yield at the last sub-basin (300), which was an inlet of the Tarbela reservoir. The prominent differences between the scenarios were observed during the summer season. In the catchment area of Tarbela reservoir, the hydrological regime featured snow, glacier melt, and monsoons during the summer. Therefore, peak flows occurred during this season, contributing one-third of the total water yield. Figure 7 shows the impacts of different LUCL scenarios on the temporal distribution of the water yield. Increased plantation reduced the annual flows, and the monthly distribution was also affected under different scenarios, with higher differences for the third scenario (Figure 7a). After the planting of 1 billion trees, the peak monthly flow (July) was reduced from 14,300 m3/s (in 2013) to 12,825 m3/s (in 2017) to nearly 10,000 m3/s (in 2025).
The annual flow was reduced by 18% due to a 5% forest increase from 2013 to 2017. Similarly, the SWAT model predicted a 26% reduction in annual flows due to a 13% increase in forest cover area from 2013 to 2025. It is obvious from Figure 7a,b that the main differences between the different scenarios occurred during the summer peak flow season. This highlighted the importance of the temporal exploration of the impacts of increasing plantation on the water yield and the need to focus on management strategies that target these high flow periods.

3.3. Impacts of the BTAP on the Sediment Load

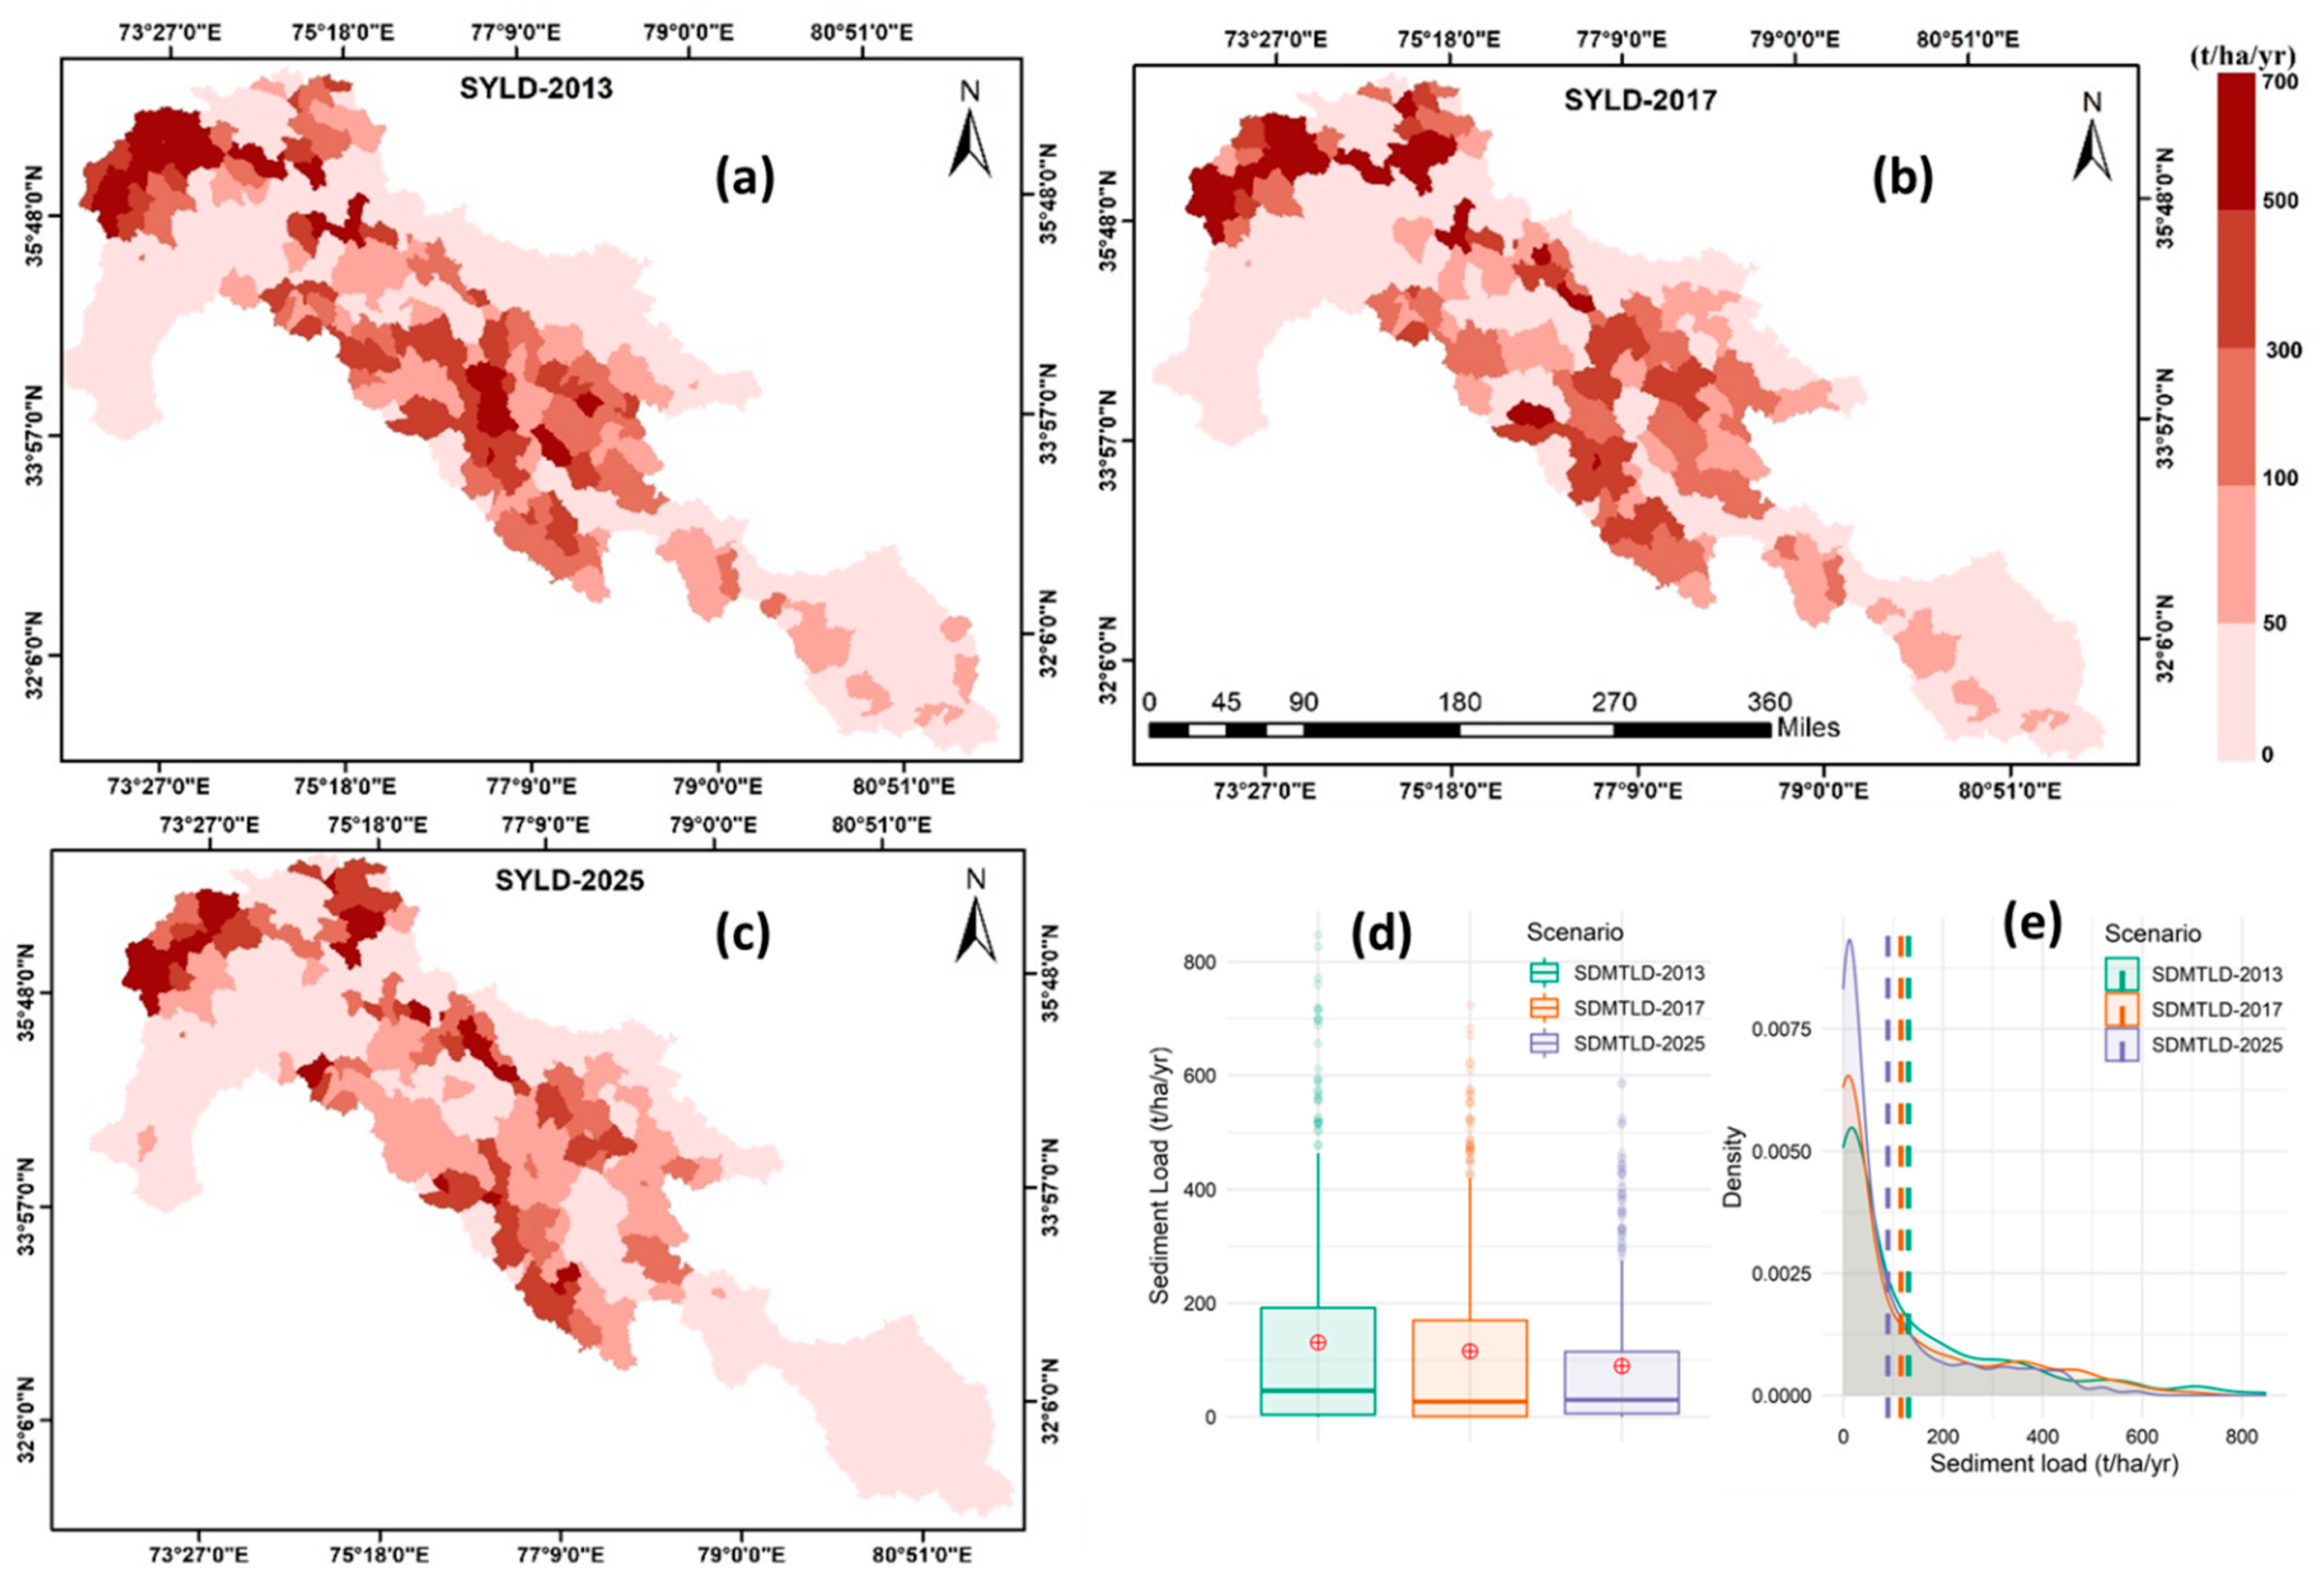
The second objective was to quantify the impacts of the increasing plantation size under the BATP on the sediment load flowing into the Tarbela reservoir from its catchment area. Figure 8 represents the SWAT results of the sediments load for the first (before plantation—2013), second (after planting one billion trees—2017), and third (after planting 3 billion trees in our study area—2025) LULC change scenarios in the sub-basins. The annual mean sediment flows were 131 t/ha, 116 t/ha, and 90 t/ha in the sub-basins under the first, second, and third scenarios, respectively. For all scenarios, the main sediments were contributed by the Hindukush and Himalaya regions (Figure 8a–c). The Hunza basin contributed the most from the Karakoram region compared with the Shigar and Shyok basins. This behavior might have been due to the construction work along the Karakoram highway in the Hunza basin under the China–Pakistan Economic Corridor (CEPC). All sub-basins responded to the increasing plantation size by reducing the sediment contributions, except for the sub-basins that fell within the periphery of construction work under the CEPC in the Hunza basin. The sediment contributions were reduced enormously from the eastern side of the catchment and lower areas of the Gilgit–Baltistan region under the third scenario (Figure 8c).
Similar to the water yield, the differences between the sediment load under different scenarios were more obvious for high values (Figure 8d). The outliers were observed only for high values. The median values for the second and third scenarios were not very different compared with the first. Meanwhile, all the mean values fell in the third quartile. The variability in sediment load contributions was reduced with increasing plantation size under the second and third scenarios (Figure 8d). The reduction in the spread of values highlighted that increased plantation size stabilized and reduced the sedimentation load flowing into the Tarbela reservoir.
We conducted statistical significance tests to distinguish the impacts of different LULC scenarios on the sediment load. The mean values of the sediment loads were away from the major cluster of low values (Figure 8e). The main effect of the LULC scenarios on the sediment load was statistically significant (F (2, 1344) = 7.91, p < 0.001; η2 = 0.01, 95% CI [3.44 × 10⁻³, 1.00]) (Table 5, ANOVA). Moreover, the impacts of scenarios (first scenario versus third scenario and second scenario versus third scenario) differed significantly, whereas the first scenario versus the second scenario differed insignificantly (Table 5, Tukey’s HSD). The significant difference between the first and third scenarios was the highest (−41.43 t/ha/yr), followed by the difference in the second and third scenarios (−26.12 t/ha/yr). The statistically insignificant difference between the first and second scenarios was −15.30 t/ha/yr. These differences between the simulated values highlighted that the plantation size significantly affected the sediment load in the Tarbela reservoir’s catchment area. Moreover, the significance increased with increasing plantation size.
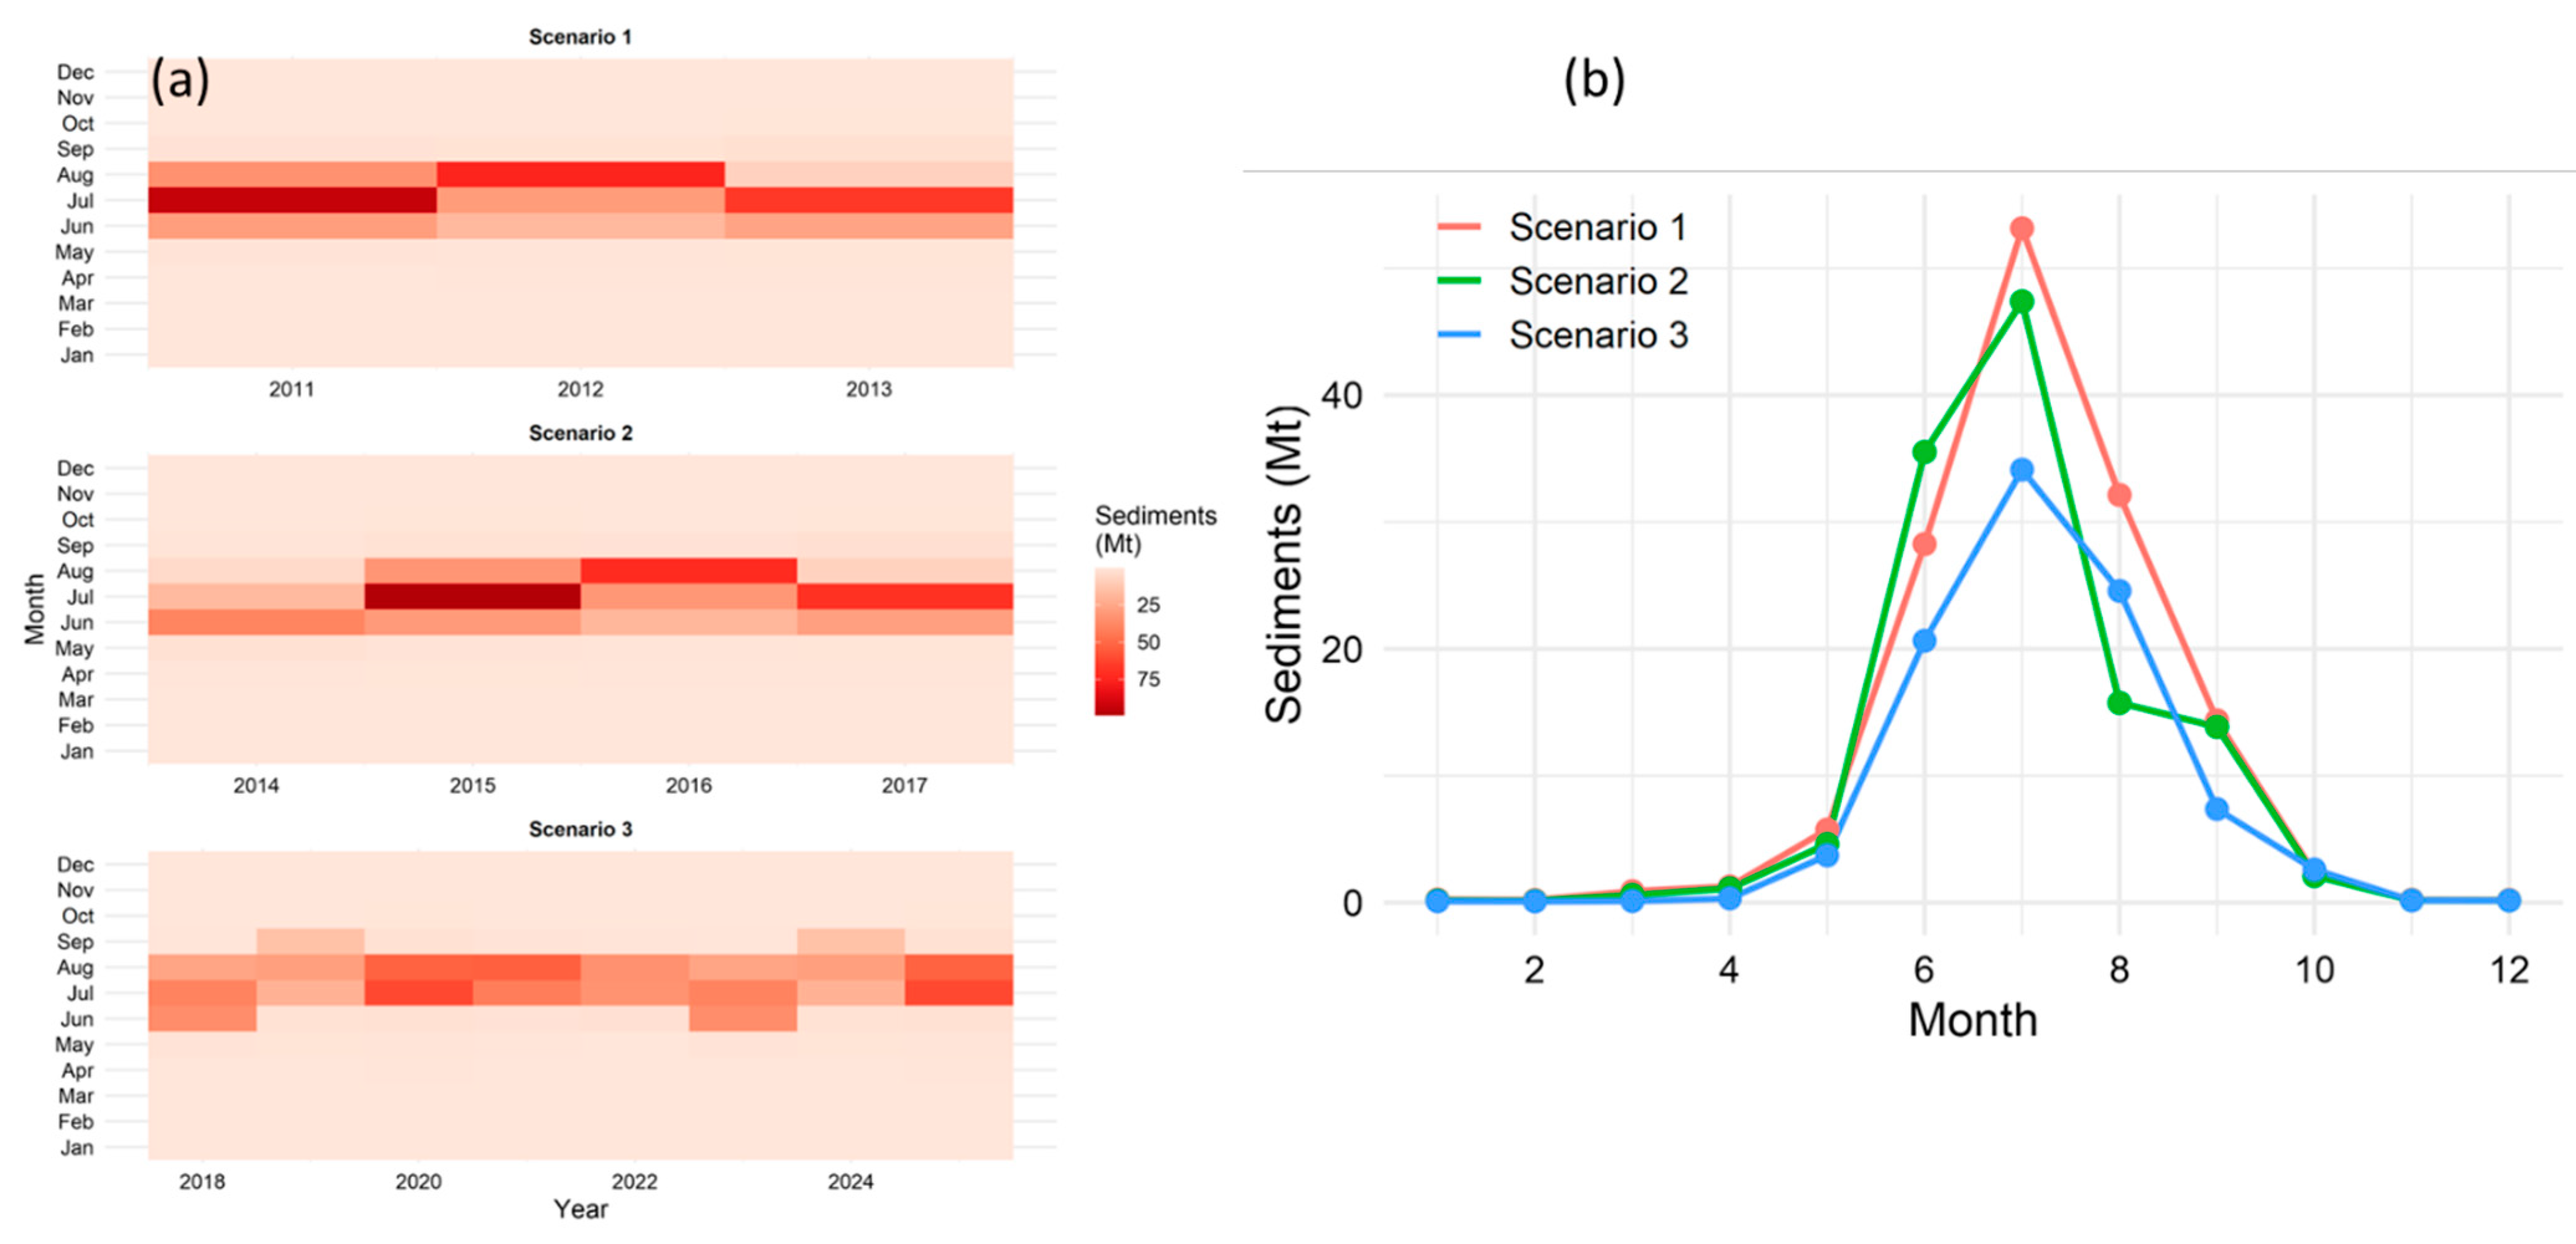
The temporal distribution of the simulated sediment load showed an increasing effect of plantation size on the reduction in sediment flows into the Tarbela reservoir. The LULC changes not only affected the annual sediment loads but also influenced the seasonal distributions. Under the third scenario, the sediment contributions vanished in June (Figure 9a). A slight deviation from the usual temporal distribution trend, i.e., June–September to July–September, was noticed for the third scenario for two years, namely, 2019 and 2024 (Figure 9a). The water flows were usually weak during June and the planting caused an additional delay in sediment transport. Thus, the planting could cause seasonal variations in the sediment load in river flows and could eventually significantly reduce the sediment load flowing into the Tarbela reservoir.
The reduction in the sediment flow in 2017 was 17.40 MT, which was a decrease of 12% from 2013 due to afforestation (under 5% more forest). After planting 3 billion trees in the Tarbela reservoir catchment area by 2025 (under 13% more forest), a reduction in sediment flow of 45 MT is expected in 2025, a 22% decrease compared with 2013. Similar to the water yield simulations, significant reductions in sediment loads were simulated during the summer months (Figure 9b). The increased plantation served as a sieve to reduce the sediment load in peak flows during summer under the second and third scenarios.

3.4. Relationship between the Water Yield and Sediment Load

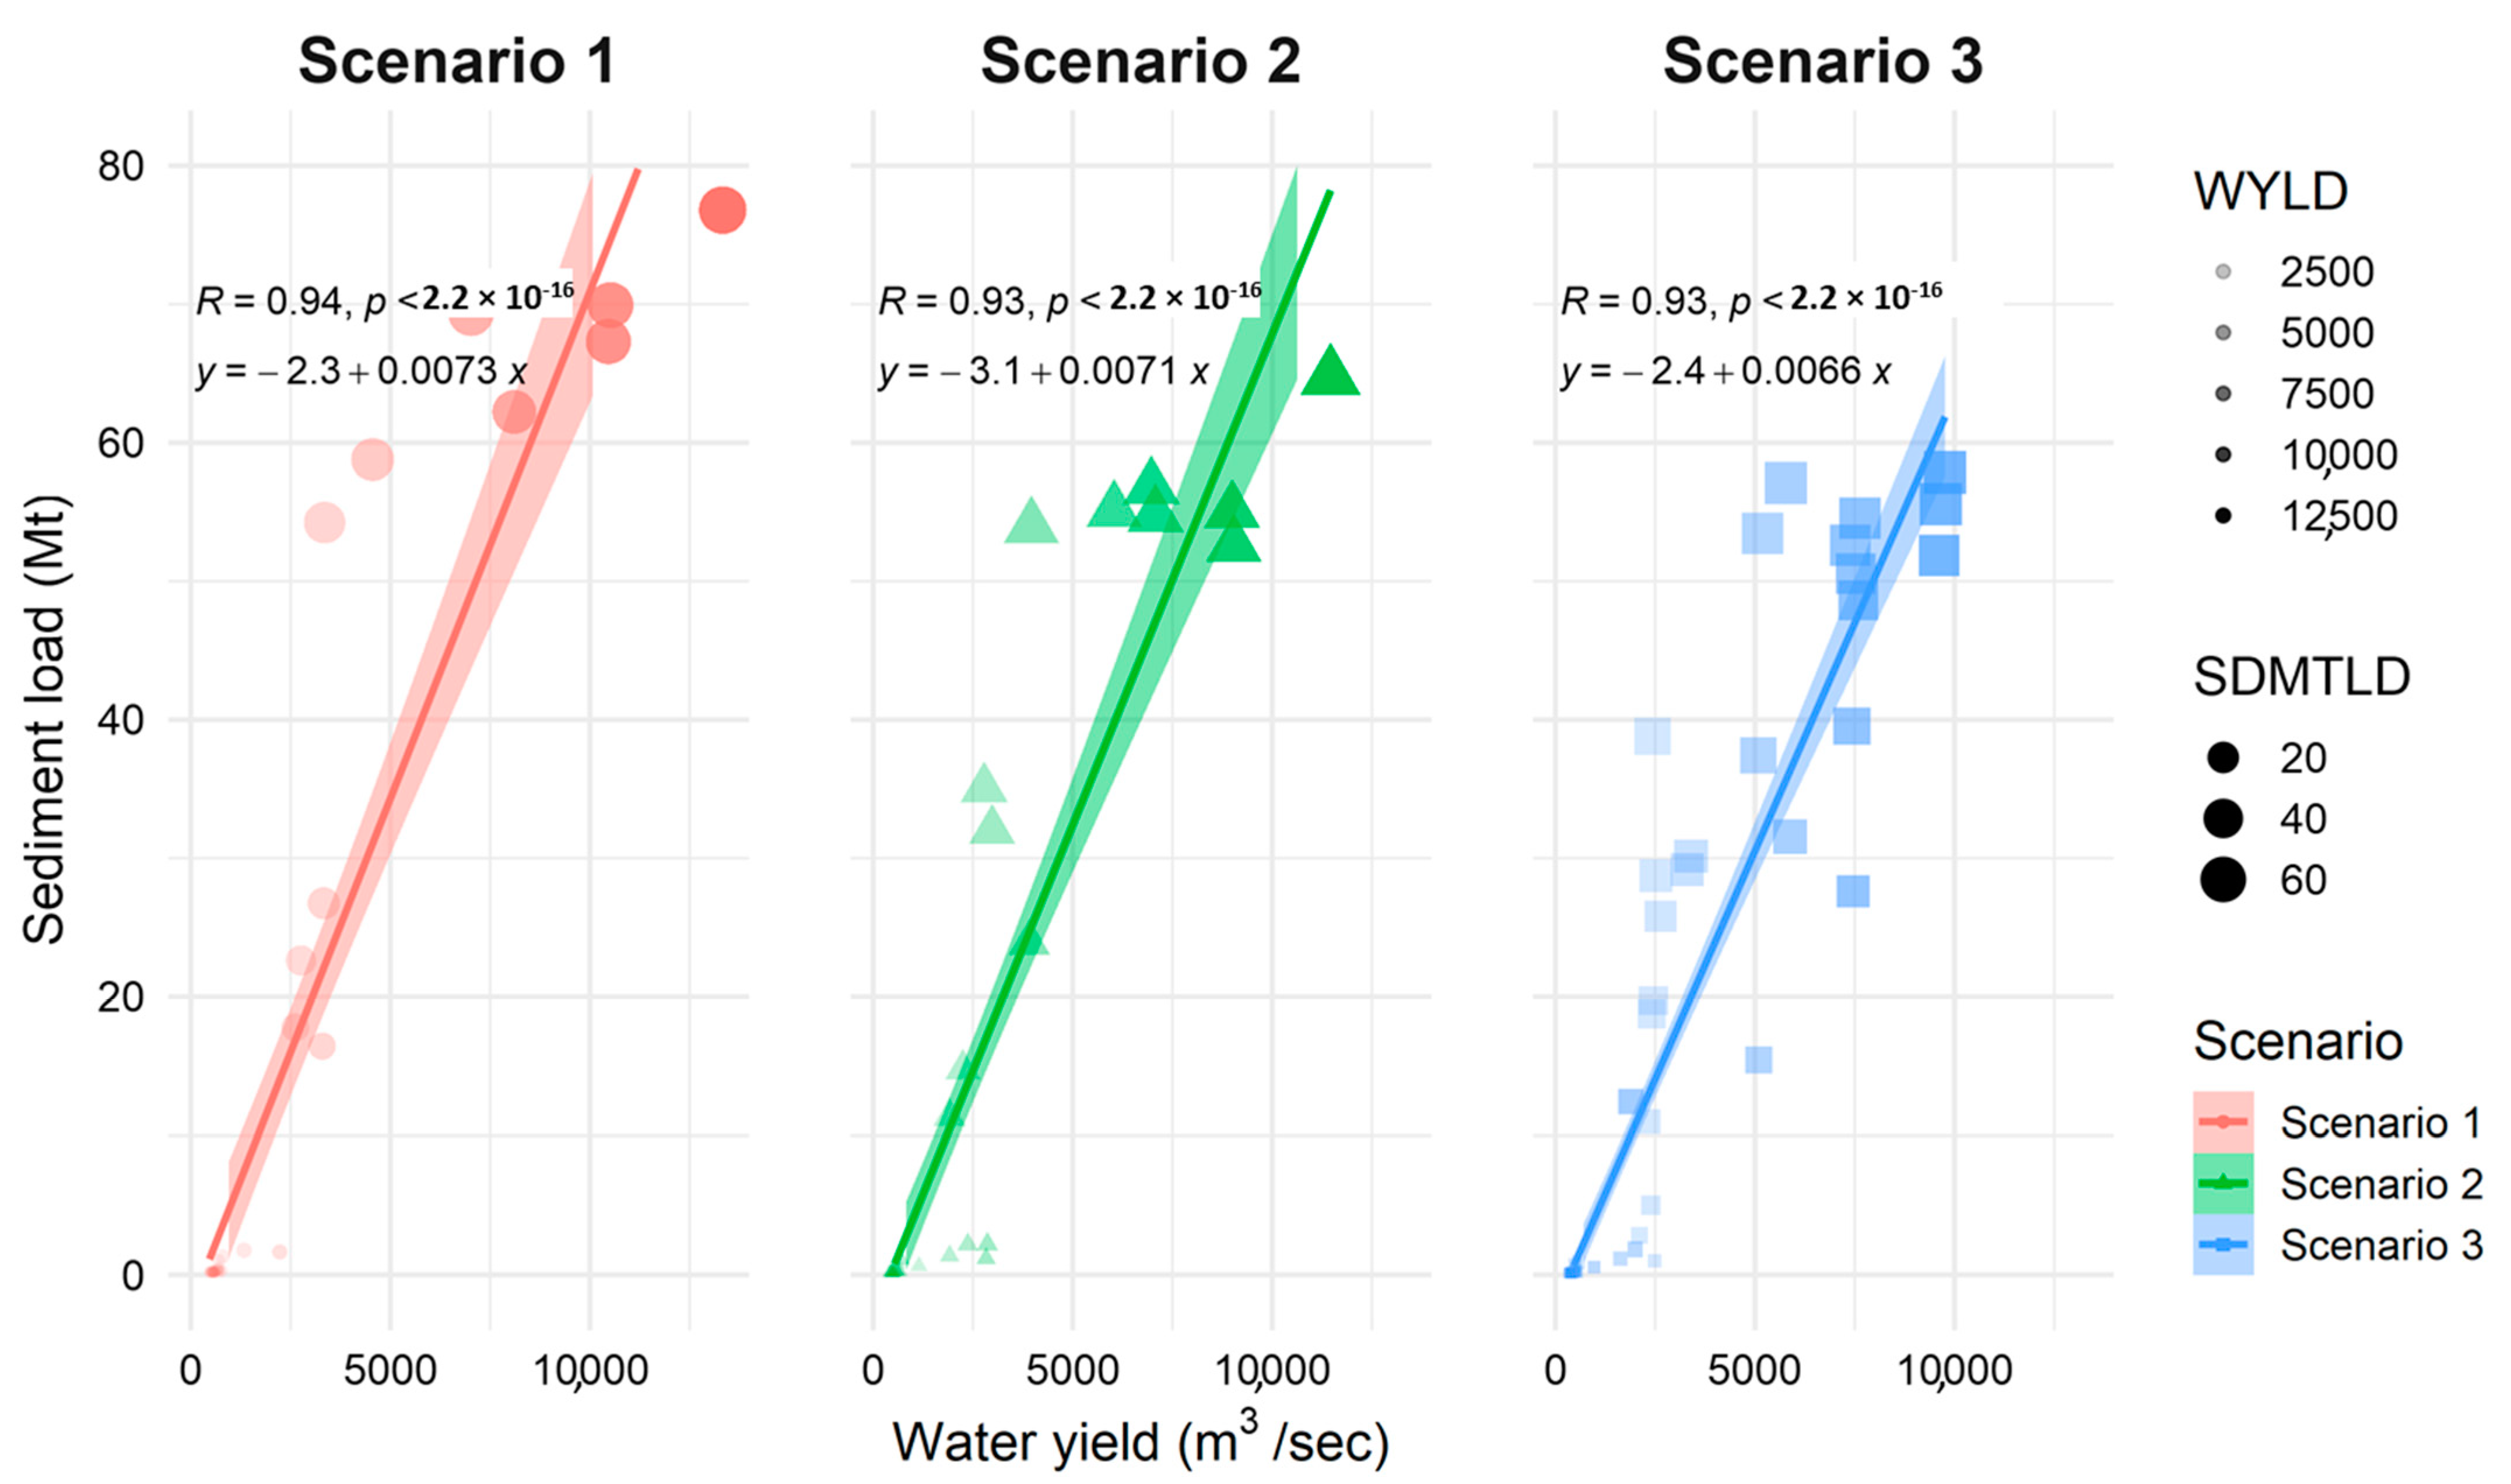
The water yield and sediment load are interrelated; we performed a regression analysis to understand the relationship between water yield and sediment load in the catchment area of the Tarbela reservoir. Pearson’s correlation coefficient showed that the water yield and sediment load had a significant (p < 2.2 × 10⁻¹⁶) positive correlation (r ≥ 0.93) for all three LULC scenarios (Figure 10). The decreasing water yield also had an impact by reducing the sediments flowing into the Tarbela reservoir. It was evident that a higher sediment load was associated with a higher runoff, i.e., during the summer when monsoons meet the glacier and snow meltwater to generate high flows. The variability (based on 95% confidence interval: the shaded area around the regression line in Figure 10) in their relationship increased with the sediment load and runoff.

4. Discussion

4.1. The Need to Parametrize the SWAT Model

It is necessary to calibrate and validate a hydrological model to simulate the impacts of a physical variable on other physical variables to produce reliable results. The SWAT model’s ability to accurately depict streamflow and silt concentration depends on parameter calibration. Despite having observation data for more than one variable, most researchers that use this model only utilize the univariable technique. This lack of utilization shows how difficult it is to calibrate and validate the model using the multivariable strategy [44]. Stepwise calibration is more accurate than simultaneous calibration, and surface runoff calibration significantly impacts surface runoff and sediment flow results [45]. The simulation procedure that is used to estimate model expectation results also depends on model calibration and validation. The SWAT model should be calibrated and verified using the surface runoff to represent the water cycle better. After that, the model may be used for forecasting to assess how flows will evolve in the future and how sediment will be transported [46]. The model calibrated with water discharge can further analyze the effects of climate change, land-use change, water quality, and sediment yield. Our statistical performance indicator values highlighted that the model performed ‘very good’ [40,41,42,43]. The SWAT model validation provided satisfactory results for water yield (R2 = 0.88, NSE = 0.86, PBIAS = 9.4%) and sediment load (R2 = 0.88, NSE = 0.86, PBIAS = −19.9%) (Table 3). The parametrized model can be used to simulate the impacts of different scenarios on the sediment load and water yield, plan future dam construction, and manage flood disaster risk, which is beneficial for the nation’s sustainable development [44,47].
In our study area, we considered a strong relationship between the surface runoff and sediment flow [12,13,14], indicating that sediment flow was directly related to runoff. Under the calibration and validation runs, it was obvious that the simulated values were significantly (p < 2.2 × 10⁻¹⁶) correlated (Figure 5). This strong relation meant that the model was capable of giving reliable surface runoff and sediment flow results after calibration on only the surface runoff [6,44,47]. Due to missing data regarding the sediment flow before 2000, the model was calibrated using the surface runoff before 2000 by adjusting the parameters for reliable results and validation for both the surface runoff and sediment data. In this situation, the parameter estimation method examined the relative sensitivity levels.
In SWAT-CUP, the SUFI-2 was used to classify the overall impact of each parameter. Based on the sensitivity analysis, the runoff curve number was identified as the most sensitive parameter (t-stat = 24.52), followed by the moist bulk density (t-stat = 16.11). Hosseini and Khaleghi [28] also found these parameters to be the most sensitive when assessing the SWAT model’s ability to simulate the sediment load in semi-arid watersheds. Both these parameters are supposed to have a higher relationship with the plantation because the plantation can change the characteristics of the surface and soil texture. The catchment area of the Tarbela reservoir (Upper Indus Basin) is heavily glaciated (>12% glacier area ratio) and located in High Mountain Asia (elevation up to >8600 m.a.s.l.). Most of the precipitation falls during winter in solid form. Therefore, the sensitivities of the snowfall temperature (t-stat = 12.19) and snowmelt base temperature (t-stat = 11.54) were also found to be very high in this area for the SWAT model calibration. The peak of the hyetograph and peak of the hydrograph had a certain delay in the catchment area of the Tarbela reservoir. This gap in hyetograph and hydrograph peaks and contributions of shallow groundwater made the baseflow alpha factor (t-stat = 8.22) and groundwater delay (t-stat = 7.00) sensitive in the calibration process (Table 2).

4.2. Reduction in the Water Yield with Higher Plantation Size

In our study, we tested the hypothesis that increasing the plantation size under the BTAP would affect the water yield from the catchment area of the Tarbela reservoir into it. Our findings suggested that the water yield was significantly affected (Table 4) due to the BATP afforestation (Figure 4) in the catchment area under the LULC change scenarios (Figure 6 and Figure 7). The water yield was reduced by 9.9 mm/yr after a 5% increase in forest cover (in 2017) and 18.9 mm/yr with 13% more forest cover by the end of 2025. The significant differences between the three simulations for the LULC scenarios verified our claim that the BTAP project positively impacted the water resources and infrastructure in the High Mountain Asia rivers basins. The Tarbela reservoir is the socioeconomic lifeline for billions of people living in downstream areas [7]. Pakistan needs to build more water storage infrastructure to buffer the supply and demand gap, which is inevitable under the depleting storage capacities of existing reservoirs under climate change.
Our results agreed with several studies in the mountain region stating that LULC changes affect water resources. The river flows in this region are derived from snow and glacier melt, which coincide with the monsoon rains [48]. The river flow peaks occur during the summer, and more than 70% of the total annual freshwater supplies are generated during the summer season [31]. A lack of plants would increase the surface runoff, and very little to no percolation happens in Upper Indus Basin. In this case, lesser evapotranspiration and interception happen, and water flows at higher speeds. Higher flows at high velocities would cause more soil erosion and increase the sediment load. Consistently increasing sediment rates cause siltation in the Tarbela reservoir [11]. Some researchers, e.g., Saddique et al. [18], projected increased water supplies in a neighboring Jhelum River Basin after focusing mainly on the snow cover changes. However, their simulation did not consider the LULC change scenarios under the BTAP. In this study, quantitative results and their significant analysis demonstrated the impacts of the BTAP plantations on the water yield.

4.3. Reduction in Sedimentation with Higher Plantation Size

It was also hypothesized that the LULC change under the BTAP would affect the sediment load positively and reduce the sedimentation into the Tarbela reservoir. The water yield was strongly correlated with the sediment load; therefore, any change in the water yield would affect the sediment load. Similar to the water yield, the outputs confirmed that the sediment load was significantly reduced with increasing plantation size, i.e., after one billion and three billion trees were planted in 2017 and 2025 under the BTAP. Due to heavy rainfall and snow melting in northern areas, sediments flow from north to south, reducing the reservoir’s storage capacity and creating a flood situation in the middle areas [6]. The changes in the LULC (Figure 4) impacted the water yield (Figure 6 and Figure 7) and sediment load (Figure 8 and Figure 9). An increase in the LULC substantially impacts reducing sediment flow [26,49]. The impacts of LULC changes were assessed under three separate scenarios: (a) before planting in 2013, (b) after planting one billion trees in 2017, and (c) after planting three billion trees in 2025. We set up, parametrized, and used the SWAT model to determine the sediment load and water yield in the catchment area of the Tarbela reservoir.
In our second scenario (2017), after planting 1 billion trees, 5% of barren (BARR) land changed to 5% forest-mixed (FRST) (Figure 4). The SWAT model results showed a 12% reduction in sediments compared with 2013 (before the plantation). In our third scenario, after planting 10 billion trees, from which 3 billion in our study area were predicted their planting will be completed by 2024, 13% barren (BARR) land was upgraded to 13% forest-mixed (FRST). After these updates, the SWAT model’s results showed a 22% reduction in the sediment load (Figure 9). Our results are in good agreement with Hussan et al. [11], who used the Mann–Kendall test and Sen’s slope estimator to study the trends of suspended sediment concentration in the upstream area of the Tarbela reservoir. They found that the suspended sediment concentration was significantly reduced, ranging from 18 to 28% per decade in river flows originating from Hindukush and Karakoram regions during the past three decades. However, they claimed that this reduction was due to the Karakoram climate anomaly and rainfall reduction. We claim that such a reduction was due to the increased forest cover in addition to climate change in this region.
The sediment load was also directly related to the water yield and had a significant positive correlation (Figure 10). High flows produced a high sediment load during the summer. The positive correlation between the water yield and sediment load is well presented in the literature [6,7,9,11,12]. This study’s results strongly agree with past studies in this region and other neighboring catchments.

4.4. Limitations and Recommendations

Unavailability and free access to observed data are important issues in the Indus Basin. Due to the limited sediment data, the SWAT model was calibrated with streamflow data. However, we were lucky to secure observed sediment data for 2001–2010. The SWAT model was then validated with the observed sediment and streamflow data. Another limitation was that the study was conducted until 2025; however, the new plantation would have an increasing impact on water yield and sediment load entering into the Tarbela reservoir. Therefore, it is recommended to project the effects on these plantations up to near (2050) and far (2100) futures using projected LULC and CMIP6 climate data.
The impact of the BTAP plantation on runoff and sedimentation was assessed in this study. The findings are helpful for policymakers for long-term watershed management. To keep the Tarbela Dam functioning for a longer time, proper watershed management of the Indus is recommended, as the inflow of sediments in a reservoir might be dramatically controlled by carefully planned watershed management. Given the reduction and uncertain changes in future freshwater supplies in the Indus River Basin, it is recommended to build more storage and conveyance infrastructure to ensure consistent and sustainable freshwater supplies for domestic, industrial, and agricultural applications. The BTAP can be more profitable by growing cash trees, e.g., fruit trees, while keeping the regional setting and balanced plantations in view.

5. Conclusions

In the current study, we quantified the impacts of the Billion Tree Afforestation Project (BTAP) on the water yield and sediment load in the catchment area of the Tarbela reservoir of Pakistan. It was hypothesized that planting more trees would reduce the sediment load in the catchment flows. The parameterization of the SWAT model showed a promising performance (R2 & NSE > 0.82) during the calibration (1984–2000) and validation (2001–2010) periods. We used the SWAT model for three separate scenarios: before planting (2013), after planting one billion trees (2017), and after planting ten billion trees (2025). The simulated results highlighted that an increase in plantation size substantially reduced the sediment flow. A 5% increase in the forest cover (after one billion trees) decreased the sediment load by 12%, while a 13% increase in forest cover (after 3 billion trees) reduced the sediment load in river flows by 22%.
The BTAP plantation impact on runoff and sedimentation revealed that more forest cover is required to keep the Tarbela Dam functioning for a longer time. Moreover, activities that cause sediments, for example, construction projects, should be carried out with great care. Proper watershed management of the Indus is recommended as the inflow of sediments in a reservoir might be dramatically controlled by carefully planned watershed management. The water yield was quantified to have decreased by up to 18–26% under the BTAP. Therefore, constructing more water storage and conveyance infrastructure could help to buffer and sustain freshwater supplies in the Indus River Basin for domestic, agricultural, and industrial uses.
We recommend that future studies should consistently quantify the impacts of growing forest trees on sediment load and water yield. In an upcoming study on BTAP, projected and observed LULC and CMIP6 climate data would be used to allow the SWAT model to project the impacts of climate and LULC changes on sediment and water yield in the Tarbela reservoir for near (up to 2050) and far future (up to 2100) scenarios.

Author Contributions

Conceptualization, research design, and model parameterization by M.S. and A.S.; data curation by A.B.; formal analysis by A.Z.M., M.W.R., M.U.K., N.S. and M.I.A.; project administration by A.S.; visualization by M.S., A.S. and A.B.; writing—original draft by A.S.; writing—review and editing by M.S., A.Z.M., M.W.R., M.U.K., N.S., M.I.A., N.A.B. and R.M.S. All authors have read and agreed to the published version of the manuscript.

Funding

The first author acknowledges the funding from the National Natural Science Foundation China (NSFC grant no. 42150410387).

Data Availability Statement

The data presented in this study are available on request from the corresponding author. The data are not publicly available due to data sharing policies of the research group.

Conflicts of Interest

The authors declare no conflict of interest.

References

  1. Mahmood, R.; Pielke, R.A., Sr.; Hubbard, K.G.; Niyogi, D.; Dirmeyer, P.A.; McAlpine, C.; Carleton, A.M.; Hale, R.; Gameda, S.; Beltrán-Przekurat, A. Land cover changes and their biogeophysical effects on climate. Int. J. Climatol. 2014, 34, 929–953. [Google Scholar] [CrossRef]
  2. Zhang, F.; Thapa, S.; Immerzeel, W.; Zhang, H.; Lutz, A. Water availability on the Third Pole: A review. Water Secur. 2019, 7, 100033. [Google Scholar] [CrossRef]
  3. Immerzeel, W.W.; Lutz, A.F.; Andrade, M.; Bahl, A.; Biemans, H.; Bolch, T.; Hyde, S.; Brumby, S.; Davies, B.J.; Elmore, A.C.; et al. Importance and vulnerability of the world’s water towers. Nature 2020, 577, 364–369. [Google Scholar] [CrossRef] [PubMed]
  4. Pritchard, H.D. Asia’s shrinking glaciers protect large populations from drought stress. Nature 2019, 569, 649–654. [Google Scholar] [CrossRef]
  5. Tonitto, C.; Gurwick, N.P.; Woodbury, P.B. Quantifying greenhouse gas emissions from agricultural and forest landscapes for policy development and verification. In Synthesis and Modeling of Greenhouse Gas Emissions and Carbon Storage in Agricultural and Forest Systems to Guide Mitigation and Adaptation; John Wiley & Sons, Inc.: New York, NY, USA, 2016; Volume 6, pp. 229–304. [Google Scholar]
  6. Amir, R.M.; Ali, S.; Cheema, M.J.M.; Hussain, S.; Waqas, M.S.; Arshad, R.H.; Salam, M.; Raza, A.; Aslam, M. Estimating Sediment Yield at Tarbela Dam and Flood Forecasting through Continuous Precipitation-Runoff Modeling of Upper Indus Basin. Big Data Water Resour. Eng. (BDWRE) 2020, 1, 43–48. [Google Scholar] [CrossRef]
  7. Ahmad, M.-u.-D.; Peña-Arancibia, J.L.; Yu, Y.; Stewart, J.P.; Podger, G.M.; Kirby, J.M. Climate change and reservoir sedimentation implications for irrigated agriculture in the Indus Basin Irrigation System in Pakistan. J. Hydrol. 2021, 603, 126967. [Google Scholar] [CrossRef]
  8. Chakrabortty, R.; Pal, S.C.; Chowdhuri, I.; Malik, S.; Das, B. Assessing the importance of static and dynamic causative factors on erosion potentiality using SWAT, EBF with uncertainty and plausibility, logistic regression and novel ensemble model in a sub-tropical environment. J. Indian Soc. Remote Sens. 2020, 48, 765–789. [Google Scholar] [CrossRef]
  9. Butt, M.J.; Mahmood, R.; Waqas, A. Sediments deposition due to soil erosion in the watershed region of Mangla Dam. Environ. Monit. Assess. 2011, 181, 419–429. [Google Scholar] [CrossRef]
  10. Ateeq-Ur-Rehman, S.; Bui, M.D.; Rutschmann, P. Variability and trend detection in the sediment load of the Upper Indus River. Water 2018, 10, 16. [Google Scholar] [CrossRef]
  11. Ul Hussan, W.; Khurram Shahzad, M.; Seidel, F.; Costa, A.; Nestmann, F. Comparative Assessment of Spatial Variability and Trends of Flows and Sediments under the Impact of Climate Change in the Upper Indus Basin. Water 2020, 12, 730. [Google Scholar] [CrossRef] [Green Version]
  12. Ijaz, M.A.; Ashraf, M.; Hamid, S.; Niaz, Y.; Waqas, M.M.; Tariq, M.A.U.R.; Saifullah, M.; Bhatti, M.T.; Tahir, A.A.; Ikram, K.; et al. Prediction of Sediment Yield in a Data-Scarce River Catchment at the Sub-Basin Scale Using Gridded Precipitation Datasets. Water 2022, 14, 1480. [Google Scholar] [CrossRef]
  13. Dahri, Z.H.; Ahmad, B.; Leach, J.H.; Ahmad, S. Satellite-based snowcover distribution and associated snowmelt runoff modeling in Swat River Basin of Pakistan. Proc. Pak. Acad. Sci. 2011, 48, 19–32. [Google Scholar]
  14. Mazhar, N.; Mirza, A.I.; Abbas, S.; Akram, M.A.N.; Ali, M.; Javid, K. Effects of climatic factors on the sedimentation trends of Tarbela Reservoir, Pakistan. SN Appl. Sci. 2021, 3, 1–9. [Google Scholar] [CrossRef]
  15. Shafeeque, M.; Luo, Y. A multi-perspective approach for selecting CMIP6 scenarios to project climate change impacts on glacio-hydrology with a case study in Upper Indus river basin. J. Hydrol. 2021, 599, 126466. [Google Scholar] [CrossRef]
  16. Ahmed, K.B.; Sanchez, M. A study of the factors and processes involved in the sedimentation of Tarbela reservoir, Pakistan. Environ. Earth Sci. 2011, 62, 927–933. [Google Scholar] [CrossRef]
  17. Petkovsek, G.; Roca, M. Impact of reservoir operation on sediment deposition. Proc. Inst. Civ. Eng.-Water Manag. 2014, 167, 577–584. [Google Scholar]
  18. Saddique, N.; Mahmood, T.; Bernhofer, C. Quantifying the impacts of land use/land cover change on the water balance in the afforested River Basin, Pakistan. Environ. Earth Sci. 2020, 79, 448. [Google Scholar] [CrossRef]
  19. Sabir, M.; Ali, Y.; Khan, I.; Salman, A. Plants Species Selection for Afforestation: A Case Study of the Billion Tree Tsunami Project of Pakistan. J. Sustain. For. 2020, 39, 1–13. [Google Scholar] [CrossRef]
  20. Mumtaz, F.; Tao, Y.; de Leeuw, G.; Zhao, L.; Fan, C.; Elnashar, A.; Bashir, B.; Wang, G.; Li, L.; Naeem, S.; et al. Modeling Spatio-Temporal Land Transformation and Its Associated Impacts on land Surface Temperature (LST). Remote Sens. 2020, 12, 2987. [Google Scholar] [CrossRef]
  21. Khan, N.; Shah, S.J.; Rauf, T.; Zada, M.; Yukun, C.; Harbi, J. Socioeconomic Impacts of the Billion Trees Afforestation Program in Khyber Pakhtunkhwa Province (KPK), Pakistan. Forests 2019, 10, 703. [Google Scholar] [CrossRef]
  22. Nazir, N.; Farooq, A.; Jan, S.A.; Ahmad, A. A system dynamics model for billion trees tsunami afforestation project of Khyber Pakhtunkhwa in Pakistan: Model application to afforestation activities. J. Mt. Sci. 2019, 16, 2640–2653. [Google Scholar] [CrossRef]
  23. Ministry-of-Climate. Ten Billion Tree Tsunami Programme Phase-I, Up-Scaling of Green Pakistan Programme; Department of Forestry, Environment & Wildlife Government of Khyber Pakhtunkhwa Peshawar: Peshawar, Pakistan, 2019; pp. 1–206. [Google Scholar]
  24. Shafeeque, M.; Masud Cheema, M.J.; Sarwar, A.; Hussain, M.W. Quantification of Groundwater Abstraction Using Swat Model in Hakra Branch Canal System of Pakistan. Pak. J. Agric. Sci. 2016, 53, 249–255. [Google Scholar] [CrossRef]
  25. Aawar, T.; Khare, D. Assessment of climate change impacts on streamflow through hydrological model using SWAT model: A case study of Afghanistan. Model. Earth Syst. Environ. 2020, 6, 1427–1437. [Google Scholar] [CrossRef]
  26. Babur, M.; Shrestha, S.; Bhatta, B.; Datta, A.; Ullah, H. Integrated assessment of extreme climate and landuse change impact on sediment yield in a mountainous transboundary watershed of India and Pakistan. J. Mt. Sci. 2020, 17, 624–640. [Google Scholar] [CrossRef]
  27. Scott, C.A.; Zhang, F.; Mukherji, A.; Immerzeel, W.; Mustafa, D.; Bharati, L. Water in The Hindu kush himalaya. In The Hindu Kush Himalaya Assessment; Springer: Berlin/Heidelberg, Germany, 2019; pp. 257–299. [Google Scholar]
  28. Hosseini, S.H.; Khaleghi, M.R. Application of SWAT model and SWAT-CUP software in simulation and analysis of sediment uncertainty in arid and semi-arid watersheds (case study: The Zoshk–Abardeh watershed). Model. Earth Syst. Environ. 2020, 6, 2003–2013. [Google Scholar] [CrossRef]
  29. Ali, W.R.M.; Chen, N.; Umar, W.R.M.; Sundas, A.; Nisa, Z.-U.; Mahfuzur, R. Assessment of Runoff, Sediment Yields and Nutrient Loss Using the Swat Model in Upper Indus Basin of Pakistan. J. Geosci. Environ. Prot. 2020, 8, 62–81. [Google Scholar] [CrossRef]
  30. Mirza, U.K.; Ahmad, N.; Majeed, T.; Harijan, K. Hydropower use in Pakistan: Past, present and future. Renew. Sustain. Energy Rev. 2008, 12, 1641–1651. [Google Scholar] [CrossRef]
  31. Shafeeque, M.; Luo, Y.; Wang, X.; Sun, L. Revealing Vertical Distribution of Precipitation in the Glacierized Upper Indus Basin Based on Multiple Datasets. J. Hydrometeorol. 2019, 20, 2291–2314. [Google Scholar] [CrossRef]
  32. Getachew, H.E.; Melesse, A.M. The impact of land use change on the hydrology of the Angereb Watershed, Ethiopia. Int. J. Water Sci. 2012, 1, 4. [Google Scholar]
  33. Savvidou, E. A Study of Alternative Hydrological Response Units (HRU) Configurations in the Context of Geographical Information Systems (GIS)-Based Distributed Hydrological Modeling. Ph.D. Thesis, Cyprus University of Technology, Limassol, Cyprus, 2018. [Google Scholar]
  34. El Harraki, W.; Ouazar, D.; Bouziane, A.; El Harraki, I.; Hasnaoui, D. Streamflow prediction upstream of a dam using SWAT and assessment of the impact of land use spatial resolution on model performance. Environ. Process. 2021, 8, 1165–1186. [Google Scholar] [CrossRef]
  35. Deng, Z.; Zhang, X.; Li, D.; Pan, G. Simulation of land use/land cover change and its effects on the hydrological characteristics of the upper reaches of the Hanjiang Basin. Environ. Earth Sci. 2015, 73, 1119–1132. [Google Scholar] [CrossRef]
  36. Chaplot, V. Impact of DEM mesh size and soil map scale on SWAT runoff, sediment, and NO3–N loads predictions. J. Hydrol. 2005, 312, 207–222. [Google Scholar] [CrossRef]
  37. Arnold, J.G.; Moriasi, D.N.; Gassman, P.W.; Abbaspour, K.C.; White, M.J.; Srinivasan, R.; Santhi, C.; Harmel, R.; Van Griensven, A.; Van Liew, M.W. SWAT: Model use, calibration, and validation. Trans. ASABE 2012, 55, 1491–1508. [Google Scholar] [CrossRef]
  38. Ridwansyah, I.; Pawitan, H.; Sinukaban, N.; Hidayat, Y. Watershed Modeling with ArcSWAT and SUFI2 In Cisadane Catchment Area: Calibration and Validation of River Flow Prediction. Int. J. Sci. Eng. 2014, 6, 92–101. [Google Scholar] [CrossRef]
  39. Mendonça dos Santos, F.; Proença de Oliveira, R.; Augusto Di Lollo, J. Effects of Land Use Changes on Streamflow and Sediment Yield in Atibaia River Basin—SP, Brazil. Water 2020, 12, 1711. [Google Scholar] [CrossRef]
  40. Jakada, H.; Chen, Z. An approach to runoff modelling in small karst watersheds using the SWAT model. Arab. J. Geosci. 2020, 13, 1–18. [Google Scholar] [CrossRef]
  41. Gull, S.; Ahangar, M.; Dar, A.M. Prediction of stream flow and sediment yield of Lolab watershed using SWAT model. Hydrol. Curr. Res. 2017, 8, 1–9. [Google Scholar] [CrossRef]
  42. Moriasi, D.N.; Arnold, J.G.; Liew, M.W.V.; Bingner, R.L.; Harmel, R.D.; Veith, T.L. Model Evaluation Guidelines for Systematic Quantification of Accuracy in Watershed Simulations. Trans. ASABE 2007, 50, 885–900. [Google Scholar] [CrossRef]
  43. Du, X.; Goss, G.; Faramarzi, M. Impacts of hydrological processes on stream temperature in a cold region watershed based on the SWAT equilibrium temperature model. Water 2020, 12, 1112. [Google Scholar] [CrossRef]
  44. Briak, H.; Mrabet, R.; Moussadek, R.; Aboumaria, K. Use of a calibrated SWAT model to evaluate the effects of agricultural BMPs on sediments of the Kalaya river basin (North of Morocco). Int. Soil Water Conserv. Res. 2019, 7, 176–183. [Google Scholar] [CrossRef]
  45. Musyoka, F.K.; Strauss, P.; Zhao, G.; Srinivasan, R.; Klik, A. Multi-step calibration approach for SWAT model using soil moisture and crop yields in a small agricultural catchment. Water 2021, 13, 2238. [Google Scholar] [CrossRef]
  46. Hallouz, F.; Meddi, M.; Mahé, G.; Alirahmani, S.; Keddar, A. Modeling of discharge and sediment transport through the SWAT model in the basin of Harraza (Northwest of Algeria). Water Sci. 2018, 32, 79–88. [Google Scholar] [CrossRef]
  47. Vilaysane, B.; Takara, K.; Luo, P.; Akkharath, I.; Duan, W. Hydrological stream flow modelling for calibration and uncertainty analysis using SWAT model in the Xedone river basin, Lao PDR. Procedia Environ. Sci. 2015, 28, 380–390. [Google Scholar] [CrossRef] [Green Version]
  48. Mukhopadhyay, B.; Khan, A. A quantitative assessment of the genetic sources of the hydrologic flow regimes in Upper Indus Basin and its significance in a changing climate. J. Hydrol. 2014, 509, 549–572. [Google Scholar] [CrossRef]
  49. Aga, A.O.; Chane, B.; Melesse, A.M. Soil erosion modelling and risk assessment in data scarce rift valley lake regions, Ethiopia. Water 2018, 10, 1684. [Google Scholar] [CrossRef] [Green Version]
Figure 1. Tarbela reservoir catchment.
Land 11 01650 g001
Figure 2. Workflow chart of the methodology.
Land 11 01650 g002
Figure 3. Soil and LULC map (2013) of Tarbala’s catchment. Here, AGRC—agricultural land-close-grown, FRSD—forest-deciduous, OILP—oil palm, WETL—wetlands-mixed, PAST—pasture, SPAS—summer pasture, WATR—water, BARR—barren, FRST—forest-mixed, GLAC—glaciers, AGRL—agricultural land-generic, FRSE—forest-evergreen, RNGB—range-brush, RNGE—range-grasses.
Land 11 01650 g003
Figure 4. Land-use proportion for (a) scenario 1: before planting (2013), (b) scenario 2: after planting 1 billion trees (2017), and (c) scenario 3: after planting 3 billion trees (2025). Here, BARR—barren, FRST—forest-mixed, GLAC—glaciers, AGRL—agricultural land-generic, FRSE—forest-evergreen, RNGB—range-brush, RNGE—range-grasses.
Land 11 01650 g004
Figure 5. SWAT model calibration and validation results. (a) time series of observed and simulated flow during calibration period. (b) time series of observed and simulated flow during validation period. (c) time series of observed and simulated sediments during validation period. (d) observed versus simulated flow during calibration. (e) observed versus simulated flow during validation. (f) observed versus simulated sediments during validation period.
Land 11 01650 g005
Figure 6. Spatial distribution of the water yield for three scenarios (a) 2013, (b) 2017, and (c) 2025 in the sub-basins. (d) boxplots and (e) density distribution plots to present differences among the scenarios.
Land 11 01650 g006
Figure 7. Monthly streamflow comparison between the first, second, and third scenarios. (a) Monthly time series and (b) monthly averages for all scenarios.
Land 11 01650 g007
Figure 8. Schematic map of the sediment load developed using SWAT for the three scenarios (a) 2013, (b) 2017, and (c) 2025. (d) boxplots and (e) density distribution plots to present the differences among the scenarios.
Land 11 01650 g008
Figure 9. Sediment’s flow comparison between the first (2013), second (2017), and third (2025) scenarios. (a) Monthly time series and (b) monthly averages for all scenarios.
Land 11 01650 g009
Figure 10. Relationship between the water yield and sediment load under the first (2013), second (2017), and third (2025) scenarios.
Land 11 01650 g010
Table 1. Meteorological stations, their locations, and their elevations.
StationLatitudeLongitudeElevation (m.a.s.l.)Average Rainfall (mm/yr)
Astore35.219074.87413709305
Basham34.911172.866317571259
Bunjhi35.643174.634237151151
Chilas35.422274.09463462197
Gilgit35.881974.46433381159
Guppies36.166773.40004107168
Kakul34.187573.261814191309
Skardu35.324775.55104088189
Table 2. Description, ranges, fitted values, and significance statistics of the sensitive parameters.
Parameter NameDefinitionFitted
Value
Min
Value
Max
Value
t-Statp-ValueRank
CN2.mgtSCS runoff curve number−0.1−0.250.2524.520.001
SOL_BD.solMoist bulk density0.23−0.50.616.110.002
SFTMP.bsnSnowfall temperature8.8851512.190.013
SMTMP.bsnSnow melt base temperature9.5951511.540.004
ALPHA_BF.gwBase flow alpha factor (days)0.440.430.518.220.025
GW_DELAY.gwGroundwater delay (days)10.28−13307.000.016
CH_K2.rteEffective hydraulic conductivity132.3151376.310.037
SOL_AWC.solAvailable water capacity of the soil layer−0.13−0.20.465.110.048
CH_N2.rteManning’s n value for the main channel0.2200.34.860.019
ESCO.hruSoil evaporation compensation factor1014.190.0210
SOL_K.solSaturated hydraulic conductivity0.25−0.80.83.740.0811
GW_REVAP.gwGroundwater revap coefficient0.180.020.21.510.5212
PLAPS.subPrecipitation lapse rate−245.63−300−191.330.0513
SNOCOVMX.bsnMinimum snow water content27.7203001.110.1514
TLAPS.subTemperature lapse rate−16.3−20201.010.0515
GWQMN.gwThreshold water level in a shallow aquifer2.191.952.46−0.990.3216
SMFMX.bsnMaximum melt rate for snow during a year5.43020−1.120.0117
ALPHA_BNK.rteBase flow alpha factor for bank storage0.501−1.800.9018
SMFMN.bsnMinimum melt rate for snow during a year7.45020−2.110.9319
RCHRG_DP.gwDeep aquifer percolation fraction0.2101.7−2.500.4420
SNO50COV.bsnSnow water equivalent0.50.10.8−3.440.7321
TIMP.bsnSnowpack temperature lag factor0.5201−5.220.2522
Table 3. Calibration and validation performance results.
Performance IndicatorCalibrationValidation (Water Yield)Validation (Sediment Load)
R20.850.880.88
PBIAS11.29.4−19.92
NSE0.840.860.86
Table 4. Analysis of variance (ANOVA) test and Tukey’s honestly significant difference (Tukey’s HSD) post hoc test for pairwise comparisons of the water yield under different scenarios.
ANOVA
Source of variationSum of squares (SS)Degrees of freedom (df)Mean squared (MS)F-valuePr (>F)
Scenario7914123957122.223.2 × 10−10 ***
Residuals239326313441781
Tukey’s HSD
ScenariosDifferenceLowerUpperp-adjusted
WYLD-2017-WYLD-2013−8.80846−15.4165−2.200440.005116
WYLD-2025-WYLD-2013−18.7639−25.372−12.15590.000000
WYLD-2025-WYLD-2017−9.95546−16.5635−3.347430.001226
Significance codes: ‘***’ 0.001.
Table 5. Analysis of variance (ANOVA) test and Tukey’s honestly significant difference (Tukey’s HSD) post hoc test for pairwise comparisons of the sediment load under different scenarios.
ANOVA
Source of variationSum of squares (SS)Degrees of freedom (df)Mean squared (MS)F-valuePr (>F)
Scenario39418221970917.9070.000385 ***
Residuals33499061134424925
Tukey’s HSD
ScenariosDifferenceLowerUpperp-adjusted
SDMTLD-2017-SDMTLD-2013−15.3074−40.02999.4151840.314263
SDMTLD-2025-SDMTLD-2013−41.4343−66.1568−16.71180.000261
SDMTLD-2025-SDMTLD-2017−26.127−50.8495−1.404420.035401
Significance codes: ‘***’ 0.001.
Publisher’s Note: MDPI stays neutral with regard to jurisdictional claims in published maps and institutional affiliations.