Article

Fractal Characteristic Evolution of Coastal Settlement Land Use: A Case of Xiamen, China

1
School of Biological Science and Biotechnology, Minnan Normal University, Zhangzhou 363000, China
2
School of Architecture, Harbin Institute of Technology, Key Laboratory of Cold Region Urban and Rural Human Settlement Environment Science and Technology, Ministry of Industry and Information Technology, Harbin 150001, China
*
Author to whom correspondence should be addressed.
Land 2022, 11(1), 50; https://doi.org/10.3390/land11010050
Submission received: 14 November 2021 / Revised: 13 December 2021 / Accepted: 22 December 2021 / Published: 30 December 2021
(This article belongs to the Special Issue Cities' Spatial Structure and Drivers of its Transformation)

Abstract

:
Coastal settlements in urban areas show certain degrees of spatial complexity. Understanding the evolution law of fractal settlements is practically important for marine engineering and urban planning. In this paper, we investigate the fractal evolution of coastal settlement land use based on fractal theory. The fractal dimensions of the land uses for three typically coastal settlements in Xiamen city, China, are obtained to quantify their spatial complexity. The results reveal the fractal characteristics and regional differences of the coastal settlements. Furthermore, nonlinear modeling is applied to describe the fractal dimension evolution of the coastal settlement land uses from 2000 to 2018. Three settlements in rapid urbanization show different nonlinear evolution equations of the fractal dimension due to their different land uses. This study might provide a theoretical basis for understanding the fractal characteristic evolution of coastal settlements in urban areas and show its potential application in urban geography.

Graphical Abstract

1. Introduction

With the rapid development of ocean exploration, the land-use complexity of coastal cities has changed significantly [1,2]. Coastal urban space expansion, population increase, and social as well as economic structure changes have accelerated the changes of coastline and urban spatial form. The complexity evolution of coastal urban land use directly affects sustainable development. Therefore, understanding its evolution law has important theoretical and practical significance.
Fractal theory has the potential to quantitatively reveal the spatial complexity of cities and has received considerable interest [3,4,5,6,7,8,9,10,11]. Mandelbrot proposed the concept of fractal in terms of the coastline length and calculated the fractal dimension of a series of regional coastlines such as Britain [12]. Batty et al. used fractal dimension to evaluate the irregularity of land use and analyzed the land-use form of Swindon city in the U.K. [3]. Frankhauser reported the fractal calculation results of urban land-use patterns [8]. By calculating the fractal dimension of 20 cities in the United States, Shen et al. found that the fractal dimension could be used as an index to measure urban spatial growth [9]. Chen calculated the fractal dimensions of urban forms and boundaries, found scaling laws of self-organized criticality in urban systems, and suggested the application of fractal city planning [6,7]. Yu et al. analyzed the fractal characteristic of Xiamen island based on satellite remote sensing data and found that the fractal dimension evolution of the island was related to land reclamation from the sea [13]. These studies suggest that the fractal analysis of urban spaces might reveal the evolution law of its complexity.
Coastal settlements, as localized units in a coastal city, are complex forms of human settlements [13,14,15,16]. Land-use patterns of coastal settlements are diversified, with gradient changes in fishing village landscape, mixed landscape, and modern urban landscape. There are many different forms of land use in Xiamen settlements, such as herringbone form in historic fishing villages, ancient houses in Southern Fujian, disordered temporary residential areas, etc. [15,16]. In particular, some coastal settlements contain coastlines with complex geometric structures [13]. Their coastline changes are closely related to natural factors such as seawater movement and sea-level change and human factors such as port construction and land reclamation. In coastal city development, the land use of smaller-scale settlements usually exhibits more significant spatial complexity and time evolution. Therefore, understanding the complexity evolution law of coastal settlements has important value for marine engineering and urban planning.
In this paper, we will study fractal characteristic evolution of coastal settlements by using fractal theory. The fractal dimensions of the land use of three typical coastal settlements in Xiamen, China, including Zengcuoan settlement, Yingping settlement, and Gaopu settlement, are calculated. Fractal characteristics and regional differences of these settlements are investigated. Furthermore, nonlinear modeling will be employed to describe the fractal dimension evolution of the coastal settlement land use from 2000 to 2018. Finally, the nonlinear evolution equations of fractal dimensions of these three settlements will be derived. This study might be valuable for understanding the fractal evolution of coastal settlements in urban areas.

2. Materials and Methods
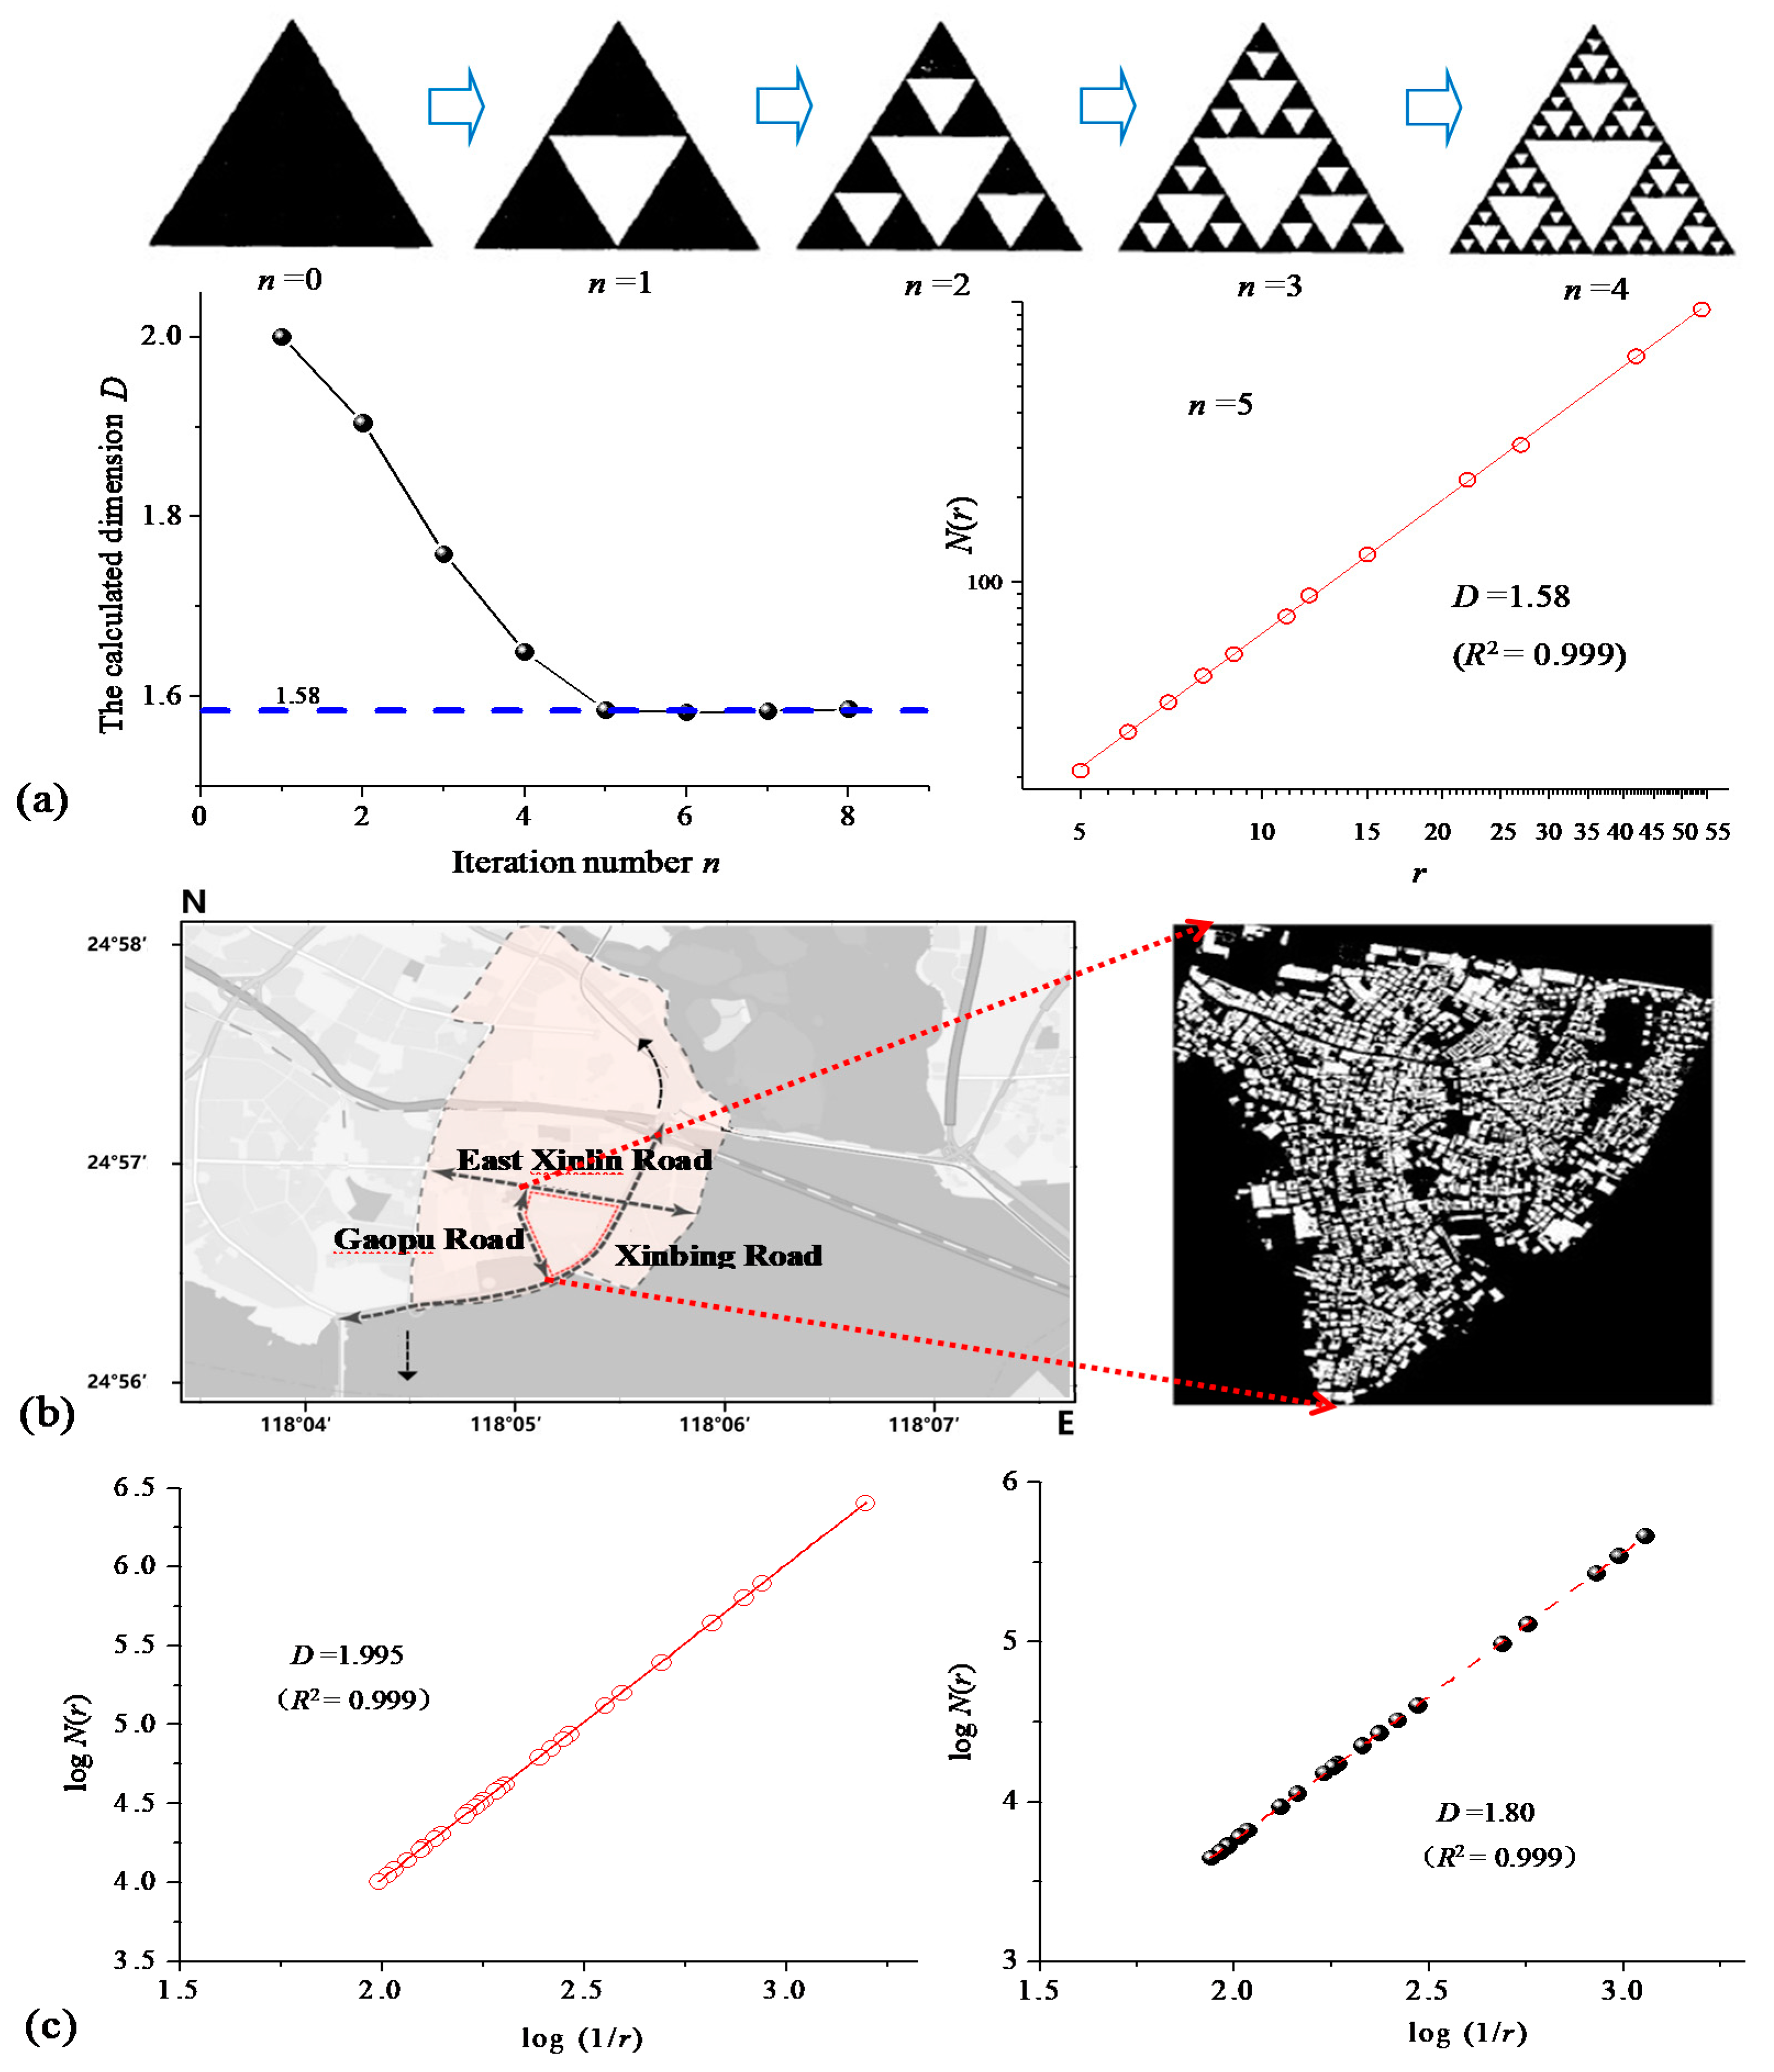
2.1. Fractals

Fractal theory is a powerful tool to quantify the complex characteristics of spatial regions [17,18,19,20,21,22,23,24,25,26,27]. In fractal geometry, complex objects show irregular spatial forms with fractal dimension, while in European geometry, points, lines, surfaces, and cubes are zero-dimensional, one-dimensional, two-dimensional, and three-dimensional regular spatial forms, respectively. To obtain the geometric dimension of an object, r is used as the scale, and N is the number of scales required. For example, if a square of unit area is divided into N = 4 smaller squares, then the area of each square with side length r = 1/2 is r2 = 1/4. If the square of unit area is divided into N = 9 smaller squares, then the area of each square with side length r = 1/3 is r2 = 1/9. Clearly, N × r2 = 1 leads to the following formula
N = r D
where the integer value D = 2 is the dimension of the square. Taking logarithms on both sides of Equation (1), then we have [12]
D = log N log ( 1 / r )
However, for fractal geometry, D, which is calculated by Equation (2), is not an integer. For example, the famous Sierpinski triangle can be generated by the iteration as shown in Figure 1a. Figure 1b shows that the fractal dimension evolves with the change in triangle number. For the iteration number n = 0, the dimension of the single triangle is 2, and the entirety of the triangular region is filled in. With the increase of the iteration number, the triangle number increases, and the geometry becomes more fractal, suggesting the decreased dimension. However, when the iteration number n becomes sufficiently larger (n > 5), the calculated dimension approaches 1.58. Theoretically, for the iteration number n = N, the side length of each triangle is r = 1/2N, and the number of smaller triangles is 3N. Substituting these parameters into Equation (2), we can obtain the fractal dimension of Sierpinski triangle [12] as
D = log 3 / log 2 1.585
Clearly, fractal geometries have a non-integer value of D. The calculated dimension of Sierpinski triangles demonstrates consistency with its theoretical value.
Based on the fractal theory, we apply the box-counting method for an urban settlement in a digital land-use map to calculate fractal dimension [3,6,7,8,9,10,22,23]. First of all, the land-use map is covered by a series of square boxes with side length r. The number N of square boxes intersecting with the settlement land use is recorded. Furthermore, the box length r is changed to obtain a series of box numbers N. Clearly, when r is sufficiently small, the boxes can be fully close to the spatial form of the settlement. Finally, a series of points (r, N) are plotted in the coordinate system, and then the least square linear regression is used to fit (log r, log N) to calculate the slope. Thus, the slope is the estimated fractal dimension of the settlement land use.
We test the numerical performance of the box-counting method by calculating the fractal dimension of the typical fractal figures, including Sierpinski triangle, Sierpinski block, and Koch snow. The theoretical solutions of the fractal dimensions of these fractal figures can be derived as log 3 / log 2 , 3 log 2 / log 3 , and 2 log 2 / log 3 , respectively [12]. Using the box-counting method, for the data pair (r, N) of these fractal figures, we take the logarithm of r and N(r) and perform linear fitting to calculate their fractal dimensions. The fractal dimension of Sierpinski triangle is calculated as 1.58, as shown in Figure 1a. The fractal dimensions of Sierpinski block and Koch snow are calculated as 1.89 and 1.26, respectively. Clearly, compared to the theoretical solutions of these fractal figures, the calculation errors of the box-counting method are less than 0.30%, indicating the reliability of fractal dimension calculation in this study.
Furthermore, we calculate the fractal dimension of Gaopu settlement, as shown in Figure 1b. Gaopu settlement is located off Xiamen Island. Fractal dimension quantifies the irregularity of settlement land use. The higher the fractal dimension is, the more the settlement land is used. For a regular two-dimensional street block surrounded by these three roads, the dimension is calculated to be 1.995 (R2 = 0.999). The error is less than 0.25%, which shows that the fractal dimension calculation has a high accuracy. In particular, for the scattered land use of Gaopu settlement, the fractal dimension can be calculated as 1.80 (R2 = 0.999), indicating the fractal characteristic of Gaopu settlement. It suggests that the fractal dimension could be applied to quantitatively analyze the complex characteristics of coastal settlements.

2.2. Nonlinear Evolution Equation

The economic and social developments of a coastal urban area may result in time evolution of settlement land use. For a certain coastal settlement, the complexity evolution of land use can be quantitatively described by the time evolution function of its fractal dimension as.
D i = F ( D i , μ )
where i is the time variable, i.e., year; D i is the corresponding fractal dimension of a settlement land use; D i is the fitted fractal dimension; F ( ) represents the time evolution equation, and μ is the coefficient vector. Typically, linear and quadratic functional forms of F ( ) can be used. Based on D i of a coastal settlement, the nonlinear least square algorithm is applied to determine F ( ) . A fitting error between the i-th fractal dimension and the fitting function as
e i = D i F ( D i , μ )
According to the least square principle [25], the objective function is constructed as:
Q = i = 1 M e i 2 = i = 1 M [ D i F ( D i , μ ) ] 2
where Q is the total error for all fractal dimension values. The optimization estimation should make the objective function Equation (5) take a minimum value, that is, satisfy
Q μ = 0
when D is correlated with time, the evolution function F ( ) with coefficient μ can be fitted by using the Gauss-Newton iterative method [28]. The fitting effect can be evaluated by the goodness of fit, that is, R2. The closer R2 is to 1, the better the fitting of the nonlinear function is. However, an R2 approaching 0 would indicate that F ( ) can not be effectively obtained. Based on the large value of R2, we can determine an effective equation form to model the time evolution of the fractal dimension of coastal settlement land use.

3. Results and Discussion

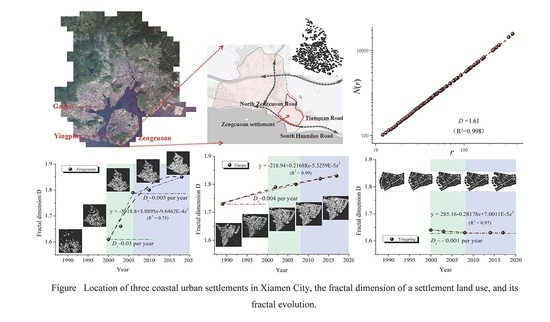
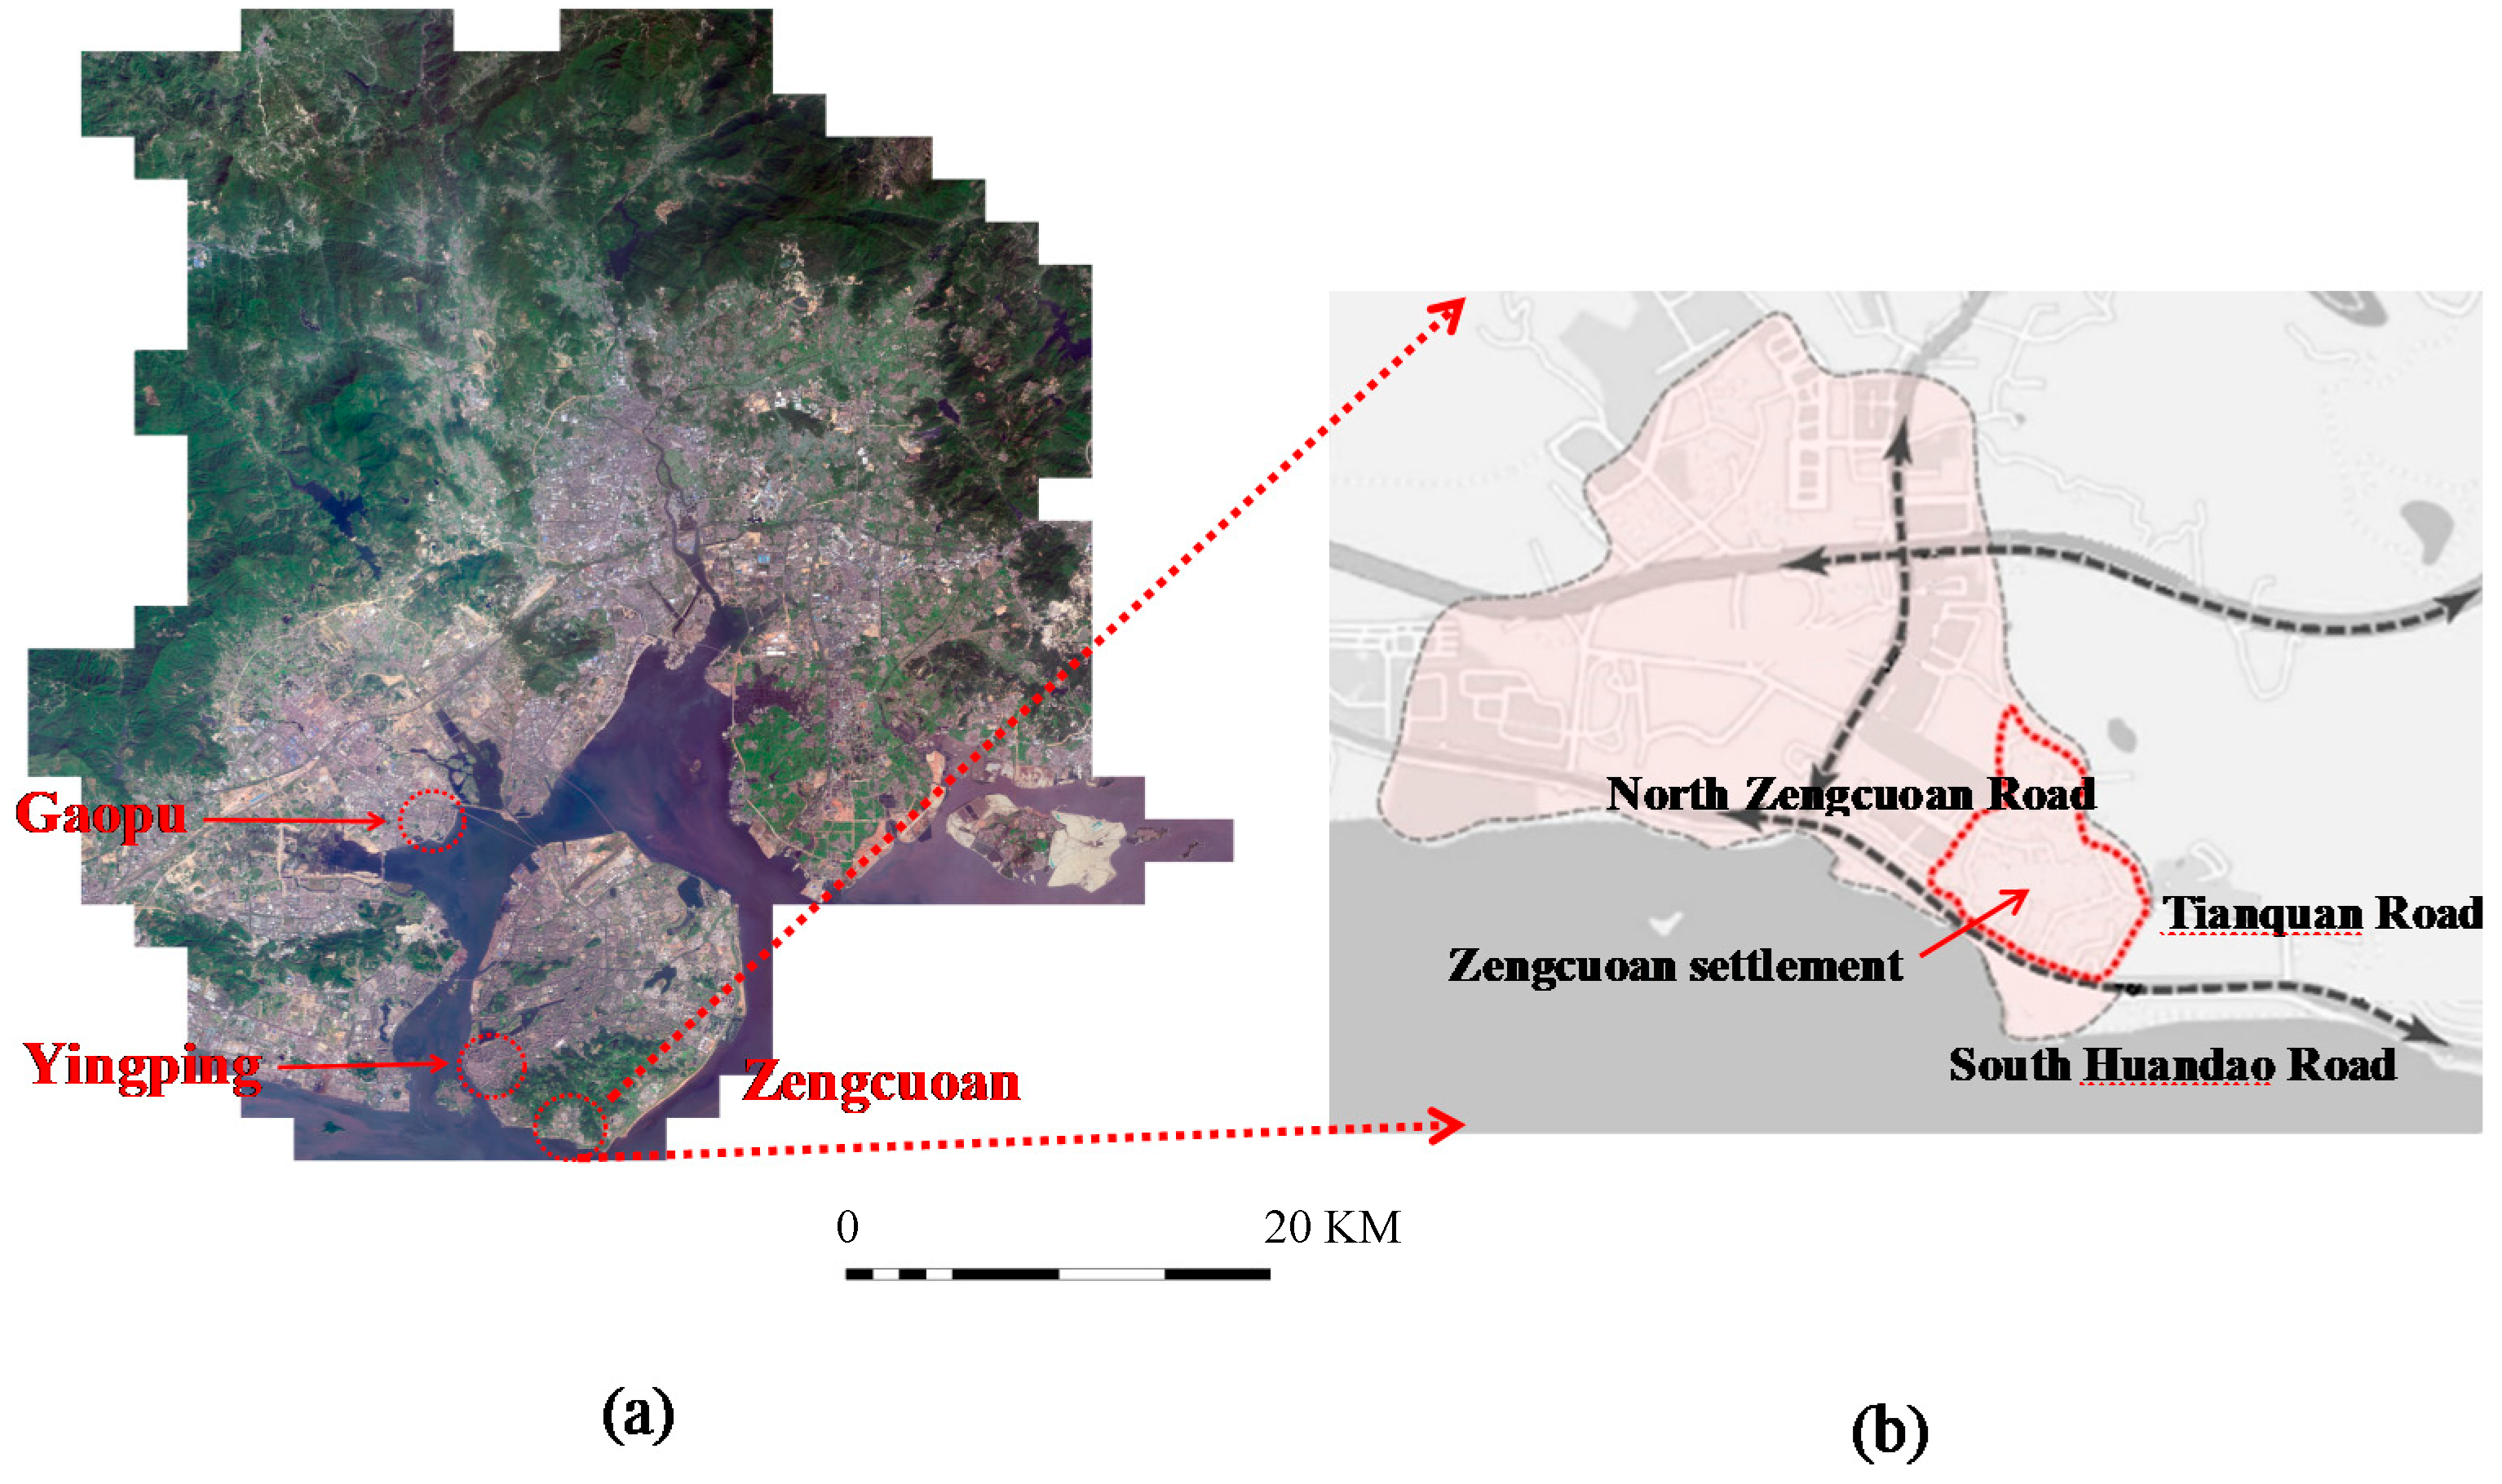
3.1. Land Use of the Studied Coastal Settlements

The spatial complexity of a coastal settlement is related to its location and geometry. In this study, we selected three typical coastal settlements in Xiamen, including Gaopu settlement, Yingping settlement, and Zengcuoan settlement, as shown in Figure 2a. Zengcuoan settlement is shown in Figure 2b. We considered these settlements for the following reasons. First of all, these three settlements are all located in the coastal zone of Xiamen City. Therefore, they have the same social and economic policies of city development. Furthermore, these three settlements were all traditional fishing village settlements. Due to the coastal geographical advantage, they exhibit similar marine culture and spatial characteristics. In recent years, accompanied by the rapid development of Xiamen, the land uses of these three settlements have exhibited different trends [13,15,16]. Thus, it is important to study the evolution of the land-use complexity of these settlements, which provides a typical case for the fractal study of coastal settlements.
In this study, the land uses of coastal settlements include residential areas, recreational areas, offices, commercial areas, and industrial areas, which are illustrated as black regions in the digital maps, while road network, barren lands, vacant areas, inner lakes, and coastlines are not considered and are illustrated as white regions. The land-use data mainly includes AutoCAD maps of Gaopu, Zengcuoan, and Yingping settlements from 2000 to 2018, provided by the Xiamen geographic information center. The on-site land-use survey of these settlements was further performed to revise the AutoCAD maps. Settlement maps from 2000 to 2018 provide the key graphic information to study the land-use evolution of these settlements. To extract the spatial forms of the settlements, we eliminated other surveying and mapping information in the land-use maps but kept the land-use outlines and exported the maps as digital images. Based on these outlines, the land uses in the map images were completely filled to obtain the overall spatial form of the settlements. Finally, fractal dimension calculations were performed on the land-use maps of these coastal settlements.

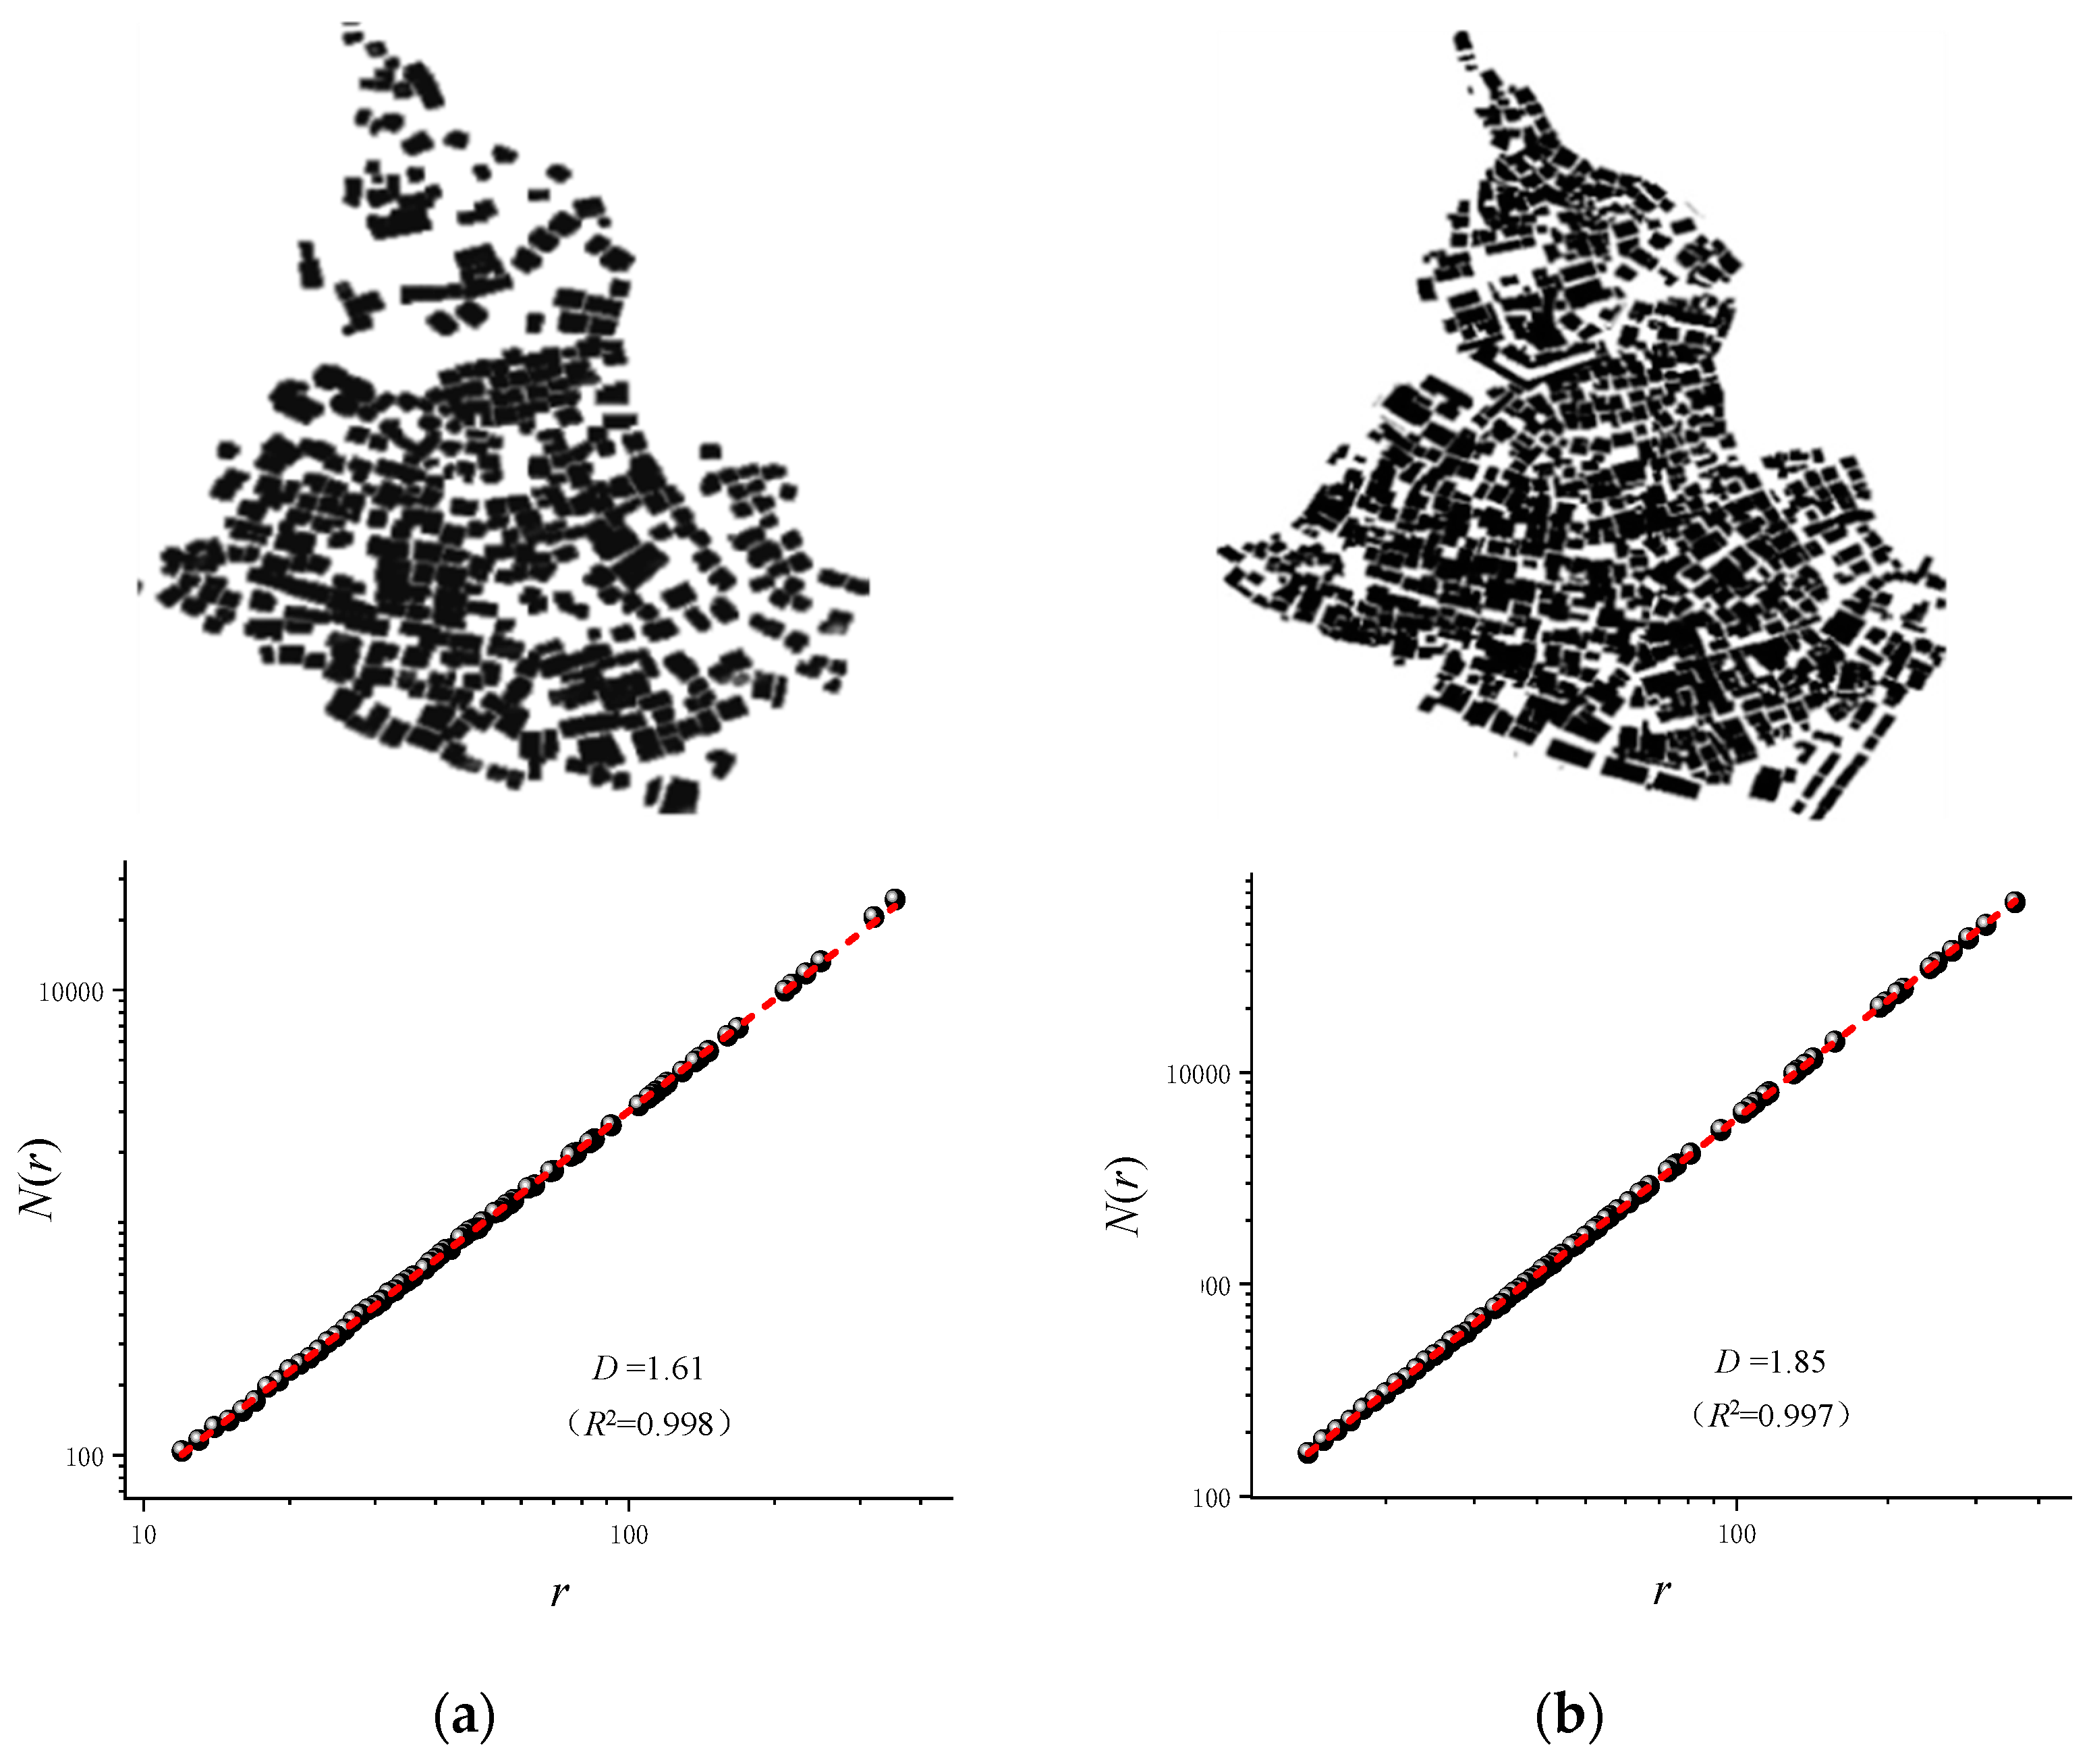
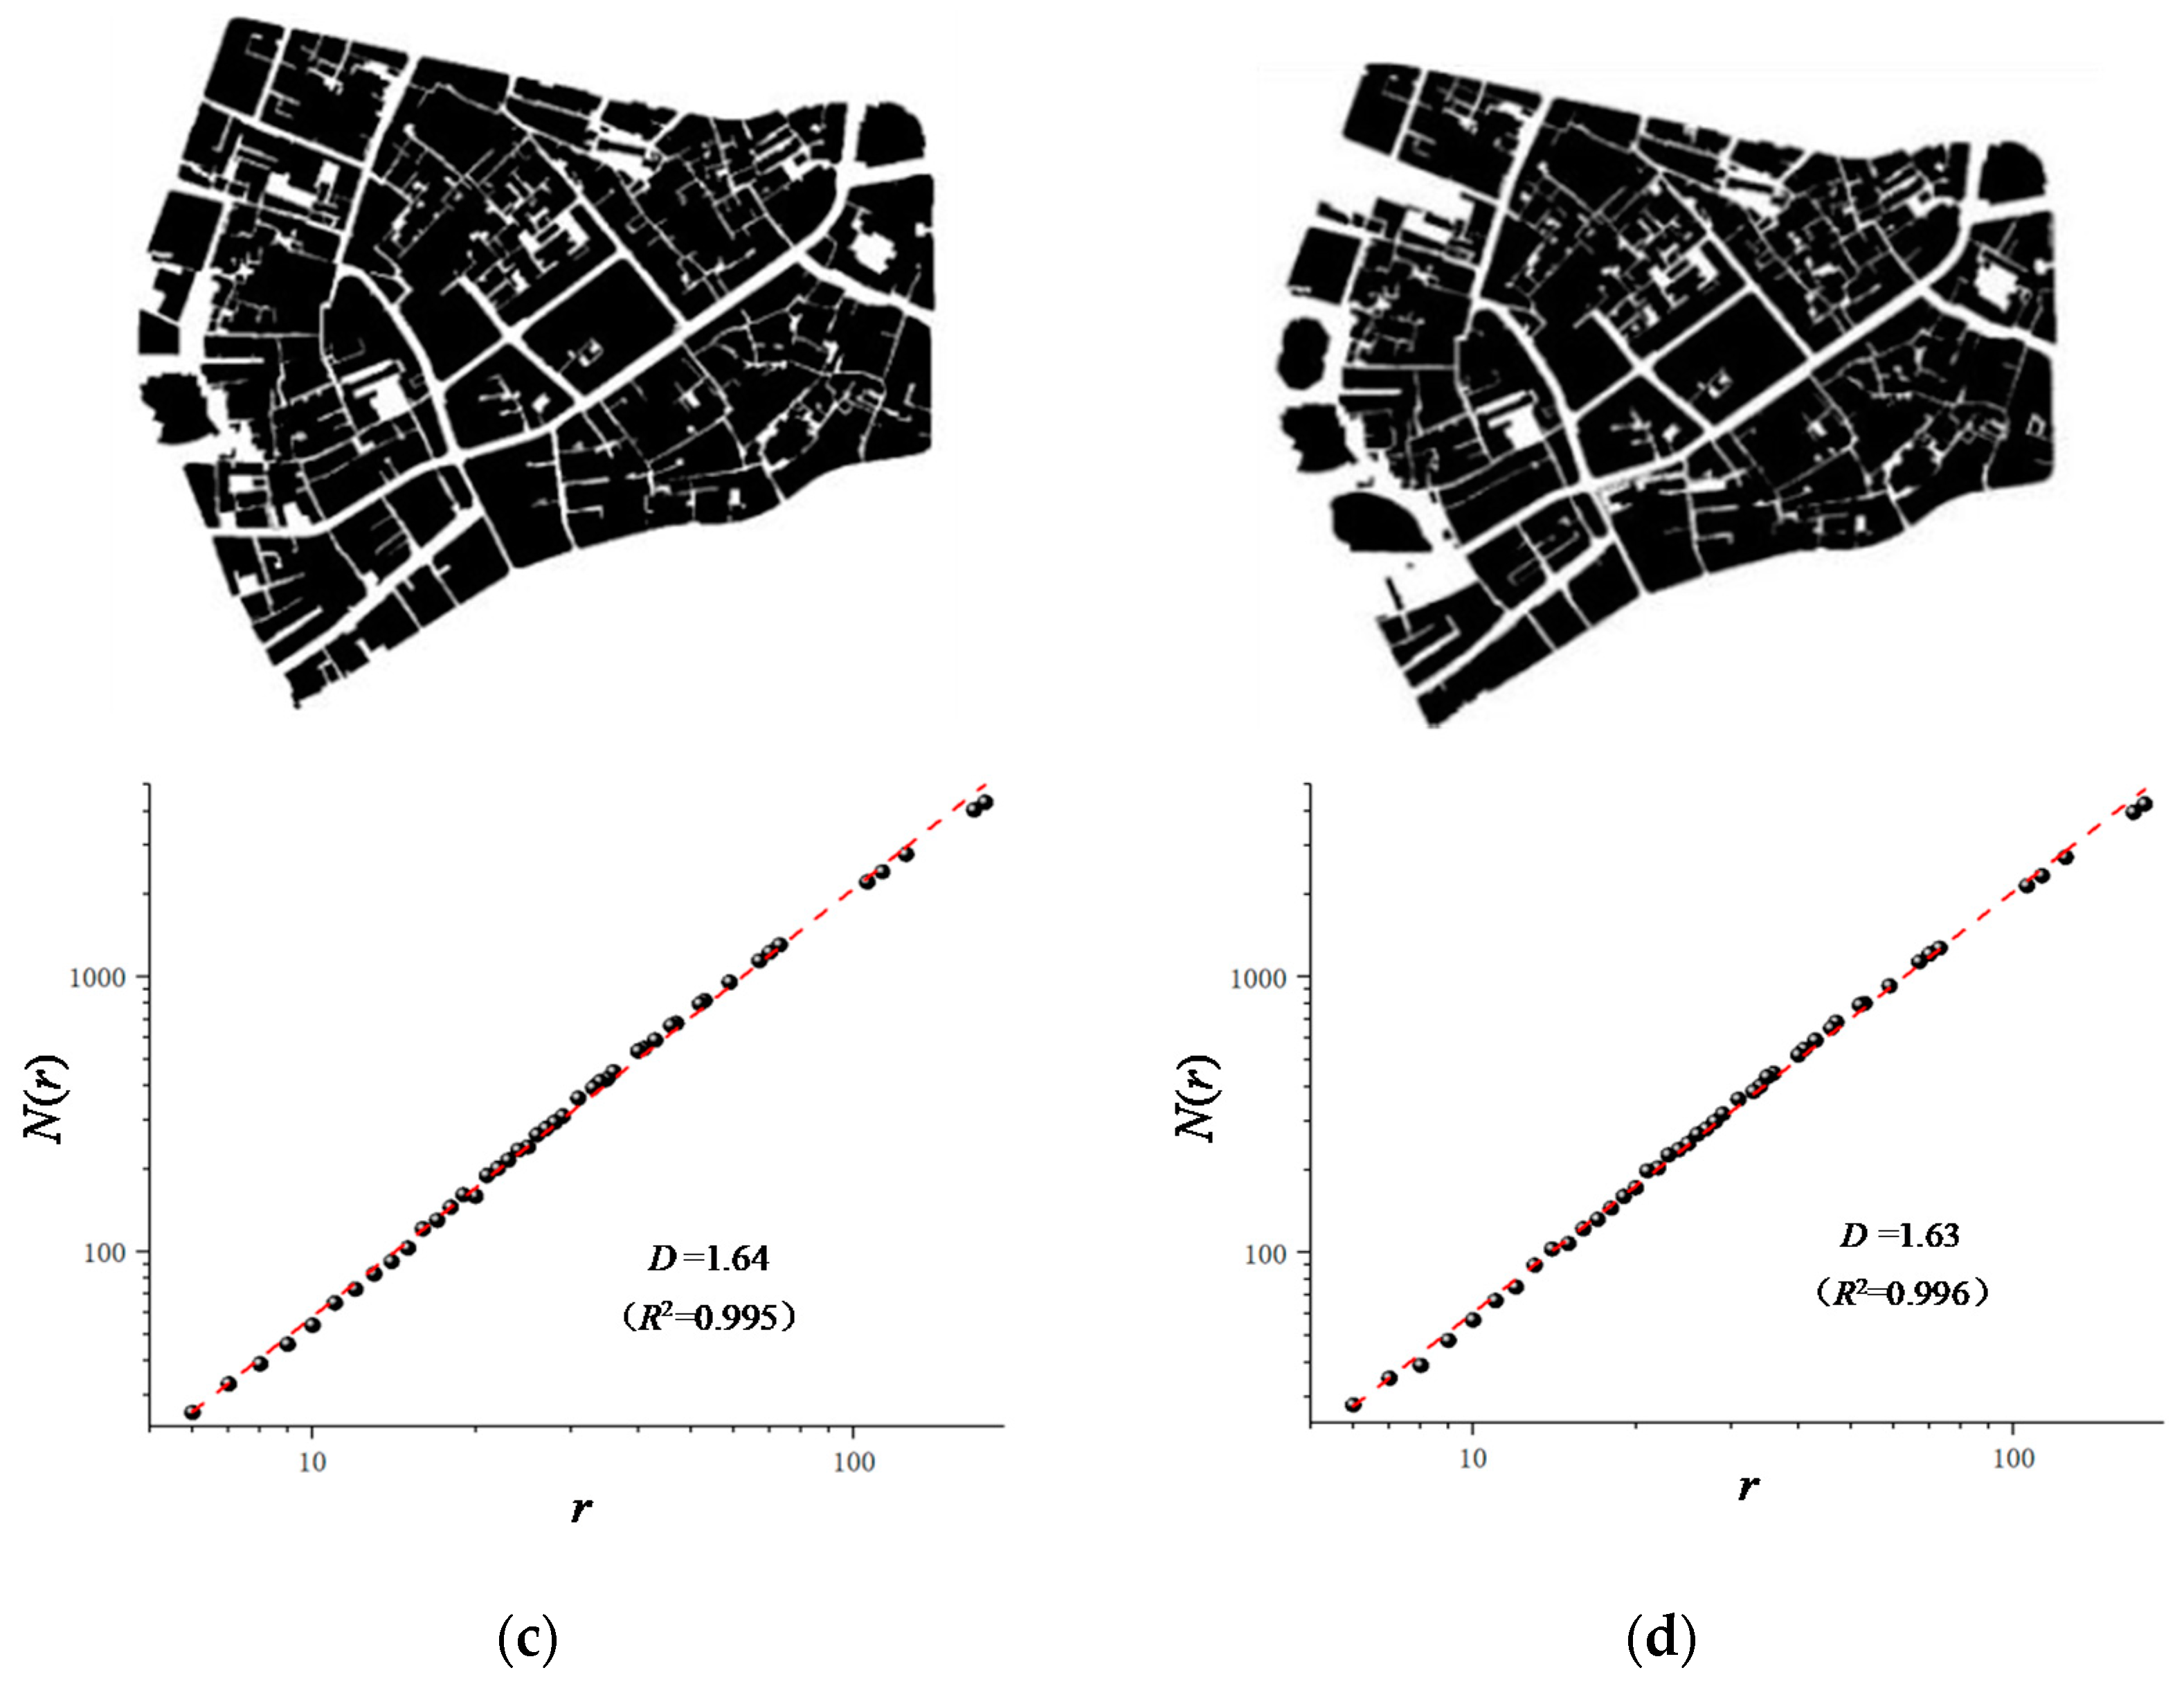
3.2. Fractal Characteristics of the Coastal Settlement Land Use

Figure 3a,b shows the complex land-use maps and the corresponding fractal dimensions of Zengcuoan settlement in 2000 and 2018, respectively. The double logarithm (log r, log N) is obtained. Linear correlations between log 1/r and log N are significant (R2 > 0.9). The fractal dimensions in 2000 and 2018 can be calculated as 1.61 and 1.85, respectively, indicating the fractal characteristic of Zengcuoan settlement. Zengcuoan settlement in 2000 shows the gradient land-use pattern. However, a higher fractal dimension in 2018 presents denser land use, suggesting that a large number of lands had been occupied or recreated. Clearly, the fractal dimension effectively describes the land-use complexity of Zengcuoan settlement.
Figure 3c,d shows the land-use maps and the corresponding fractal dimensions of Yingping settlement in 2000 and 2017, respectively. Yingping settlement also has a complex spatial pattern. Land uses in 2000 and 2017 have no significant change. Significant linear correlations between log 1/r and log N were found (R2 > 0.9). The fractal dimensions in 2000 and 2017 was calculated as 1.64 and 1.63, respectively, revealing the fractal characteristic of Yingping settlement.
The coastal settlements show irregular spatial patterns. The lengths and areas of the coastal settlements are related to the scale r of the maps. The accurate calculations of the lengths and areas of fractal geometry are associated with self-similarity and may be difficult. However, the calculated fractal dimensions of the coastal settlements are constant and independent of scale. Thus, the fractal dimension might represent a valuable tool to quantify the spatial complexity for urban geography study.
As shown in Figure 3, the coastal settlements in different locations may have different land-use complexity, leading to their different fractal dimensions. The land-use trend from a scattered pattern to a higher degree of filling pattern can be found in Zengcuoan settlement. Due to the expansion of Xiamen University and its surrounding areas, Zengcuoan settlement was filled with a large number of residential buildings and increased land uses. It results in a rapid increase of the fractal dimension in Zengcuoan settlement, that is, from 1.61 in 2000 to 1.76 in 2018. However, the land-use maps of Yingping settlement in 2000 and 2017 have no significant change. It may be related with the local government’s monitoring of land regulations. During the spatial expansion of the surrounding Lujiang Road, the land-use change of the overall settlement, except in the leftmost area, is not significant, thus the fractal dimension remains unchanged in Yingping settlement.
Furthermore, the coastal settlements show self-similarity in spatial form. The irregular spatial patterns at larger scaling regions can also be observed at smaller scaling regions as shown in Figure 1 and Figure 3. Such a self-similarity causes the fractal dimensions of the coastal settlements to distribute within certain scaling regions. Land use leads to multi-scale spatial organization [3,6,8,9,29]. If the fractal dimension can be calculated in the small-scale scaling region (r < 80), then the settlement has the self-similarity of an individual building. If the fractal dimension lies in the mesoscale scaling region (80 < r < 400), then the settlement has the self-similarity of street blocks or building groups. In Figure 3, the fractal dimensions of Zengcuoan settlement are distributed in both small-scale and mesoscale regions, indicating the fractal characteristics of individual buildings as well as building groups. However, the fractal dimensions of Yingping settlement are mainly distributed in the small-scale regions, indicating the fractal characteristics of individual buildings. It is related to the demolition of mesoscale building groups in Yingping settlement in the last twenty years. Therefore, compared with Zengcuoan settlement, Yingping settlement has a lower fractal dimension and lacks mesoscale data. It may need an improved plan for land-use optimization. For example, further spatial development is needed for the mesoscale building groups in Yingping settlement. In the renewal of coastal settlement spaces, urban land-use planning designers should not only pay attention to the complexity of individual buildings but also pay attention to the self-similarity of building groups [15]. Collaborative land-use planning at multiple spatial scales could avoid the one-sided development of settlement land use at a single scale. In the rapid development of cities, using the fractal dimension as a quantitative parameter would contribute to the multi-scale land use of coastal settlements and promote their sustainable development.
Finally, the fractal dimension of coastal settlements in this study is less than two, while the dimension values of the street blocks of Gaopu, Zengcuoan, and Yingping settlements are shown to approach two. This reveals that fractal settlements may not occupy the whole two-dimensional space, which is similar to fractal cities [3,4,5,6,7,8,9,10]. Shen et al. reported that the fractal dimension range of 20 large U.S. cities along with their surrounding urbanized areas is 1 < D < 2 [9]. Chen calculated the fractal dimension of Chinese cities and British cities and suggested that their value might come between 1.5 and 2 [6]. Zhao et al. obtained the averaged fractal dimension of the build-up land in urban areas, which was higher than that in rural areas in Shanghai [30]. Clearly, just like cities and urban systems, coastal settlement spaces with a fractal dimension greater than 1.9 are quite rare. As a coastal community, Gaopu settlement includes both coastlines and lands. However, Yingping and Zengcuoan settlements have no coastlines due to high urbanization, as well as land reclamation from the sea. Coastlines may have fractal characteristics [12,13]. Therefore, the comparison of fractal characteristics between settlement coastline and lands is worthy of further study.

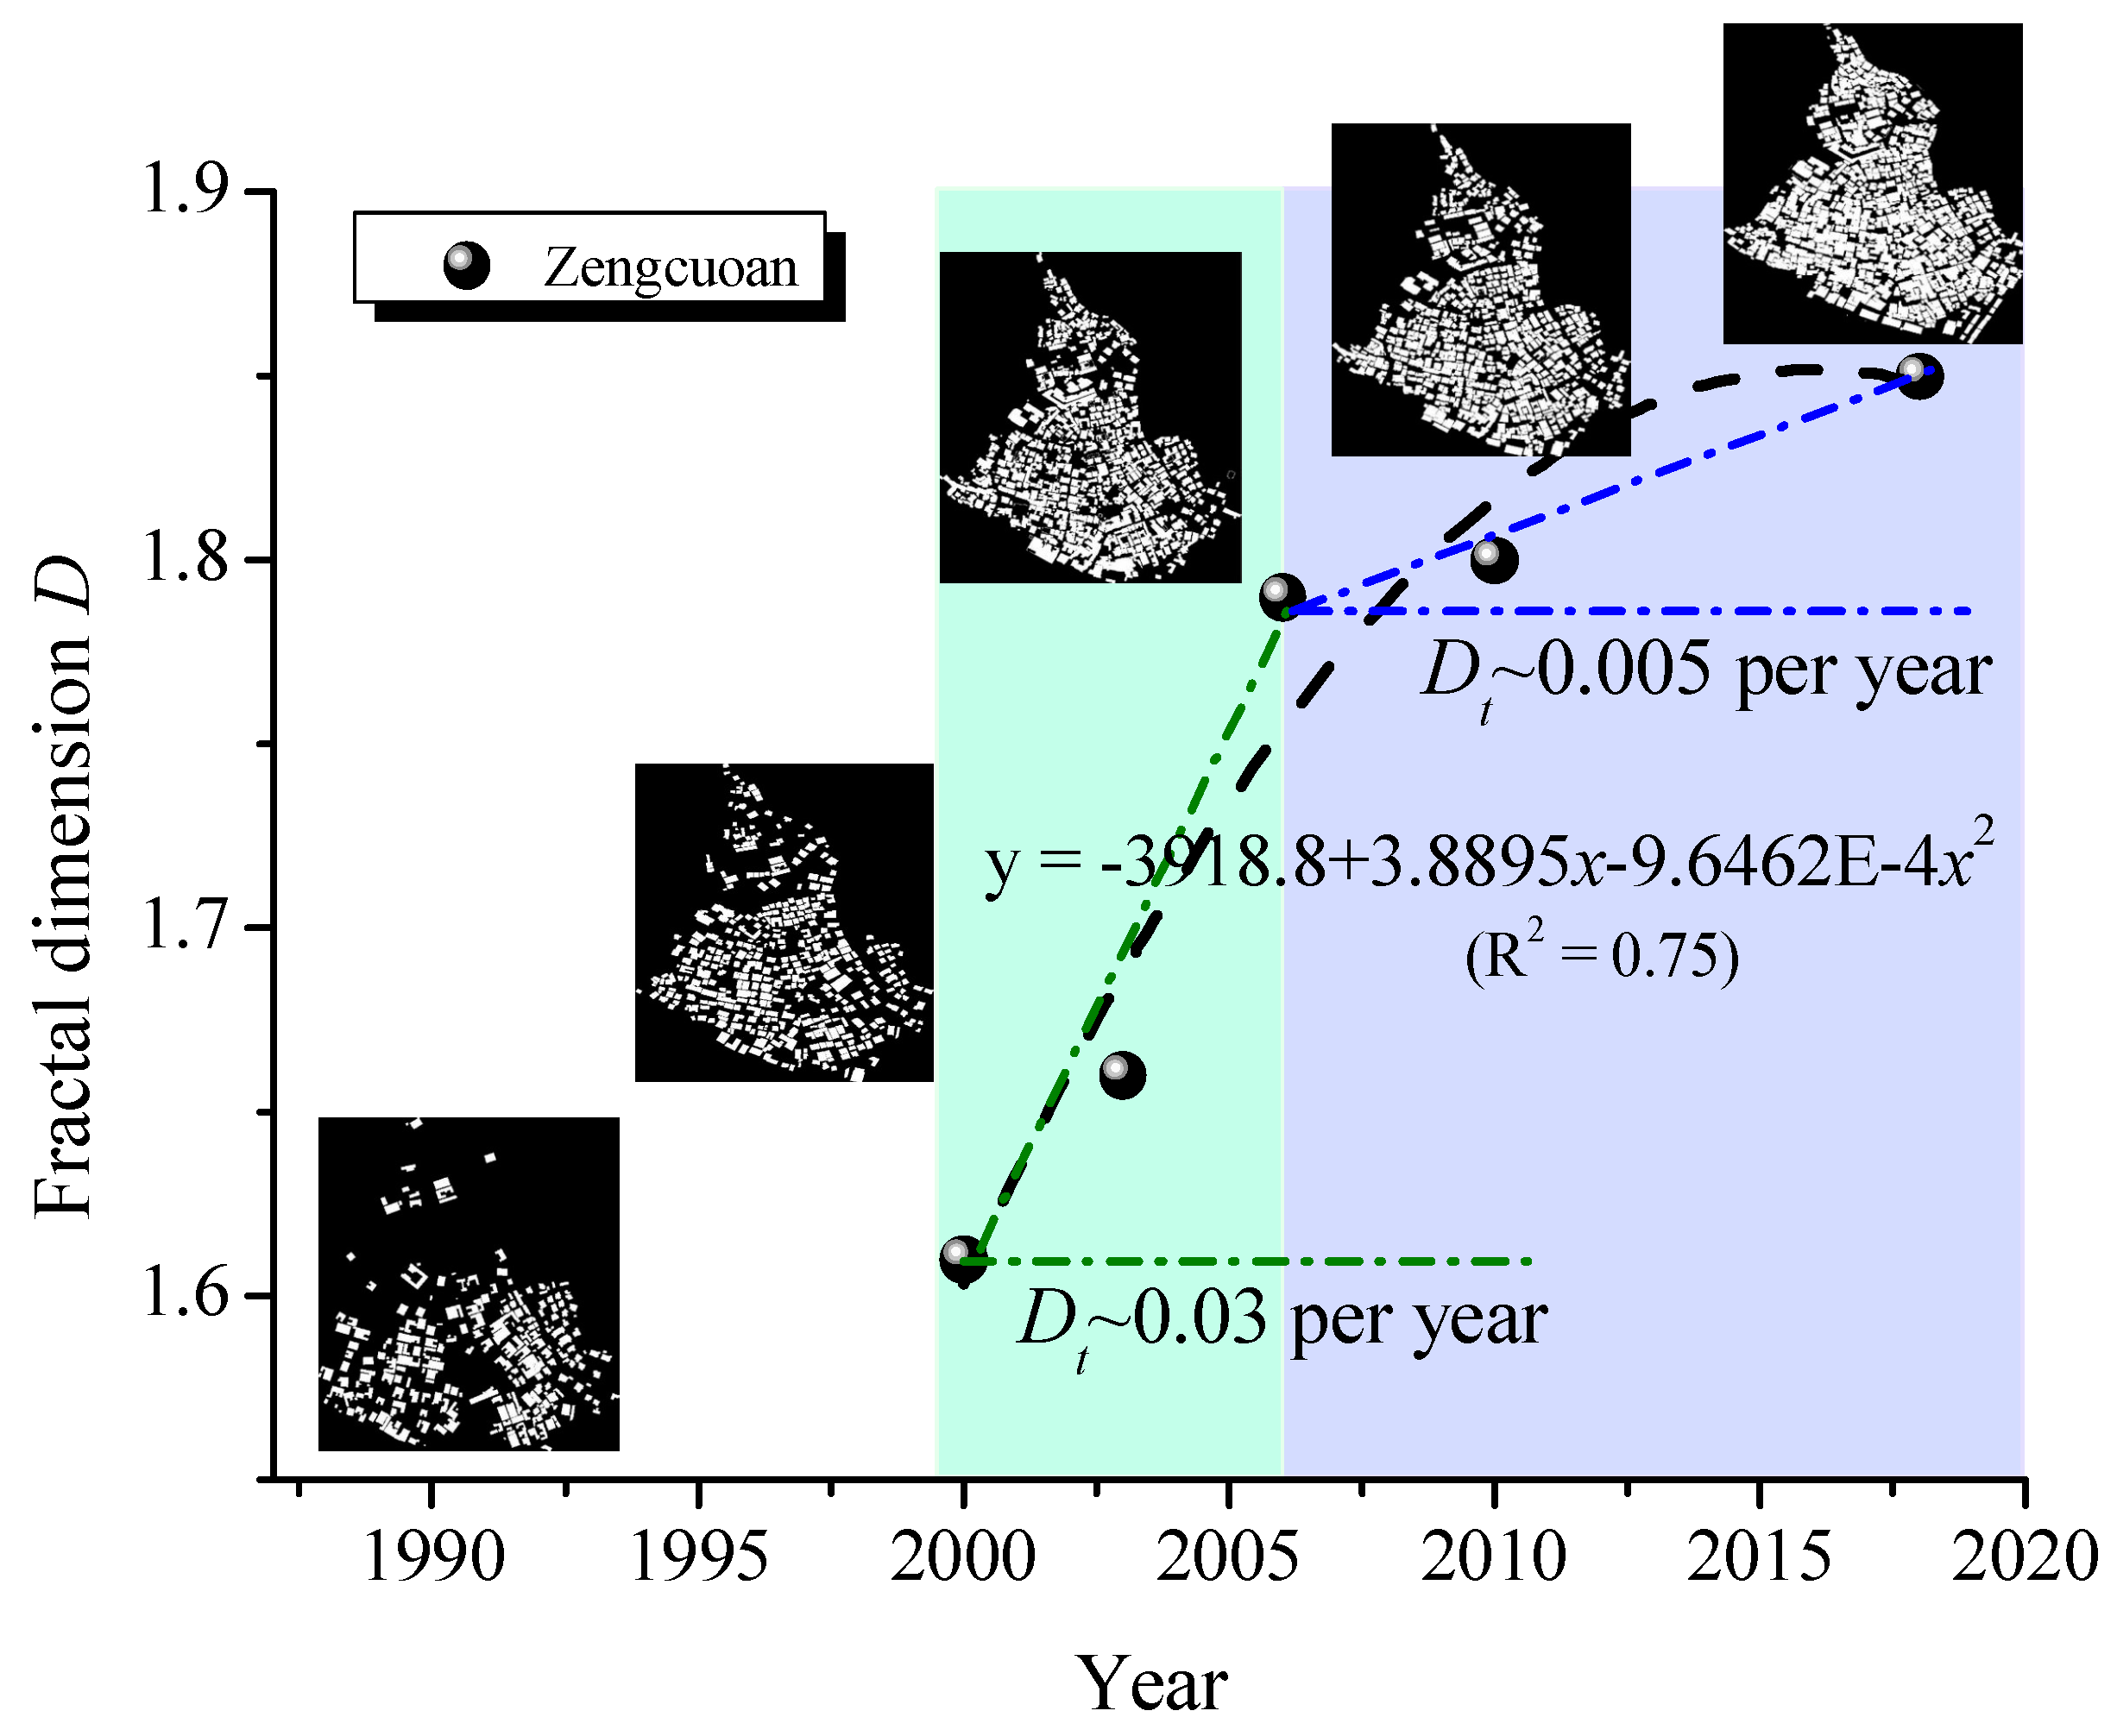
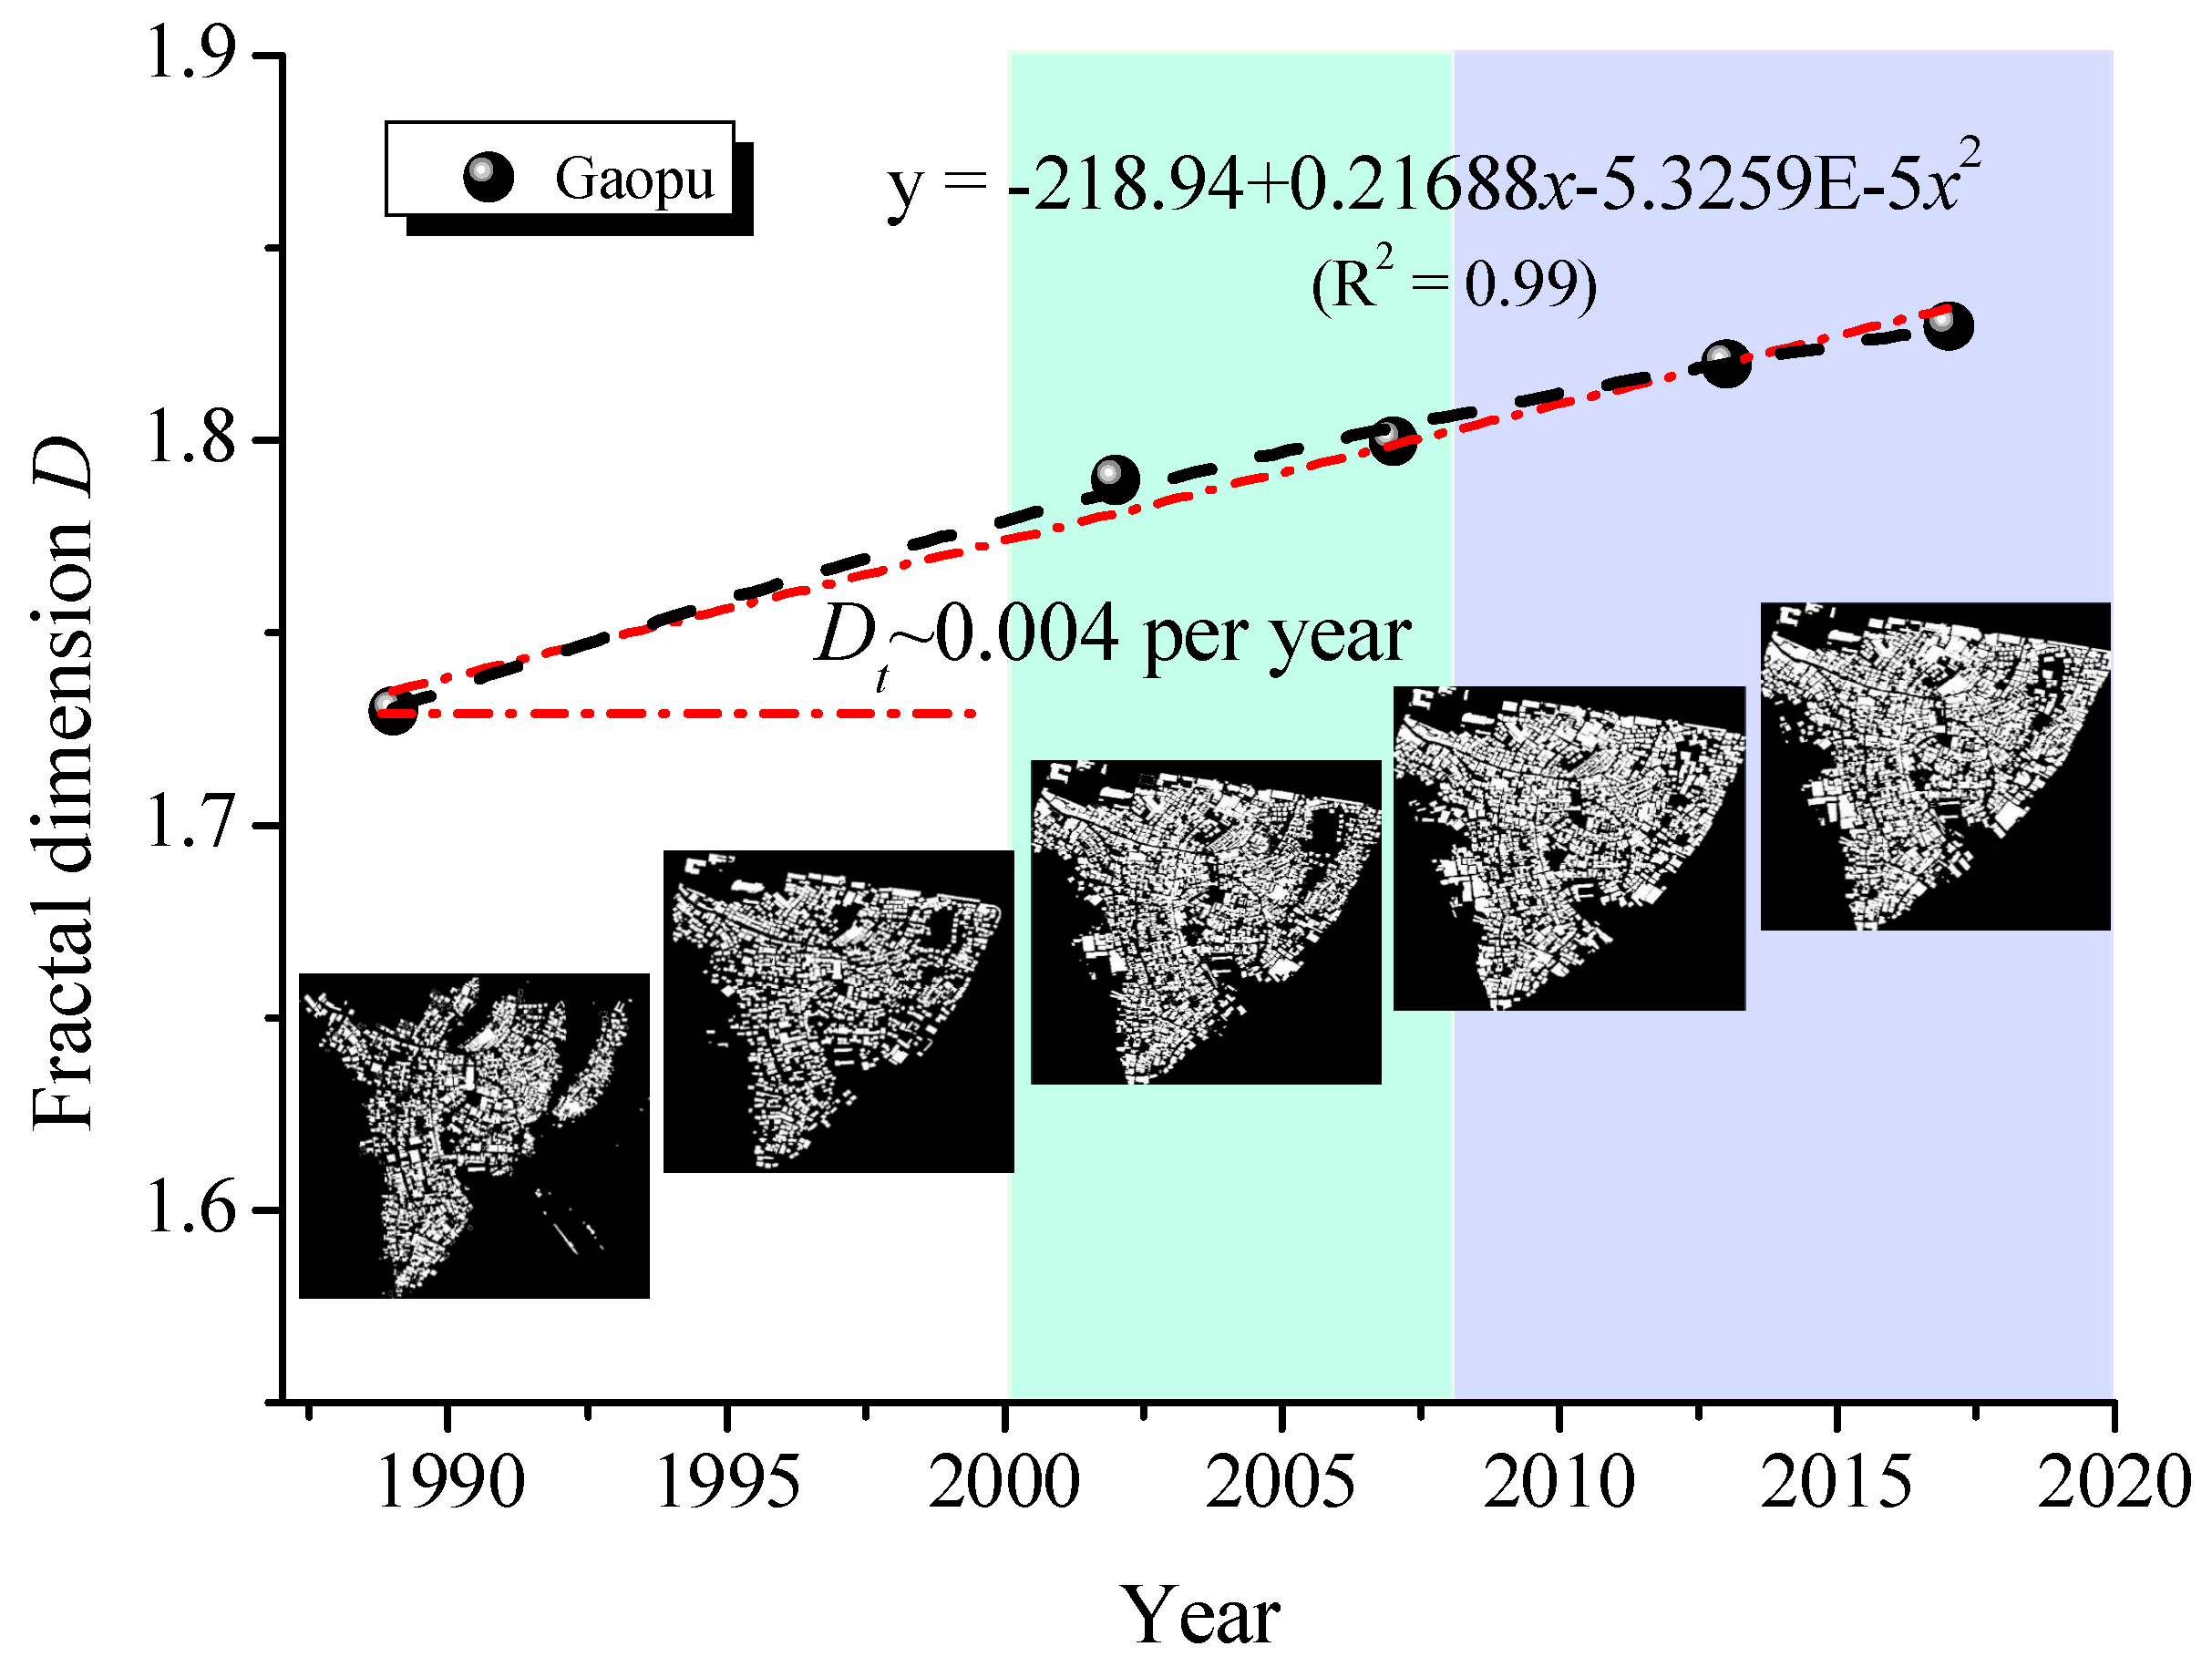
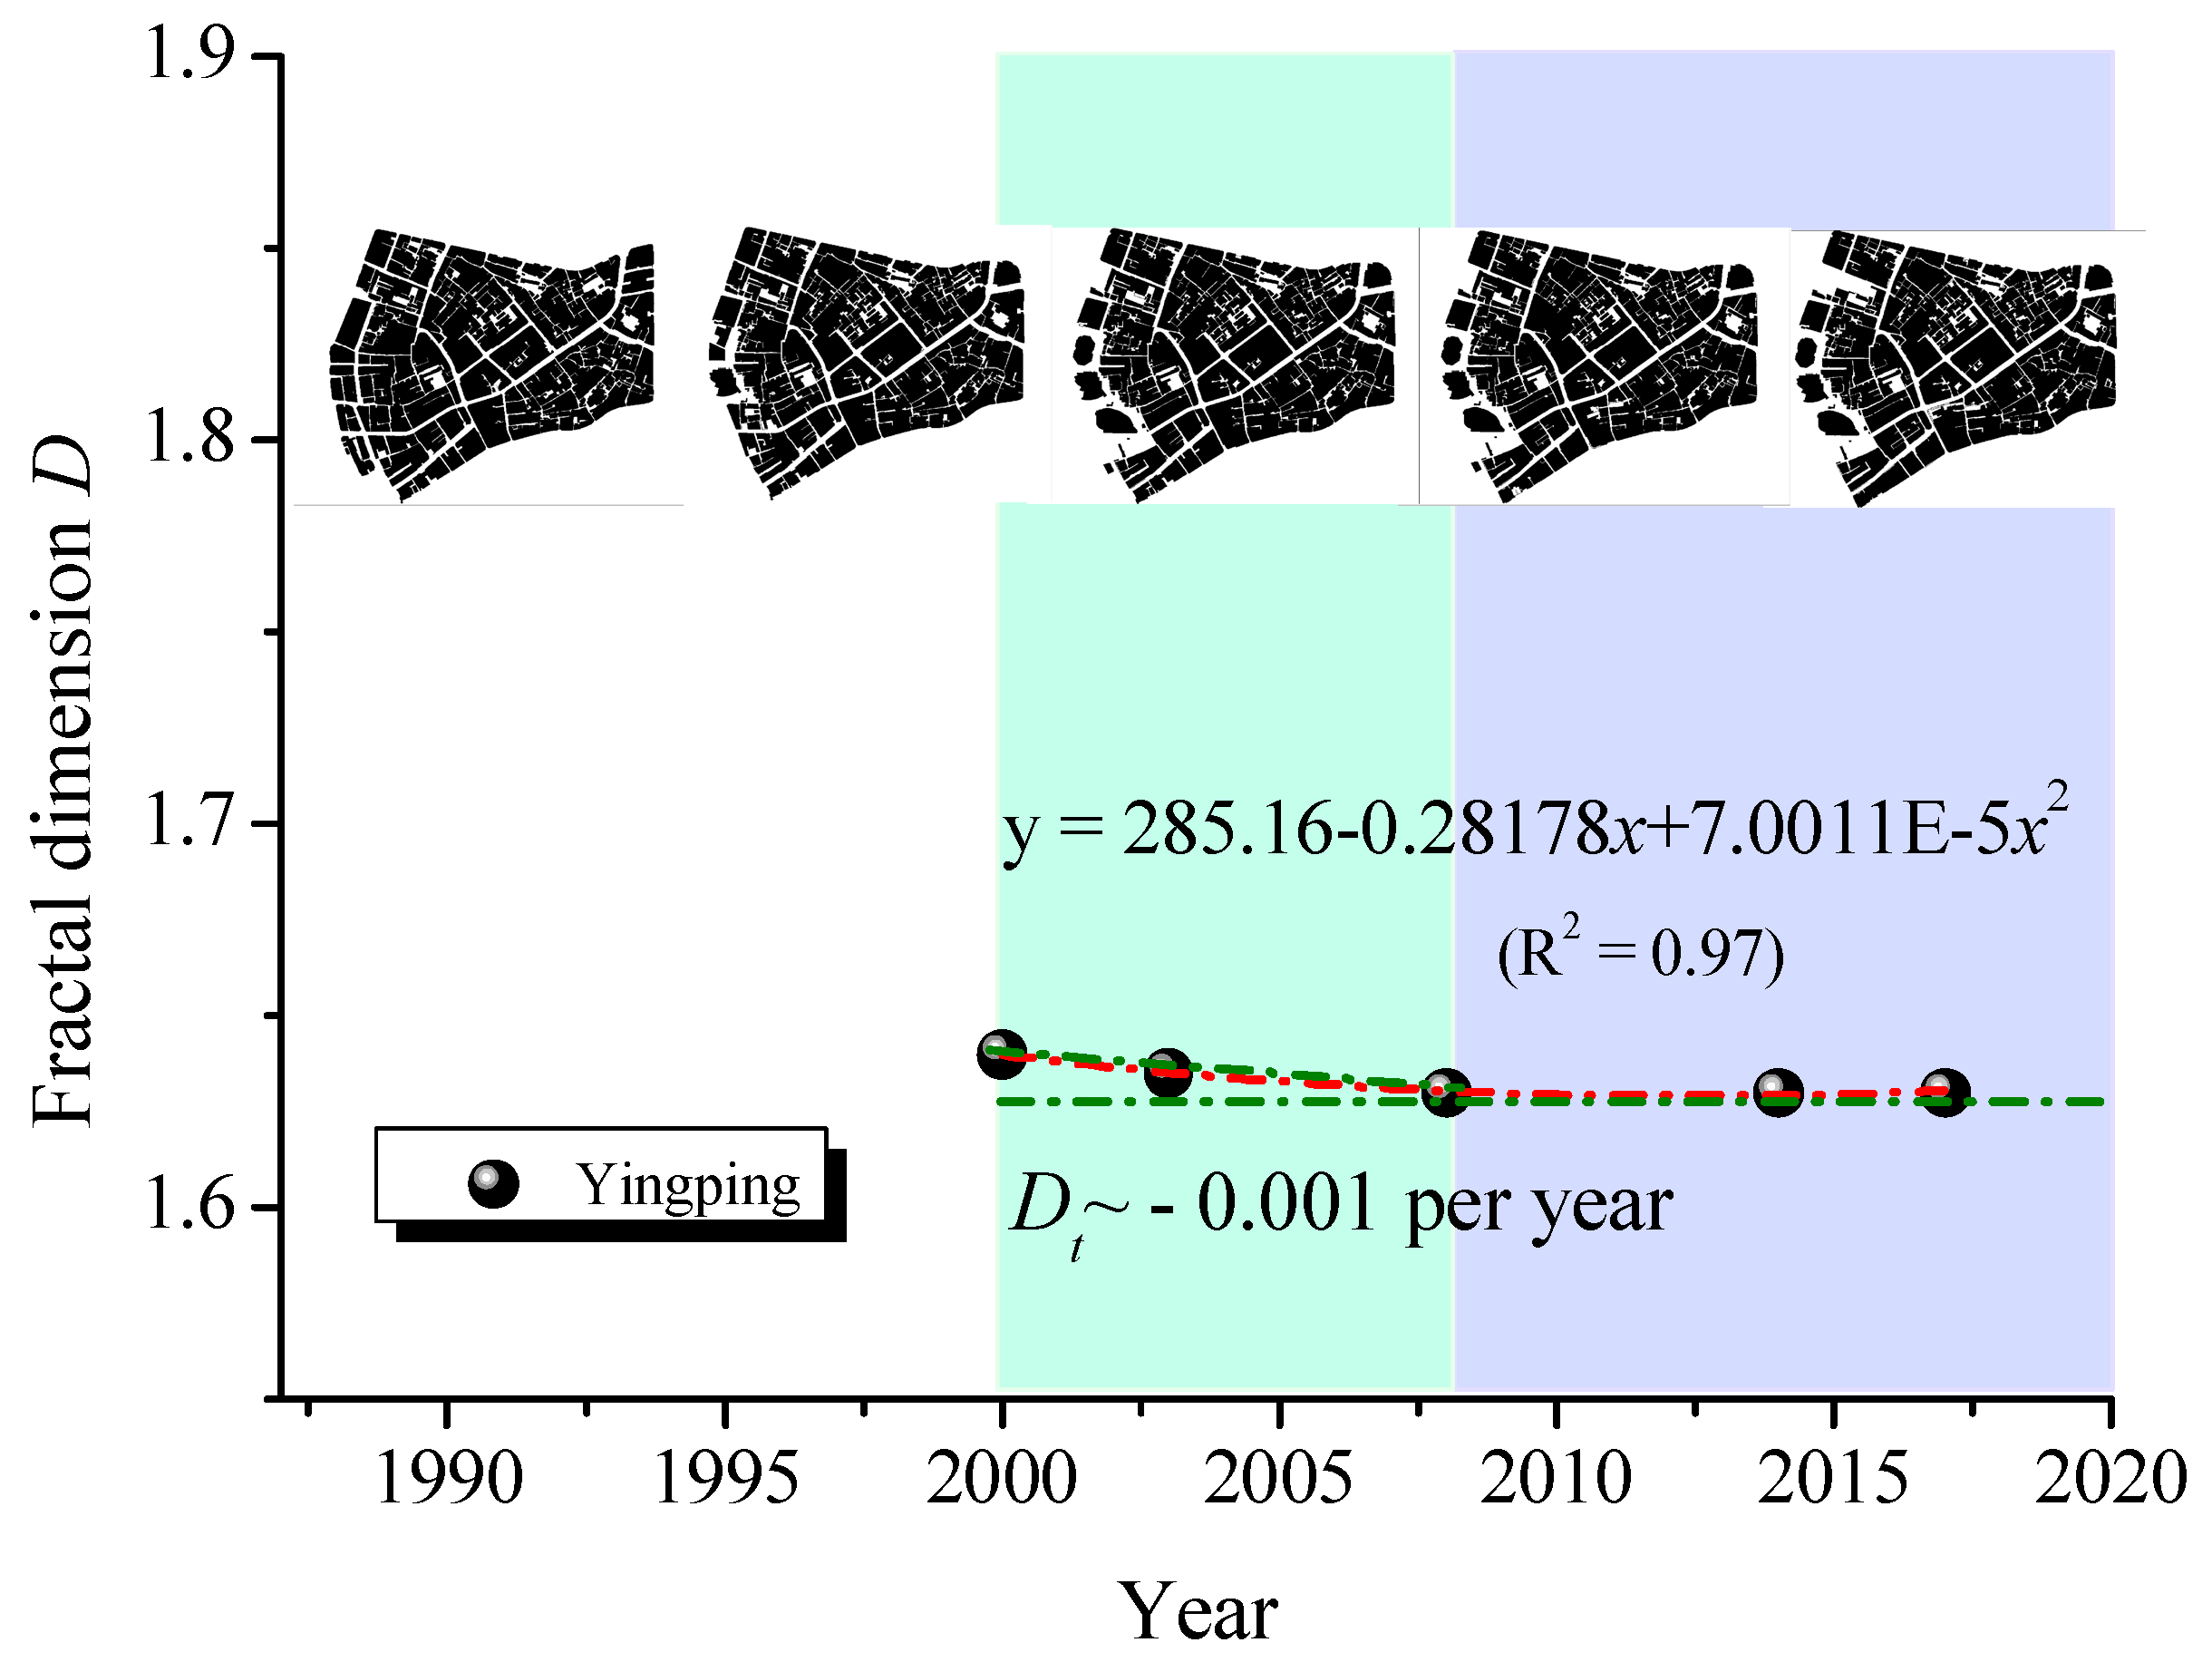
3.3. Fractal Evolution of the Settlement Land Use

Figure 4, Figure 5 and Figure 6 show the time evolution of fractal dimensions of Zengcuoan settlement, Gaopu settlement, and Yingping settlement, respectively. Nonlinear modeling reveals that the fractal dimensions of the settlement land use have the following nonlinear functional relationship with time,
Zengcuo settlement:
D = 3918.8 + 3 . 8895 × Year 9.6462 × 10 4 × Year 2   ( R 2 = 0.75 )
Yingping settlement:
D = 285.16 0 . 28178 × Year + 7.0011 × 10 5 × Year 2   ( R 2 = 0.97 )
and Gaopu settlement:
D = 218.94 + 0 . 21688 × Year 5.3259 × 10 5 × Year 2   ( R 2 = 0.99 )
Clearly, the fractal dimensions of these three coastal settlements show a diversified nonlinear evolution trend. Zengcuoan settlement rapidly increases and then slows down; Gaopu settlement increases with time; however, Yingping settlement slowly decreases and then remains unchanged. The nonlinear evolution of fractal dimensions of these coastal settlements is related to their different land use.
Zengcuoan settlements have undergone dramatic urbanization from 2000 to 2010. Many lands were requisitioned; the settlement boundary was excessively expanding, and a large number of buildings were constructed, as shown in Figure 3. It results in a rapid increase of fractal dimension at the high annual growth rate of 0.03 (Figure 4). This growth rate is even much higher than that in urban areas in Shanghai, indicating the excessive land use in this settlement. According to this annual growth rate, the fractal dimension of Zengcuoan settlement would reach D = 2 in 2013, so that the settlement land use would approach saturation and its development space was very limited. In order to overcome this, Zengcuoan settlement improved public facilities, optimized land use, and restricted spatial exploration after 2010. The improvement of the settlement landscape reduced the annual growth rate of fractal dimension to 0.005. This growth rate predicts that the fractal dimension of Zengcuoan settlement would approach 2 in the middle of this century. Therefore, according to the evolution law, Zengcuoan settlement should further control land use to reduce the growth rate of fractal dimension in order to achieve sustainable development.
The fractal dimension of Gaopu settlement is high and grows more slowly over time than Zengcuoan settlement. Over the last 30 years, its fractal dimension increased at an annual growth rate of 0.004. Gaopu settlement was occupied by overcrowded buildings. The fractal structure at all levels was gradually destroyed. The coastline was over-explored. As shown in Figure 5, its annual growth rate of 0.004 predicts that the fractal dimension of Gaopu settlement would also approach 2 in the middle of this century. Gaopu settlement has a profound cultural heritage and distinctive regional advantage. Its sustainable development requires the further reduction of the growth rate of the fractal dimension, and thus the protection of spatial diversity and complexity is imminent.
Compared with Zengcuoan and Gaopu settlements, the fractal dimension of Yingping settlement is much smaller (Figure 6). From 2000 to 2008, the fractal dimension of Yingping settlement decreased by about 0.001 per year. It is related to the fact that Yingping settlement paid great attention to land-use protection. Such a tendency for decreases can also be found in some settlements in Xiamen, such as Xiagan settlement. The downward tendency of fractal dimension has been found in rural areas in Shanghai [30]. It indicated that Xiamen city effectively enhanced land-use protection. After 2008, a certain development trend in Yingping settlement was strengthened. Some buildings were demolished. As shown in Figure 3, the transformation had little impact on Yingping settlement, resulting in the basically unchanged fractal dimension. According to the growth rates of Zengcuoan and Gaopu settlements, it is predicted that the fractal dimension of Yingping settlement would approach two by the end of this century. Yingping settlement is located in the prosperous commercial center of Xiamen, with the characteristics of a traditional coastal market culture. Efficient land use has huge commercial value. Therefore, fractal dimension analysis shows that Yingping settlement should further improve land use, reduce regulation constraints, and promote the rapid development of its marine economy.
Furthermore, the coastal settlements are dynamically fractal. Firstly, the spatial forms and boundaries of the settlements reflect the complexity, which is similar to fractal coastlines (such as Britain, Norway, etc.) [12,13,15]. Their spatial forms and boundaries are often changed to meet the transient demands of land-use expansion, population increase, and public construction. It may lead to the time evolution of fractal features of coastal settlements. The settlement land use consists of thousands of individual buildings. Settlements include smaller neighborhood groups, ancestral halls, etc. Ancestral halls usually are the spaces for a neighborhood gathering, communication, and entertainment and also provide multi-level activity places for community residents. The land use in these settlements show complex spatial forms, including herringbone form in historic fishing villages, ancient houses in Southern Fujian, disordered temporary residential areas, and modern city road networks [15,16]. The land-use self-similarity of coastal settlements is an important characteristic of the fractal. The fractal dimensions in Figure 1 and Figure 3 reveal the fractal characteristics of the coastal settlements and provides a quantitative parameter for land-use complexity analysis. In addition, fractal settlements have the dynamic characteristic of time evolution. From 2000 to 2010, the fractal dimension change of urban forms in Ulaanbaatar might have slightly increased [4]. In comparison with Ulaanbaatar, the fractal dimension change of Zengcuo settlement is much larger, indicating its excessive land-use expansion over 10 years. Throughout the development process of coastal settlements, rapid urbanization has brought more changes to the settlement land use. The traditional local style, architecture, and pattern are disappearing. Under the influence of policies, the complex land uses of the settlements are changing. There are complex economic and social effects impacting on the development of coastal settlements [1,2,4]. Driven by the maximization of economic benefits, settlement land uses are gradually compressed. These factors are superimposed in time and space to form fractal settlements.
Finally, this study selects the typical data of Xiamen coastal settlements over the period from 2000 to 2018. Presently, more than 50% of the world’s population lives in urban areas [31]. With the rapid development of the coastal zone, the settlement space in an urban area may be eroded by commercial development. Therefore, quantifying the land use of urban settlements becomes important for sustainable development. The results in this study may have important reference value for understanding the settlement complexity of other coastal cities. Future studies should include a larger time span and more settlement data for exploring fractal characteristics and monitoring the evolution of urban settlement land use.

4. Conclusions

In this paper, we investigated the fractal evolution of coastal settlements based on the fractal theory. The fractal dimensions of the land use of three coastal settlements in Xiamen city, China, including Zengcuoan settlement, Yingping settlement, and Gaopu settlement, were obtained to quantify their spatial complexity. The results indicated the fractal characteristics of the coastal settlements. The fractal dimension of Zengcuoan settlement increased from 1.61 in 2000 to 1.76 in 2018. Zengcuoan settlement was filled with a larger number of residential buildings and had an increase in land use. However, the land-use patterns and the corresponding fractal dimension of Yingping settlement in 2000 and 2017 had no significant change. In addition, Yingping settlement had a lower fractal dimension and lacked mesoscale scaling data, suggesting its further development of the mesoscale land use. Therefore, in the renewal of coastal settlement spaces, fractal dimension could be used as a quantitative parameter for multi-scale land use. Furthermore, the coastal settlements showed different nonlinear evolution equations of the fractal dimensions due to different land uses. Zengcuoan settlement rapidly increased and then slowed down, and Gaopu settlement increased with years. However, Yingping settlement slowly decreased and then remained unchanged. Evolution laws predicted that the fractal dimensions of Zengcuoan and Gaopu settlements would approach two in the middle of this century. Thus the land uses of these two settlements should reduce the annual growth rate of fractal dimension in order to achieve sustainable development. Yingping settlement had a much lower fractal dimension, which suggests its huge potential in improving land use. This study might provide a theoretical basis for the fractal evolution of coastal urban settlements and develop a valuable quantitative method for their spatial optimization and sustainable development.

Author Contributions

X.Y. and Z.Z. conceived the project. X.Y. performed the data analysis. X.Y. contributed to the writing of the manuscript. All authors commented on the manuscript. All authors have read and agreed to the published version of the manuscript.

Funding

This work was supported in part by the Natural Science Foundation of Fujian Province of China (Grant No. 2020J01808), the National Natural Science Foundation of China (Grants No. 5178205), the University-Industry Cooperation Project in Fujian Province (Grant No. 2018Y4012), and the Special Fund for Marine and Fishery Development of Xiamen (Grant No. 20CZB015HJ01).

Data Availability Statement

This research received data from the local government and the data are confidential.

Acknowledgments

The authors would like to thank Xiamen geographic information center for providing the digitized research data.

Conflicts of Interest

The authors declare no conflict of interest.

References

  1. Eger, S.L.; Courtenay, S.C. Integrated coastal and marine management: Insights from lived experiences in the Bay of Fundy, Atlantic Canada. Ocean. Coast. Manag. 2021, 204, 105457. [Google Scholar] [CrossRef]
  2. Li, R.; Dong, L.; Zhang, J.; Wang, X.; Wang, W.X.; Di, Z.; Stanley, H.E. Simple spatial scaling rules behind complex cities. Nat. Commun. 2017, 8, 1841. [Google Scholar] [CrossRef] [Green Version]
  3. Batty, M.; Longley, P.A. The fractal simulation of urban structure. Environ. Plan. A Econ. Space 1986, 18, 1143–1179. [Google Scholar] [CrossRef]
  4. Purevtseren, M.; Tsegmid, B.; Indra, M.; Sugar, M. The fractal geometry of urban land use: The case of Ulaanbaatar city, Mongolia. Land 2018, 7, 67. [Google Scholar] [CrossRef] [Green Version]
  5. Pérez-Campuzano, E.; Guzmán-Vargas, L.; Angulo-Brown, F. Distributions of city sizes in Mexico during the 20th century. Chaos Soliton Fractals 2015, 73, 64–70. [Google Scholar] [CrossRef]
  6. Chen, Y. A set of formulae on fractal dimension relations and its application to urban form. Chaos Soliton Fractals 2013, 54, 150–158. [Google Scholar] [CrossRef] [Green Version]
  7. Chen, Y. An allometric scaling relation based on logistic growth of cities. Chaos Soliton Fractals 2014, 65, 65–77. [Google Scholar] [CrossRef] [Green Version]
  8. Frankhauser, P. The fractal approach, a new tool for the spatial analysis of urban agglomerations. Popul. Engl. Sel. 1998, 10, 205–240. [Google Scholar]
  9. Shen, G. Fractal dimension and fractal growth of urbanized areas. Int. J. Geogr. Inf. Sci. 2002, 16, 437–519. [Google Scholar] [CrossRef]
  10. Encarnação, S.; Gaudiano, M.; Santos, F.C.; Tenedório, J.A.; Pacheco, J.M. Fractal cartography of urban areas. Sci. Rep. 2012, 2, 1–5. [Google Scholar] [CrossRef] [Green Version]
  11. Alam, M. Double exposure and fractal city: Cultural disengagement and disembodied belonging due to outdoor thermal changes. J. Reg. City Plan. 2018, 29, 67–82. [Google Scholar] [CrossRef] [Green Version]
  12. Mandelbrot, B. The Fractal Geometry of Nature; Freeman: San Francisco, CA, USA, 1983. [Google Scholar]
  13. Yu, X.; Zhao, Z.; Li, Y.; Lin, S. Fractal study on evolution of community spatial form: A case study on Gaopu community of Xiamen. J. Appl. Oceanogr. 2019, 38, 540–548. [Google Scholar]
  14. Roy, A. Urban informality: Toward and epistemology of planning. J. Am. Plan. Assoc. 2005, 71, 147–158. [Google Scholar] [CrossRef]
  15. Liang, F.; Liu, S.; Liu, L. Spatial characteristics and evolution of rural settlement landscape based on fractal theory: A case study of Xiamen, China. Chin. J. Appl. Ecol. 2017, 28, 2640–2648. [Google Scholar]
  16. Lin, S.; Yu, X.; Li, Y.; Zhang, Y.; Zhao, Z. Fractal characteristics evolution of coastline of the Xiamen island. Adv. Mar. Sci. 2020, 38, 121–129. [Google Scholar]
  17. Jevric, M.; Romanovich, M. Fractal dimensions of urban border as a criterion for space management. Procedia Eng. 2016, 165, 1478–1482. [Google Scholar] [CrossRef]
  18. Matsuba, I.; Namatame, M. Scaling behavior in urban development process of Tokyo City and hierarchical dynamical structure. Chaos Soliton Fractals 2003, 16, 151–165. [Google Scholar] [CrossRef]
  19. Batty, M. New ways of looking at cities. Nature 1995, 377, 574. [Google Scholar] [CrossRef]
  20. Chen, Y. A new model of urban population density indicating latent fractal structure. Int. J. Urban Sustain. Dev. 2010, 1, 89–110. [Google Scholar] [CrossRef] [Green Version]
  21. Browna, C.T.; Witschey, W.R.T. The fractal geometry of ancient Maya settlement. J. Archaeol. Sci. 2003, 30, 1619–1632. [Google Scholar] [CrossRef]
  22. Jiang, S.; Liu, D. Box-counting dimension of fractal urban form: Stability issues and measurement. Des. Int. J. Artif. Life Res. 2012, 3, 41–63. [Google Scholar] [CrossRef]
  23. Hern, W.M. Urban malignancy: Similarity in the fractal dimensions of urban morphology and malignant neoplasms. Int. J. Anthropol. 2008, 23, 1–19. [Google Scholar] [CrossRef]
  24. Triantakonstantis, D.P. Urban growth prediction modelling using fractals and theory of chaos. Open J. Civ. Eng. 2012, 2, 81–86. [Google Scholar] [CrossRef] [Green Version]
  25. Oprisan, S.A. An application of the least-squares method to system parameters extraction from experimental data. Chaos 2002, 12, 27–32. [Google Scholar] [CrossRef]
  26. Thomas, I.; Frankhauser, P.; Biernacki, C. The Morphology of built-up landscapes in Wallonia (Belgium): A classification using fractal indices. Landsc. Urban Plan. 2008, 84, 99–115. [Google Scholar] [CrossRef]
  27. Yu, X.; Zhang, Y. Ray chaos in an architectural acoustic semi-stadium system. Chaos 2013, 23, 013107. [Google Scholar] [CrossRef] [PubMed]
  28. Zhang, Y.; Sprecher, A.J.; Zhao, Z.; Jiang, J.J. Nonlinear detection of disordered voice productions from short time series based on a Volterra-Wiener-Korenberg model. Chaos Soliton Fractals 2011, 44, 751–758. [Google Scholar] [CrossRef]
  29. Yu, X.; Zhao, Z. Quantitative space morphology of Xiamen port area maps based on space syntax analysis. In Proceedings of the IEEE International Conference on Signal Processing, Communications and Computing (ICSPCC), Xiamen, China, 22–25 October 2017; pp. 1–4. [Google Scholar]
  30. Zhao, C.; Li, Y.; Weng, M.A. Fractal approach to urban boundary delineation based on raster land use maps: A case of Shanghai, China. Land 2021, 10, 941. [Google Scholar] [CrossRef]
  31. United Nations. World Urbanization Prospects: The 2007 Revision; United Nations: New York, NY, USA, 2008. [Google Scholar]
Figure 1. (a) Sierpinski triangle evolves with with the iteration number n and the corresponding fractal dimension calculation; (b) roads and land-use map of Gaopu settlement; (c) the corresponding fractal dimensions of the street blocks and land use of Gaopu settlement.
Land 11 00050 g001
Figure 2. (a) Location of three coastal settlements in Xiamen City, China; (b) roads of Zengcuoan settlement.
Land 11 00050 g002
Figure 3. Land-use maps of Zengcuoan settlement and the corresponding fractal dimensions in (a) 2000 and (b) 2018, and the land-use maps of Yingping settlement and the corresponding fractal dimensions in (c) 2000 and (d) 2017.
Land 11 00050 g003aLand 11 00050 g003b
Figure 4. Time evolution of the fractal dimension of Zengcuoan settlement.
Land 11 00050 g004
Figure 5. Time evolution of the fractal dimension of Gaopu settlement.
Land 11 00050 g005
Figure 6. Time evolution of the fractal dimension of Yingping settlement.
Land 11 00050 g006
Publisher’s Note: MDPI stays neutral with regard to jurisdictional claims in published maps and institutional affiliations.

