Article

Drivers of Long-Term Land-Use Pressure in the Merguellil Wadi, Tunisia, Using DPSIR Approach and Remote Sensing

1
National Research Institute for Rural Engineering, Water and Forestry, BP 10, Ariana 2080, Tunisia
2
National Engineering School of Tunis (ENIT), University of Tunis El Manar, BP 37, Tunis 1002, Tunisia
3
Institute of Arid Regions (IRA) of Medenine, Medenine 4119, Tunisia
4
Division of Water Resources Engineering, Centre for Advanced Middle Eastern Studies, Lund University, P.O. Box 118, 22100 Lund, Sweden
5
National Centre for Cartography and Remote Sensing (CNCT), BP 200, Marsa 2045, Tunisia
*
Author to whom correspondence should be addressed.
Land 2022, 11(1), 138; https://doi.org/10.3390/land11010138
Submission received: 14 December 2021 / Revised: 7 January 2022 / Accepted: 14 January 2022 / Published: 16 January 2022

Abstract

:
Increasing land use pressure is a primary force for degradation of agricultural areas. The drivers for these pressures are initiated by a series of interconnected processes. This study presents a novel methodology to analyze drivers of changing land use pressure and the effects on society and landscape. The focus was on characterizing these drivers and relate them to land use statistics obtained from geospatial data from the important semiarid Merguellil Wadi between 1976 and 2016. Cause-and-effect relationships between different drivers of land use change were analyzed using the DPSIR approach. Results show that during the 40-year period cultivated land increased and wetland areas decreased substantially. Drivers for change were pressure from economic development, cultivation practices, and hydro-agricultural techniques. This leads to stress on water and soil resulting in soil erosion, poverty increase, and rural exodus. We show that hydro-agricultural techniques adapted to the semiarid climate, allocation of land property rights, resource allocation, and improved marketing of agricultural products can help rural residents to diversify their economy, and thus better preserve the fragile semiarid landscape. Results of this study can be used to ensure sustainable management of water and soil resources in areas with similar climate and socio-economic conditions.

1. Introduction

Land use has significant environmental and socio-economic impacts. Information on land use changes is among other things necessary for questions regarding planning and protection of environment for a sustainable management of natural resources [1]. The dynamics of land use are to a great extent influenced by human and natural processes, and results from complex interactions between social, economic, and biophysical developments [2,3]. These processes operate at various temporal and spatial scales and are significantly affected by agricultural development, technological advances, and population pressure [1,4,5].
The study of land use dynamics, as a function of several physical and socio-economic factors or drivers of land use change, has attracted much attention from many researchers during the latest decades [6]. Human-induced land use changes reflect various policies of land use development and management. Although, these changes may be economically beneficial for humans, the stability of the natural environment may be jeopardized (e.g., [7]). Understanding of underlying drivers for land use changes becomes important to mitigate degradation of ecosystems and eventually the foundation for human life [8]. This is especially important in biologically fragile arid and semiarid areas with high population pressure.
In recent years, remote sensing and geospatial technology have experienced improvements in the quality and availability of satellite images. The images can be used to analyze various environmental phenomena at different scales. The coupling of remote sensing with geographic information systems (GIS) is commonly used to classify maps and identify land use at different time scales [9,10,11,12,13,14]. A prominent advantage is that land use dynamics can be linked to socio-economic conditions such as economic development, demographic pressure, technological changes, and biophysical attributes of land areas that occur at the local level [15]. A promising approach adopted for complex environmental problems related to soil and land use is based on the DPSIR (Driver-Pressure-State-Impact-Response) conceptual framework. This concept makes it possible to understand and explain the challenges of real or foreseen situations and their potential evolution at different scales [16]. The DPSIR approach can be used to examine the mechanisms underlying environmental problems and the interaction between society and the environment (European Environment Agency, [17]). Thus, the DPSIR approach can link driving forces of land use changes with the pressures created and society’s response to these problems (e.g., [18]). The flexibility of the DPSIR approach is advantageous in relation to other socio-economic/theoretical models in regions where data are scarce and difficult to access [15]. It, thus, allows a wide range selection of suitable indicators to run the model in large regions with limited data. This is the case for the Tunisian semiarid Merguellil Wadi Basin.
Central Tunisia and the Merguellil Wadi are the location for extreme rainfall storms as well as recurring droughts. The peak flow of the September 1969 flood probably reached 3000 m3/s at Haffouz [19]. It had disastrous effects on the land use in the Merguellil Basin. All traditional Seguias, the only irrigation system using the water of the Merguellil Wadi, were destroyed [20]. The flood further eroded much of the clay soil and deposited sandy sediments that reduced rangelands to less productive or unproductive soils [21]. To reduce risk of flooding, the El Hourreb dam was constructed in 1989 [22]. Since then, the basin has undergone a conversion from rain-fed agriculture of cereals to intensively irrigated agriculture [23]. The post-revolution period after January 2011, meant that rapid changes affected the area and new socioeconomic processes acted as driving forces for land use change in the study region [21]. One of the most important features was the onset of numerous illegal drillings and intensive exploitation of the land coupled with certain poor agricultural practices. The result was a significant drop in yields linked to increased soil loss caused by intensified and improper land use. Thus, the current socio-environmental emergency of the area can be said to have been caused by the reduced productivity of the land and the soil deprived of its organic matter.
In view of the above, the main objective of the present study was to introduce a novel methodology to analyze drivers of changing land use pressure and the effects on society and landscape properties. We tried to characterize these drivers and relate them to land use statistics obtained from geospatial data. Cause-and-effect relationships between the different drivers of land use change were analyzed using the DPSIR approach (Driver-Pressure-State-Impact-Response). This approach was used together with satellite data, questionnaire-based surveys, and in-depth analyses of data obtained from secondary data sources. Thus, multispectral Landsat satellite imagery for the period from 1976 to 2016 was used to assess the dynamics of the agricultural landscape. The objective was to identify main drivers of the changing agricultural landscape in the Merguellil Wadi Basin. Thus, the results can be used to formulate policies and strategies for land management in semiarid and fragile landscapes in terms of water and soil resources use.

2. Materials and Methods

2.1. Study Area

The Merguellil Wadi Basin is located in central Tunisia. The Merguellil Wadi is the second most important non-perennial river in central Tunisia. It covers an area of 1183 km2. During the Roman period the area was intensely farmed and today irrigation is used to produce mainly olive and apricot crops. The El Haouareb dam retains all water from the Merguellil Wadi (Figure 1) [24]. The shape of the watershed is almost triangular with a downstream base (Figure 1). The bed of the watercourse is classified as very sensitive to erosion [25]. Various hydraulic and soil structures have been built in the upstream of Merguellil Wadi to protect against floods and supply agricultural areas with irrigation. These structures have significantly altered surface runoff feeding the wadi. To prevent El Haouareb dam from silting, the upstream area is equipped with more than 200 km2 of soil benches, lakes, and dams (38 lakes and five earth dams) to collect more than one million cubic meters of water. The altitude varies between 200 and 1200 m with an average of about 500 m (Figure 1). The basin is located in a semiarid climate, characterized by a very high spatial-temporal variability of precipitation [26]. Annual rainfall varies between 220 mm downstream and 420 mm in the upstream. Occurring rainfall is often intense, especially in spring and autumn, which cause flooding of the wadis [27]. Intermittent flow in the Merguellil Wadi supplies the El Haouareb reservoir with water. The reservoir, in turn, provides water to the downstream Kairouan plain and recharges the groundwater table here. The groundwater is used for irrigation and drinking water supply.
The basin annual average temperature is 19.2 °C with a minimum of 10.7 °C in January and a maximum of 28.6 °C in August and the potential evapotranspiration is about 1600 mm/year [28]. The area has a strong rural character with about 85% rural and 15% urban residents and these live mainly from livestock farming and rainfed and irrigated agriculture [21]. The population density varies between 50 and 100 inhabitants per km2 with an average annual population growth of about 1.5%. About half of the watershed surface is occupied by annual crops (wheat and barley) and arboriculture (olive, apricot, and almond trees). Since about 2000, the central watershed has experienced an unprecedented increase in fruit growing. Irrigated agriculture is the economic engine of the area. The area’s agricultural products are oriented towards the regional and national market [23]. Selective changes in land use, coupled with certain poor agricultural practices (over-tillage, ploughing against the slope, poor control of irrigation and spate) have resulted in increased erosion. Farmers have to a great extent moved from multi-cropping to intensive monoculture [23]. This has deteriorated the land further and, thus, the degradation of soil fertility continues. As a result, the loss of agricultural land has had large-scale impacts on food security of the area, health, and quality of the soil, which in the long-term will hamper its productivity.

2.2. Data Used

We used Landsat 1 MSS (Multi-Spectral Sensor) acquired on 21 July 1976, Landsat 5 TM (Thematic Mapper) taken on 19 July 1996, and Landsat 8 OLI-TIRS (Operational Land Imager- Thermal Infrared Sensor) taken on 21 July 2016 with a spatial resolution of 30 m. July coincides with the start of the dry season and the end of the rainy season and thus, images were clear of clouds and haze. This also made it possible to avoid the effect of annual vegetation and to better understand the behavior and distribution of the plant cover. Landsat images were downloaded free of charge from the USGS website (https://earthexplorer.usgs.gov/, access date: 3 March 2020) to produce land use maps and identify the different classes of land use. A digital elevation model (DEM) was derived from the SRTM Shuttle Radar Topography Mission data (SRTM), from 1 arc-second for global coverage (30 m) and downloaded via the USGS website (https://earthexplorer.usgs.gov/, access date: 30 November 2019) (Figure 1).

2.3. Land Use—Land Cover Classification

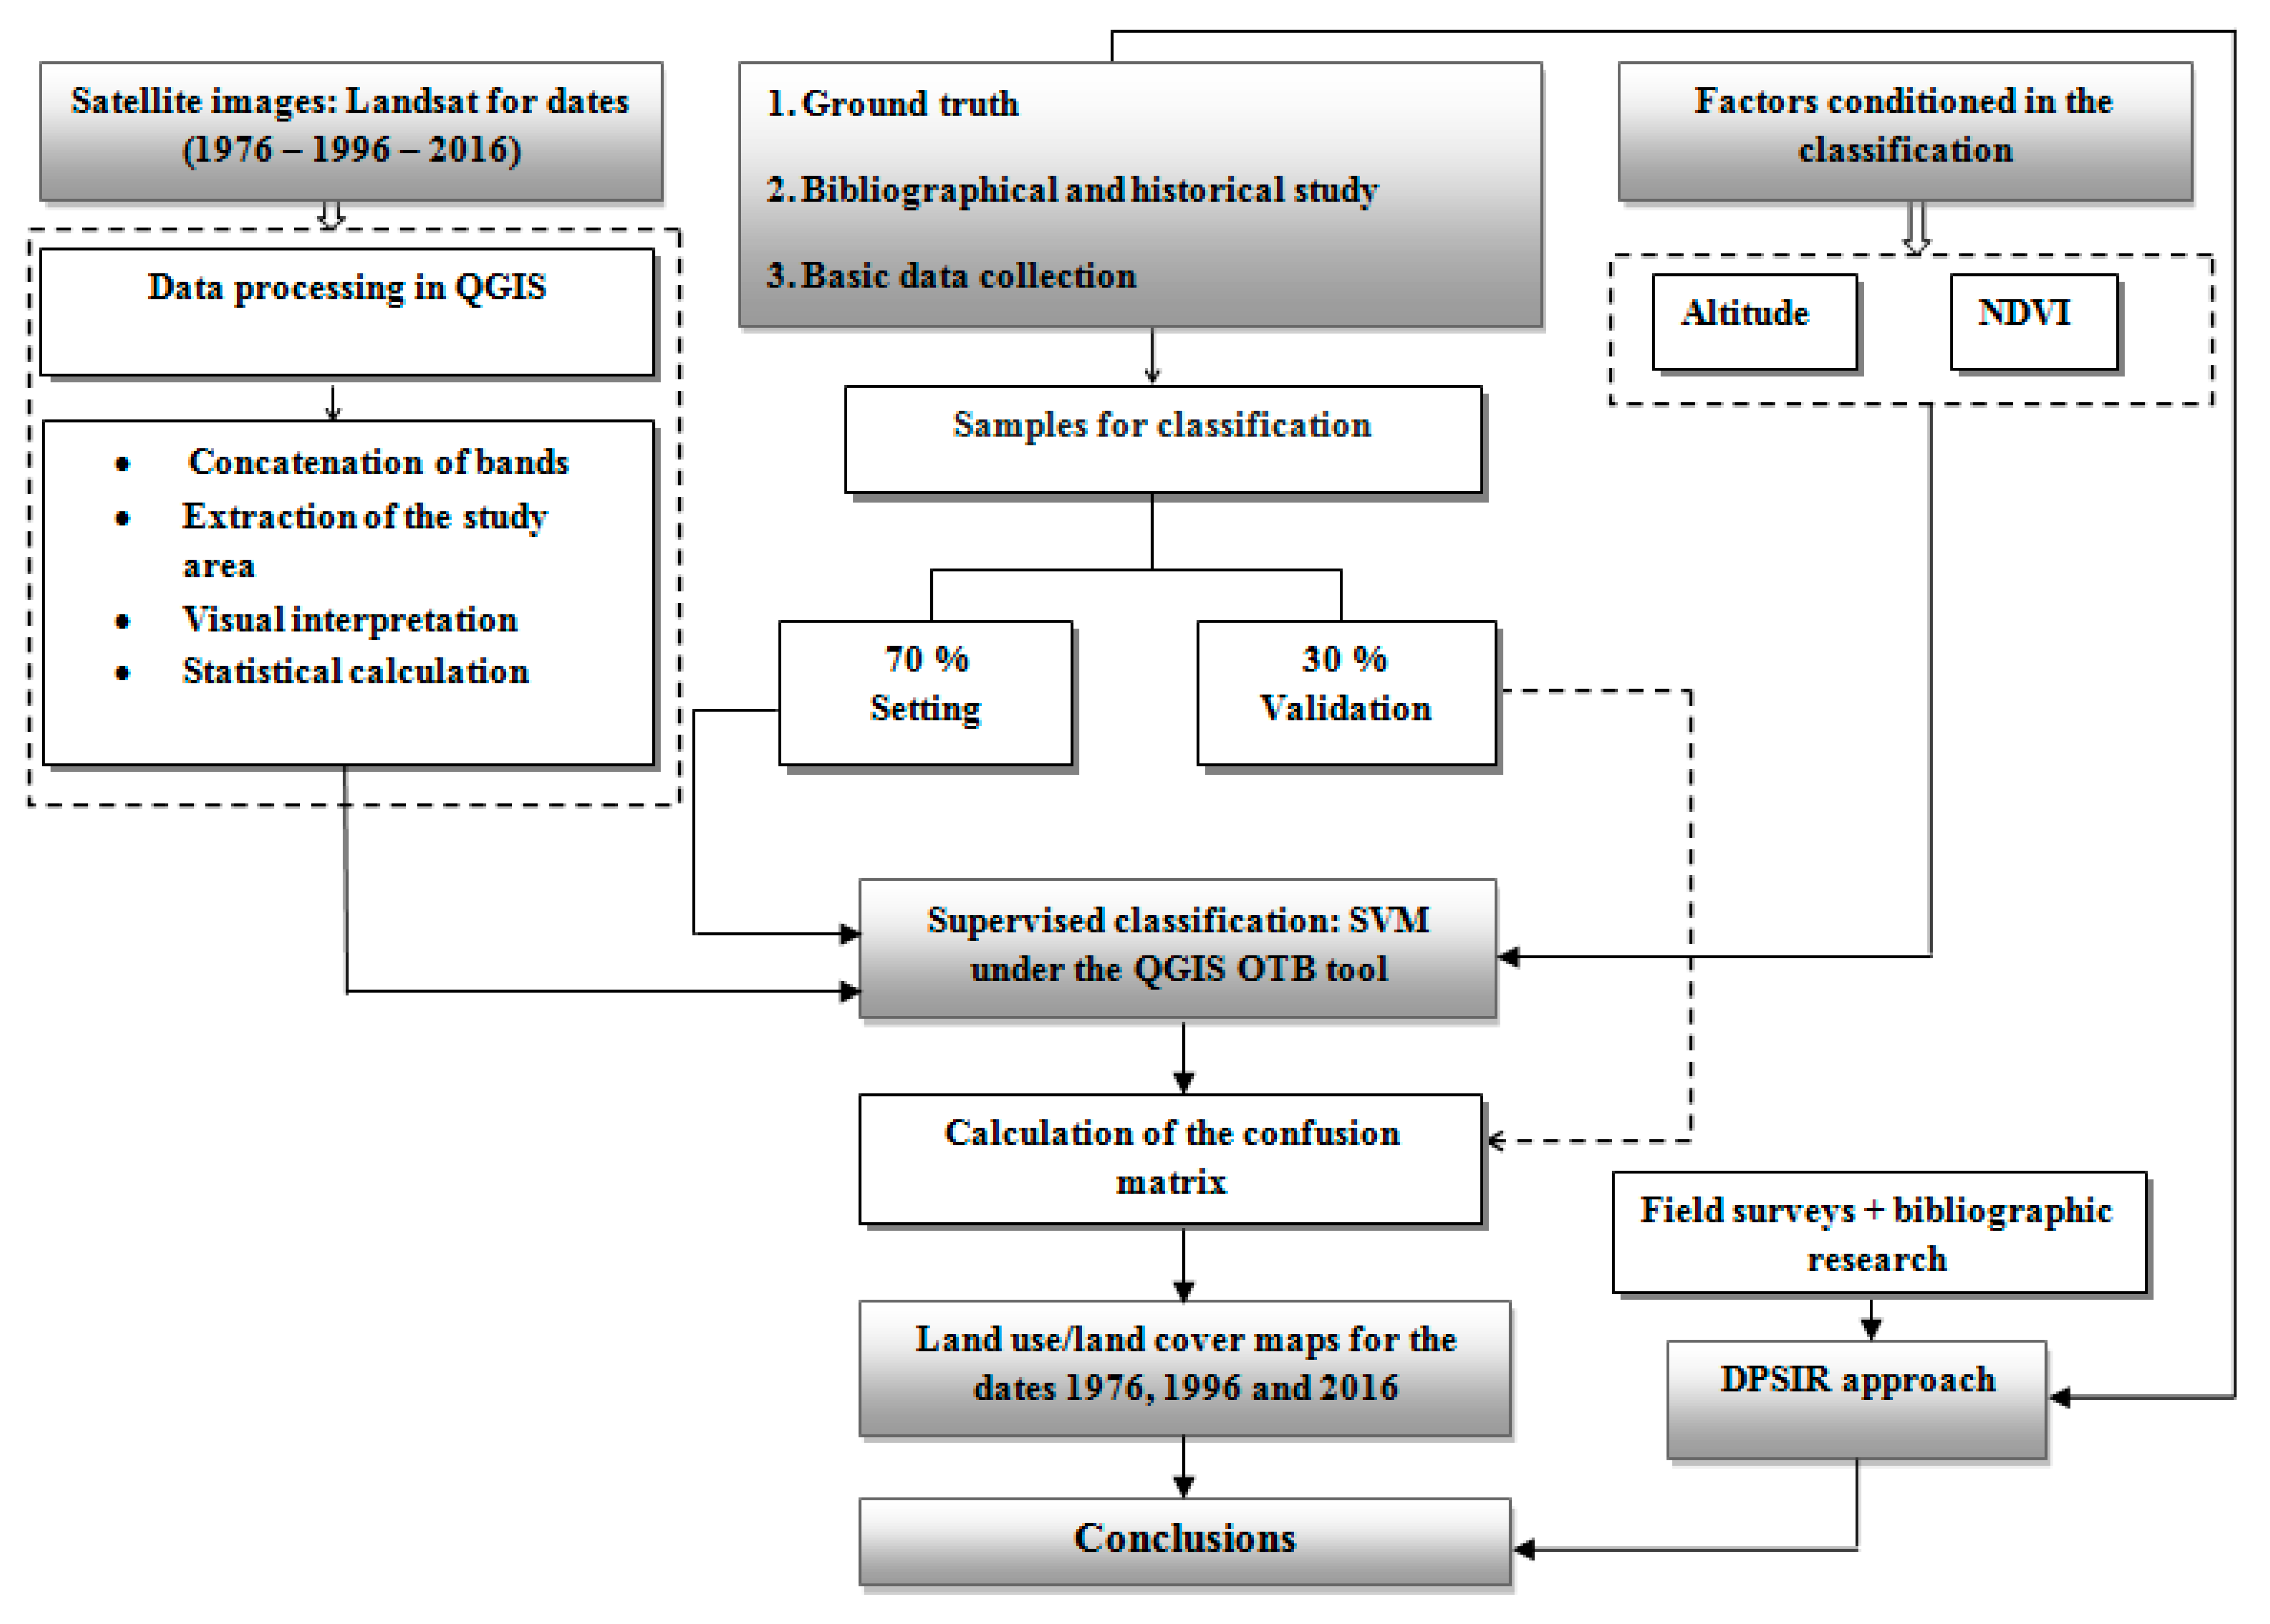
The land use/land cover classification for the three years (1976, 1996, and 2016) was based on pixels supervised with the Support Vector Machine (SVM) whose algorithm is integrated with the OTB tool (Orfeo ToolBox) of QGIS (Quantum GIS) (Figure 2). The adopted land use classes in this study are based on the classification used by the Food and Agriculture Organization of the United Nations (FAO) [29]. The land use/land cover classes were grouped into seven main categories depending on soil conditions and nature of land cover in the study area (Table 1). The classification was performed for each acquisition date using reference data and the normalized vegetation index.

2.4. Accuracy Assessment

Classification results were evaluated using the QGIS software to verify the supervised classification with field reality using randomly selected reference sampling points [1]. Benchmark data for each class were in the form of classification samples for training and validation. These samples were selected via Google Earth and the land use/land cover map of the Merguellil Wadi derived from an inventory (1995–2010) published in 2010 by the Directorate General of Forests [30]. The total number of benchmarks collected was 20,549 pixels, of which 15,807 were for classification and 4742 for accuracy rating. The total number of pixels represents approximately 0.77% of the pixels for the entire study area. Precision measures, such as total accuracy, kappa coefficient, user (U), and producer (P) accuracy were calculated as percentages. Thus, an error matrix of the land use classification was generated.

2.5. Household Surveys

Household surveys were conducted to understand the changing land use situation and gain insight of effects on farming using the DPSIR approach. A total of 116 household surveys were conducted during the period from November to December 2017 [31]. The population targeted by the survey was all individuals (farmers, herders, traders, etc.). The survey included socio-economic questions on the farming life and farmers’ use of the natural resources. The aim was to analyze the functioning of the farm and to identify the factors driving the land use change. Interviews were semi-structured together with participating observations [31]. The surveys were designed to allow expression of farmers´ views regarding long-term changes. However, people´s opinions on change are often related to changes in the short-term and there was no real way to collect data on long-term changes in farmers’ opinions.
The El Alaa region with about 32,000 inhabitants was selected as a representative area located at the foothills of the upstream Merguellil Wadi Basin at an altitude of 463 m (Figure 1). The area was selected after a comprehensive pre-study of the socio-economic conditions of this area [31]. The region of El Alaa provides a link between the forest environment and other landscape units forming the Merguellil Basin. In addition, the socio-economic problems experienced by the villagers in the management of natural resources in connection with exploitation methods are representative for the larger basin area. The El Alaa region constitutes a delegation (mutamadiyah) and a second level administrative division of Tunisia between governorates and sectors (imadats). There are 24 governorates in Tunisia that are divided into 264 delegations. The El Alaa inhabitants are mostly rural, living mainly from agriculture. Most other inhabitants have left the delegation to work elsewhere in Tunisia or Libya. According to the local authorities, 80% of the population are unemployed. Among the unemployed people, 1700 have higher education degrees and have generally been unemployed for nearly 10 years. More than 85% of the rural area are agro-pastoral [21]. Despite difficult conditions and the extension of the arboriculture, the cereal farming continues to be an important resource [31]. Most of the water is pumped from the downstream groundwater table through a high density of wells [23]. The basin has more than 5000 wells while there were only about a hundred in the 1960s [21]. In the upstream basin, farmers practice dry farming and arboriculture of olive trees (71% of plantations), almond trees (12%), and cereals dominate.

2.6. Indicator-Based Approach

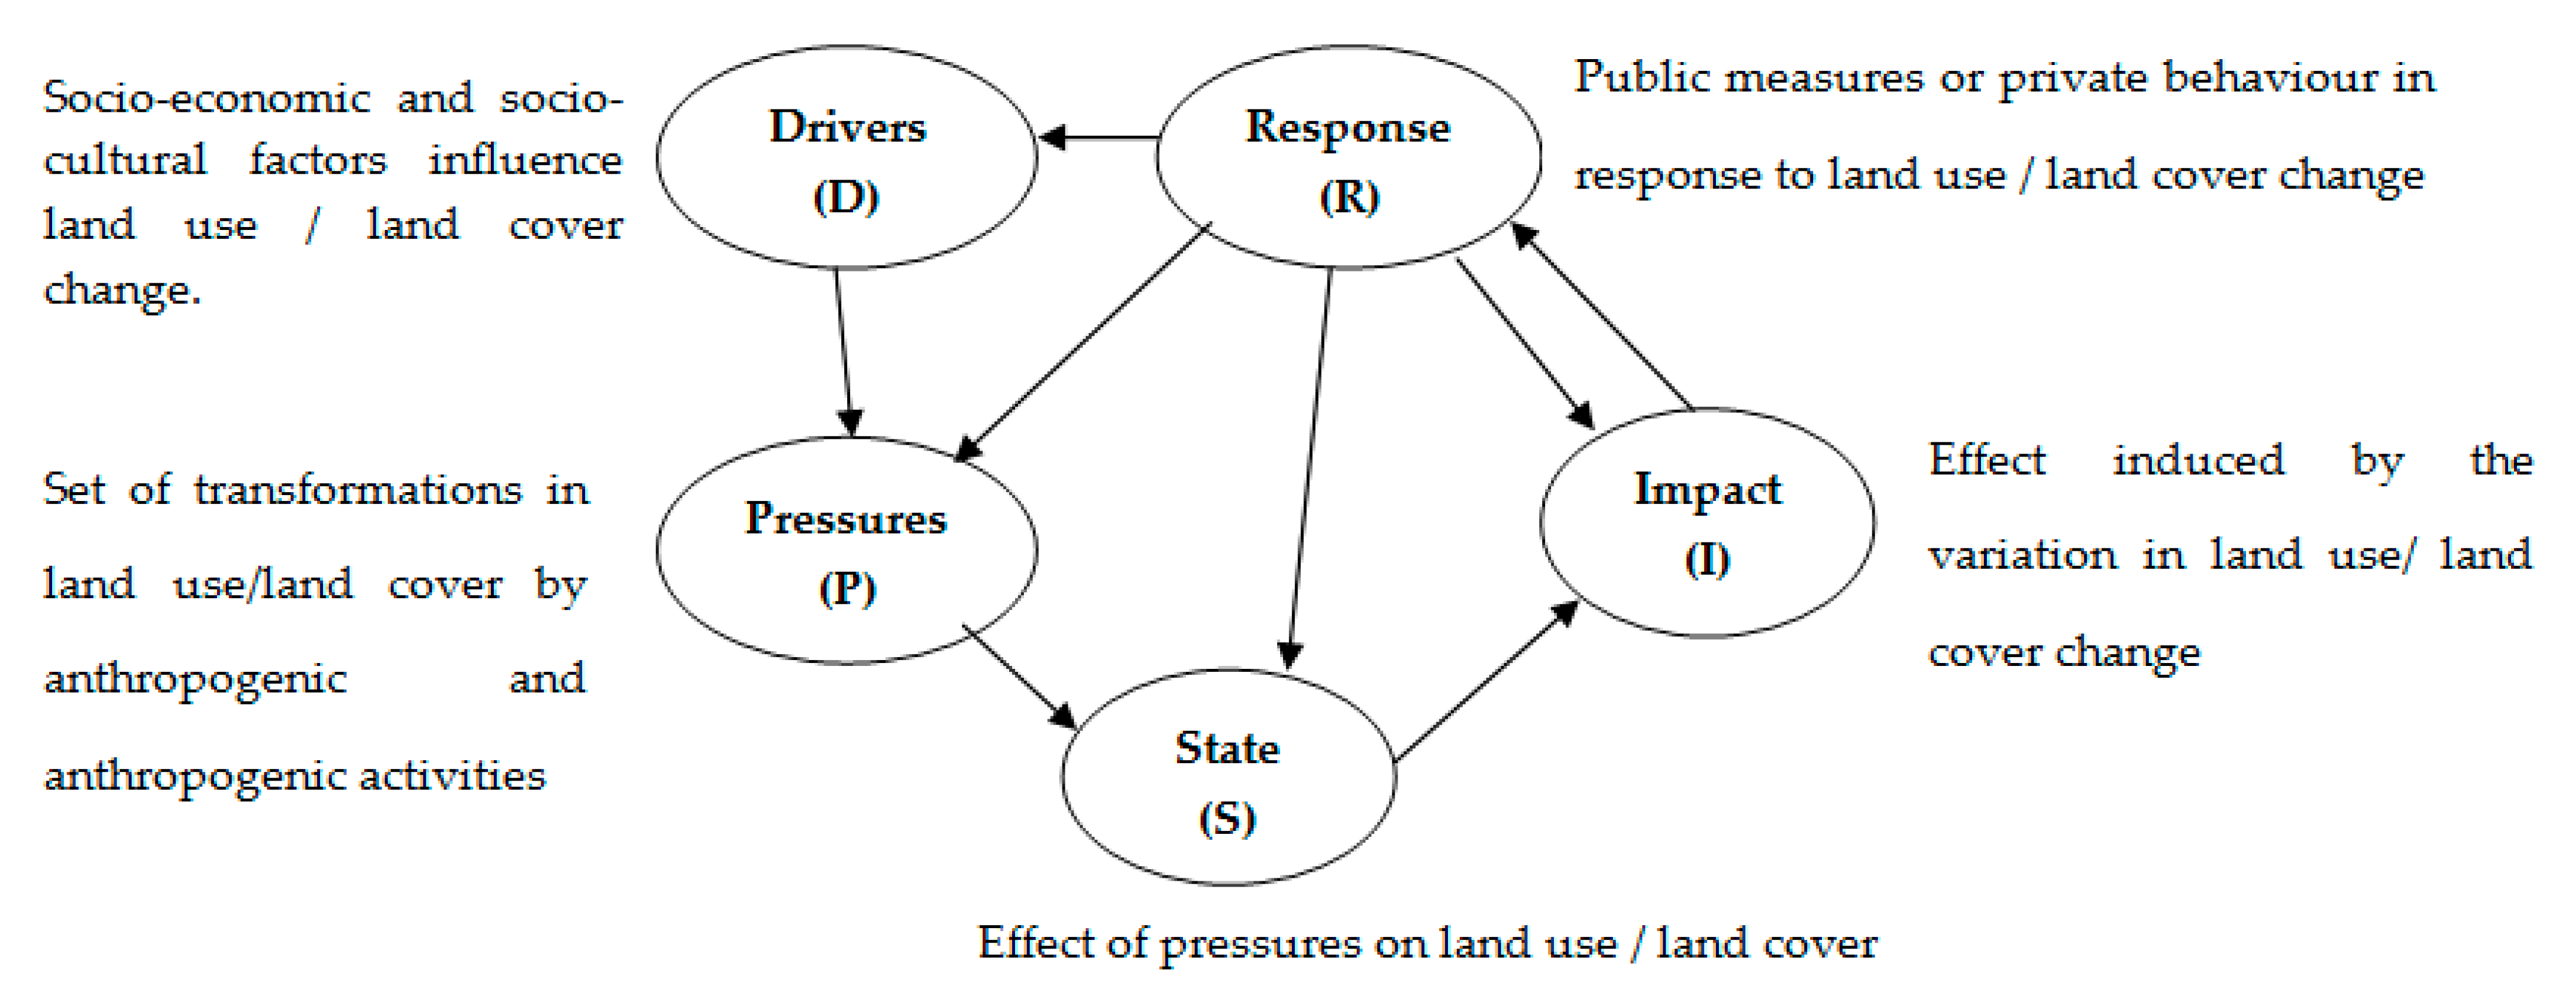
Land use dynamics can impact land conditions through pressures from various driving forces that cause changes. The satellite images were used to determine the state of land use changes in the area for the different time periods. These only explain “how” these changes occurred and the “why” requires careful study of various variables or indicators of this change. The DPSIR approach establishes the relationship between “how” and “why”. It presents a cause-and-effect framework of driving force-pressure-state-impact-response. Each parameter is impacted by the precedent that ultimately affects political decisions at the highest level. The adaptation of DPSIR in the assessment of land use dynamics is summarized in Figure 3.
The DPSIR indicators were assessed using the probability of selection and based on the 5-point Likert scale (level 1—very low; level 5—very high). The surveys were constructed and processed according to the probability of occurrence, mean, standard deviation, and the consensus for the 5 points of the Likert scale. The Xi denotes the degree of satisfaction of the arguments according to category i of the Likert scale and Pi the probability of occurrence of Xi. Thus, the average of the overall agreement for the 5-point Likert scale is defined by:
wMean = i = 1 5 X i P i ( X i )
The mean values can be classified according to five levels; very low (1.00–1.49); low (1.50–2.49); medium (2.50–3.49); high (3.50–4.49); very high (4.50–5.00) [32,33].
The standard deviation for the 5-point Likert scale is defined by:
wSTD = i = 1 5 ( X i wMean ) 2 5
The consensus is defined as the agreement of an argument between individuals in a sample of the group [33,34]. It is defined according to the 5-point Likert scale by:
C n S ( X ) = 1 + i = 1 5 P i ( X i ) l o g 2 ( 1 | X i w M e a n | 4 )
The Pearson product moment correlation aims to determine the relationships between land use/land cover dynamics and the DPSIR parameters. This tests the linear association between two quantitative variables X and Y [35]:
R = X Y ( X ) ( Y ) N ( X 2 ( X ) 2 N ) ( Y 2 ( Y ) 2 N )
where R is the correlation coefficient; X corresponds to the land use/land cover type; Y is the dependent variable, which corresponds to the probability of occurrence for the DPSIR parameters as perceived by households, and N is the number of indicators for each DPSIR component. The coefficient of determination (R2) is calculated to test the correlation strength [36].

3. Results

Figure 4 illustrates the relationship between the probability of occurrence for the driving forces of arboriculture dynamics as perceived by households. We denote by (1) Population growth; (2) Creation of douars; (3) Climate change; (4) Creation of agricultural plots; (5) Land fragmentation; (6) Mountainous and rugged topography.

3.1. Land Use/Land Cover Dynamics

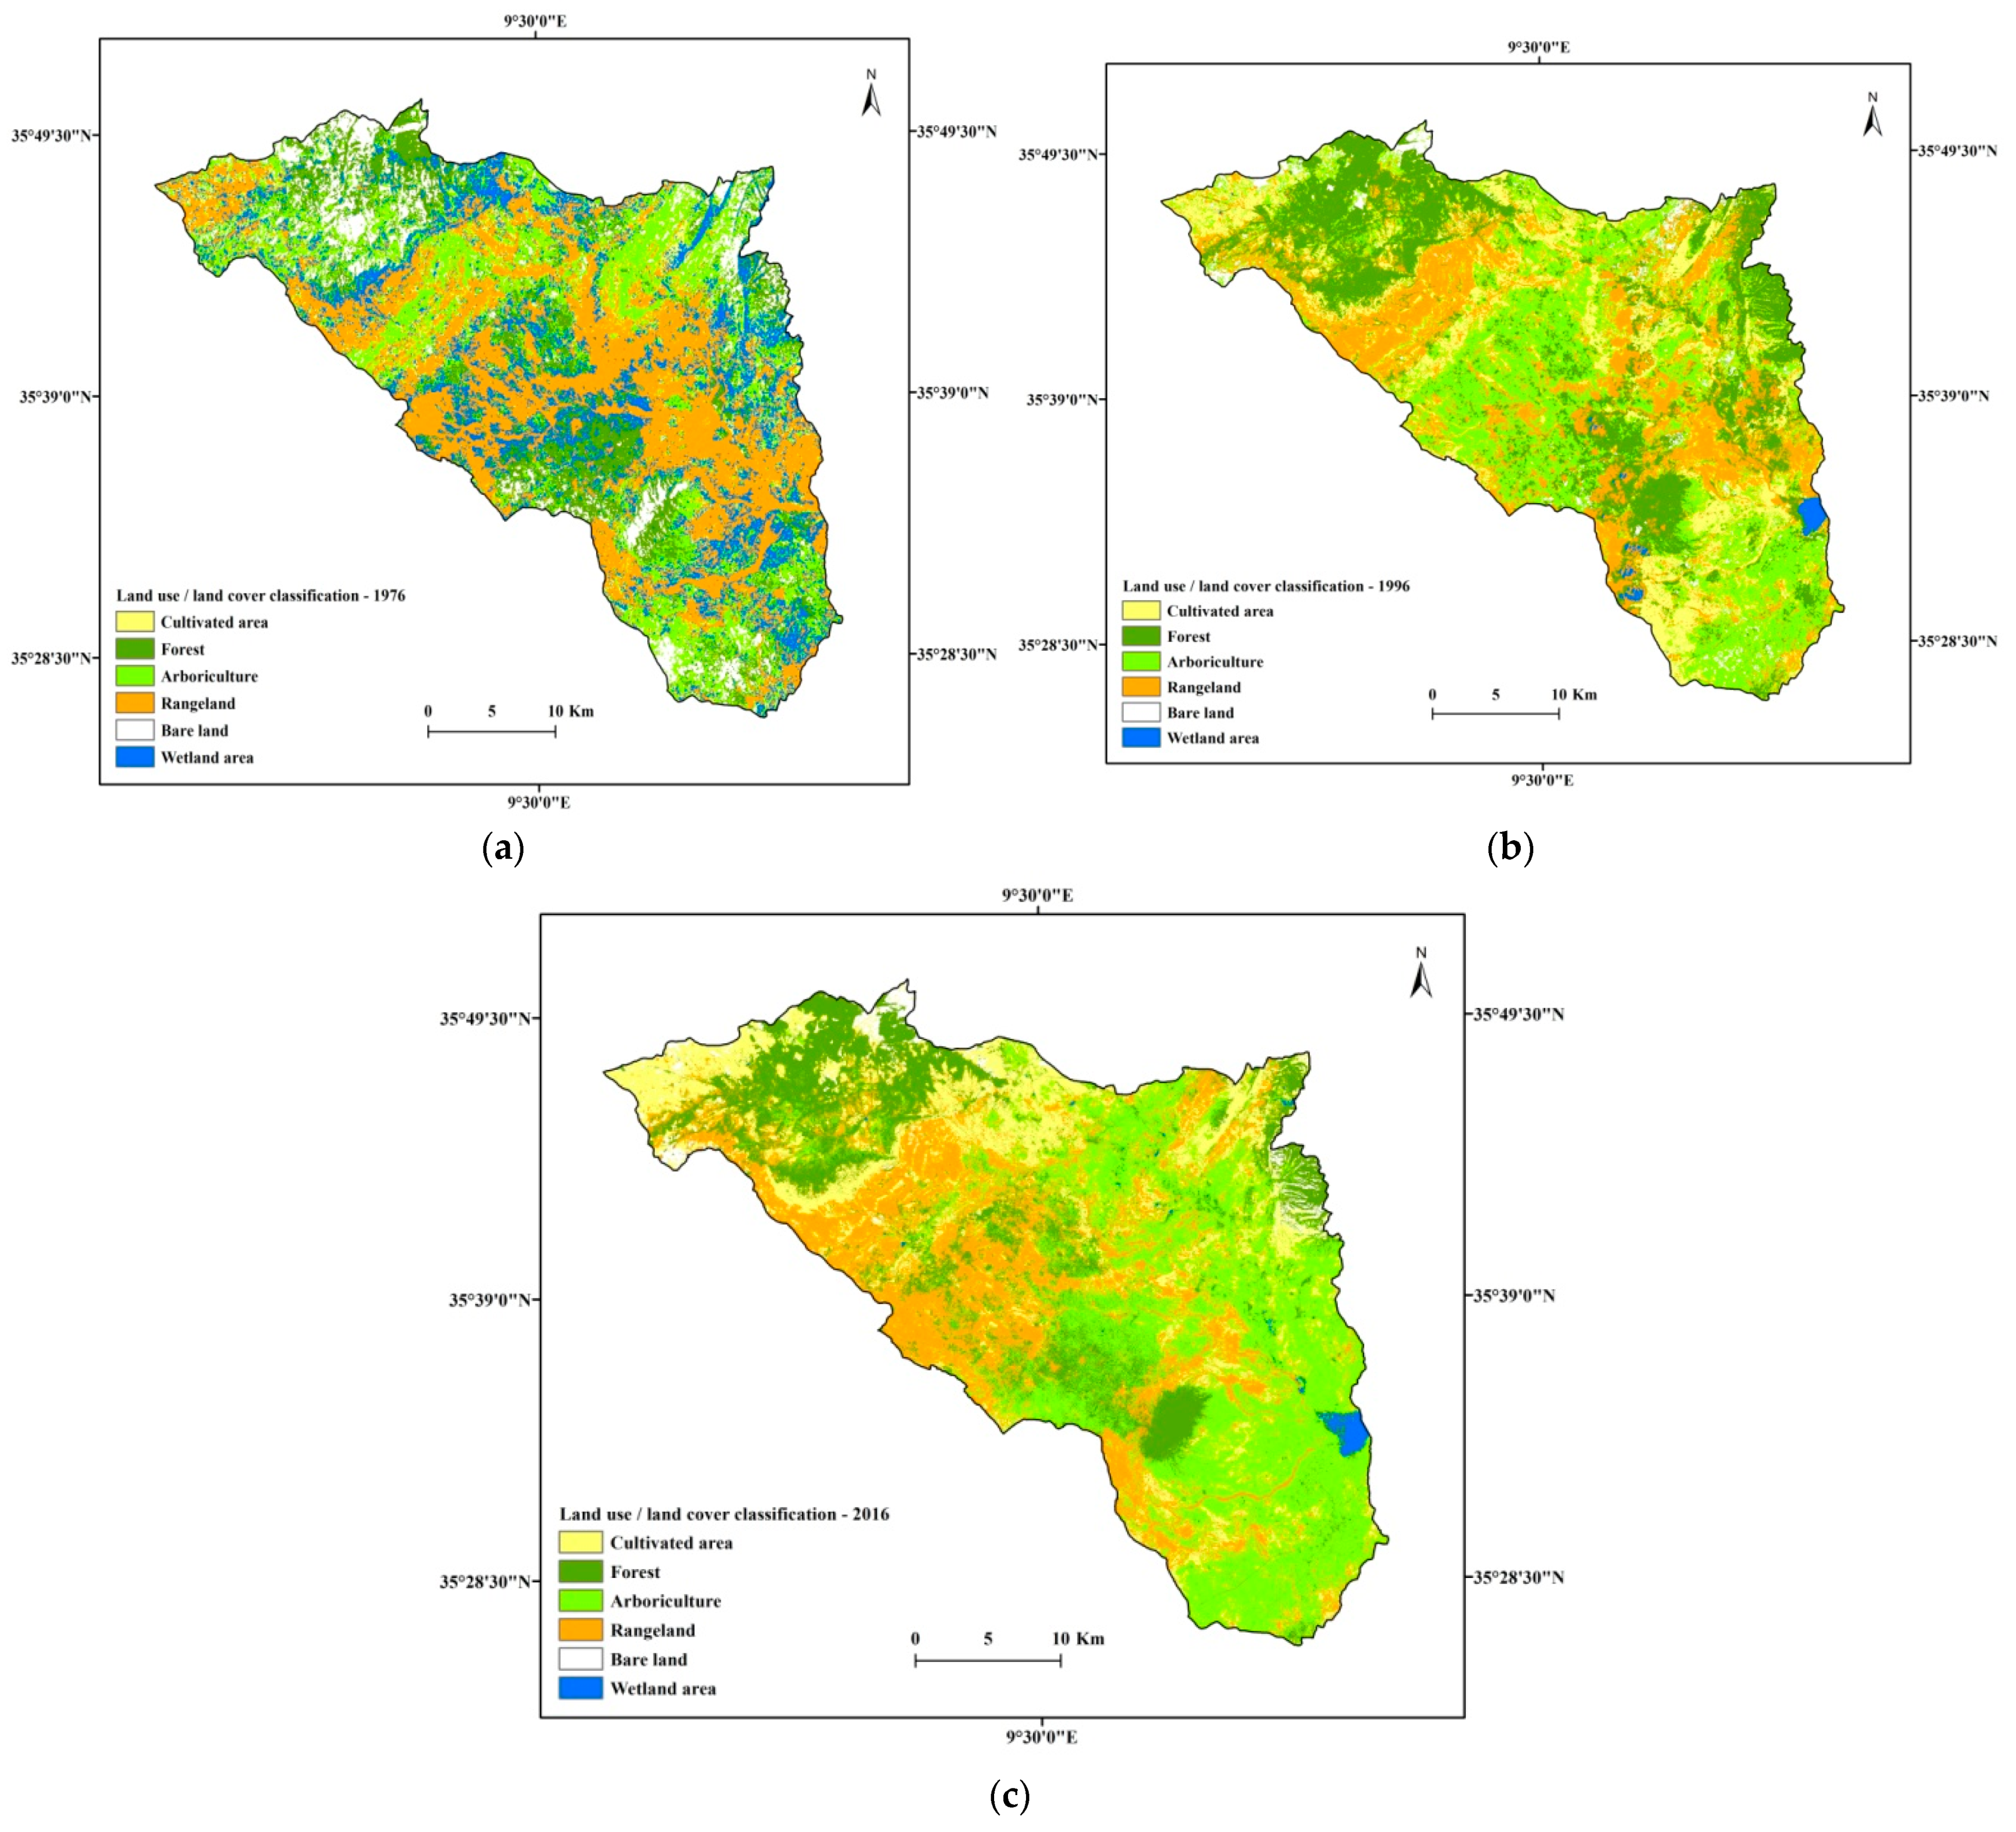
Table 2 shows the confusion matrix for the three investigated years. The confusion matrix is calculated by comparing land covers derived from the Landsat images against ground truth land use data. Each column of the confusion matrix represents a ground truth class that corresponds to the image’s labeling of the ground truth pixels [37]. Evaluation of the supervised classification is illustrated in Table 3. The overall precision was 79.3% for 1976, 79.5% for 1996, and 81.1% for 2016. The rate of the overall accuracy precision is related to the resolution of the satellite images used. The kappa coefficient for 1976, 1996, and 2016 was 0.73–0.75 (Table 3). The classification of cultivated area yielded high producer’s and user’s accuracies. However, confusions were mainly observed between cultivated area and rangeland (Table 3), indicating the difficulty of optical data in separating land covers of similar spectral signatures. The resulting land use classification of Merguellil Wadi Basin for 1976, 1996, and 2016 is shown in Figure 5 and Table 4. Therefore, the results can be said to have met the requirement for precision and it is possible to use them for an in-depth analysis of changes during the 40-year study.
Table 5 shows that the basin area has gone through substantial changes in land use during the 40-year study period. Especially, wetland areas decreased and cultivated areas increased. During the last twenty years, arboriculture, and forestry suffered a significant decrease (Table 5).

3.2. Adaptation of the DSPIR Approach in the Merguellil Wadi Basin

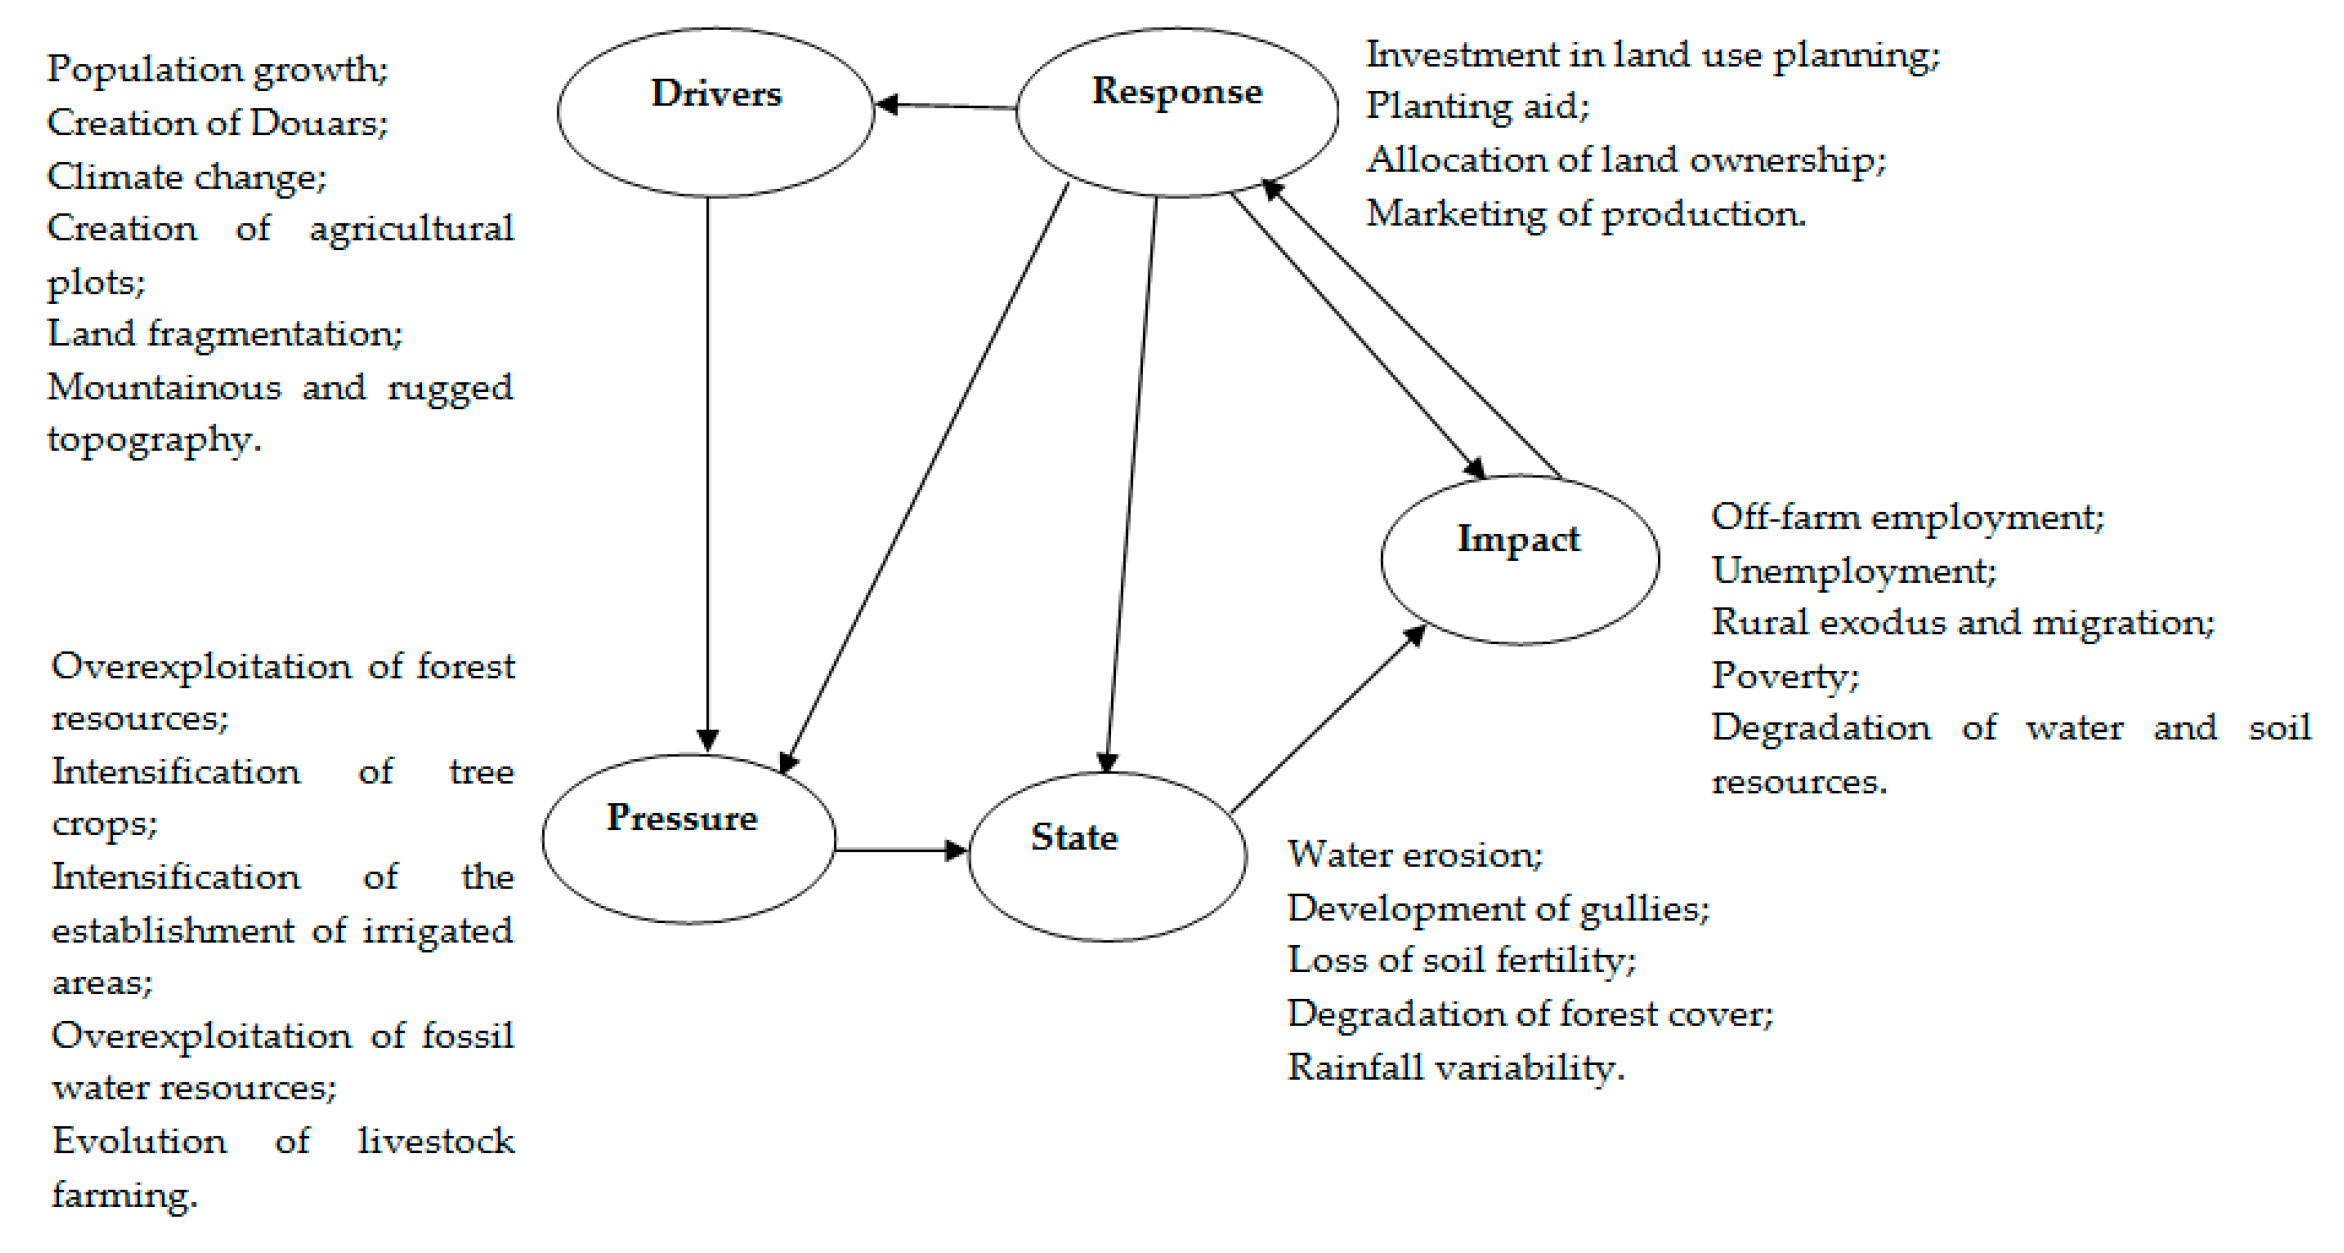
The DPSIR methodology was used to link land cover maps to the indicator-based approach. Based on the responses of farming households in the El Alaa region, regarding their perception of the different factors concerning land use change, a DSPIR model was developed (Figure 6). The figure lists all responses from farm households in the questionnaire survey, but also includes the factors mentioned in the group discussions to encompass the entire Merguellil Wadi Basin.

3.2.1. Drivers of Land Use/Land Cover Change

Table 6 shows driving forces of land use/land cover changes as perceived through the 116 household surveys.
The climate change appeared to be one of the main factors responsible for land use change (CnS = 0.68). The cultural practices implemented by farmers clearly show that drought presents a major climatic risk. Changes in the seasonal distribution of rainfall threaten the sustainability of existing production systems [31]. The plots of the El Ala region are cultivated using rain-fed systems (97.7% of the agricultural area). The most important crop distribution (51%) is a mixture between cereals and arboriculture of which olive and almond trees are the main crops due to their water stress resistance [31]. The population growth received a large consensus (CnS = 0.6) (Table 6). Indeed, the number of inhabitants is about 29,900 people. The average size of a farming family in the study area is about 6.6 people, with a maximum of 12 people. The structure of land organization represents a main problem. The creation of agricultural plots and the division of land represent high mean driving force of 4.65 and 3.03, respectively. About half (48%) of farmers does not have ownership of the cultivated land. This adds to the fragmentation of land that is an obvious and important issue. In fact, the average number of plots per farmer is 6 with a minimum of 1 and a maximum of 20. The fragmentation of agricultural land (CnS = 0.34) and the creation of agricultural plots (CnS = 0.62) present two important driving forces. The average number of plots is 4.75 with a maximum of 22 plots. The total agricultural area is of the order of 1891.5 ha of which 1383.5 ha are for agriculture, with an average of 9.6 ha, a minimum of 1.5 ha, and a maximum of up to 200 ha per plot.

3.2.2. Pressures Due to Land Use/Land Cover Change

The pressures exerted due to the changing land use as perceived by agricultural households are mainly overexploitation of groundwater (CnS = 0.54) by increase in the number of illegally drilled wells, demand for more agricultural land, theft of livestock, degradation of rangelands, agroforestry, overexploitation of forest resources, and increased demand for forest products (CnS = 0.58) (Table 7).

3.2.3. States Perceived Due to Land Use/Land Cover Change

In most of the region, the condition currently observed due to change in land use by households is change in forest cover (CnS = 0.76). Indeed, the survey region is characterized by traces of Aleppo pine and rosemary with diversified plantations (red juniper, etc.). In addition, water and soil resources are degraded and threatened by water erosion (CnS = 0.70). During field visits, we noticed the presence of expanding gullies and rock outcrops (Table 8).

3.2.4. Impacts of Land Use/Land Cover Change

The environmental and economic impacts reported by farmers are the increase in migration from rural to urban areas, work in the field of masonry, tourism and trade, and craft activities (margoum tapestry, sewing), declining land productivity, and increasing consumption of natural resources (Table 9).

3.2.5. Responses of Land Use/Land Cover Change

The response of farmers to changes in land use is development of diversification [31]. As a result, the population is turning towards diversification such as arboriculture (olive and almond trees), cereals, breeding (poultry, sheep, cattle, and goats) and the promotion of cactus crops (Table 10).

3.3. Relationship between Land Use Land Cover Types of Culture and the DPSIR Approach

Table 11 illustrates the strength of the relationships between each land use land cover type and the probability of occurrence of DPSIR parameters as perceived by households. The determination coefficient is on average equal to 0.76. This shows that there is a strong correlation between the land cover class and the different components of the DPSIR approach.

4. Discussion

4.1. Land Use Change

The land use change between 1970 and 2016 showed a continuous increase in cultivated areas. The share of crops occupied 6.3, 18.4, and 19.3% in 1976, 1996, and 2016, respectively (Table 3). Thus, over a period of 40 years between 1976 and 2016, the crop cover almost tripled, i.e., from 6.3 to 19.3% (Table 3). This is due to the conversion of denuded areas into rangeland and arboriculture. The construction of the El Houarreb dam in 1989 has helped to develop irrigation. These results are consistent with the description of the state of the soil cover in the Forest Investment Program in 2016 for the second national forest and pastoral inventory (IFPN) [38]. The inventory documented a gradual extension of crops, particularly for the practice of cereals and arboriculture. The increase of crops serves to improve self-sufficiency for certain products (vegetables, fruits, and cereals, including barley) and the provision of agricultural by-products to feed the livestock. Barley remains an important crop in the production system integrating sheep and cattle farming in the study region. In addition, the increasing cropping area is linked to the development of irrigation with an increase in drip irrigation between 1999 and 2005 [39]. Bare soil and rangeland have also experienced an important change (Table 5). Overgrazing and overexploitation of rangelands are explained by the increase in number sheep and goats and illegal logging of shrubs and trees, commonly practiced by the poorest agro-pastoral population [38]. A major land use change is the decreasing wetlands. These include springs, hill reservoirs, and tributaries of Merguellil Wadi (Table 5). This is explained by the variability of the rainfall regime and the increase in temperature during the study period [26] as well as soil erosion that causes siltation of the hill reservoirs and the El Houarreb dam. [40].

4.2. DPSIR Indicators Related to Land Use Change

4.2.1. Drivers Linked to Land Use Change

Land use change is the result of a combined association between demographic, socio-economic, biophysical, and institutional processes. Population growth has led to higher demand for natural resources, resulting in changes in land cover over time [41]. Indeed, according to the general population and housing census in 2014, the total population in the governorate of Kairouan is about 187,000 people with a growth rate of 1.8% [42]. According to forecasts by the National Statistics Institute, this population will more than double until 2030 [43]. In addition, the rugged mountainous topography of the Merguellil Basin makes agricultural production difficult resulting in large pressure on existing farmland.
Another important driver of land use change is the fragmentation of agricultural land. Indeed, the plots are small areas that usually do not exceed 10 ha [44]. This has encouraged farmers to increase their agricultural production, to use the most available space and, therefore, to remove ecological zones, namely hedges, and banks of the river. In addition, agricultural land use has been developed without regard to the capacity of the land. For example, livestock and animal production are not well integrated with cereal production.
Another driver of land use degradation is the insufficient/inefficient use of animal manure, inappropriate agricultural techniques, including among other things the repeated cycles of barley, wheat, and fallow in crop rotations. Inappropriate crops and mechanization (disc ploughs are not good for the soil structure). In addition, one of the main factors responsible for land use change is the impact of climate change. This factor is crucial for all of Tunisia. Indeed, recent trends show that Tunisia is becoming warmer and drier with intense extreme events (droughts and heavy rains). In fact, global warming will further disrupt rainfall patterns, as well as increase temperature, which will have even more disastrous consequences for water erosion and land management [28,45].

4.2.2. Pressures Linked to Land Use Dynamics

The drivers of land use change are exerting pressure on the sustainability of water and soil. In the Merguellil Basin, geomorphology has conditioned creation of the douars. These constitute groups of dwellings linked according to family relationships based on a common ancestry in the paternal line. The douars are grouped around water sources. Agricultural activities are characterized by diversification and extension of irrigated land; namely arboriculture and a frequent practice of market gardening especially in the center of the basin. This is due to the overexploitation of groundwater by drilling and pumping [26]. In addition, unregulated livestock grazing on public pastures and woodlands eliminates any possibility of sustainable management. There are at present no control mechanism for the number and type of animals and their grazing time on these pastures [21,23].

4.2.3. Status Linked to Land Use Dynamics

The degradation of the agricultural landscape is a visible and tangible phenomenon that has a direct impact on the livelihoods of the douars in the study area [23]. Indeed, soil loss presents the main type of land degradation since the most fertile upper part of the soil is lost, leading to exposure of the less fertile and more erosive part of the soil. For shallow soils, water erosion can strip the soil down to bedrock. Therefore, erosion leads to a total loss of the productive potential of agricultural land. The structure of soils can be severely damaged, and they usually become more acidic and much less fertile or non-productive [46].

4.2.4. Impacts Linked to the Dynamics of Land Use

Several studies have documented the impact of land use dynamics on the biodiversity (e.g., [47,48,49]). In the study area, the farmers are extremely poor due to the nature of dry farming and the use of land often less than an area of 5 ha. Income from agriculture is often insufficient to support the family. In addition, apart from the periods of sowing and harvesting, small farms do not generate labor. This, favors rural exodus and mountainous areas, traditionally the most popular for farming, olive picking, and forestry activities, have become less attractive as compared to plains and towns. In addition, the improved urban infrastructure has increased the differences between towns and the countryside and accelerated the rural exodus [23,50].

4.2.5. Responses Linked to Land Use Dynamics

Responses are measures to be taken by the government to mitigate the negative impacts of land use change. Tunisia has implemented different forms of adaptation strategies in view of environmental change and climate variability [51]. This strategy was developed following a period of severe drought between 1999 and 2001 that became the national strategy for the development and sustainable management of forests and rangelands (2015–2024). As well, the authorities have implemented the integrated rural agricultural development project (PADRI), the mountainous areas development policy since 1987, and the MERGUSIE project [52]. Water and soil conservation developments in the Merguellil Basin are divided into two categories, land use planning and hydrographic network development. The objective is to help increase water and soil reserves and to protect dams and hill lakes located downstream against siltation. They are essentially in the center of the basin, covering a total area of 285.2 km2 [52].
The development of watercourses in the study area consists of stabilizing structures for riverbanks and longitudinal sections, lakes, and hill-side dams. In total, there are 44 dams and hill-side lakes in the Merguellil Basin [52]. More than half of these lakes (24 hillside lakes) are entirely for agricultural use, 9 lakes are used to protect dams against siltation, 2 to supply groundwater, and 13 for various uses.
The response of the authorities is further to encourage farmers to transform and sell their products at national and regional markets. Cereals and olive oil are collected and sold by specialized offices and organizations, namely the Cereals Office from 1992 and the National Oil Office from 1993.
However, despite continuous State interventions and significant investment, farmers still do not consider the problems to be solved. Decision-making must not only meet the needs of the people but as well constitute an appropriate land use policy to end harmful land use changes. The State must propose an appropriate management strategy based on international land resource management conventions.

5. Conclusions

Analyses of land use changes over a 40-year period at the watershed scale, using geospatial techniques and the DPSIR methodology, have helped to improve the understanding of drivers, pressures, conditions, impacts, and responses to adverse changes in land cover. The spatial distribution of land cover for the investigated period indicated increasing cultivated land (19.6%) and decreasing wetland area (−17.5%). The DPSIR model provided qualitative means regarding the land use changes and included an explanatory platform to understand the complexity of these changes. The novelty of this study lies in the combination of quantitative techniques for the detection of land use changes, such as remote sensing and ground truth observations, and qualitative studies, namely diagnostics, surveys, and group interviews. The purpose was to improve the understanding and link motivation of farmers to the observed change in land cover/use.
Despite State interventions in land use planning and management, the level of satisfaction of farmers is low and their social involvement is very low or even absent. A State policy in the 90s that was used as development strategy for coastal areas supplying resources and labor from “interior territories” has reinforced the marginalization and vulnerability of these rural inland territories that initiated the movement leading to the Tunisian revolution in 2011. Today, in the still brittle post-revolutionary context, the Tunisian State must thus, face the socio-economic challenges (rural exodus, unemployment), environmental degradation (water and soil resources), and climatic change for a sustainable development in these agricultural landscapes.
The results of the study have important implications for similar water-scarce and semiarid areas. They show that allocation of land property rights, resource allocation, and improved marketing of agricultural products are important instruments to help rural residents and avoid rural exodus. Results of this study can be used to ensure sustainable management of water and soil resources in areas with similar climate and socio-economic conditions.

Author Contributions

Conceptualization, methodology, data collection, analysis of results, writing—original draft preparation: K.K.; methodologies, writing—review and editing: S.J.; DPSIR methodology and writing: N.M.; household survey and writing: I.S.; review and editing, funding acquisition: R.B.; Remote sensing methodology and writing: S.B. All authors have read and agreed to the published version of the manuscript.

Funding

This research was funded by the European Union Horizon 2020 program Faster project, grant agreement No. [810812], the MECW (Middle East in the Contemporary World) project at the Centre for Advanced Middle Eastern Studies, Lund University, and the PACTE program implemented by DG/ACTA and funded by AFD and FFEM.

Institutional Review Board Statement

Not applicable.

Informed Consent Statement

Not applicable.

Data Availability Statement

The data presented in this study are available on request from the corresponding author.

Conflicts of Interest

The authors declare no conflict of interest.

References

  1. Gedefaw, A.; Atzberger, C.; Bauer, T.; Agegnehu, S.; Mansberger, R. Analysis of land cover change detection in Gozamin District, Ethiopia: From remote sensing and DPSIR perspectives. Sustainability 2020, 12, 4534. [Google Scholar] [CrossRef]
  2. Islam, K.; Jashimuddin, M.; Nath, B.; Nath, T.K. Land use classification and change detection by using multi-temporal remotely sensed imagery: The case of Chunati wildlife sanctuary, Bangladesh. Egypt. J. Remote Sens. Space Sci. 2018, 21, 37–47. [Google Scholar] [CrossRef]
  3. Bruno, M.F.; Saponieri, A.; Molfetta, M.G.; Damiani, L. The DPSIR approach for coastal risk assessment under climate change at regional scale: The case of apulian coast (Italy). J. Mar. Sci. Eng. 2020, 8, 531. [Google Scholar] [CrossRef]
  4. Reid, R.S.; Kruska, R.L.; Muthui, N.; Taye, A.; Wotton, S.; Wilson, C.J.; Mulatu, W. Land-use and land-cover dynamics in response to changes in climatic, biological and socio-political forces: The case of southwestern Ethiopia. Landsc. Ecol. 2000, 15, 339–355. [Google Scholar] [CrossRef]
  5. Nwaogu, C.; Okeke, J.; Adu, S.A.; Babine, E.; Pechanec, V. Land use—Land cover change and soil-gully erosion relationships: A study of Nanka, South-Eastern Nigeria using geoinformatics. In Dynamics in GIscience; Springer: Cham, Switzerland, 2017; pp. 305–319. [Google Scholar] [CrossRef]
  6. Rawat, J.; Kumar, M. Monitoring land use/cover change using remote sensing and GIS techniques: A case study of Hawalbagh block, district Almora, Uttarakhand, India. Egypt. J. Remote Sens. Space Sci. 2015, 18, 77–84. [Google Scholar] [CrossRef] [Green Version]
  7. Betrua, T.; Tolera, M.; Sahleb, K.; Kassac, H. Trends and drivers of land use/land cover change in Western Ethiopia. Appl. Geogr. 2019, 104, 83–93. [Google Scholar] [CrossRef]
  8. Schürmann, A.; Kleemann, J.; Fürst, C.; Teucher, M. Assessing the relationship between land tenure issues and land cover changes around the Arabuko Sokoke Forest in Kenya. Land Use Policy 2020, 95, 104625. [Google Scholar] [CrossRef]
  9. Valentin, C.; Poesen, J.; Li, Y. Gully erosion: Impacts, factors and control. Catena 2005, 63, 132–153. [Google Scholar] [CrossRef]
  10. Taruvinga, K. Gully Mapping Using Remote Sensing: Case Study in Kwazulu Natal, South Africa. Ph.D. Thesis, University of Waterloo, Waterloo, ON, Canada, 2008. Available online: https://uwspace.uwaterloo.ca/bitstream/handle/10012/4216/Kanyadzo_Taruvinga_Thesis.pdf?sequence=1 (accessed on 14 October 2021).
  11. Bouaziz, M.; Wijaya, A.; Gloaguen, R. Remote gully erosion mapping using aster data and geomorphologic analysis in the Main Ethiopian Rift. Geo-Spat. Inf. Sci. 2011, 14, 246–254. [Google Scholar] [CrossRef]
  12. Desprats, J.; Raclot, D.; Rousseau, M.; Cerdan, O.; Garcin, M.; Le Bissonnais, Y.; Ben Slimane, A.; Fouche, J.; Monfort-Climent, D. Mapping linear erosion features using high and very high resolution satellite imagery. Land Degrad. Dev. 2013, 24, 22–32. [Google Scholar] [CrossRef]
  13. Karami, A.; Khoorani, A.; Noohegar, A.; Shamsi, S.R.F.; Moosavi, V. Gully erosion mapping using object-based and pixel-based image classification methods. Environ. Eng. Geosci. 2015, 21, 101–110. [Google Scholar] [CrossRef]
  14. Pourghasemi, H.R.; Yousefi, S.; Kornejady, A.; Cerdà, A. Performance assessment of individual and ensemble data-mining techniques for gully erosion modeling. Sci. Total Environ. 2017, 609, 764–775. [Google Scholar] [CrossRef] [Green Version]
  15. Rasool, R.; Fayaz, A.; Shafiq, M.U.; Singh, H.; Ahmed, P. Land use land cover change in Kashmir Himalaya: Linking remote sensing with an indicator based DPSIR approach. Ecol. Indic. 2021, 125, 107447. [Google Scholar] [CrossRef]
  16. OCDE. OCDE Core Set of Indicators for Environmental Performance Reviews; OCDE: Paris, France, 1993. [Google Scholar]
  17. EEA. The Changing Faces of Europe’s Coastal Areas; Number No. 6 in EEA Report; European Environment Agency: Copenhagen, Denmark, 2006. [Google Scholar]
  18. Desta, H.; Fetene, A. Land-use and land-cover change in Lake Ziway watershed of the Ethiopian Central Rift Valley Region and its environmental impacts. Land Use Policy 2020, 96, 104682. [Google Scholar] [CrossRef]
  19. Hamza, M. Projet de Développement Agricole du Gouvernorat de Kairouan (Ressources en eau); Rapp. Tech. D.G.R.E.: Tunis, Tunisia, 2006; p. 90. [Google Scholar]
  20. Bouzaiane, S.; Lafforgue, A. Monographie hydrologique des oueds Zeroud et Merguellil; D.G.R.E-ORSTOM: Tunis, Tunisia, 1986; p. 1058. [Google Scholar]
  21. Haddaji, F.; Messoudi, N.; Saidani, M.; Selmi, T.; Saidi, I.; Braiki, H. Diagnostic Territorial, Participative et Systémique: Zone d’Intervention de Kairouan—El Alaa; Rapp Int.: Tunis, Tunisia, 2020; 70p. [Google Scholar]
  22. MARHP. Projet de Développement Agricole du Gouvernorat de Kairouan; Rapport Interne; Ministère de L’agriculture, des Ressources Hydrauliques et de la Pêche: Tunis, Tunisia, 1985. [Google Scholar]
  23. Burte, J.; Leauthaud, C.; Augusseaux, X. Guide Audit Territorial Participatif Programme d’Adaptation au changement Climatique des Territoires vulnérables de Tunisie (PACTE); Rapp. Expertise, CIRAD: Montpellier, France, 2017; 100p. [Google Scholar]
  24. Leduc, L.; Beji, R.; Calvez, R. Les Ressources en eau du Barrage d’el Haouareb et des Nappes Adjacentes, Vallée du Merguellil, Tunisie Centrale. In Proceedings of the Séminaire PCSI “Gestion intégrée de l’eau au sein d’un bassin versant”, session Présentation détaillée d’un terrain du Sud, la gestion du bassin du Merguellil (Tunisie), Montpellier, France, 2–3 December 2003. [Google Scholar]
  25. Kingumbi, A.; Besbes, M.; Bourges, J.; Garetta, P. Évaluation des transferts entre barrage et aquifères par la méthode de bilan d’une retenue en zone semi-aride. Cas d’El Haouareb en Tunisie centrale. Rev. des Sci. de l’eau 2004, 17, 213–225. [Google Scholar] [CrossRef] [Green Version]
  26. Khemiri, K.; Jebari, S.; Berndtsson, R.; Maalel, K. Is climate or direct human influence responsible for discharge decrease in the Tunisian Merguellil Basin? Water 2021, 13, 2748. [Google Scholar] [CrossRef]
  27. Ogilvie, A.; Le Goulven, P.; LeDuc, C.; Calvez, R.; Mulligan, M. Réponse hydrologique d’un bassin semi-aride aux événements pluviométriques et aménagements de versant (bassin du Merguellil, Tunisie centrale). Hydrol. Sci. J. 2016, 61, 441–453. [Google Scholar] [CrossRef] [Green Version]
  28. INM. Annuaire Météorologique de la Tunisie; Publication de l’Institut National de la Météorologie: Tunis, Tunisia, 2018. [Google Scholar]
  29. Latham, J.; Cumani, R.; Rosati, I.; Bloise, M. FAO Global Land Cover (GLCSHARE) Beta-Release 1.0 Database; Division Land and Water: Rome, Italy, 2014. [Google Scholar]
  30. DGF. Direction Générale des Forêts, Inventaire des Forêts par Télédétection—Résultat du Deuxième Inventaire Forestier et Pastoral National Ministère de la Défense Nationale, Ministère de l’Agriculture des Ressources Hydrauliques et de la Pêche et Ministère de l’Enseignement Supérieur et de la Recherche Scientifique; CNUDST: Tunis, Tunisia, 2010; 195p. [Google Scholar]
  31. PR-OSCAR. Projet—Zone D’intervention El Ala; Rapport Interne INRGREF: Tunis, Tunisia, 2019. [Google Scholar]
  32. Zhu, L. The Institutional Environment for B2B E-Commerce Adoption. Ph.D. Thesis, University of Arizona, Tucson, AZ, USA, 2008; 320p. [Google Scholar]
  33. Nguyen, T.C.; Nguyen, P.; Nguyen, Q.P.; Phan, T.M.H. Application of DPSIR framework to access environmental impact of white limestone mining and processing in Luc Yen, Yen Bai province. J. Vietnam. Environ. 2018, 9, 235–239. [Google Scholar] [CrossRef]
  34. Tastle, W.J.; Wierman, M.J. Consensus and dissention: A measure of ordinal dispersion. Int. J. Approx. Reason. 2007, 45, 531–545. [Google Scholar] [CrossRef] [Green Version]
  35. Yule, G.U.; Pearson, K. Early Statistical Papers; University Press: Cambridge, UK, 1948. [Google Scholar]
  36. Awuh, M.E.; Japhets, P.O.; Officha, M.C.; Okolie, A.O.; Enete, I.C. A Correlation Analysis of the Relationship between Land Use and Land Cover/Land Surface Temperature in Abuja Municipal, FCT, Nigeria. J. Geogr. Inf. Syst. 2019, 11, 44–55. [Google Scholar] [CrossRef] [Green Version]
  37. Shao, Z.; Fu, H.; Fu, P.; Yin, L. Mapping Urban Impervious Surface by Fusing Optical and SAR Data at the Decision Level. Remote Sens. 2016, 8, 945. [Google Scholar] [CrossRef] [Green Version]
  38. PIF. Programme d’Investissement Forestier. In Plan d’Investissement; MARHP: Ariana, Tunisia, 2016. [Google Scholar]
  39. GIZ. Etude de la filière des céréales dans le Gouvernorat du Kairouan-Projet. In Promotion de l’Agriculture Durable et du Développement rural-Filière Céréales Dans le Gouvernorat de Kairouan; Rapport Final; Deutsche Gesellschaft für Internationale Zusammenarbeit (GIZ) GmbH MARHP: Ariana, Tunisia, 2014; 45p. [Google Scholar]
  40. Khemiri, K.; Jebari, S. Étude comparative de deux modèles d’évaluation de l’érosion hydrique RUSLE et MUSLE dans les bassins versants du semi-aride Tunisien. Cah. Agric. 2021, 30, 7. [Google Scholar] [CrossRef]
  41. Turner, A. Population priorities: The challenge of continued rapid population growth. Philos. Trans. R. Soc. Lond. B Biol. Sci. 2009, 364, 2977–2984. [Google Scholar] [CrossRef]
  42. INS. Institut National de la Statistique-Recensement Général de la Population et de l’Habitat-Tunisie; Rapport Interne; INS: Tunis, Tunisia, 2014. [Google Scholar]
  43. INS. Institut National de la Statistique-Recensement Général de la Population et de l’habitat-Tunisie; Rapport Interne; INS: Tunis, Tunisia, 2016. [Google Scholar]
  44. Jouini, M. Evaluation Environnementale des Pratiques Agricoles et des Aménagements de Conservation par ACV: Cas du Bassin Versant Merguellil de la Tunisie Centrale. Ph.D. Thesis, Agro—Montpellier Sup. Agro. Institut—Nat. Agr. of Tunisia, Tunis, Tunisia, 2019. [Google Scholar]
  45. UNFCCC. United Nations Climate Change. Annual Report. 2019. Available online: https://unfccc.int/sites/default/files/resource/unfccc_annual_report_2019.pdf (accessed on 5 October 2021).
  46. Jebari, S.; Berndtsson, R.; Bahri, A.; Boufaroua, M. Spatial soil loss risk and reservoir siltation in semi-arid Tunisia. Hydrol. Sci. J. 2010, 55, 121–137. [Google Scholar] [CrossRef]
  47. Mantyka-Pringle, C.S.; Visconti, P.; Di Marco, M.; Martin, T.; Rondinini, C.; Rhodes, J. Climate change modifies risk of global biodiversity loss due to land-cover change. Biol. Conserv. 2015, 187, 103–111. [Google Scholar] [CrossRef] [Green Version]
  48. Eitelberg, D.A.; van Vliet, J.; Doelman, J.C.; Stehfest, E.; Verburg, P. Demand for biodiversity protection and carbon storage as drivers of global land change scenarios. Glob. Environ. Chang. 2016, 40, 101–111. [Google Scholar] [CrossRef]
  49. Masum, K.M.; Mansor, A.; Sah, S.A.M.; Lim, H.S. Effect of differential forest management on land-use change (LUC) in a tropical hill forest of Malaysia. J. Environ. Manag. 2017, 200, 468–474. [Google Scholar] [CrossRef] [PubMed]
  50. Géroudet, C. Démographie et Histoire Agraire du Bassin Versant du Merguellil—Partie I: Histoire du Peuplement et Histoire Agraire; IInstitute national agronomique Paris-Grignon: Paris, France; Institue de Recherche Pour le Développement et International Water Management Institue IRD & IWMI: Anand, India, 2004; Available online: http://www.iwmi.cgiar.org/assessment/files/word/ProjectDocuments/Merguellil/partie2.pdf (accessed on 5 October 2021).
  51. GIZ. Rapport National—EZ Trifft Wissenschaft. Deutsche Gesellschaft für Internationale Zusammenarbeit (GIZ) GmbH Sektorvorhaben Politikberatungim Bereich Wasser. 2007. Available online: https://wocatpedia.net/images/2/2e/GIZ_%282007%29_EZ_trifft_Wissenschaft.pdf (accessed on 5 October 2021).
  52. MARHP. Projet de Développement Agricole du Gouvernorat de Kairouan (Ressources en eau); Rapp. Tech.; Ministère de l’Agriculture, des Ressources Hydrauliques et de la pêche: Tunis, Tunisia, 2017. [Google Scholar]
Figure 1. Location and topography of the experimental Merguellil Wadi Basin.
Land 11 00138 g001
Figure 2. Schematic of the methodological approach adopted for the diachronic analysis of the dynamics of land use/land cover for the study period (1976–2016).
Land 11 00138 g002
Figure 3. Adaptation of the DPSIR framework to land use/land cover change.
Land 11 00138 g003
Figure 4. Relationship between probability of occurrence for driving forces of arboriculture culture dynamics as perceived by households.
Land 11 00138 g004
Figure 5. Land use/land cover maps for the Merguellil Wadi Basin for (a) 1976, (b) 1996, and (c) 2016.
Land 11 00138 g005
Figure 6. Adaptation of the DPSIR framework to household experienced land use changes in the Merguellil Wadi Basin.
Land 11 00138 g006
Table 1. Different classes adopted for the diachronic study of land use degradation [29].
Land Use/Land Cover ClassDescription
Cultivated areaHerbaceous crops; woody crops; mixed herbaceous and woody crops.
ForestTree plants with a cover of 10% or more.
Other types of plants (shrubs and/or grasses) may be present, even at a higher density than trees.
ArboricultureWoody plants (trees and/or shrubs) may be present assuming that their cover is less than 10%.
RangelandNatural herbaceous plants (grasslands, steppes) with a cover of 10% or more,
independent of different human and/or animal activities, such as grazing.
Bare landNatural abiotic surfaces (bare soil, sand, rocks, etc.) where natural vegetation is absent or almost absent (cover less than 2%).
Wetland areaFlooded areas, salt water, fresh water (sebkha, wadi course).
Table 2. Confusion matrix for 1976, 1996, and 2016.
1976
Land use/Land coverCultivated areaForestArboricultureRangelandBare landWetland areaTotal
Cultivated area22544163142052568
Forest1218704450572339
Arboriculture5149219501761232756
Rangeland476024610970431862
Bare land863762221485001548
Wetland area823838459058406403
Total34242380341014888565918
1996
Land use/Land coverCultivated areaForestArboricultureRangelandBare landWetland areaTotal
Cultivated area26822515209002931
Forest1124760274631905228
Arboriculture103415719263501003477
Rangeland32518310123266402999
Bare land14231901120294
Wetland area04006390400
Total4295516023252948211390
2016
Land use/Land coverCultivated areaForestArboricultureRangelandBare landWetland areaTotal
Cultivated area341231212125103727
Forest9545821274704815
Arboriculture5575162162416303654
Rangeland7625152316283902850
Bare land1556001220283
Wetland area2151212379500830
Total4510517223262971290890
Table 3. Accuracy assessments for land use/land cover classification (%) (1976–2016).
Land Use/Land Cover197619962016
User
Accuracy (U)
Producer
Accuracy (P)
User
Accuracy (U)
Producer
Accuracy (P)
User
Accuracy (U)
Producer
Accuracy (P)
Cultivated area87.765.891.562.491.575.6
Forest79.978.591.192.295.288.6
Arboriculture70.757.255.482.859.292.9
Rangeland58.973.777.578.981.377.9
Bare land54.999.338.153.143.142.1
Wetland area91.298.697.5100.060.256.2
Overall accuracy79.379.581.1
Kappa coefficient0.740.730.75
Table 4. Land use/land cover for the Merguellil Wadi Basin for 1976, 1996, and 2016.
Land Use/Land CoverArea (%)
197619962016
Cultivated area6.318.425.9
Forest13.226.116.0
Arboriculture22.029.722.7
Rangeland30.621.930.0
Bare land9.10.64.2
Wetland area18.73.31.2
Table 5. Percentage change between 1976, 1996, and 2016 for the land use/land cover classification.
Land Use/Land CoverChange (%)
1976–19961996–20161976–2016
Cultivated area12.17.519.6
Forest12.9−10.12.8
Arboriculture7.6−7.00.7
Rangeland−8.78.1−0.6
Bare soil−8.53.6−4.9
Wetland area−15.40.6−17.5
Table 6. Driving forces of land use/land cover changes as perceived by households.
Indicator/Selection Probability in Likert Scale12345WmeanWstdCnS(X)
Population growth0.030.040.090.430.414.162.570.60
Creation of douars0.100.160.170.080.483.672.720.27
Climate change0.010.030.090.090.784.592.300.68
Creation of agricultural plots0.050.010.040.030.864.652.170.62
Land fragmentation0.020.430.170.260.123.033.070.34
Mountainous and rugged topography0.030.140.080.060.694.232.420.37
Table 7. Pressures perceived by household due to land use/land cover changes.
Indicator/Selection Probability in Likert Scale12345WmeanWstdCnS(X)
Overexploitation of forest resources0.030.030.080.360.494.242.550.58
Intensification of tree crops0.060.160.130.280.383.762.790.46
Intensification of the establishment of irrigated areas0.010.040.070.080.804.622.260.67
Overexploitation of fossil water resources0.070.050.090.280.524.122.600.54
Evolution of livestock farming0.030.110.070.360.434.062.620.55
Table 8. States perceived by households due to land use/land cover changes.
Indicator/Selection Probability in Likert Scale12345WmeanWstdCnS(X)
Water erosion0.010.030.020.080.864.752.180.70
Development of gullies0.010.020.030.100.844.762.200.74
Loss of soil fertility0.050.040.010.070.834.582.220.56
Degradation of forest cover0.010.020.030.060.884.782.150.76
Rainfall variability0.010.010.010.060.914.862.110.74
Table 9. Impacts of land use/land cover changes perceived by households.
Indicator/Selection Probability in Likert Scale12345WmeanWstdCnS(X)
Off-farm employment0.010.010.020.030.944.882.070.73
Unemployment0.000.000.000.030.974.972.040.78
Rural exodus and migration0.010.010.030.070.894.822.140.74
Poverty0.010.010.010.020.964.912.050.75
Degradation of water and soil resources0.010.010.010.060.914.862.110.74
Table 10. Responses by households due to land use/land cover changes.
Indicator/Selection Probability in Likert Scale12345WmeanWstdCnS(X)
Investment in land use planning0.010.020.030.170.784.692.310.76
Planting aid0.010.010.020.090.874.812.170.75
Allocation of land ownership0.030.050.040.070.804.552.260.58
Marketing of production0.010.010.020.120.844.782.210.78
Table 11. Determination coefficient (R2) for LULC types of culture and the probability of occurrence for the DPSIR approach of LULC types of culture dynamics as perceived by households.
LULC/DPSIR ApproachDriving ForcesPressuresStatesImpactsResponses
Cultivated area0.80.670.940.970.84
Forest0.740.720.660.870.91
Arboriculture0.720.450.760.740.96
Rangeland0.740.870.70.920.67
Bare land0.880.750.970.650.95
Wetland area0.730.510.440.780.7
Publisher’s Note: MDPI stays neutral with regard to jurisdictional claims in published maps and institutional affiliations.