Article

Interaction Relationship between Urbanization and Land Use Multifunctionality: Evidence from Han River Basin, China

1
School of Public Administration, Huazhong Agriculture University, Wuhan 430070, China
2
Department of City and Regional Planning, University of North Carolina at Chapel Hill, Chapel Hill, NC 27599-3140, USA
*
Author to whom correspondence should be addressed.
Land 2021, 10(9), 938; https://doi.org/10.3390/land10090938
Submission received: 5 August 2021 / Revised: 29 August 2021 / Accepted: 3 September 2021 / Published: 6 September 2021
(This article belongs to the Special Issue Efficient Land Use and Sustainable Urban Development)

Abstract

:
Coordinating the interaction between urbanization and land use multifunctionality (LUMF) is of great significance in regional sustainable development. This article explores the interaction relationship between urbanization and LUMF in the Han River Basin (HRB) of China from 2000 to 2018. We used the combination weighting method, coupling coordination degree model, and geographic detector method to examine the coupling relationship and internal mechanism between urbanization and LUMF. The results showed that (1) there exists a significant correlation between urbanization and LUMF, the coupling coordination degree of each county displayed an upward trend throughout the research period, and the whole region has a radiation effect of central cities; (2) from the perspective of the internal mechanism of urbanization demand and the LUMF supply, we found that social urbanization demand is the primary demand for LUMF, while the town living function is the main supply of LUMF for urbanization, which means social urbanization has more influence than economic and population urbanization on LUMF, and the town living function has greater decisive power than agricultural production function and ecological function on urbanization; and (3) the supply and demand-influencing factors between urbanization and LUMF in each sub-region are different, and the upstream is more susceptible to determinants than the midstream and downstream because of the worse natural resource endowment. In conclusion, the critical finding provides not only guidance to understand the relationship between urbanization and LUMF but also suggests that the government should adapt to local conditions when formulating regional development planning.

1. Introduction

Urbanization is a complicated process of social and economic development [1]. Different disciplines have different interpretations of urbanization. Demography defines urbanization as the process of transforming rural populations into urban populations [2]. Economics defines urbanization as a process of change in the industrial structure [3], industrialization occurs ahead of urbanization and promotes urbanization [4]. Ecology believes that the process of urbanization is the evolution of the ecosystem. Sociologists define urbanization from the perspective of social relations and organizational changes [5]. In recent years, rapid urbanization has brought a number of problems to regional sustainable development; the increase in GDP per capita and financial development has a negative effect on the environment [6], such as occupied cultivated land, resource shortage, and especially the increased scarcity of land resources [7,8]. With socioeconomic development, the ability of human beings to organize and transform land resources has improved continuously [9]. At the same time, land provides various products and services for humans through human needs [10]. The ability to provide private or public services and products through different land-use types is called land use function [11]. The diversification of urbanization development goals leads to diversified land use behaviors, so land use multifunctionality (LUMF) has become an inevitable choice for regional sustainable development [12]. The view that the changes of land use function are important factors in rapid urbanization has become a worldwide consensus [13]. Thus, research on the interaction between urbanization and land use is of great significance to regional sustainable development and improving land use management.
The LUMF concept evolved from the notion of agriculture multifunctionality. It regards all land use types as an organic whole that provides the products and services for humans within a certain area [14]. Although different scholars have different understandings of the connotation of LUMF, they have basically reached a consensus on its essential characteristics, that is, the goal of LUMF is to meet human demands for various products and services, with land not only providing material products for humans but also including non-material requirements, such as environmental, economic, cultural, and other functions [15,16,17]. According to previous research, the evaluation system of LUMF is mainly constructed from two aspects: one is economy, society, and the environment [18,19], and the other is production, ecology, and living functions [20]. Based on these two classifications, scholars have expanded many other classification systems according to the characteristics of the research area [21]; for example, Tao [22] divided the LUMF into five functional classifications: production function, supply function, ecological function, safety guarantee function, and economic function.
The interaction between urbanization and LUMF belongs to the human–land system, which directly reflects the relationship of human demand for land and land supply for humans [23]. Land is a limited regional resource that represents the restriction of the natural environment on the development of urbanization [24]. However, urbanization not only has a strong intervention effect on the structure, function, and scarcity of land resources, but it also has various demands for land use functions, representing the transition of population, society, and ecological factors [25,26]. The interaction of the supply and demand between the two systems directly affects the realization of regional sustainable development [27]. Therefore, this paper proposes a research hypothesis that there is a significant correlation between urbanization and land use functions based on the theory of the human–land system. The human–land system is a huge system that integrates the two subsystems of “human” and “land” [24]. The “human” system mainly refers to human social activities, which consist of population development, economic development, and social development. The “land” system mainly refers to the natural environment elements and land resource elements, which including the production of resources, the living level of people, and environmental protection [28]. The main goal of the human–land system is to coordinate the human–land relationship, promote regional sustainable development [12], and provide a practical theoretical basis for regional planning and development.
To study the interaction between two systems, the coupling coordination degree model (CCDM) is a widely used approach [29]. This model was recently introduced to measure the nonlinear relationship between the ecological environment and urbanization, such as energy–environment efficiency and urbanization [30], ecological and economic coordination in metropolitan areas [31], air environment and urbanization [32], and even geological hazards and urbanization [33]. Studies have shown that urbanization and land use function exist in an interaction relationship. On one hand, LUMF promotes land use efficiently and sustainably, improves urbanization quality, and enhances the ability of land to meet human needs [34]. On the other hand, urbanization activities stimulate demand for LUMF, such as infrastructure construction, ecological environment maintenance, and human entertainment [18]. However, the development of urbanization and LUMF are discussed separately from the view of supply and demand in most existing literature, and the study of the interaction between LUMF and urbanization is lacking, so determining how to satisfy the increasing demands of humans through multifunctional land use in the process of urbanization can not only help ease the conflict between humans and land but also promote regional sustainable development. Furthermore, as urbanization and LUMF varies markedly between different cities, the internal mechanism of the two systems is still unclear. In order to further explore the interaction between the two systems, this study used the geographic detector to analyze how the internal factors of one system affect the other from the view of supply and demand. The geographical detector model was applied to explore the spatial differentiation between urbanization and LUMF. The geographical detector model describes the spatial differentiation and determination of various factors through spatial stratification heterogeneity [35], and it has the advantage of overcoming excessive assumptions and collinearity compared with traditional statistical analysis methods [36]. In addition, this method can provide a higher level of explanatory capability, but it does not require a linear relationship between independent and dependent variables [37]. Therefore, the geographical detector can be effectively used to study the determinants of spatial heterogeneity between urbanization and LUMF.
To implement the interaction between urbanization and LUMF, this paper first constructed an urbanization and LUMF system in the Han River Basin (HRB) from 2000 to 2018 to study the temporal and spatial trends of urbanization and LUMF. Second, the CCDM was used to explore the coupling effect between the two systems in the HRB. Finally, the geographical detector model was applied to analyze the internal mechanism of urbanization and LUMF from the perspective of supply and demand. The experience of the HRB can provide a reference for other similar developing countries.
This article is organized as follows: Part 2 describes the study area and conceptual framework of the interaction relationship between urbanization and LUMF. Part 3 shows the data and methods used. Part 4 examines the relationship of the coupling and effect mechanism between urbanization and LUMF. Part 5 is a discussion about the relationship between urbanization and LUMF. Part 6 outlines the main conclusions.

2. Study Area and Data Source
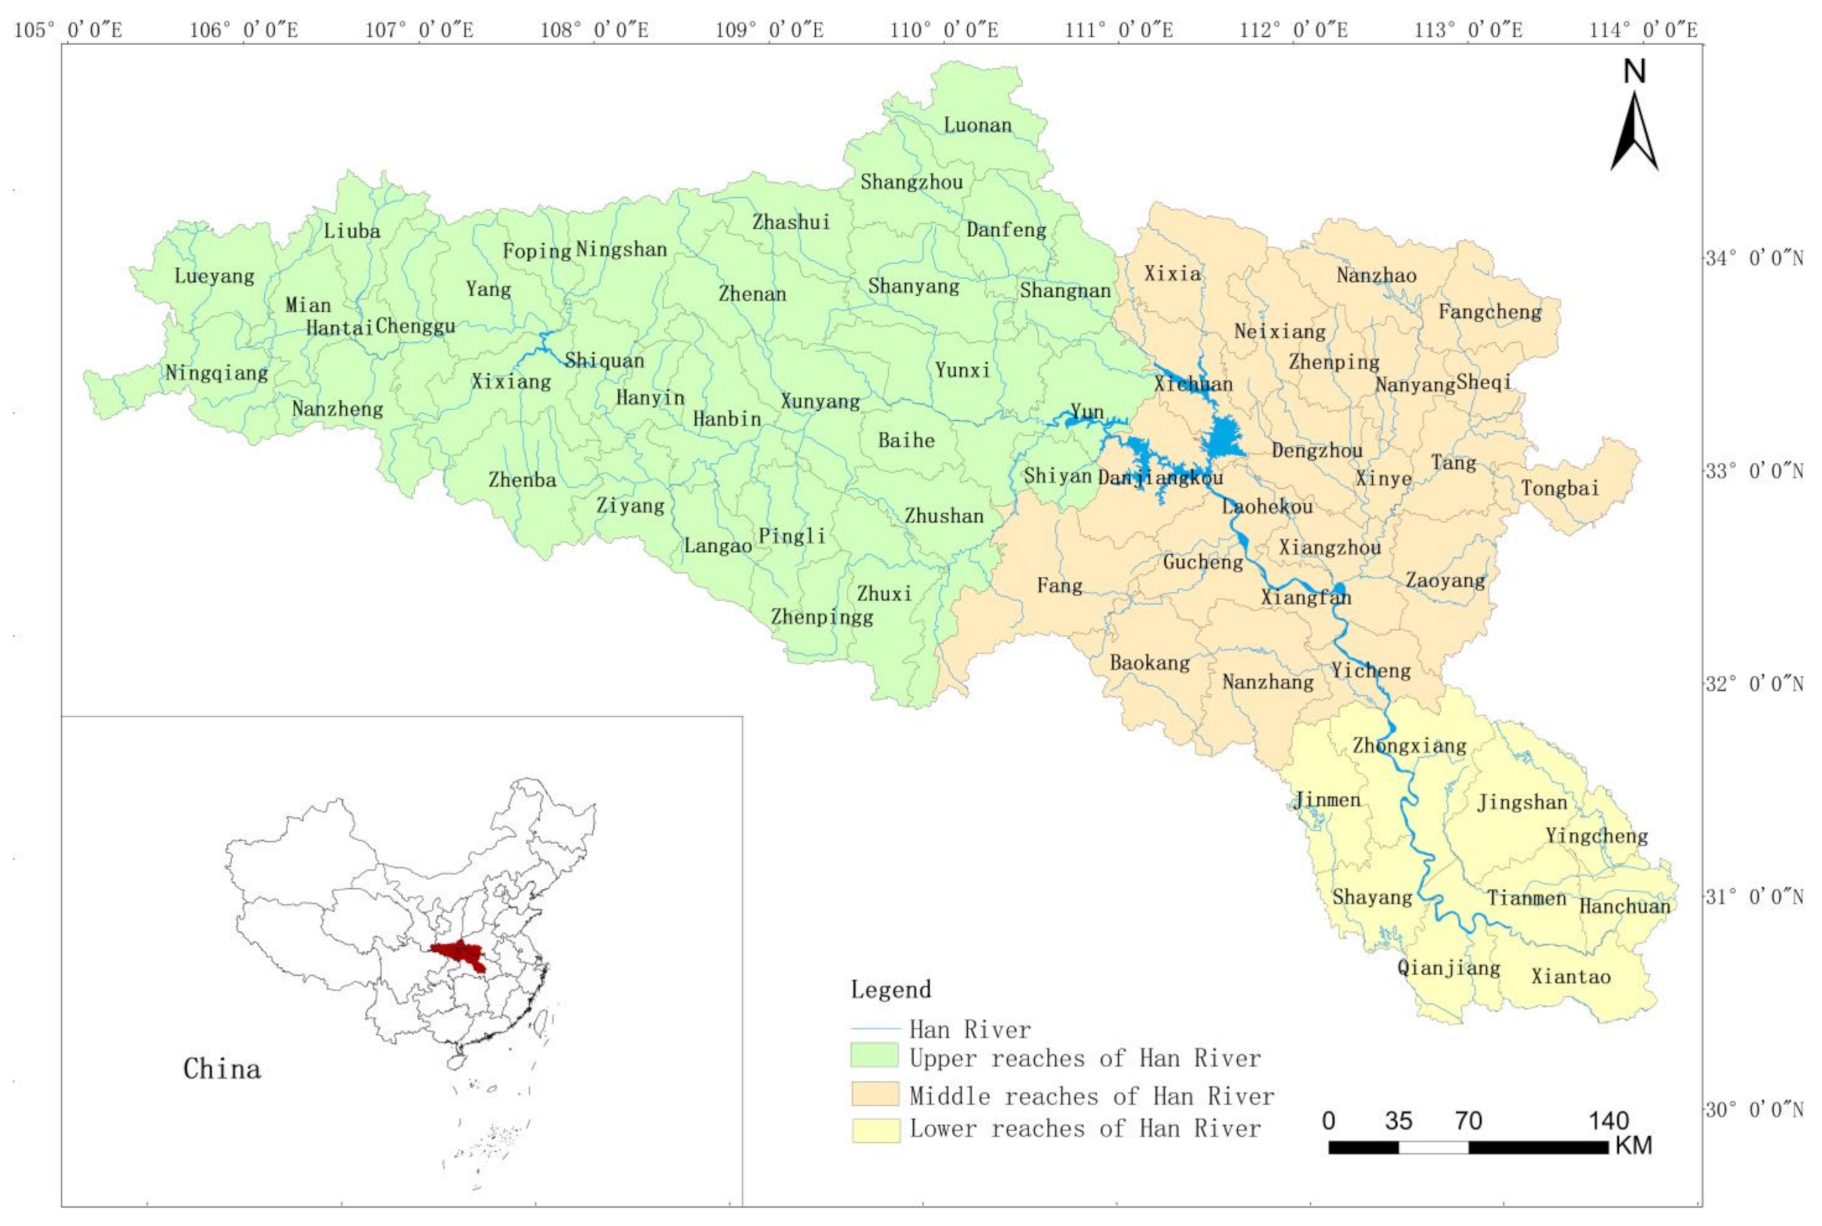
2.1. Study Area

This study selected the Han River Basin (HRB) as the research area. As a typical ecologically fragile area and area of concentrated poverty in China, the contradiction between economic development and environmental protection in the HRB is more serious compared with other regions. The HRB is located at 30°05′ N–34°25′ N and 105°30′ E–114°00′ E, which is located in the middle of China. As the largest tributary of the Yangtze River, the Han River flows through 64 counties in the Shaanxi, Henan, and Hubei provinces, with a total length of approximately 1532 km and a watershed area of 15.9 ×   10 4   km 2 , the specific location is shown in Figure 1. The whole watershed is divided into three parts: the upstream part is a mountain area, and the land type is mainly forest land and grassland; the midstream part contains hilly basins, where the land types are mainly forest land and cultivated land; and the downstream part is a plains area, where the land use type is mainly cultivated land. The diverse topography in the HRB makes the natural resources distinct and the economic development greatly unbalanced. Furthermore, the HRB is a concentrated area of impoverished counties in China, and it is also a national first-level water source protection zone, which has an important strategic position in the ecological environment. The urgent requirements of economic development are in serious conflict with environmental protection. Facing these challenges, the Chinese government began to seek a new type of urbanization starting in 2012; the new urbanization emphasizes that economic development and ecological security should be placed at an equally important position. With the contradiction becoming increasingly acute between human and land use in the HRB, analyzing the interaction between urbanization and LUMF is of great strategic significance to promote regional sustainable development.

2.2. Data Source

The main data used in this article are shown in Table 1. The socioeconomic statistical data was obtained from China’s County Statistical Yearbooks. Land use/land cover map was acquired from the remote sensing images of Landsat 5 TM in 2000, 2005, and 2010 and Landsat 8 OLI in 2018; then, ENVI 5.1 was used for manual interpretation to obtain a land-use classification map with a spatial resolution of 30 m. Land use was classified into six types: arable land, grassland, construction land, forestland, water area, and bare land. In order to eliminate the impact of inflation, economic data were deflated using the consumer price index (CPI), which is a constant price based on 2000. All data were unified to the WGS_1984_UTM_Zone_49N projected coordinate system and unified to a 30 m resolution before calculation. These datasets were used to construct the indices identified in Table 2.

3. Methods

This section first establishes an evaluation system for urbanization and LUMF, and calculates the weight of each indicator through entropy method and principal component analysis, then obtains the composite index of the two systems. Next, the CCDM was applied to explore the coupling relationship between urbanization and LUMF. Finally, the geographical detector was applied to analyze the spatial differentiation of the two systems.

3.1. Index System

To study the interaction relationship between urbanization and LUMF in the HRB, we constructed a composite index system for urbanization and LUMF in accordance with the following criteria: (a) ease of obtaining data; (b) the most accepted indicators based on the citation; and (c) ability to cover multiple dimensions of the urbanization and LUMF systems.
Urbanization development has caused a reduction in arable land and an increase in the pollution of the ecological environment. According to the understanding of the urbanization demand for land use in the HRB, this paper constructed an evaluation system of urbanization from the three aspects of population urbanization, economy urbanization, and society urbanization. Specifically, population urbanization is the basis of urbanization development; it refers to the process of transforming agricultural populations into non-agricultural populations and is usually represented by the population urbanization rate. Economic urbanization is the core of the urbanization process; it shows the conversion of agricultural activities to non-agricultural activities and the improvement in the urban economy, including secondary and tertiary industry output value, real GDP per capita, local government revenue per capita, and fixed-asset investment per capita. Social urbanization is the key to measuring the quality of urbanization development. It refers to changes in people’s lifestyles and traditional consumption concepts, which assist with changes in resource utilization and environmental protection [38], and it consists of the average salary of employees, total retail sales of consumer goods per capita, disposable income ratio of urban and rural residents, number of beds in hospitals and health centers, and highway density.
LUMF refers to the ability of the land to provide private or public services and products to humans through different land-use types [39]. The diversification of social and economic development goals leads to diversified land use functions. Under the background of rapid urbanization, the LUMF system often includes three functions: agricultural production function, town living function, and ecological maintain function [40]. Specifically, the agricultural production function is a foundation of the land-use system related to providing various agricultural and industrial products for humans, which includes food output per capita, per capita gross output value of agriculture, forestry, animal husbandry and fisheries, and cultivated land area per capita. Town living function is the core function to maintain human consumption, housing, employment, and infrastructure construction. It includes GDP per unit area, industry employee per unit area, and government expenditure per unit area. Ecological function refers to the function that mainly undertakes ecological services and ecosystem maintenance, including carbon stock, soil erosion, and forest cover rate.
This article used the data shown in Table 1 to quantitatively calculate the composite indices of urbanization and LUMF in the HRB from 2000 to 2018. Among them, soil erosion was calculated by the RUSLE model [41] and carbon stock was obtained by the INVEST model [42]. The indicators are shown in Table 2.

3.2. Index Weight Setting and Score Calculation

3.2.1. Data Standardization

Because of the differences in the dimensions of each selected indicator, we used the range standardization method to transform the indicators into dimensionless values, as shown in Equations (1) and (2):
Positive indicator:
Z ij = ( x i j m i n x i ) ( m a x x i m i n x i )
Negative indicator:
Z ij = m a x x i x i j ( m a x x i m i n x i )
In the formula, x ij denotes the initial value of the ith indicators in the jth counties from 2000–2018, i = (1, 2, ……, 19), j = (1, 2, ……, 64); z i j represents the standardized value of x ij ; and min x i and max x i are the minimum value and maximum value of the ith indicators of n (n = 64) counties, respectively. After standardization, all index values were in the range of [0, 1].

3.2.2. Weight Calculation

Index weights have an important influence on the evaluation of comprehensive assessment. The entropy weight method is an objective weighting method based on the degree of dispersion of index values, and it is used worldwide to obtain weights. The greater the dispersion of the index, the larger its weight is. However, in the general evaluation index system, there may be some correlation between various indices. Therefore, the traditional entropy weight method has the problem of repeated weighting, which leads to deviations in the evaluation results [43,44]. The principal component analysis method converts multiple indicators of the original data into a few comprehensive indicators, removes data redundancy and correlation, and increases the role of the main component. However, in the process of variable dimensionality reduction, the original variable is blurred [45,46]. In actual applications, there are often many special data that can cause the obtained weights to be very different from people’s expectations. Thus, we need to combine weighting methods to calculate the weight.
This article used two methods to calculate the weights separately, and the final weight is the average value of the two methods. After trial calculations, we found that the combination of the two methods could reduce the absolute impact of a single method on the weight of a certain index and improve the accuracy of the calculation results. The weight results are shown in Table 2.
(1)
The entropy method
First, we calculated the proportion of the ith indicator to the jth counties, where n represents the total number of counties:
p i j = Z i j j = 1 n Z i j
Second, we calculated the entropy value for the ith indicator:
e i = 1 ln n j = 1 n p i j ln 1 p i j
Finally, we calculated the weight for the ith indicator, where m represents the total number of indicators:
w i e = 1 e i i = 1 m 1 e i
The indicator’s weight value is in the range of [0, 1], and the higher the weight value, the more important the indicator is in the entire evaluation system. Conversely, the lower the weight value, the weaker the importance of the indicator.
(2)
Principal component analysis
Principal component analysis is a method that replaces the original indicators with a set of irrelevant composite indicators to achieve dimension reduction of the indicators while retaining the information of the original parameters.
First, we used the Kaiser–Meyer–Olkin (KMO) test to test whether the data were appropriate for using principal component analysis and found that the KMO value was above 0.5, meaning that the original variable was suitable for principal component analysis.
Then, we established the original variable matrix X. The matrix can be expressed as X = x i j m × n , where x i j denotes the ith indicators of county j. In addition, we used SPSS software to calculate the correlation coefficient matrix (R) of a standardization matrix Z and obtained the eigenvalues λ i i = 1 , 2 , 3 , , p , the eigenvectors E i i = 1 , 2 , 3 , , p , and the initial factor loading matrix f i j i = 1 , 2 , , p ; j = 1 , 2 , , k . The calculation method is shown in Equations (6)–(9):
Z = Z i j = z 11 z 12 z 1 j z 21 z 21 z 2 j z i 1 z i 1 z i j
f i j = Z i j j = 1 n Z i j
R = 1 p 1 Z Z
λ E R = 0
where Z, R, E, and λ denote the standardization matrix, correlation coefficient matrix, eigenvector matrix, and eigenvalue matrix, respectively.
Next, we established the equations of the principal components and calculate their values. We selected eigenvectors with a cumulative contribution rate of more than 80%; among them, urbanization selected the first three eigenvectors, and LUMF selected the first four eigenvectors. Finally, we calculated the weight of the urbanization and LUMF indicators separately. The steps to calculate the index weights of the two systems were the same, the only difference is that the urbanization system had three principal components, k = 3, and the LUMF system had four principal components, k = 4; the equations are as follows:
F k = a 1 k Z 1 + a 2 k Z 2 + + a p k Z p
a i j = f i j λ i
w i = j = 1 k a i j × E i
In the above formulas, F k is the composite score of the k-th principal component; a i j describes the factor scoring matrix of factor i in the j-th principal component, that is, the contribution of the i-th factor to the j-th principal component. w i is the weight of factor i. Because the sum of the weights of all indicators is 1, the final indicator weights ( w i p ) need to be normalized on the basis of the comprehensive model.
w i p = w i i = 1 p w i
(3)
Composite index
Finally, the composite index of urbanization and LUMF can be calculated by the following equation:
U j o r   L j   = i = 1 m w i e + w i p 2 Z i j
where U j and L j represent the composite indices of urbanization and LUMF, respectively. w i e + w i p 2 is the average weight obtained by the entropy weight method and the principal component analysis method, and Z i j is the normalized value.

3.3. Coupling Coordination Degree Model (CCDM)

The principle of CCDM is to detect the interaction relationship between two or more systems and was originally identified by physicists [47]. This study constructed a CCDM of urbanization and LUMF in the HRB, and the equations are as follows:
C = U j × L j U j + L j 2 2 1 2
T = α U j + β L j
D = C T
where C denotes the coupling degree of urbanization and LUMF; U j and L j are the composite index of urbanization and LUMF, respectively; T is the coordination degree of urbanization and LUMF; and α and β are the contribution rate of urbanization and LUMF, which are both 0.5 because urbanization and LUMF are equally important in this paper. D denotes the coupling coordination degree (CCD) between urbanization and LUMF, the value range is [0, 1]. It is necessary to note that if both the index of urbanization and the LUMF are high, the CCD of the two systems will be high. Otherwise, the CCD will be low.
On the basis of existing research [48], the CCD of urbanization and LUMF were divided into 5 levels (see Table 3).

3.4. Geographical Detector

The geographical detectors were adopted to detect the internal influence of the interaction between urbanization and LUMF from the perspective of supply and demand. The geographical detector consists of ecological, risk, interaction, and factor detectors. This research primarily utilized the factor detector, which is used to analyze the formation mechanism of the spatial distribution differences and determine what drives it [49,50]. The internal mechanism relationship between urbanization and LUMF was expressed by a q-value, and the formula is as follows:
q = 1 1 N σ 2 h = 1 L N h σ h 2
where q is the value of the explanatory force of the independent variable on the dependent variable and the q-value is a range from 0 to 1, with 0 indicating no correlation between the dependent variable and the independent variable, meaning that the dependent variable is likely to be randomly distributed in each subcategory of the explanatory variables. q = 1 indicates that the dependent variable can be completely explained by the independent variables, where the dependent variable tends to be the same without any variance within each subcategory of the explanatory variables. The larger the value, the stronger the interpretation ability. h (h = 1, 2, …, L) is the stratification of the independent variables. Following references [51] and trial calculations, the natural breakpoint method of ArcGIS software was used to divide the population urbanization rate, food output per capita, and soil erosion into 6 layers and the other independent variables into 7 layers. N h and N are the number of samples in layer h and in the whole area, respectively, and σ h 2 and σ 2 are the variance of the dependent variable of layer h and of the whole area, respectively. In this paper, with the use of GeoDetector software, the internal mechanism of urbanization indicators on the LUMF index and the internal mechanism of LUMF indicators on the urbanization index were detected separately.

4. Results

4.1. Spatiotemporal Change of Urbanization and LUMF

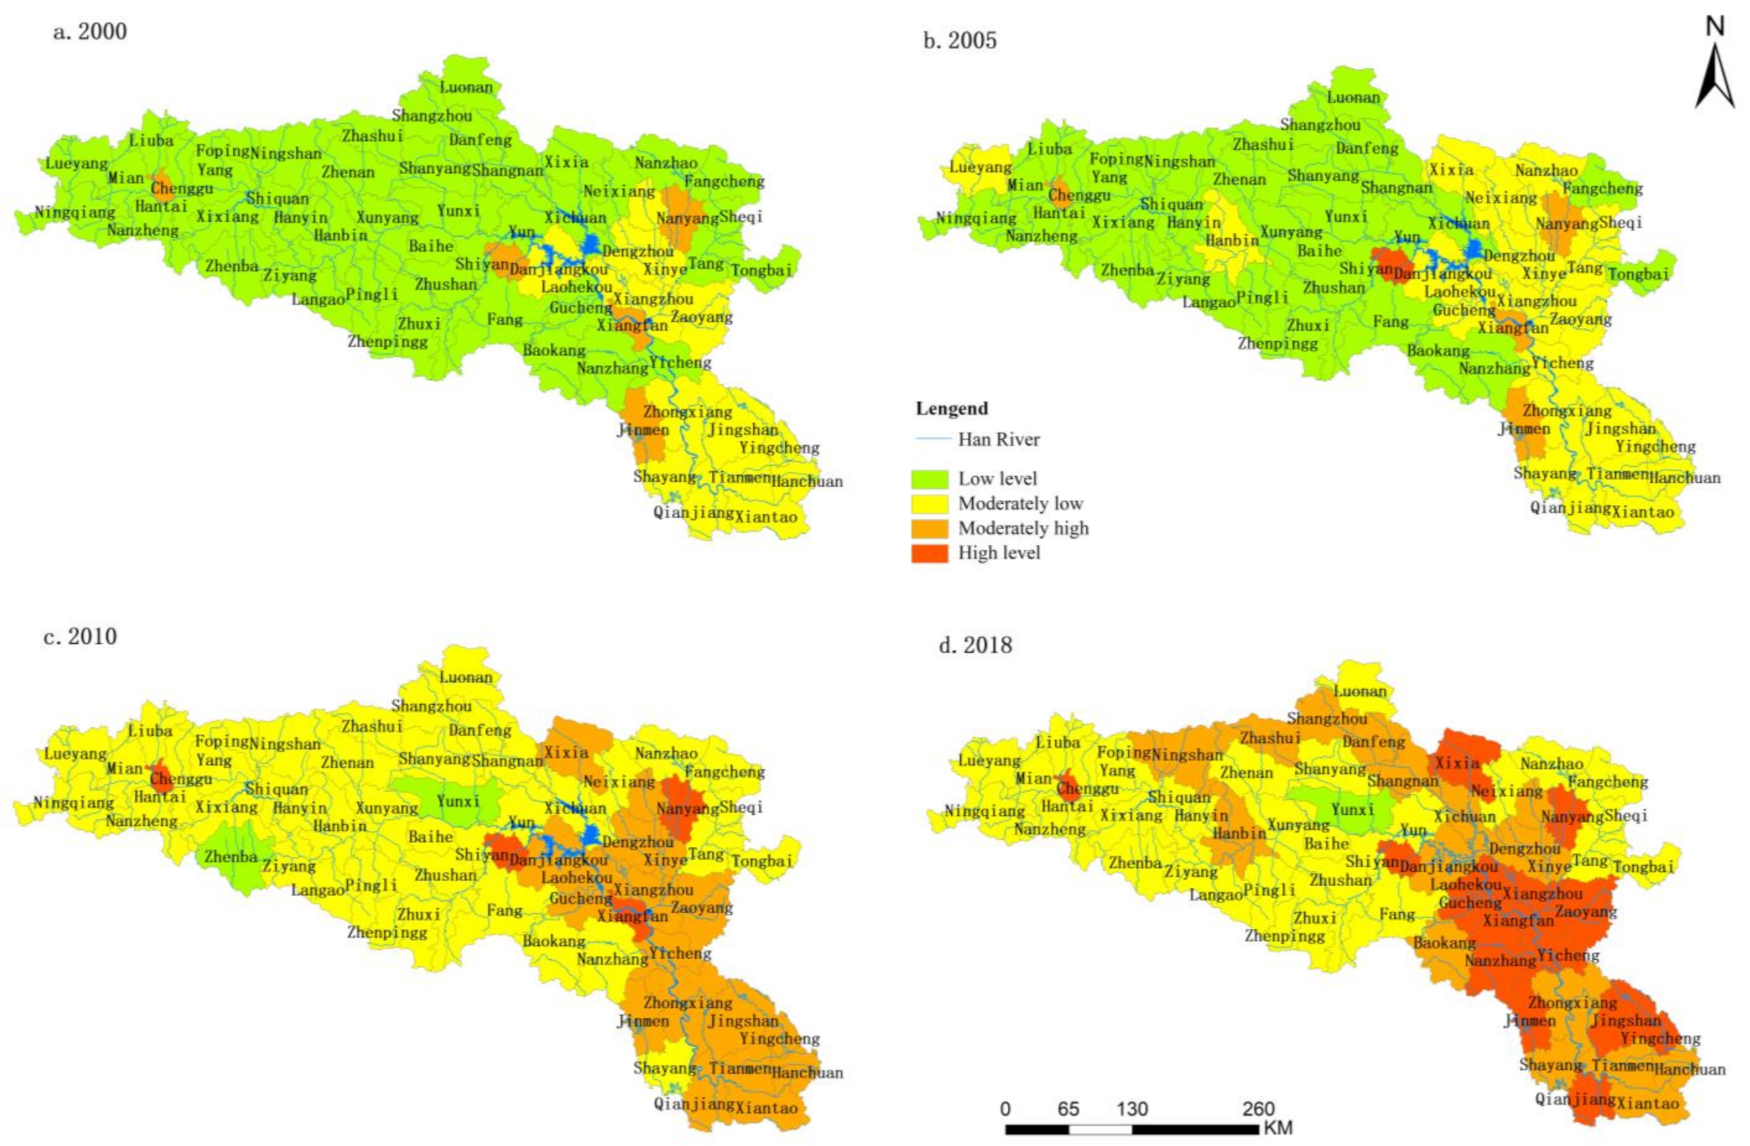
4.1.1. Spatiotemporal Change of Urbanization

We calculated the urbanization composite index of 64 counties in the HRB. The whole basin was divided into three parts: upstream, midstream, and downstream. Figure 2 shows the spatiotemporal change trends of the urbanization composite index in the HRB from 2000 to 2018. From the perspective of temporal change, we can see the urbanization index of each region has increased constantly over the research period, and the urbanization index of the three regions ranked from high to low was downstream > midstream > upstream.
From the perspective of spatial change, the urbanization composite index was divided into four categories using the natural breakpoint method, which are low-level, moderately low-level, moderately high-level, and high-level. Figure 3 also displays the spatial difference in the urbanization index from 2000 to 2018. Overall, the comprehensive level of urbanization presented a spatial distribution characteristic of low in the west and high in the east. In 2000, the HRB was dominated by low-level and moderately low-level urbanization, except for Shiyan, Xiangyang, Nanyang, and Hantai, which are municipal districts that stayed at the moderately high level. Although the urbanization index among the 64 counties increased, the character of spatial distribution in 2005 was similar to that in 2000. Specifically, the low-level areas were mainly located in the upstream region of the HRB, and the moderately low-level areas were distributed in the midstream and downstream regions. In 2010, the urbanization composite index greatly improved. In the upper reaches of the HRB, 96% of counties improved from low levels to moderately lower levels, and 64% of counties improved from moderately low levels to moderately high levels in the midstream and downstream areas of the HRB. In 2018, the urbanization level increased significantly; the midstream and downstream areas mostly stayed in moderately high- or high-level states. Only Yunxi county stayed in a low-level state because Yunxi is located in a mountainous area with harsh weather conditions, and the agriculture and industry developed slowly with the restrictions of natural conditions, so the urbanization quality was worse than that of other counties.
The overall quality of urbanization in the HRB was relatively low, and upstream urbanization quality was lower than midstream and downstream urbanization quality. The reason is that the upstream region of the HRB has a high altitude and rugged mountains, so there is backward industrial development, inconvenient transportation, and a low urbanization quality composite index. By contrast, the middle and lower reaches of the HRB have good soil and water conditions. Furthermore, Shiyan and Xiangyang are important automobile production bases in China, and the industrial development of these areas drives urban development and radiates to surrounding counties and districts. Therefore, the urbanization development level of the middle and lower reaches is higher than that of the upper reaches. Furthermore, the areas where the urbanization composite index increased significantly were all municipal districts of each city, such as Shiyan, Xiangyang, Nanyang, and Hantai; these areas are core regions of the economy and technology of the city, and they not only have excellent resources but also have a strong driving force of central cities, so the composite index of urbanization quality is relatively high.

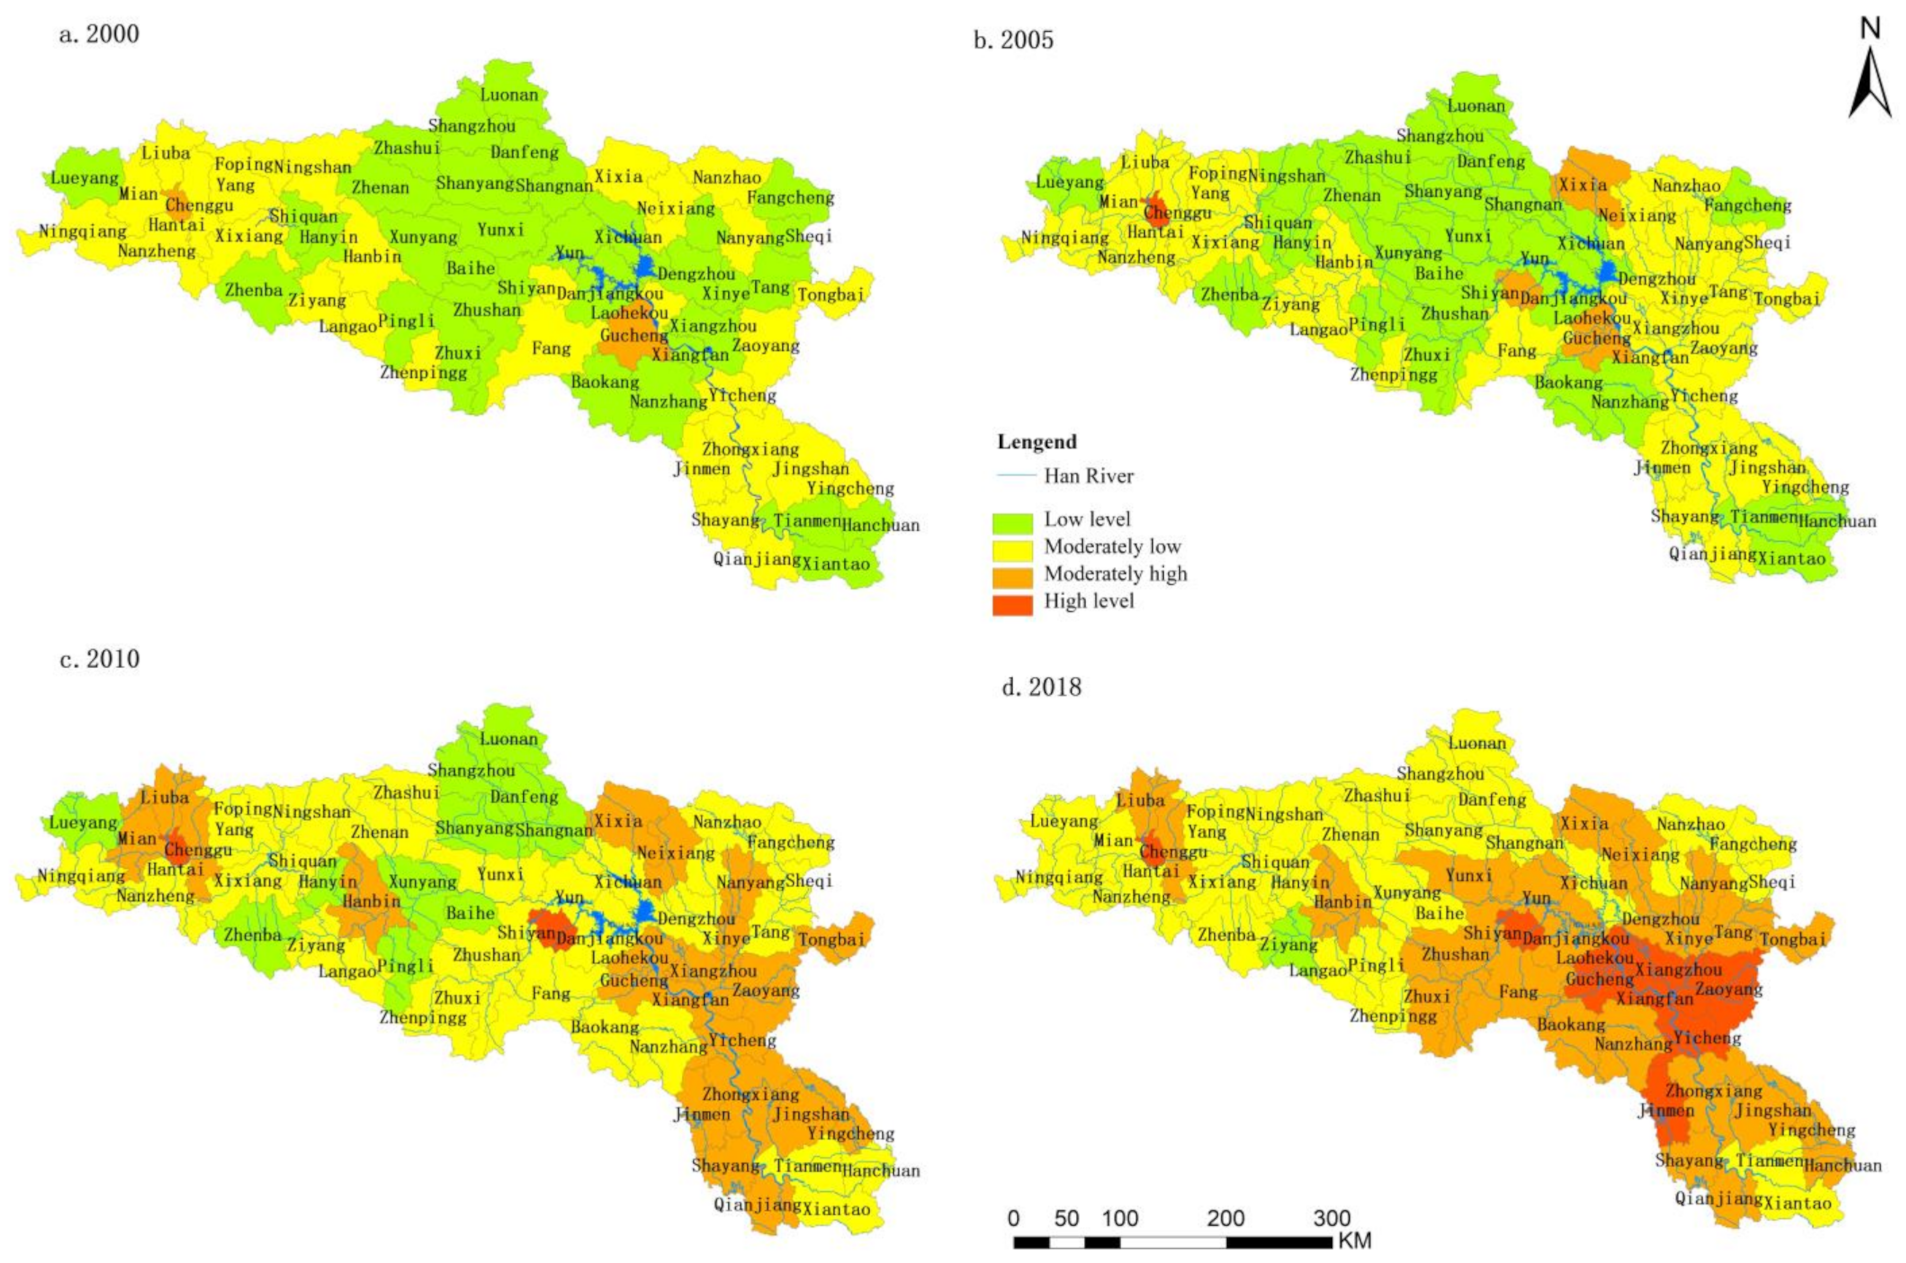
4.1.2. Spatiotemporal Change of LUMF

Figure 3 shows the spatiotemporal change trends of the LUMF composite index in the HRB from 2000 to 2018. From the perspective of temporal change, the LUMF index of each region increased during the study period and was significantly different between the three regions. The ranking of the three regions by the LUMF composite index was the same as the ranking by urbanization composite index, with an order from high to low of downstream, midstream, and upstream.
From the perspective of spatial change, using the natural breakpoint method to divide the LUMF index into four categories, the meaning of each category was the same as that of the urbanization index. The spatial pattern of LUMF was diversified, with the characteristics of low levels in the upstream region of the HRB and high levels in the midstream and downstream regions of the HRB, which was consistent with the spatial distribution of urbanization. In 2000, the HRB was dominated by low-level and moderately low-level LUMF, except Hantai and Gucheng Counties, which stayed in the moderately high-level state. Compared with that in 2000, the LUMF index in 2005 changed slightly. In 2010, the high-value area of the LUMF index showed a spatial diffusion trend from Hantai, Shiyan, and Gucheng to their peripheral areas. This diffusion trend was especially obvious in 2018. This means that the LUMF index has a radiation effect from the central city in the HRB, indicating that the LUMF index of the central city is high, which also drives the index of the surrounding areas to high levels, such as Hantai, Shiyan, and Gucheng.
The composite index of LUMF in the upper reaches of the HRB was lower than that in the middle and lower reaches. This is because the topography of the upper reaches of the HRB is mostly mountainous and hilly, and the natural conditions restricted agricultural production function and town living function. The middle and lower reaches of the HRB are plains areas, with developed transportation, rapid economic development, and high quality of cultivated land, so the composite index is higher than that upstream.

4.2. Coupling Analysis of Urbanization and LUMF

Through the above analysis of the temporal and spatial changes of urbanization and LUMF, we found that the two systems’ temporal and spatial changes have similar characteristics. On the temporal scale, urbanization and LUMF both showed an upward trend during the research period. On the spatial scale, they both displayed a spatial distribution characteristic of low values in the west and high values in the east. These phenomena indicate a synergy relationship between the two systems, so the coupling coordination degree model (CCDM) was applied to explore the interaction between urbanization and LUMF.

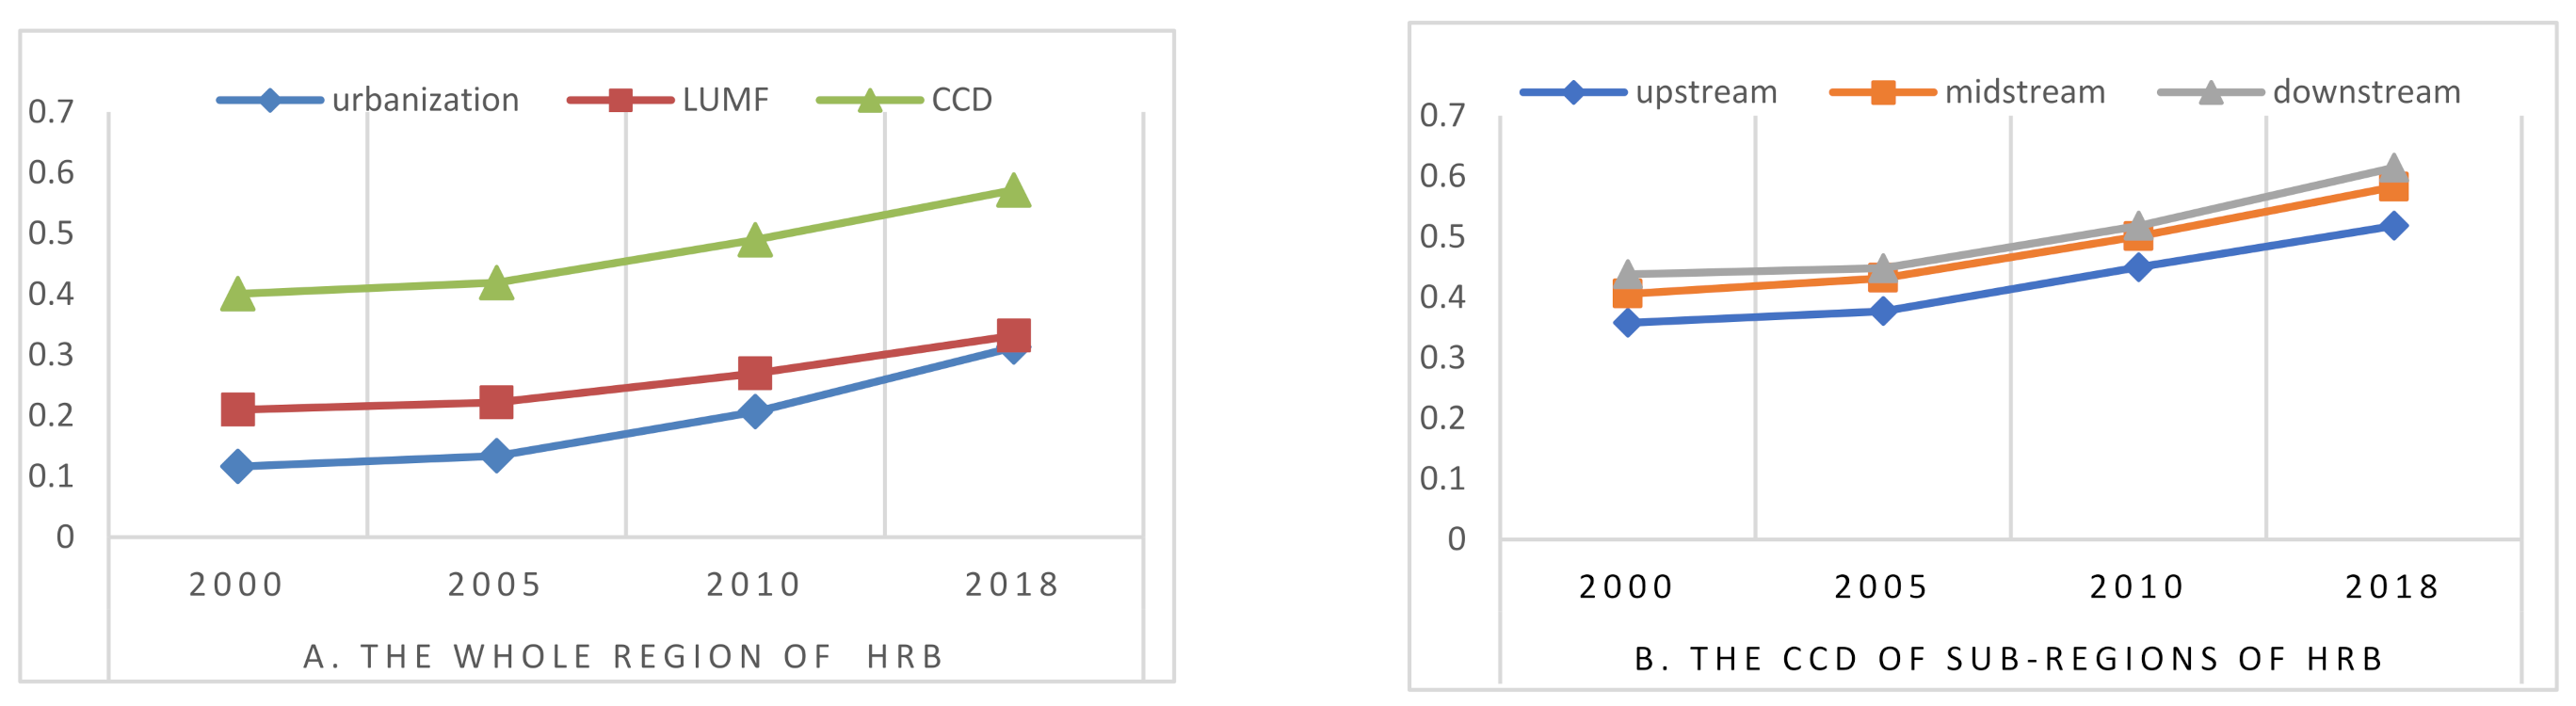
4.2.1. Temporal Characteristics of the Coupling Coordination between Urbanization and LUMF

Figure 4A shows the temporal change trends of urbanization, LUMF, and coupling coordination degree (CCD) of 64 counties in the HRB. The composite level of urbanization and LUMF both increased from 2000 to 2018, but the urbanization index was smaller than the LUMF index. Overall, the average CCD of urbanization and LUMF increased from 0.3856 to 0.5167 over the study period. This indicates that the CCD had an upward trend, and the development toward a new orderly structure was under the influence of each other. The coordination degree of each region is shown in detail in Figure 4B. We can see that the CCD of the three regions has increased but with a spatial difference. Moreover, the ranked order from high to low was the same as that for urbanization and LUMF, that is, downstream > midstream > upstream. The two systems represent a synchronous growth trend, indicating that the coupling relationship between urbanization and LUMF is developing in the right direction.

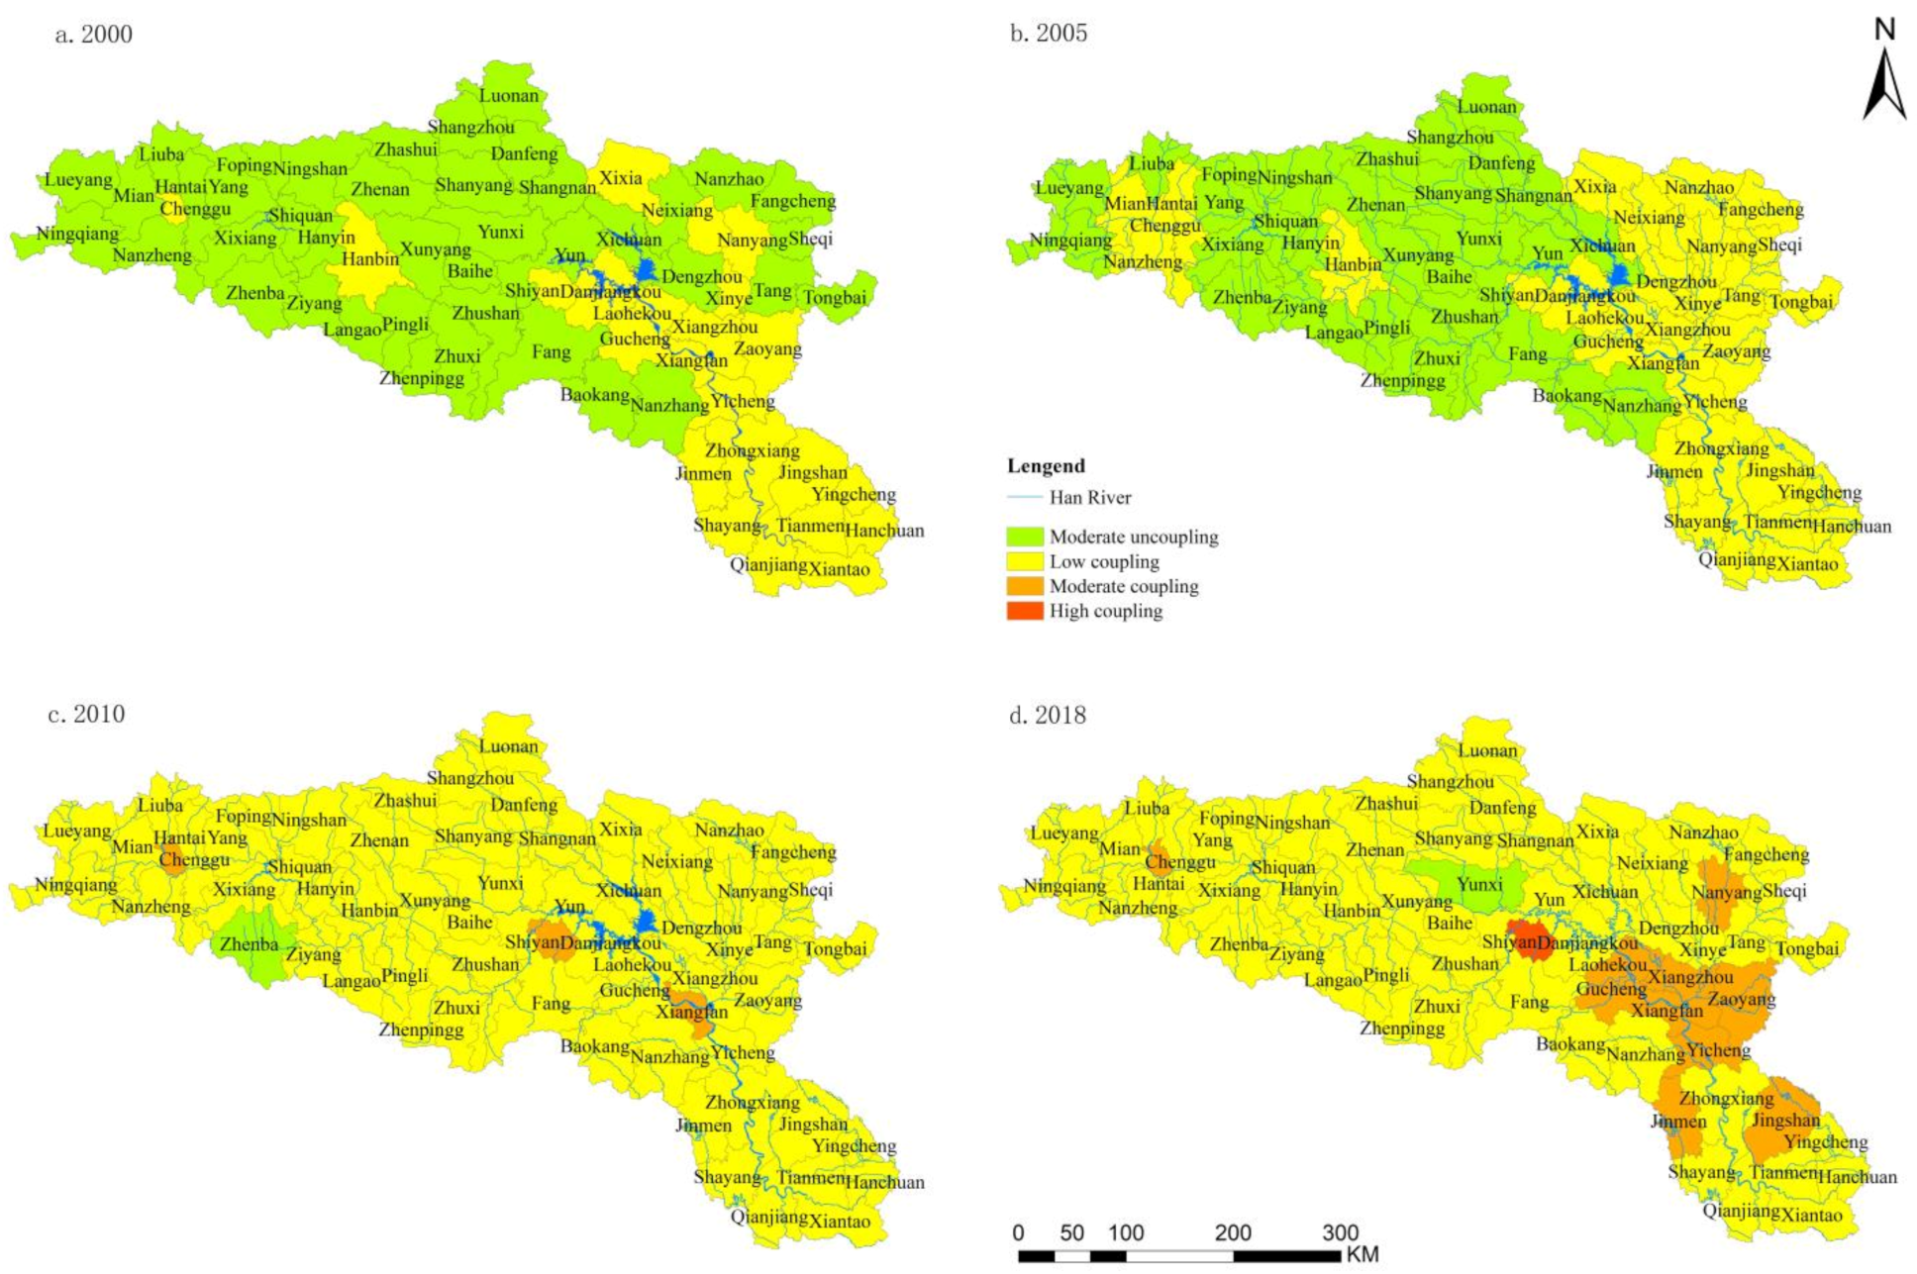
4.2.2. The Spatial Characteristics of the Coupling Coordination between Urbanization and LUMF

The CCD was divided into five classes based on Table 3. Figure 5 shows the spatial change trend of the CCD between urbanization and LUMF. The overall state ranged from moderate uncoupling to high coupling, with values ranging from 0.2985 to 0.8579. Moreover, the spatial distribution of the CCD in the HRB was low in the west and high in the east.
According to the classification of the CCD between urbanization and LUMF in Table 3, we can see the coupling coordination degree was divided into four class. In 2000–2005, the degree of coupling coordination was dominated by moderate uncoupling and low coupling in the study area. The moderate uncoupling level was mostly distributed in the upper reaches of the HRB, and the low coupling level was distributed in the middle and lower reaches of the HRB. In 2010, the coupling coordination degree of the upstream region had significantly improved; most areas changed from moderate uncoupling to low coupling, except five counties, Luonan, Danfeng, Yunxi, Xunyang, and Zheba, where the economy is underdeveloped because of the limited natural conditions. Meanwhile, Xiangfan, Shiyan, and Hantai were the three counties with the highest degree of coupling coordination, with values of 0.6417, 0.6896, and 0.6071, respectively. The three areas are municipal jurisdictions with good economic conditions and a high level of multi-functional land use, so they have higher coupling coordination degrees. By 2018, 38.04% of counties in the middle and low reaches of the HRB had transformed from low coupling to moderate coupling. The highest coupling coordination degree was observed in Shiyan County with a value of 0.8659, which indicates a state of high coupling, and other areas reached states of low coupling.
In general, the coupling coordination degree of the upstream region was lower than that of the midstream and downstream regions, consistent with the spatial distribution of urbanization and LUMF, indicating that when the composite level of urbanization and LUMF are both high, the CCD is also high. On the contrary, when the levels of urbanization and LUMF are both low, or one is high and another is low, the CCD of the two systems will be low. Although the coordination level of the HRB is gradually increasing, the overall level is relatively low. Improvement in the coordination of urbanization and LUMF is necessary in the future.

4.3. Research on the Mechanism of Influence between Urbanization and LUMF

4.3.1. Exploring the Impact of Urbanization on LUMF from the Perspective of Demand

The development of urbanization has multiple demands for land use functions. Therefore, we took the composite index of LUMF as the dependent variable and the urbanization indicators as the independent variables to analyze how urbanization affects LUMF in the whole region and three sub-regions. Because of the similar coordination characteristics of urbanization and LUMF in the middle and lower reaches of the HRB, the two regions were combined and named “midstream–downstream” for analysis.
Table 4 reflects the demand effect of urbanization factors on LUMF. From the view of the whole stream, we can see that in population urbanization, the population density was significant at a level of 0.01, but the household registration urbanization rate was not significant, showing that the population density indicator can better reflect the demand effect of urbanization for LUMF. In economic urbanization, the real GDP per capita had a strong influence on LUMF (0.6316); other indicators had less influence on LUMF. In social urbanization, apart from the average salary of employees and highway density, which were not significant indicators, the other variables had different degrees of impact on the LUMF. Among them, the total retail sales of consumer goods per capita had the largest q-value of 0.7142, showing that this indicator can predominantly explain the spatial variability of LUMF. The impact of the number of beds in hospitals and health centers (0.5148) on LUMF was second only to the total retail sales of consumer goods per capita. The impact of the disposable income ratio of urban and rural residents on LUMF was weaker than those two indicators. Overall, in the urbanization demand for LUMF, we found that social urbanization had a more significant influence than population urbanization and economic urbanization on demand for LUMF.
From the sub-region perspective, we can see that in the upstream region of the HRB, only three indicators had a significant effect on LUMF, namely, population density, total retail sales of consumer goods per capita, and the number of beds in hospitals and health centers. The q-values of the three indicators were all larger than 0.8, which demonstrates that the three indicators have an extensive contribution to the development of LUMF. Because of the limitation of natural conditions in the upstream region, the inadequate local government revenue and fixed-asset investment, and the large income gap between urban and rural areas, these indicators did not stimulate the multifunctional use of land. Nevertheless, when population density, total retail sales of consumer goods per capita, and the number of beds in hospitals and health centers increase, the demand of humans for land use also increases, and the increasing demand drives land for multifunctional use under the limited usable land in the upstream region. In the midstream–downstream region, only the real GDP per capita was significant for LUMF. A possible reason is that the midstream–downstream region has a concentrated population and promising economic and social conditions, and the land use functions are also diversified. If we want to promote multi-functional land use further, it can only be achieved by improving the regional economic level. When the economic level improves, the increase in demand for land will promote the LUMF.

4.3.2. Exploring the Impact of LUMF on Urbanization from the Perspective of Supply

As the carrier of urbanization, land provides multiple services to meet human survival needs, such as production, ecology, and living functions. We took the composite index of urbanization as the dependent variable and LUMF indicators as the independent variables to explore the supply effect of LUMF on urbanization.
Table 5 reflects the supply effect of LUMF on urbanization. From the view of the whole region, we can see that in the agricultural production function, the food output per capita did not significantly influence urbanization. The per capita gross output value of agriculture, forestry, animal husbandry and fisheries, and cultivated land area per capita significantly influenced urbanization, but their q-value was less than 0.5, indicating that these two indicators have a weak supply effect on urbanization. In respect to the town living function, the three factors of GDP per unit area, industry employee per unit area, and government expenditure per unit area were all significant at the level of 0.01. The q-value of the three indicators was more extensive than the others, meaning that the town living function had the most considerable impact on the supply effect of urbanization. In the ecological function, the q-value of the three indicators was smaller than that of the others and did not significantly influence urbanization, which means that the supply effect of ecological indicators on urbanization was not apparent. The results show that in the supply of LUMF to urbanization, the town living functions are the most explanatory factors for urbanization, followed by agricultural production supply, and the ecological function is the weakest supply to urbanization.
From the sub-region perspective, we can see that cultivated land area per capita, GDP per unit area, industry employees per unit area, and government expenditure per unit area had a significant influence on urbanization in the HRB upstream region. The undulating terrain caused severe soil erosion, weak agricultural production conditions, and slow development of secondary and tertiary industries in the HRB upstream region. Therefore, an increase in cultivated land and town living indicators can effectively solve these problems in the upstream region of the HRB. In the midstream–downstream region, there were no factors significant to urbanization, meaning that either the agricultural production function or town living function and ecological maintenance function were all in a good state. Hence, a change in these indicators has no significant influence on the development of urbanization in the middle and lower reaches.

5. Discussion

The interaction and coordination development of urbanization and LUMF is the key issue to realize the sustainable development of regions. LUMF is the accumulation of natural and man-made conditions on the effect of land use in historical processes; this means that the emergence of LUMF cannot be separated from two carriers, namely, the land supply and the needs of human society [12]. Incorporating urbanization and LUMF into the human–land system, urbanization development refers to human needs for the social, economic, and environmental functions of land resources. Land resources are the suppliers of various products and services for the development of urbanization [52,53]. With the rapid development of urbanization, the intensity of human demand for land resources continues to increase, and the conflict between urbanization and land use becomes more serious. LUMF is a great method to solve this problem by balancing the supply and demand of land resources [54]. This article provides a reference for the coordinated development of urbanization and land use on a regional scale.

5.1. Coupling Relationship of Urbanization and LUMF

In the coupling analysis of urbanization and LUMF, we found that the areas with the highest coordination values were distributed in the municipal jurisdictions, such as Shiyan, Xiangfan, Nanyang, and Hantai. The results show that the coordinated development of LUMF and urbanization in the HRB has a radiation effect from central cities, but the driving power of central cities to surrounding areas is different between locations. For example, in the upper reaches of the HRB, traditional agriculture is concentrated, and the development of secondary and tertiary industries is limited, so Hantai District has little radiation effect on the surrounding counties. By contrast, the middle and lower reaches of the HRB possess obvious advantages in agricultural production and industrial economy, so Shiyan, Xiangfan, Nanyang have strong driving effects on the surrounding areas.
In addition to the influence of natural conditions and economic indicators, policies are another important factor coordinating the development of urbanization and LUMF in the HRB. In the early period, the urbanization of the HRB only focused on economic development but ignored the quality of development, which caused serious environmental problems and hindered the development of urbanization. To tackle this, governments implemented ecological restoration policies in the HRB. Moreover, in 2017, the “Development Planning of Han River Ecological Economic Belt” proposed to build Xiangfan as a central city in the HRB and support Hantai, Xiangfan, Jingmen, and Nanyang to develop high-tech industries. These policies strengthened the role of ecological and economic functions in the process of urbanization, contributing to LUMF and urbanization showing a simultaneous growth trend over time.
To guarantee the coordinated and sustainable development of urbanization and LUMF in the future, we recommend that policymakers should fully consider regional divergence and avoid creating one policy that applies to all regions. In areas with limited natural conditions, the government should increase investment in infrastructure and medical facilities, improve resource utilization efficiency, and strive to promote economic and urban development. In areas with better economic conditions, such as municipal districts, policymakers should make full use of the radiation effect of the central city, strengthen cooperation with surrounding areas, and place the economic development and ecological security in equally important positions to take advantage of multifunctional land use under the process of urbanization.

5.2. The Internal Influence of Urbanization and LUMF

With respect to the internal influence of urbanization and LUMF, this study found that each indicator’s decision-making power was quite different. In the urbanization demand for LUMF, the q-value of the midstream–downstream region was smaller than that of the upstream region. This is because urbanization and LUMF have a coordinated relationship; the urbanization level is a key factor promoting LUMF, and the urbanization level of the midstream–downstream region is better than that of the upstream region, making the urbanization of upstream areas more sensitive to LUMF than that of midstream–downstream areas. Similarly, LUMF in the upstream region is more sensitive to urbanization than that in the midstream–downstream region.
In the supply effect of LUMF on urbanization, the ecological maintenance function was not significant, meaning that the ecological function has less supply effect on urbanization. The HRB is an ecologically fragile area, and the ecological environment is greatly affected by human disturbance. In addition, the region is a concentrated area of poverty in China, and the development of urbanization mainly focused on economic development but ignored the ecological maintenance function, which caused severe environmental problems, such as soil erosion, water pollution. and ecological environment degradation. Therefore, the ecological supply to urbanization is not significant for urbanization. Additionally, the town living function indicators have more impact than ecological function and agricultural production function on the supply effect of urbanization. A possible reason is that the town living function is the ultimate goal of multi-functional land use urbanization, and it is achieved through the production and ecological functions.
The relationship between urbanization and LUMF in the upstream region is more susceptible to determining factors than that in the midstream and downstream regions. The upstream regions of the HRB are dominated by mountains and hills, with large undulations of land cover and serious soil erosion. Because of the barrier of mountains, communication between cities maintains a low efficiency, and urbanization and LUMF have a low coupling degree, so the entire system is vulnerable to external interference. By contrast, the middle and lower reaches of the HRB are part of the Jianghan Plain, where resources are abundant, agricultural production has advantageous conditions, and industrial and high-tech industries are relatively developed. Moreover, the downstream region is also adjacent to China’s central megacity, Wuhan, which has a strong radiation effect on the lower reaches of the HRB. These factors have jointly promoted the rapid development of urbanization, high land-use efficiency, and stable development of the human and land interaction in the middle and lower reaches of the HRB. It can be seen that the coordinated development of urbanization and LUMF plays a vital role in resisting external disturbances and realizing regional sustainable and stable development.

5.3. Limitations

This article proposed a new framework and effective methodology for studying the interaction between urbanization and LUMF, but there are still several limitations. (1) In terms of index selection, because the study area is at the county level and covers 64 counties, the data availability is restricted in the selection of indicators. (2) This article conducted research in the HRB, which contains ecologically fragile and poverty-intensive areas, and it is also an important ecological environment protection zone in China, so there is a large conflict between the urgent requirements of economic development and the realization of environmental protection goals. Therefore, the recommendations in the conclusion do not apply to all other regions, especially those with good conditions of natural resources and economic development. (3) The article studied the coupling coordination relationship between urbanization and LUMF and explored the internal influence mechanism of the two systems, but the influence factors of the coupling relationship have not been studied yet. Exploring which factors lead to the changes in the degree of coupling coordination between the two systems is important for future research on regional sustainable development.

6. Conclusions

In recent years, rapid urbanization has put land use under great pressure in the HRB. This paper aimed to explore the interaction between urbanization and LUMF. First, this article selected appropriate indices according to the regional characteristics of the HRB to construct an evaluation system of urbanization and LUMF. We integrated the entropy weight method and the principal component analysis method to calculate the index weight, making the results more comprehensive and accurate. Next, we used CCDM to test whether there was a coupling and coordination relationship between urbanization and LUMF. Furthermore, we explored the internal effect mechanism of urbanization and LUMF from the perspective of supply and demand. However, detailed analyses of the interaction between LUMF supply and urbanization demand are rare. Thus, this research can be considered a first attempt to gain a deeper understanding of the interaction between the two systems.
In the coupling analysis of urbanization and LUMF, we found that there was a significant and upward coupling relationship between the two systems, and the coupling coordination degree ranged from a moderate uncoupling state to a high coupling state, with the values of the upstream regions being lower than those in the midstream and downstream regions. Moreover, the highest coordination values were distributed in municipal jurisdictions, such as Shiyan, Xiangfan, Nanyang, and Hantai. In the internal mechanism analysis, we found that social urbanization demand was the primary demand for urbanization for LUMF. In addition to population and economic urbanization, social urbanization also warrants sufficient attention in the policy formulation of LUMF development, meaning that the development of urbanization pays more attention to quality rather than purely economic factors. In the supply effect of LUMF on urbanization, the town living function was the main supply, followed by agricultural production supply, and the ecological function was the weakest supply to urbanization. Moreover, because of different resource endowments, the sub-regions’ internal mechanisms showed different characteristics; the upstream region is more likely to be disturbed by human activities than the midstream and downstream regions.
In conclusion, there is a mutually reinforcing relationship between urbanization and LUMF. As the spatial carrier of urbanization development, land is an essential support for urbanization development, and the quality of urbanization development affects the change of land use function. The key finding provides guidance to increase ecological function supply and pay more attention to social urbanization demand in the HRB, which can improve the coordination of urbanization and LUMF. In general, the coordination of urbanization and LUMF in the upper reaches of the HRB deserves more attention. The government should increase capital and technology input, strengthen agricultural and industrial production efficiency in the HRB’s upstream regions, and improve cooperation and exchange among sub-regions. As an important ecological barrier and economic development area in central China, the Han River Ecological Economic Belt shoulders the task of ensuring national food security and promoting economic development in the central region. Studying the coordinated relationship between urbanization and LUMF in the HRB not only proposes new insights into the interactive effect between urbanization and LUMF but also contributes a guide to achieving sustainable development in other similar regions.

Author Contributions

Conceptualization, H.L. and Y.G.; methodology, Y.G.; software, Y.G.; validation, Y.G., H.L. and Y.S.; formal analysis, Y.G.; investigation, Y.G.; resources, Y.G.; data curation, Y.G.; writing—original draft preparation, Y.G.; writing—review and editing, Y.S. and Y.G.; visualization, Y.G.; supervision, H.L.; project administration, H.L.; funding acquisition, H.L. All authors have read and agreed to the published version of the manuscript.

Funding

This research was funded by the National Natural Science Foundation of China (No. 41871179) and supported by the Huazhong Agricultural University Scientific and Technological Self-Innovation Foundation (No. 2016RC014).

Institutional Review Board Statement

Not applicable.

Informed Consent Statement

Not applicable.

Data Availability Statement

The data used in this study mainly come from the China Statistical Yearbook and the online databases. I have listed in the Table 1, all my used data can be obtained by visiting these links.

Conflicts of Interest

The authors declare no conflict of interest.

References

  1. Friedmann, J. Four theses in the study of China’s urbanization. Int. J. Urban Reg. Res. 2006, 30, 440–451. [Google Scholar] [CrossRef]
  2. Xu, F.; Wang, Z.; Chi, G.; Zhang, Z. The impacts of population and agglomeration development on land use intensity: New evidence behind urbanization in China. Land Use Policy 2020, 95, 104639. [Google Scholar] [CrossRef]
  3. Hong, T.; Yu, N.; Mao, Z.; Zhang, S. Government-driven urbanisation and its impact on regional economic growth in China. Cities 2021, 117, 103299. [Google Scholar] [CrossRef]
  4. Luo, Y.; Xiang, P.; Wang, Y. Investigate the Relationship between Urbanization and Industrialization using a Coordination Model: A Case Study of China. Sustainability 2020, 12, 916. [Google Scholar] [CrossRef] [Green Version]
  5. Fan, W.; Wang, H.; Liu, Y.; Liu, H. Patio-temporal variation of coupling relationship between urbanization development and air quality: A case study of Shandong Province. J. Clean. Prod. 2020, 272, 122812. [Google Scholar] [CrossRef]
  6. Guo, K.; Li, S.; Wang, Z.; Shi, J.; Bai, J.; Cheng, J. Impact of Regional Green Development Strategy on Environmental Total Factor Productivity: Evidence from the Yangtze River Economic Belt, China. Int. J. Environ. Res. Public Heal. 2021, 18, 2496. [Google Scholar] [CrossRef]
  7. Wu, Y.; Zhang, X.; Shen, L. The impact of urbanization policy on land use change: A scenario analysis. Cities 2011, 28, 147–159. [Google Scholar] [CrossRef]
  8. Gong, J.; Liu, Y.; Chen, W. Land suitability evaluation for development using a matter-element model: A case study in Zengcheng, Guangzhou, China. Land Use Policy 2012, 29, 464–472. [Google Scholar] [CrossRef]
  9. You, H. Impact of urbanization on pollution-related agricultural input intensity in Hubei, China. Ecol. Indic. 2016, 62, 249–258. [Google Scholar] [CrossRef]
  10. Zhang, Y. Multiple-use forestry vs. forestland-use specialization revisited. For. Policy Econ. 2005, 7, 143–156. [Google Scholar] [CrossRef]
  11. Zhen, L.; Cao, S.; Wei, Y.; Xie, G.; Li, F. Land Use Functions: Conceptual Framework and Application for China. Resour. Sci. 2009, 31, 544–551. (In Chinese) [Google Scholar]
  12. Hermanns, T.; Helming, K.; König, H.J.; Schmidt, K.; Li, Q.; Faust, H. Sustainability impact assessment of peatland-use scenarios: Confronting land use supply with demand. Ecosyst. Serv. 2017, 26, 365–376. [Google Scholar] [CrossRef]
  13. Soja, E.W. Regional urbanization and third wave cities. City 2013, 17, 688–694. [Google Scholar] [CrossRef]
  14. Brown, I.; Castellazzi, M. Scenario analysis for regional decision-making on sustainable multifunctional land uses. Reg. Environ. Chang. 2014, 14, 1357–1371. [Google Scholar] [CrossRef]
  15. Reidsma, P.; König, H.J.; Feng, S.; Bezlepkina, I.; Nesheim, I.; Bonin, M.; Sghaier, M.; Purushothaman, S.; Sieber, S.; van Ittersum, M.; et al. Methods and tools for integrated assessment of land use policies on sustainable development in developing countries. Land Use Policy 2011, 28, 604–617. [Google Scholar] [CrossRef]
  16. Purushothaman, S.; Patil, S.; Francis, I.; König, H.J.; Reidsma, P.; Hegde, S. Participatory impact assessment of agricultural practices using the land use functions framework: Case study from India. Int. J. Biodivers. Sci. Ecosyst. Serv. Manag. 2012, 9, 2–12. [Google Scholar] [CrossRef]
  17. Du, G.M.; Sun, X.B.; Wang, J.Y. Spatiotemporal patterns of multi-functionality of land use in Northeast China. Prog. Geogr. 2016, 35, 232–244. [Google Scholar]
  18. Zhou, D.; Xu, J.; Lin, Z. Conflict or coordination? Assessing land use multi-functionalization using production-living-ecology analysis. Sci. Total. Environ. 2017, 577, 136–147. [Google Scholar] [CrossRef]
  19. De Rudolf, G. Function-analysis and Valuation as a Tool to Assess Land Use Conflicts in Planning for Sustainable, Multi-functional Landscapes. Landsc. Urban Plan. 2006, 75, 175–186. [Google Scholar]
  20. Liang, Z.; He, Z.; Zhou, X.; Powell, C.A.; Yang, Y.; He, L.M.; Stoffella, P.J. Impact of mixed land-use practices on the microbial water quality in a subtropical coastal watershed. Sci. Total. Environ. 2013, 449, 426–433. [Google Scholar] [CrossRef] [PubMed]
  21. Fleskens, L.; Duarte, F.; Eicher, I. A conceptual framework for the assessment of multiple functions of agroecosystems: A case study of Trás-os-Montes olive groves. J. Rural. Stud. 2009, 25, 141–155. [Google Scholar] [CrossRef] [Green Version]
  22. Tao, J.; Fu, M.; Sun, J.; Zheng, X.; Zhang, J.; Zhang, D. Multifunctional assessment and zoning of crop production system based on set pair analysis-A comparative study of 31 provincial regions in mainland China. Commun. Nonlinear Sci. Numer. Simul. 2014, 19, 1400–1416. [Google Scholar] [CrossRef]
  23. Zhou, D.; Xu, J.; Wang, L.; Lin, Z. Assessing urbanization quality using structure and function analyses: A case study of the urban agglomeration around HangzhouBay (UAHB), China. Habitat Int. 2015, 49, 165–176. [Google Scholar] [CrossRef]
  24. Wu, C.J. The core of study of geography: Man-land relationship areal system. Econ. Geograp. 1991, 11, 1–6. [Google Scholar]
  25. Delphin, S.; Escobedo, F.; Abd-Elrahman, A.; Cropper, W. Urbanization as a land use change driver of forest ecosystem services. Land Use Policy 2016, 54, 188–199. [Google Scholar] [CrossRef] [Green Version]
  26. Han, X.; Zhang, A.; Cai, Y. Spatio-Econometric Analysis of Urban Land Use Efficiency in China from the Perspective of Natural Resources Input and Undesirable Outputs: A Case Study of 287 Cities in China. Int. J. Environ. Res. Public Heal. 2020, 17, 7297. [Google Scholar] [CrossRef] [PubMed]
  27. Wang, S.; Ma, H.; Zhao, Y. Exploring the relationship between urbanization and the eco-environment—A case study of Beijing–Tianjin–Hebei region. Ecol. Indic. 2014, 45, 171–183. [Google Scholar] [CrossRef]
  28. Liu, J.; Dietz, T.; Carpenter, S.R.; Alberti, M.; Folke, C.; Moran, E.; Pell, A.N.; Deadman, P.; Kratz, T.; Lubchenco, J.; et al. Complexity of coupled hu-man and natural systems. Science 2007, 317, 1513–1516. [Google Scholar] [CrossRef] [Green Version]
  29. Cen, X.; Wu, C.; Xing, X.; Fang, M.; Garang, Z.; Wu, Y. Coupling intensive land use and landscape ecological security for urban sustainability: An integrated socioeconomic data and spatial metrics analysis in Hangzhou city. Sustainability 2015, 7, 1459–1482. [Google Scholar] [CrossRef] [Green Version]
  30. Wang, J.; Wang, S.; Li, S.; Feng, K. Coupling analysis of urbanization and energy-environment efficiency: Evidence from Guangdong province. Appl. Energy 2019, 254, 113650. [Google Scholar] [CrossRef]
  31. Zhang, Z.; Chang, T.; Qiao, X.; Yang, Y.; Guo, J.; Zhang, H. Eco-Economic Coordination Analysis of the Yellow River Basin in China: Insights from Major Function-Oriented Zoning. Sustainability 2021, 13, 2715. [Google Scholar] [CrossRef]
  32. Ding, L.; Zhao, W.; Huang, Y.; Cheng, S.; Liu, C. Research on the Coupling Coordination Relationship between Urbanization and the Air Environment: A Case Study of the Area of Wuhan. Atmosphere 2015, 6, 1539–1558. [Google Scholar] [CrossRef] [Green Version]
  33. Zhang, Z.; Li, Y. Coupling coordination and spatiotemporal dynamic evolution between urbanization and geological hazards–A case study from China. Sci. Total. Environ. 2020, 728, 138825. [Google Scholar] [CrossRef] [PubMed]
  34. Tang, Z. An integrated approach to evaluating the coupling coordination between tourism and the environment. Tour. Manag. 2015, 46, 11–19. [Google Scholar] [CrossRef]
  35. Ding, Y.; Zhang, M.; Qian, X.; Li, C.; Chen, S.; Wang, W. Using the geographical detector technique to explore the impact of socioeconomic factors on PM2.5 concentrations in China. J. Clean. Prod. 2019, 211, 1480–1490. [Google Scholar] [CrossRef]
  36. Wang, J.F.; Zhang, T.L.; Fu, B.J. A measure of spatial stratified heterogeneity. Ecol. Indic. 2016, 67, 250–256. [Google Scholar] [CrossRef]
  37. Wang, J.F.; Li, X.H.; Christakos, G.; Liao, Y.L.; Zhang, T.; Gu, X.; Zheng, X.Y. Geographical detectors-based health risk assessment and its application in the neural tube defects study of the Heshun region, China. Int. J. Geogr. Inf. Sci. 2010, 24, 107–127. [Google Scholar] [CrossRef]
  38. He, J.; Wang, S.; Liu, Y.; Ma, H.; Liu, Q. Examining the relationship between urbanization and the eco-environment using a coupling analysis: Case study of Shanghai, China. Ecol. Indic. 2017, 77, 185–193. [Google Scholar] [CrossRef]
  39. Huang, J.; Lin, H.; Qi, X. A literature review on optimization of spatial development pattern based on ecological-production-living space. Prog. Geogr. 2017, 36, 378–391. [Google Scholar]
  40. Fan, Y.; Jin, X.; Xiang, X.; Liu, J.; Yang, X.; Zhou, Y. Land use functions change and its spatial pattern in Jiangsu province from 2000 to 2015. Geogr. Res. 2019, 38, 193–208. (In Chinese) [Google Scholar]
  41. Fu, B.J.; Zhao, W.; Chen, L.D.; Zhang, Q.J.; Lü, Y.H.; Gulinck, H.; Poesen, J. Assessment of soil erosion at large watershed scale using RUSLE and GIS: A case study in the Loess Plateau of China. Land Degrad. Dev. 2005, 16, 73–85. [Google Scholar] [CrossRef]
  42. He, C.; Zhang, D.; Huang, Q.; Zhao, Y. Assessing the potential impacts of urban expansion on regional carbon storage by linking the LUSD-urban and InVEST models. Environ. Model. Softw. 2016, 75, 44–58. [Google Scholar] [CrossRef]
  43. Li, Y.; Li, D. Assessment and forecast of Beijing and Shanghai’s urban ecosystem health. Sci. Total. Environ. 2014, 487, 154–163. [Google Scholar] [CrossRef] [PubMed]
  44. Qi, Z.-F.; Ye, X.-Y.; Zhang, H.; Yu, Z.-L. Land fragmentation and variation of ecosystem services in the context of rapid urbanization: The case of Taizhou city, China. Stoch. Environ. Res. Risk Assess. 2013, 28, 843–855. [Google Scholar] [CrossRef]
  45. Price, A.L.; Patterson, N.J.; Plenge, R.M.; Weinblatt, E.M.; Shadick, A.N.; Reich, D. Principal components analysis corrects for stratification in genome-wide association studies. Nat. Genet. 2006, 38, 904–909. [Google Scholar] [CrossRef] [PubMed]
  46. Gao, S.; Zhao, H.; Bai, Z.; Han, B.; Xu, J.; Zhao, R.; Zhang, N.; Chen, L.; Lei, X.; Shi, W.; et al. Combined use of principal component analysis and artificial neural network approach to improve estimates of PM2.5 personal exposure: A case study on older adults. Sci. Total. Environ. 2020, 726, 138533. [Google Scholar] [CrossRef]
  47. Liu, N.; Liu, C.; Xia, Y.; Da, B. Examining the coordination between urbanization and eco-environment using coupling and spatial analyses: A case study in China. Ecol. Indic. 2018, 93, 1163–1175. [Google Scholar] [CrossRef]
  48. Ariken, M.; Zhang, F.; Liu, K.; Fang, C.; Kung, H.-T. Coupling coordination analysis of urbanization and eco-environment in Yanqi Basin based on multi-source remote sensing data. Ecol. Indic. 2020, 114, 106331. [Google Scholar] [CrossRef]
  49. Guo, Y.; Zhang, X.; Wang, Q.; Chen, H.; Du, X.; Ma, Y. Temporal changes in vegetation around a shale gas development area in a subtropical karst region in southwestern China. Sci. Total. Environ. 2020, 701, 134769. [Google Scholar] [CrossRef] [PubMed]
  50. Qi, X.; Si, Z.; Zhong, T.; Huang, X.; Crush, J. Spatial determinants of urban wet market vendor profit in Nanjing, China. Habitat Int. 2019, 94, 102064. [Google Scholar] [CrossRef]
  51. Wang, J.F.; Haining, R.; Liu, T.J.; Li, L.-F.; Jiang, C.-S. Sandwich estimation for multi-unit reporting on a stratified heterogeneous surface. Environ. Plan. A 2013, 45, 2515–2534. [Google Scholar] [CrossRef] [Green Version]
  52. Peng, J.; Liu, Z.; Liu, Y.; Hu, X.; Wang, A. Multifunctionality assessment of urban agriculture in Beijing City, China. Sci. Total. Environ. 2015, 537, 343–351. [Google Scholar] [CrossRef] [PubMed]
  53. Li, J.; Zhang, H.; Sun, Z. Spatiotemporal variations of land urbanization and socioeconomic benefits in a typical sample zone: A case study of the Beijing-Hangzhou Grand Canal. Appl. Geogr. 2020, 117, 102187. [Google Scholar] [CrossRef]
  54. Sun, P.L.; Xu, Y.Q.; Liu, Q.G.; Liu, C.; Huang, A. Spatiotemporal differentiation and driving factors of multi-functionality of land use in county scale in poverty belt around Beijing and Tianjin. Trans. Chin. Soc. Agric. Eng. 2017, 33, 283–292. (In Chinese) [Google Scholar]
Figure 1. Study area.
Land 10 00938 g001
Figure 2. Spatial change trend of urbanization. The (ad) stand for 2000, 2005, 2010, and 2018 respectively. Low level indicates that the indices of the three subsystems were all lower than the average value of the whole basin. Moderately low level indicates that any one of the three subsystem indices was higher than the average value of the whole basin. Moderately high level indicates that any two indices of the three subsystems were higher than the average value of the whole basin. High level indicates that the indices of the three subsystems were all higher than the average value of the whole basin.
Land 10 00938 g002
Figure 3. Spatial change trend of LUMF. The (ad) stand for 2000, 2005, 2010, and 2018 respectively. Low level indicates that the indices of the three subsystems were all lower than the average value of the whole basin. Moderately low level indicates that any one of the three subsystem indices was higher than the average value of the whole basin. Moderately high level indicates that any two indices of the three subsystems were higher than the average value of the whole basin. High level indicates that the indices of the three subsystems were all higher than the average value of the whole basin.
Land 10 00938 g003
Figure 4. Temporal change trend of the coupling coordination degree between urbanization and LUMF in different regions. (A) represents the whole region of the HRB; (B) represents the three sub-regions of the HRB.
Land 10 00938 g004
Figure 5. Spatial change trend of the coupling coordination degree between urbanization and LUMF. The (ad) stand for 2000, 2005, 2010, and 2018 respectively.
Land 10 00938 g005
Table 1. Data description.
DataResolutionSource
Soil MapRaster; 1 kmChina Soil Map Based on Harmonized World Soil Database (v1.1). Available online: http://westdc.westgis.ac.cn/ (accessed on 25 Juanary 2021).
Normalized Difference Vegetation Index data (NDVI)Raster; 1 kmResource and Environment Data Cloud Platform. Available online: http://www.resdc.cn/ (accessed on 20 Juanary 2021)
Digital Elevation Model (DEM)Raster; 30 mGeospatial Data Cloud. Available online:
http://www.giscloud.cn/ (accessed on 28 Juanary 2021)
Precipitation DataVector; 30 mChina Meteorological Data Sharing Service System. Available online: http://data.cma.cn/ (accessed on 15 Juanary 2021)
Land Use/Land CoverRaster; 30 m × 30 mGeospatial Data Cloud. Available online: http://www.giscloud.cn/ (accessed on 21 Juanary 2021)
Grain OutputStatisticsHubei/Shannxi/Henan Statistical Yearbook
Socioeconomic DataStatisticsChina’s County Statistical Yearbooks
Table 2. Index system of urbanization and LUMF.
Layer of TargetCriterion LevelIndex LevelAttributeWeight
Urbanization Population urbanizationPopulation density (people/ km 2 ) ( x 1 )+0.0915
Population urbanization rate (%) ( x 2 )+0.0748
Economic urbanizationSecondary and tertiary industry output value account for GDP (%) ( x 3 )+0.0380
Real GDP per capita (RMB/person) ( x 4 )+0.0976
Local government revenue per capita (RMB/person) ( x 5 )+0.1270
Fixed-asset investment per capita (RMB/person) ( x 6 )+0.1141
Social urbanizationAverage salary of employees (RMB) ( x 7 )+0.0698
Total retail sales of consumer goods per capita (RMB) ( x 8 )+0.1064
Disposable income ratio of urban and rural residents (%) ( x 9 )0.0609
Number of beds in hospitals and health centers (beds) ( x 10 )+0.1086
Highway density ( x 11 )+0.1113
Land use multifunctionalityAgricultural production functionFood output per capita (t/person) ( x 12 )+0.0851
Per capita gross output value of agriculture, forestry, animal husbandry and fisheries (RMB/person) ( x 13 )+0.0896
Cultivated land area per capita (m2/person) ( x 14 )+0.0604
Town living functionGDP per unit area (RMB10,000/ km 2 ) ( x 15 )+0.1906
Industry employees per unit area (people/ km 2 ) ( x 16 )+0.1938
Government expenditure per unit area (RMB10,000/ km 2 ) ( x 17 )+0.1642
Ecological maintenance functionCarbon stock t / hm 2 · a ( x 18 )+0.0692
Soil erosion t / hm 2 · a ( x 19 )0.0472
Forest cover rate (%) ( x 20 )+0.0999
Table 3. Classification of the CCD between urbanization and LUMF.
DCoupling StateCharacteristics
0.8 < D ≤ 1High couplingThe benign coupling between urbanization and LUMF increases toward orderly development.
0.6 < D ≤ 0.8Moderate couplingUrbanization and LUMF begin to cooperate and balance with each other.
0.4 < D ≤ 0.6Low couplingThe interactions between urbanization and LUMF strengthen.
0.2 < D ≤ 0.4Moderate uncouplingUrbanization and LUMF development show a weak imbalance.
0 < D ≤ 0.2Severe uncouplingUrbanization and LUMF development show a serious imbalance.
Table 4. The impact of urbanization factors on the internal mechanism of LUMF.
Criterion LevelIndex LevelWhole Region q-ValueUpstream q-ValueMidstream–Downstream q-Value
Population urbanizationPopulation density0.5253 **0.8306 **0.2874
Population urbanization rate0.45820.60070.4272
Economic urbanizationSecondary and tertiary industry output value account for GDP0.25570.50970.1783
Real GDP per capita0.6316 ***0.64370.7151 **
Local government revenue per capita0.56700.60400.4292
Fixed-asset investment per capita0.32540.63040.3387
Social urbanizationAverage salary of employees0.14030.22110.2663
Total retail sales of consumer goods per capita0.7142 ***0.8599 **0.4488
Disposable income ratio of urban and rural residents0.3208 *0.03140.4336
Number of beds in hospitals and health centers0.5148 ***0.8435 ***0.2373
Highway density0.25830.25720.0649
Note: *** represents statistical significance at a level of 0.01, ** represents statistical significance at a level of 0.05, * represents statistical significance at a level of 0.1.
Table 5. The impact of LUMF factors on the internal mechanism of urbanization.
Criterion LevelIndex LevelWhole Stream q-ValueUpstream q-ValueMidstream-Downstream q-Value
Agricultural production functionFood output per capita0.22340.39710.0809
Per capita gross output value of agriculture, forestry, animal husbandry and fisheries0.2480 *0.35660.2570
Cultivated land area per capita0.4740 **0.8056 ***0.4113
Town living functionGDP per unit area0.7864 ***0.9617 ***0.5832
Industry employee per unit area0.7838 ***0.9507 ***0.7178
Government expenditure per unit area0.6320 ***0.7946 ***0.4297
Ecological maintain functionCarbon stock0.17710.21260.0762
Soil erosion0.23660.11280.5415
Forest cover rate0.07620.08770.1826
Note: *** represents statistical significance at a level of 0.01, ** represents statistical significance at a level of 0.05, and * represents statistical significance at a level of 0.1.
Publisher’s Note: MDPI stays neutral with regard to jurisdictional claims in published maps and institutional affiliations.

