1. Introduction
Radiation and radioactive materials have many useful applications in different sectors, from energy production to medicine, industry, and agriculture. Risks related to radiation exposure of workers, the population, and the environment must be assessed and controlled, while production, transport, and use of radioactive wastes (RW) must be strictly regulated to guarantee safety. In particular, RW management and storage are some of the main challenges that the world must, and will have to, deal with in the many years to come. RW can be liquid, solid, or gaseous. They contain radionuclides at concentrations, or have activities, above the safety levels established by regulatory agencies [
1,
2,
3]. From a political point of view, RW management is a critical issue; from a scientific point of view, proposed solutions still require further research for technical and safety improvements [
4]. Many studies have been conducted throughout the world. Nevertheless the long-term environmental impacts of RW, particularly in presence of even small leakages, must still be fully assessed [
5,
6]. In fact, many parameters intervene during RW conditioning, transport, and storage operations, possibly resulting in radionuclides migration to the environment [
7]. Safety regulations are not always sufficient to avoid accidents, whose effects may exceed national boundaries. International cooperation is, therefore, essential to promote security at a global scale by sharing experience that can improve the ability to control radiation hazards, prevent emergencies, and mitigate consequences [
8]. Diligence is due, at both the national and international level, in following proper protocols, detecting hazardous conditions and activating prompt interventions for both hazard reduction and remediation [
9].
International RW safety standards have been established by the International Atomic Energy Agency (IAEA). IAEA defines standards for structures and procedures related to activities suffering from radiation hazard, including nuclear plants and RW management. In particular, it defines safety standards, requirements and measures to control human exposure to radiation and radioactive material releases into the environment, aiming at limiting the probability of catastrophic events [
10,
11]. According to IAEA guidelines [
8], the procedure for locating RW repositories must follow four steps: (a) conceptualization and general site design; (b) potential sites selection; (c) potential sites characterization; and (d) final site selection. In practice, from several potential sites resulting from point (b), a more detailed selection follows—point (c)—based on the assessment of specific environmental and socio-political factors such as land use, transport infrastructure, demographic conditions, local economic activities, etc. It has to be considered that the process may involve different levels of public and local players and include the use of vetoes and volunteering.
Recently, Italy has started the procedure for the identification of suitable sites for hosting its national RW repository. Sogin spa (hereinafter called Sogin), a public company, has proposed a map (called CNAPI) locating 67 potential suitable areas to host the repository. Selection procedure by Sogin has taken into account the criteria as defined in the Technical Guide no. 29 [
12] edited by the Italian Institute for Nuclear Safety and Radio Protection (ISPRA, presently ISIN). This was based on the above mentioned IAEA guidelines [
8]. In [
12] ISPRA has defined some criteria of “exclusion” (hereinafter called EC) and some others for technical specification of site features (hereinafter called “investigation criteria”, IC), both defining the requirements of potential sites all over the national territory. These criteria have been defined based on the following issues: (1) geological, geomorphological and hydraulic features of the area; (2) hydrogeological and chemical characteristics of the soil, to counteract the possible transfer of radionuclides into the biosphere; (3) protection and preservation of the territory and cultural heritage; (4) distance of the repository from man-made infrastructures and human activities; (5) distance from underground natural resources; and (6) protection from extreme weather conditions.
The present step of the selection workflow should correspond to the (b) point of the previously cited IAEA procedure. Nevertheless, Sogin has already anticipated a sorted list of suitable sites based on the adoption of a limited number of IC out of the many that were defined in [
12]. Preliminary projects concerning RW deposit structure and the related technological park were also provided in [
13].
It is worth remarking that EC and IC criteria can be associated to steps (b) and (c) of the IAEA procedure, respectively. It sounds clear that the inclusion of a certain criterion into the EC or IC group strongly affects the final solution of the decision process. In fact, while EC operate in a in/out mode by immediately including, or excluding, a given area, IC play a more understated role, being called to just grading the suitability of selected sites. This makes possible that, once a site is included among the candidates (not complying the EC criteria), the final choice may not exclusively obey to technical and scientific principles, but be possibly conditioned by economic and political dictates. Conveniently acting on the IC criteria—and related grading—permits, in fact, to introduce elements of subjectivity that could compromise a transparent solution.
ISIN/ISPRA guidelines strongly rely on the adoption of geographical data that represent the main tool for site selection [
14,
15,
16], permitting them to spatially formalize both EC and IC criteria. It is worth stating that proper data (in terms of content, updating and detail level) are basic to guarantee robust deductions. When a public player (such as Sogin) is called to achieve such an analysis, possibly granted through public money, it would be desirable that all the available open and free data were used, especially if obtainable from official and institutional subjects (regions, provinces and municipalities). This makes possible to save technical efforts and further spending of public money in the next phases of the procedure, when local communities, through their local administrations, have to eventually demonstrate unsuitability of their territories.
Unexpectedly, the Sogin procedure shows significant lacks in open data utilization. In fact, all spatial concerns are based on a very limited number of data, mainly having a homogeneous coverage over the Italian territory. No concern about the current availability of data from regional geoportals, better describing local conditions, is shown. In this work, to highlight this important criticality of the Sogin process, the TO-10 site was used as a paradigm. According to Sogin, it resulted compliant with no EC criterion, and, therefore, suitable to host the repository. Moreover, the TO-10 site is presently the first one appearing in the graded list contained in the Sogin published document [
17]. In this work, we demonstrate that available public data would have been enough to exclude the TO-10 site from the candidate ones already in the present step. The same is expected for other sites presently included in the CNAPI, as well. Consequently, one can assume this analysis to be general and useful to improve results in the next steps of the procedure.
We advise that only some out of the ISIN criteria were taken into consideration in our analysis (see
Section 2). In particular, those more strictly related to spatial analysis and, therefore, relying on the adoption of geographical data obtainable from official free archives/geoportals and literature.
To give a comprehensive description of these issues, we initially explored the general traits of the Sogin procedure, highlighting the most evident weaknesses and related threats. Then, focusing on the TO-10 site, a detailed analysis based on available open data, was achieved, testing the compliance of the site with the selected EC and IC criteria. Given the particular nature of the analysis, we preferred to integrate the Results and Discussion sections in a single one, making possible a more comprehensive interpretation of the analysis.
2. Materials and Methods
Some general and evident concerns have to be, initially, given about the Sogin procedure, this being the starting point of this work. When trying to figure out anomalies that can be recognized in a selection process, perspective has to be shifted to the proper point of view; this strictly depends on the degree of caution one wants to pay. It is worth reminding that caution has to be consistent with the impact that the forecasted structure/action potentially has. With these premises, authors detected that the philosophy supporting the Sogin procedure relies on an inappropriate complete confidence about human activities and artefacts (i.e., repository engineering). According to this vision, the repository is assumed as completely safe with zero probability assigned to internal failures, or external unpredictable threats, whose effects, however, can dramatically affect local population and environment [
18]. Ordinary evaluation and sizing approaches of engineering appear to be reverted. In fact, EC and IC criteria, are more aimed at testing the degree of protection of the repository itself by eventual menaces from the external context, than at protecting local population and environment in case of failure/accident of the repository itself. Some evidences come from the application of the EC10 and IC8 criteria (groundwater issues) and EC12 criterion (topological constraints relating the repository and its neighbour settlements). As far as groundwater is concerned, tested conditions are only addressed at verifying if it could ever interact with the repository substructures, possibly degrading them. As far as settlements are concerned, the buffer zone is set to such a value (1 km for smaller municipalities) that can be just intended for preserving the repository from external solicitations and, not certainly, to preserve local population from the failure of a nuclear waste repository. Additionally, the air compartment is not taken into consideration at all, since the underlying hypothesis is that nothing will never fail in the repository and no radioactive pollutant can be introduced in the air.
A second great criticality of the Sogin procedure concerns the consistency between expected outputs from the (b) step of the IAEA selection procedure (namely, “potential sites selection”) and the ones by Sogin. The IAEA (b) step has to generate a list of suitable sites for the repository by applying EC criteria. No grading is associated by IAEA at this procedural step. Conversely, sites grading is the expected output of the next procedural step (c), when IC criteria have to be applied. Unexpectedly, in [
17], a sorted list of sites is given by Sogin relying on a classification based on only three IC criteria (namely, IC10, IC11, IC12) out of the 13 defined in [
12]. Additionally, the same document explicitly goes back to two EC criteria—namely, EC11 and EC12. It is not clear the motivation that made these IC criteria more important than the other ones (some of them even more important), nor the reason why Sogin (c) step had to consider two EC. For example, the hydrogeology-related IC8, was not considered in the sorting step. We remind that IC8 was in charge of absorbing the most of concerns (i.e., groundwater level, recharge areas of aquifers, permeability, etc.) that the EC10 criterion unreasonably neglected in the previous step.
It is, however, a fact that the anticipation, within an official published document, of a sorted list of sites during a step of a procedure that is not called to define it, appears as a distortion of the transparent decisional process based on objective and independent analysis. This sounds furtherly strange when considering that Sogin defines its procedure as “participatory”.
A further criticality by Sogin concerns the type of data (in particular the geographical ones) that the procedure based some of its deductions on. Sogin, in fact, did not consider official regional geodatabases that are known to provide updated data at the proper spatial scale. Moreover, some data were obtained from external suppliers, possibly showing a lower degree of officialdom and, generally, a reduced, and not properly updated, content. A paradigmatic example comes from the application of the EC13 criterion, concerning the road/railroad network analysis. It was, in fact, based on the DBPrior10K dataset (a so called harmonized “patchwork” of regional official databases from CISIS) integrated with the Navteq (Nokia 2012) one.
But the most critical element coming from the public documents that were published, is contained in the ISPRA Technical Guide n. 30 [
19], following the ISPRA Technical Guide n. 29 [
12]. In [
19] it is stated that the same repository, designed and located to host “low and medium activity” radioactive wastes, will also host, for a “long lasting”, but temporary, period (no time limit is given, nor ensured), “high activity” RW. This unreasonable choice appears to furtherly revert ordinary planning approaches, where caution and structure oversizing are, generally, the leading criteria to protect population and environment.
In this framework of evident native faults of the procedure, we finally decided to test a subset of ISIN EC and IC criteria, namely EC2, EC3, EC4, EC5, EC10, EC12, IC2, IC3, and IC8 (
Table 1). In particular, we tested those being majorly compliant with authors’ research fields and majorly relying on geographical data. The aim was to investigate if, from a strictly technical point of view, results from Sogin were consistent with those obtainable using more appropriate data from open archives. As previously mentioned, the analysis focused on the TO-10 site, the first one reported in the sorted list of suitable sites unexpectedly published in [
17].
2.1. Study Area
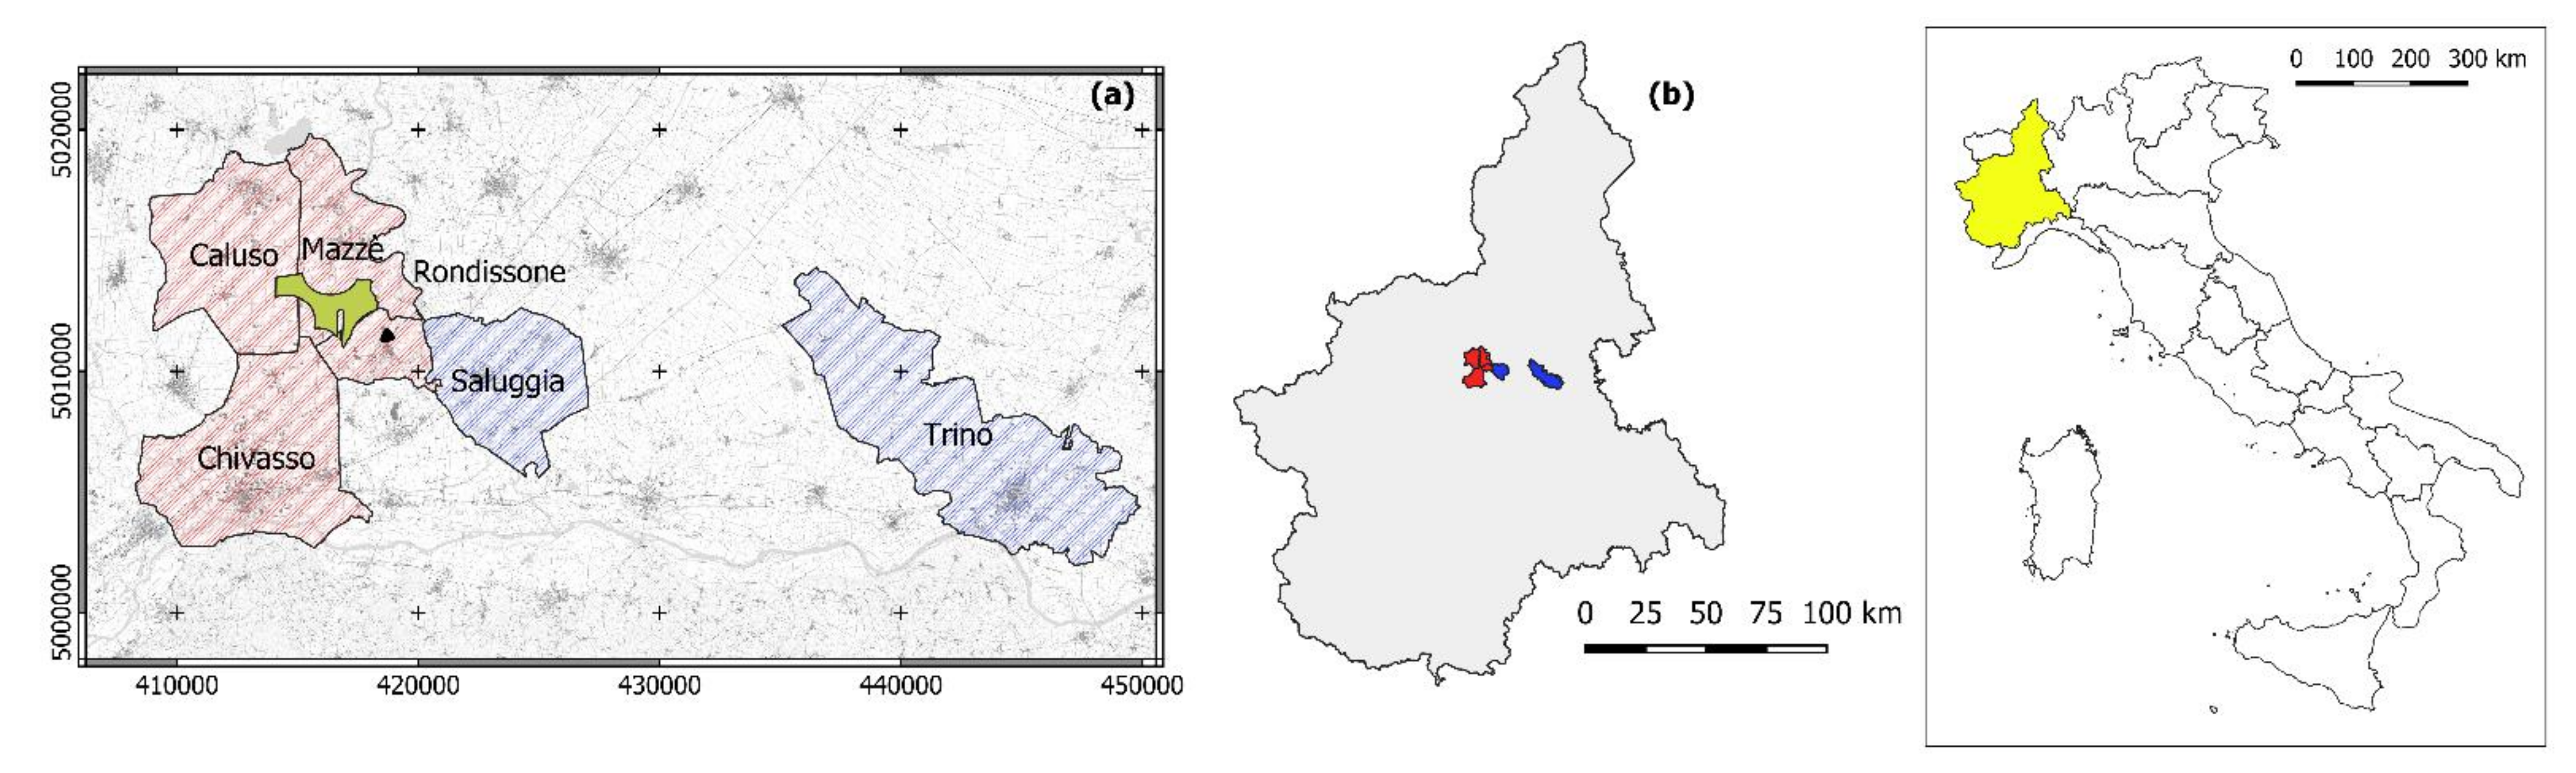
The TO-10 site is located in the eastern sector of the Torino Metropolitan district (Piemonte region, NW Italy) and involves the municipalities of Caluso, Mazzé, and Rondissone. These municipalities counts about 13,500 inhabitants, that can reach 40,500 if the close municipality of Chivasso is considered. According to CNAPI, the TO-10 site sizes about 5.15 km
2 (
Figure 1). The area develops on the right side of the Dora Baltea river; it is located at about 7 km from the existing EUREX Sogin nuclear waste repository and treatment area (Saluggia), and at about 26 km from the dismissed “E. Fermi” nuclear plant (Trino Vercellese). It is worth to remind that, both these sites must be “decommissioned” in the near future due the extreme hydrogeological vulnerability of the area [
20].
2.2. Geographical Data
The core focus of this work develops around the application of the selected EC and IC criteria based on available free and official data from public geoportals. With respect to the TO-10 site (but the same could be done for the other sites located in the Piemonte Region), geographical data from open archives of
Table 2 were used to accomplish the analysis.
2.3. Geological, Tectonic and Seismogenic Analysis of the Area
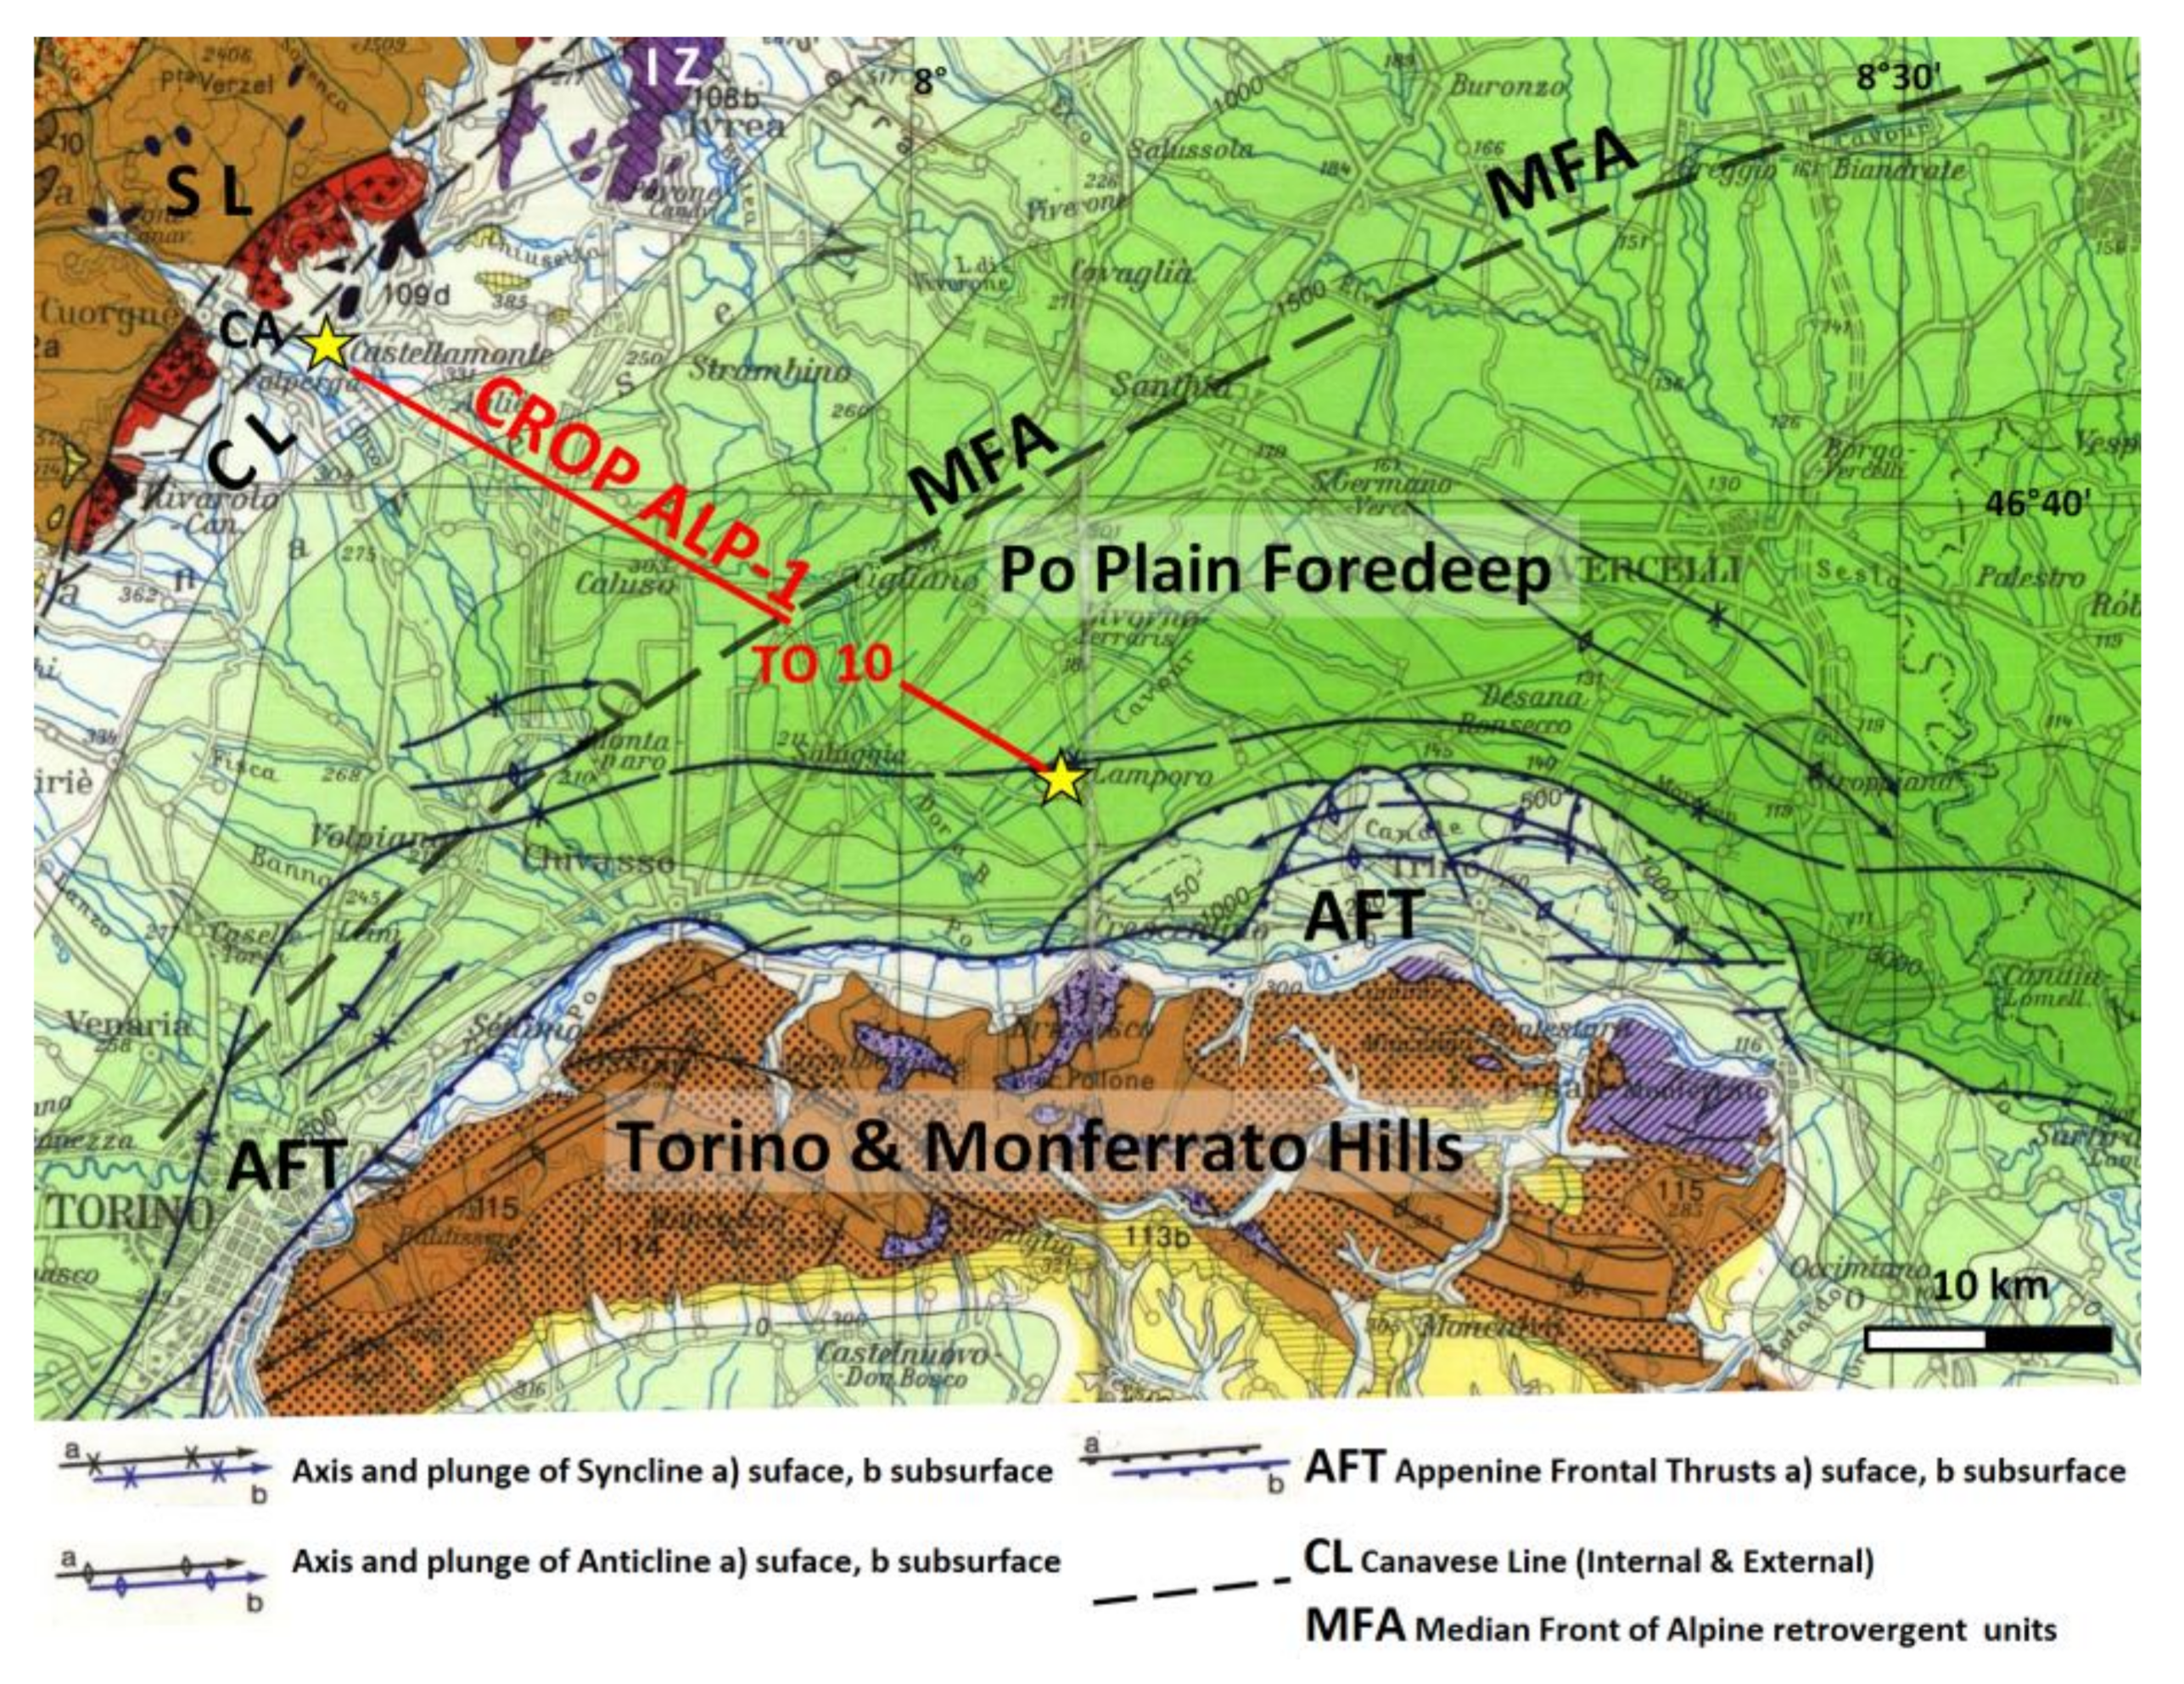
The proposed analysis relies on the re-interpretation of the CROP-ALPS 1 seismic reflection data from Roure et al. [
26] integrated with considerations about active tectonics and seismicity based on the INGV databases. CROP-ALPS 1 (also known as ECORS-CROP) project focused on the deeper structure of the orogen in the French-Italian sector of Western Alps [
26,
27]. Nevertheless, in the SE sector, original data of the profile show a proper resolution for analysing superficial structures related to the Plio-Pleistocene coverings.
2.4. Seismic Hazard of the TO-10 Area
The EC2 criterion of the Technical Guide n. 29 [
12] is intended to exclude those areas “marked by high seismicity”. It uses, as a reference, the Technical Standards for Constructions (Ministerial Decree 14 January 2008, [
28]) and the INGV Seismic Hazard Map ([
29],
http://esse1.mi.ingv.it/, accessed on 13 May 2021). These documents indicate that “
high seismicity” corresponds to peak values of “
acceleration (PGA) at the rigid substrate equal to, or greater than, 0.25 g for an earthquake return time of 2475 years”.
Seismic Hazard Maps of Italy are determined on the basis of the known instrumental and historical seismicity that is reported in the Parametric Catalogues of Italian Earthquakes (see
http://emidius.mi.ingv.it/CPTI/, [
30], accessed on 13 May 2021) and in the Catalogue of Strong Earthquakes in Italy (
http://storing.ingv.it/cfti/cfti5/, [
31], accessed on 13 May 2021). In these catalogues, the “older” recorded earthquakes date back to 217 B.C. and 461 B.C., respectively, showing to be clearly incomplete for previous periods. Therefore, the EC2 exclusion criterion defined in [
12] is in itself hard to be applied, given the limited information on earthquake dates and their correspondent magnitudes; in fact, the EC2 criterion explicitly refers to the events occurred in the 2475 years B.P., that were not recorded. Certainly, this deficiency is even more significant if one has to refer to the time-scale of geological processes. With these premises, interesting information come from the study conducted by the Department of Earth Sciences of “La Sapienza” University (Roma) and commissioned by Sogin [
23]. This research integrates rheology of the lithosphere of the Italian peninsula with the active regional tectonics, by jointly analysing available geological, geo-structural and geophysical information. In [
23] authors explored the whole Italian territory using a 25 × 25 km sized grid. With reference to the crustal thickness and depth of the lithospheric mantle, they calculated the local maximum differential stress for rupture of the lithosphere. Calculations were completed with (a) the analysis of the deformation vectors as measured by networks of GNSS permanent stations, (b) the stratigraphy of deep wells drilled by ENEL and AGIP; (c) the “database” of Italian major faults (DISS, ITHACA, GNDT). Results were synthesized in the “
Maps of the maximum expected magnitude on geological-geophysical basis” for earthquakes potentially occurring within each of the 25 × 25 km cells.
Finally, the earthquakes spatial distribution was analysed based on the instrumental recordings from the ISIDE-INGV (
http://iside.rm.ingv.it, accessed on 13 May 2021), which reports the active seismicity since 1985.
2.5. Holocene Uplift, Erosion and Sedimentation
A geomorphological analysis was achieved to test the hypothesis that a regional uplift, lasting since the Pleistocene-Holocene, is presently occurring in the area [
32].It relies on the interpretation of the numerous fluvial terraces and entrenched meanders that can be recognized along the course of the Dora Baltea river. Special attention was paid about fluvial terraces developing outside the moraine arc, which crosscuts the outwash plain south of Mazzè.
2.6. Hydrogeological Data
Hydrogeological constraints for RW repository localization are defined in the EC10 criterion and further technical specifications are given in the IC8 one. EC10 only takes into consideration piezometric levels of the superficial aquifer, moving all of the other technical issues to the IC8 criterion. EC10 is intended for testing the possibility that groundwater could interact with RW repository foundations compromising its degree of insulation, thus increasing the possibility of radionuclides transfer to the surrounding environment. If one compares EC10 with IC8, an unreasonable unbalance can be, immediately, detected. EC10 introduces the following exclusion conditions: (a) the proximity (300 m) of the area to superficial waterbodies (with an area > 1500 m2); (b) the presence of underground water field evidences (e.g., flooded crops, swamps, etc.); (c) the presence of springs or intake artefacts. These conditions do not take into account the actual groundwater level of the aquifer (hereinafter called GL), nor the underground water flow, nor to the groundwater uses, nor the eventual presence of recharging areas of the deep aquifer (used for supplying drinking water). The latter, alone, represents a solid exclusion criterion. Instead, Sogin (according to ISPRA guidelines) delegated all of these concerns to IC8, whose weakness has already been discussed. Indeed, many open public and official data exist for easily deepening the analysis, making possible a more detailed description of the actual situation.
A further weakness of this approach is that the EC10 and IC8 criteria majorly focus on the near surface aquifer, being the one that can interact with the RW repository. No explicit concern is given about the “deep” aquifer providing drinking water to local communities. With the aim of demonstrating that the existing open data (PH, AF, W layers in
Table 2) are sufficient to decode critical situations, ordinary GIS-based (SAGA GIS v.7.9 and QGIS 3.18.1) procedures were applied during the analysis.
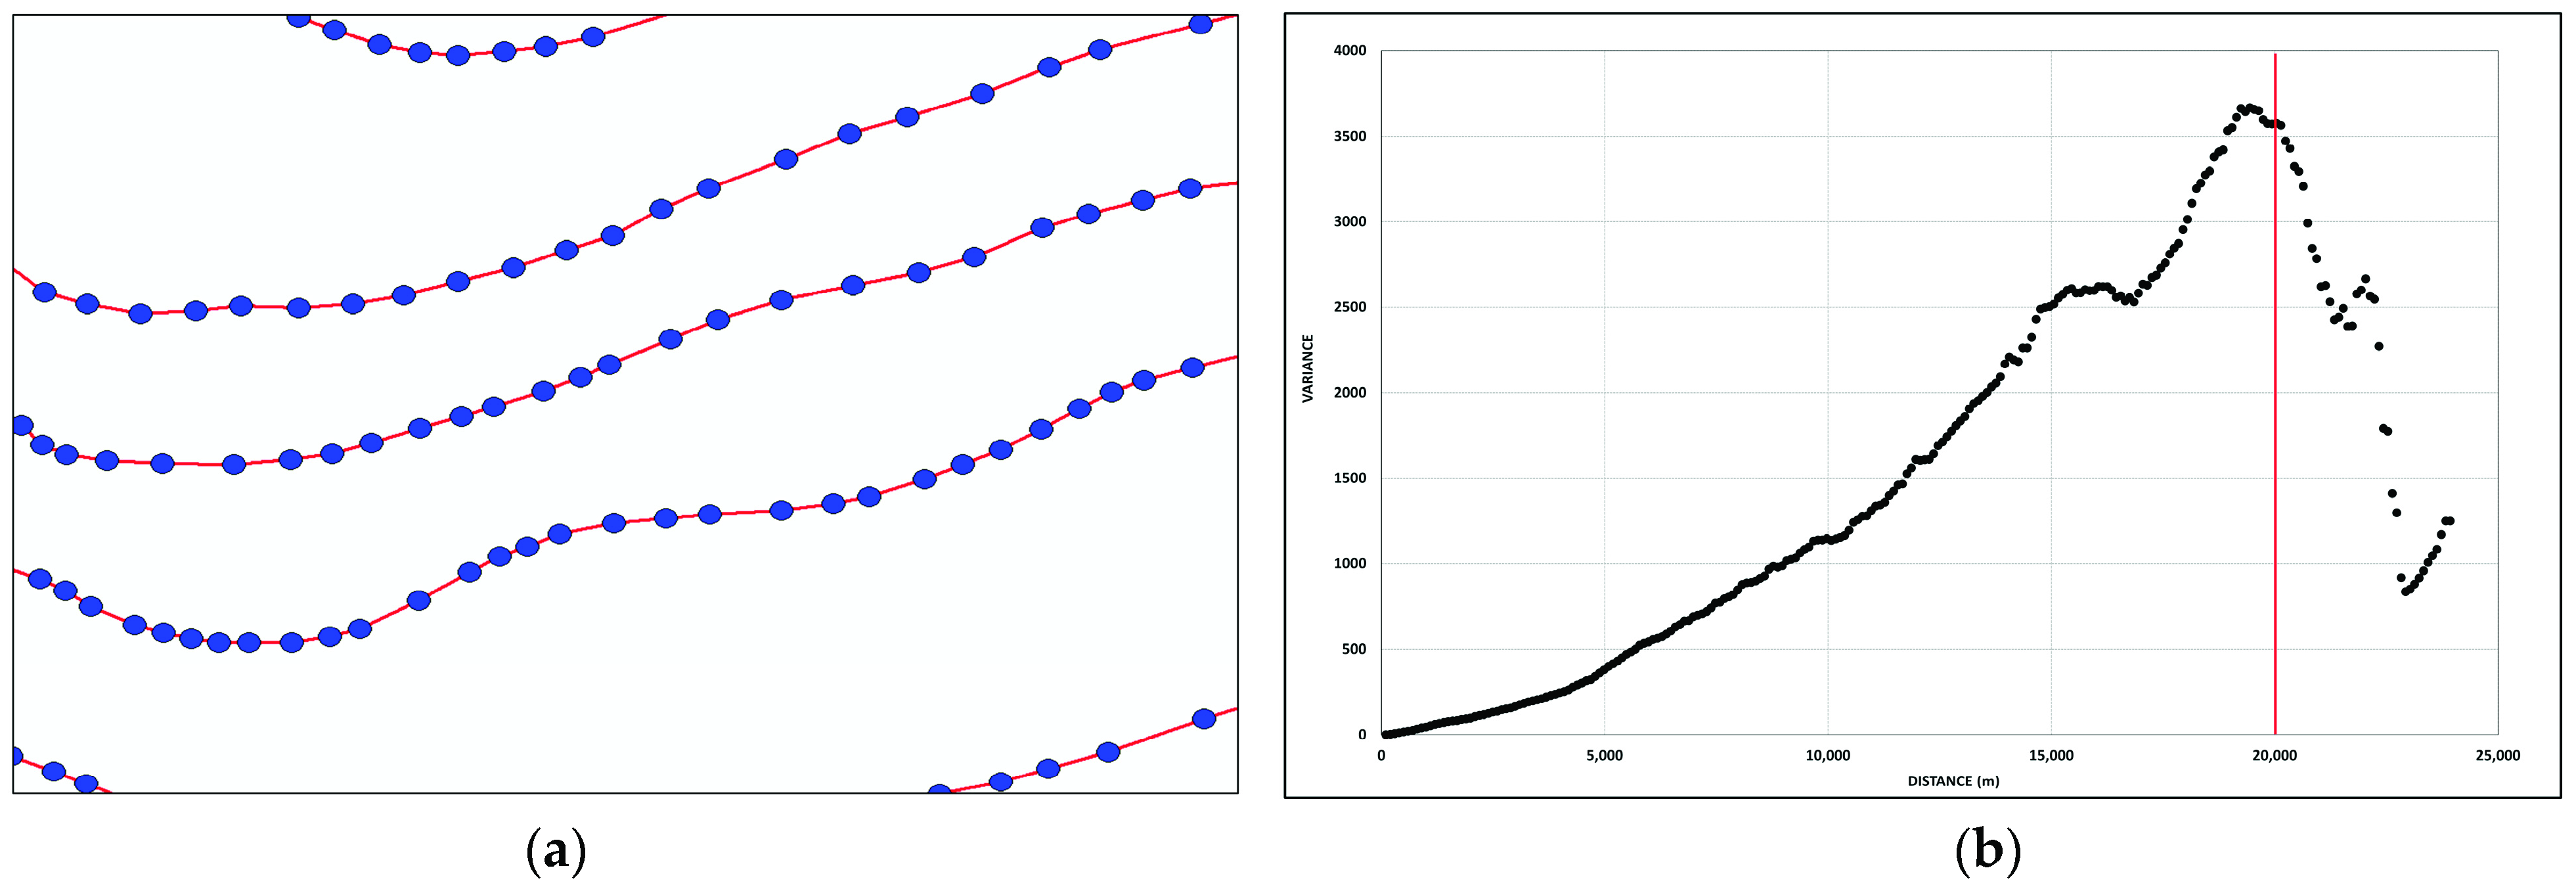
Spatially continuous representations of the main local hydrogeological features were generated from the native PH and AF vector layers, by rasterization. This was obtained by spatial interpolation based on the “natural neighbour” algorithm as implemented in SAGA GIS [
33]. A grid size of 100 m was selected during the rasterization. To achieve this task, native line vectors were converted (with densification, 1 point every 100 m) into point layers (see Figure 9). The correspondent variograms [
34] were, therefore, generated to test the legitimacy of spatial interpolation, that was confirmed. Resulting raster layers (hereinafter called
PH(
x,
y) and
AF(
x,
y), respectively) were used for the following analyses.
PH(
x,
y) was preliminary validated, to ensure robustness of deductions in the following steps aimed at mapping the local groundwater level (GL). During this step, the 20% of points (randomly selected) were used as validation set. The local PH value at those positions (as coming from the regional data) was compared with the estimated one by spatial interpolation from
PH(
x,
y). MAE (Mean Absolute Error,) and RMSE (Root Mean Squared Error) [
35] were used as accuracy parameters. To recover a proper representation of local groundwater level,
PH(
x,
y) was compared by grid differencing with the available DTM. A 100 m grid sized raster map of the superficial aquifer, hereinafter called
GL(
x,
y), was obtained and analysed with respect to the EC10 and IC8 criteria.
The Variance Propagation Law [
36], involving DTM and
PH(
x,
y) accuracy (namely, σ
DTM and σ
PH), was applied (Equation (1)) to recover an appropriate estimate of the
GL(
x,
y) uncertainty (σ
GL). This was needed to properly consider groundwater table interference with the repository structure.
Furtherly, seasonal variations of GL were taken into consideration while testing this condition. Estimates of GL variations in the area were found in literature (see
Section 3).
2.7. Testing the EC12 Criterion
A rather complex exclusion criterion is the one related to the local settlements (EC12) that investigates spatial relationships between the repository and surrounding settlements. The approach proposed by Sogin [
18,
37,
38] relies on the possibility of testing topological conditions, mainly related to the distance between the repository and neighbour-built areas, or technological-industrial facilities. Buffering, operated with reference to the flat distance between the site hosting the RW repository and the generic settlement structure, is the main spatial tool adopted within the procedure. Concerning both residential and productive areas, the reference geodatabase (polygon vector layer) used by Sogin was LOC2011 (see
Table 2). In this layer, four types of settlements are considered: (a) towns/villages (“centri abitati”, code = 1); (b) group of houses (“nucleo abitato”, code = 2); (c) productive/industrial areas (“località produttive”, code = 3); (d) sparse houses (“case sparse” code = 4). Crucial importance has the meaning assigned to class 2, that in [
18] is defined as “
an inhabited locality, with no meeting place for people, consisting of a group of close houses hosting at least five families, with roads, paths, squares, farmyards, small gardens, small uncultivated grounds. The space inter houses is expected to be less than 30 m”.
In [
18,
37], three levels of analysis are proposed, each defining a buffering level: (a) “settlements” (1st buffering level) involving all polygons labelled as 1, 2 and 3 in LOC2011; (b) “local urbanisms” (2nd buffering level), involving only settlements having more than 20,000 inhabitants; (c) “metropolitan areas” (3rd buffering level), involving only the biggest Italian cities. This hierarchical approach aims at taking into consideration not only spatial relationships between settlements and the repository, but also those mutually existing among neighbour settlements and defining the local commercial/social tissue. In spite of this reasonable, and explicitly, defined procedure by Sogin for the application of the EC12 criterion, only the first level buffering was implemented to generate the CNAPI [
18]. This corresponds to the application of a buffer zone around the polygons classified as 1, 2 or 3 in LOC2011. The size of the buffer was set to generate an area 10 times greater than the one presently occupied by the considered settlement. A minimum radius value of 1 km was, however, considered for smallest towns. The buffer was computed from the border of the mapped polygon, defining the settlement in the LOC2011 layer. In this framework, we explored the potential scenario that would have been found if the 2nd level buffering (“local urbanisms”) had been considered during the application of the EC12 criterion. The implemented procedure, managed by ordinary GIS tools, was the one reported in [
37] with respect to the close municipality of Chivasso, being compliant with the requirements from Sogin (number of inhabitants > 20,000).
A further critical point in EC12 application by Sogin concerns the spatial granularity and updating of the LOC2011 layer used for the first level buffering. Two “groups of houses” (code = 2), namely “Cascina Giletta” and “Cascina Gabriella”, located close to the border of the TO-10 site, were not considered, since not mapped in the LOC2011 layer. Nevertheless, they were clearly mapped in the available BDTRE2021 layer and proved to be compliant with the requirements about: number of resident families (at least five, data supplied by the Mazzè local administration—Demographic Office); inter-houses distance (<30 m). Moreover, a bio-gas production site (that could be associated to the 3 code of the LOC2011 layer), located close to the NW part of the TO-10 site, was not considered. A new scenario was, therefore, generated including these additional polygons and the correspondent buffers (1 km radius).
3. Results and Discussions
Given the particular nature of this analysis where results are mainly discussions and interpretations of existing data, we decided to include results and discussions in a single section of the paper, making its reading easier and more effective. Consequently, the ordinary organization of the paper was changed, accordingly.
3.1. Geological, Tectonic and Seismogenic Analysis of the Area
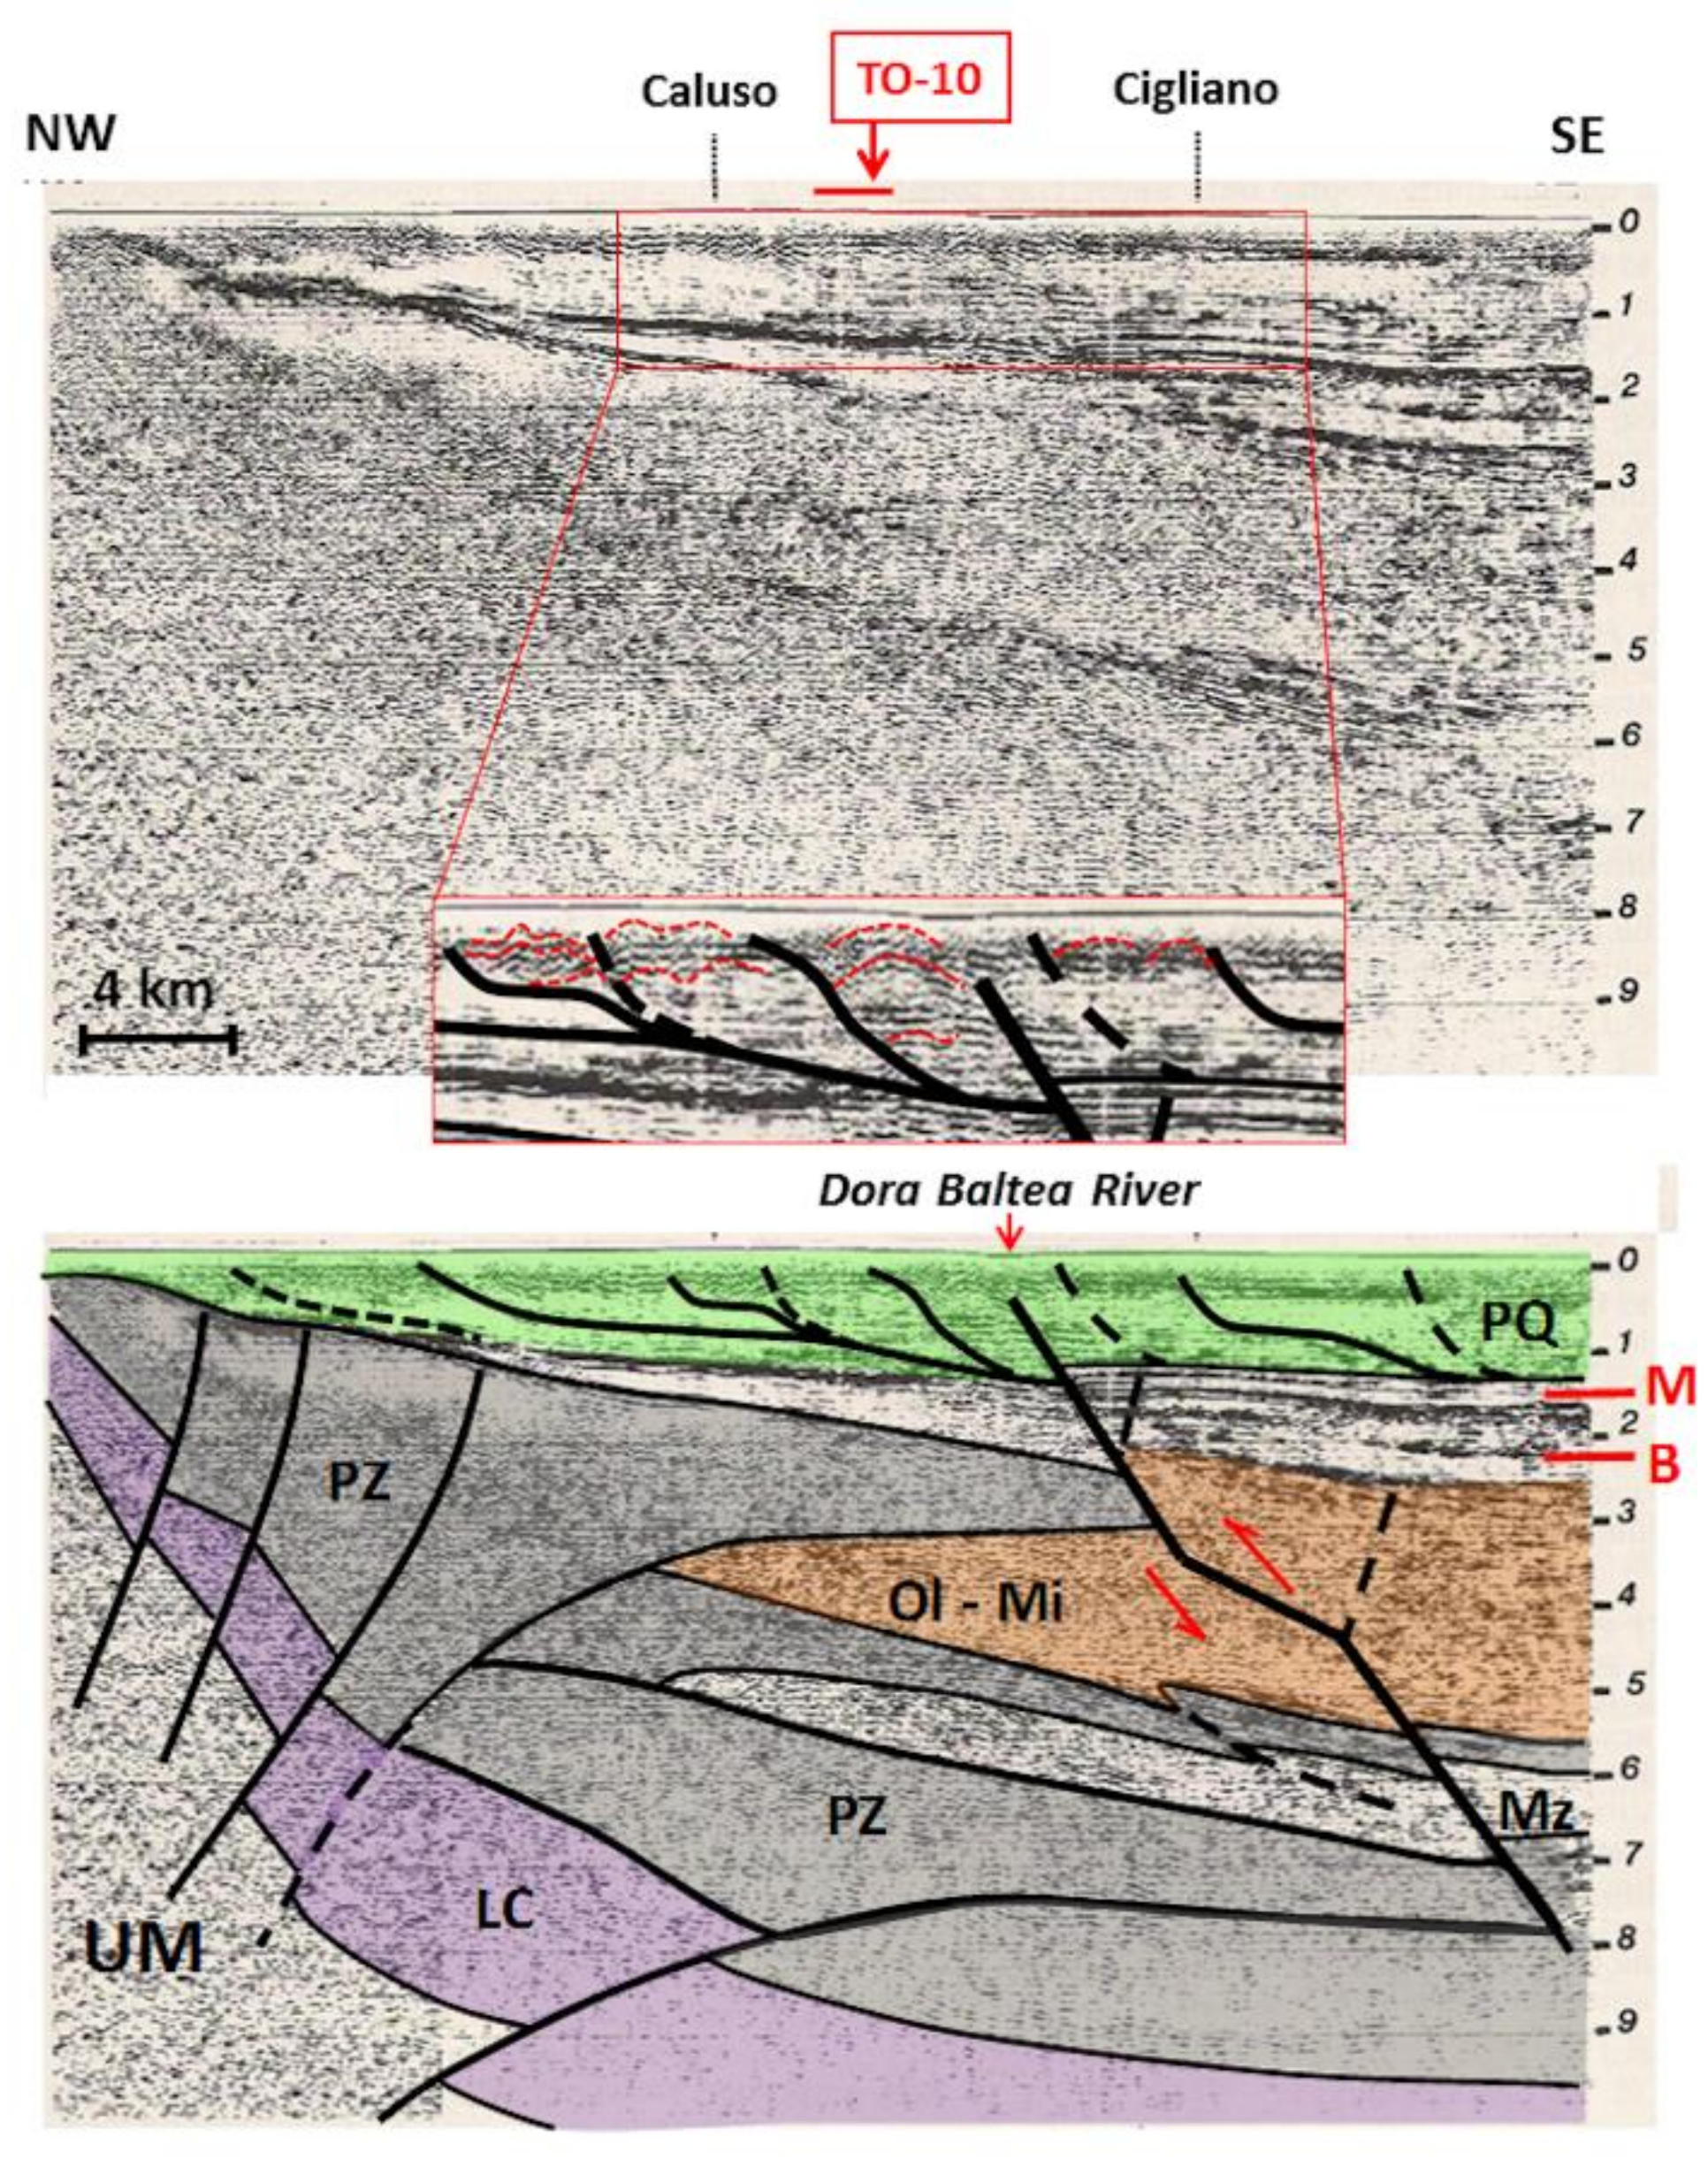
The study area lays on Pleistocene fluvio-glacial sediments. It develops within a complex Miocene-to-Holocene geodynamic setting. During this period, the Apennine thrust fronts propagated north and northeast-ward below the Po plain, dislocating the active Alpine retrovergent units and the pre-Tertiary sedimentary series [
22,
39]. In particular, according to Festa et al. [
40], the frontal Apennine thrusts deformed the Plio-Quaternary sediments along the Po plain fore deep basin (
Figure 2 and
Figure 3). The CROP-ALPS 1 seismic reflection data made it possible to identify a major inverse fault (with a series of ramps and flats) that belongs to the Apennine domain and clearly dislocates and overthrusts the retrovergent south-Alpine units and the most superficial sedimentary sequence (
Figure 3). This structure is outlined by a major discontinuity in the reflective traces, propagating from 8 km depth up to the surface. It can be observed that, besides the crystalline blocks, the fault affects the Mesozoic, the Tertiary, and the Plio-Quaternary units. The emplacement dynamics related to this fault generated a series of fault-propagation-folds and fault-bend folds [
41] approaching the surface with a general northward vergence. Among these, the anticline that affects the clayey horizons outcropping in the Torrazza-Rondissone area, on the NW side of the Dora Baltea scarp.
Concerning the interpretation of the above mentioned data, the tectonics of the area appear to be rather complex. This complexity was not detected by Sogin and no mention is given in [
42]. Nevertheless, this issue has relevant implications with respect to tectonic uplift and seismic hazard of the Po plain region, where the TO-10 area is located. Here, both the active north-vergent tectonics of the Apennine margin (responsible for the Emilia 2012 earthquake), and the active south-vergent Alpine margin tectonics (involved in the genesis of the Verona 1117 earthquake, the Brescia 1222 earthquake and the Friuli 1976 earthquake) combine and interfere, within a relatively limited spatial volume, involving the upper crustal blocks. This configuration significantly increases the potential for stress accumulation, tectonic uplift, and consequent seismic hazards.
3.2. Seismic Hazard of the TO-10 Area
With focus on the above mentioned “
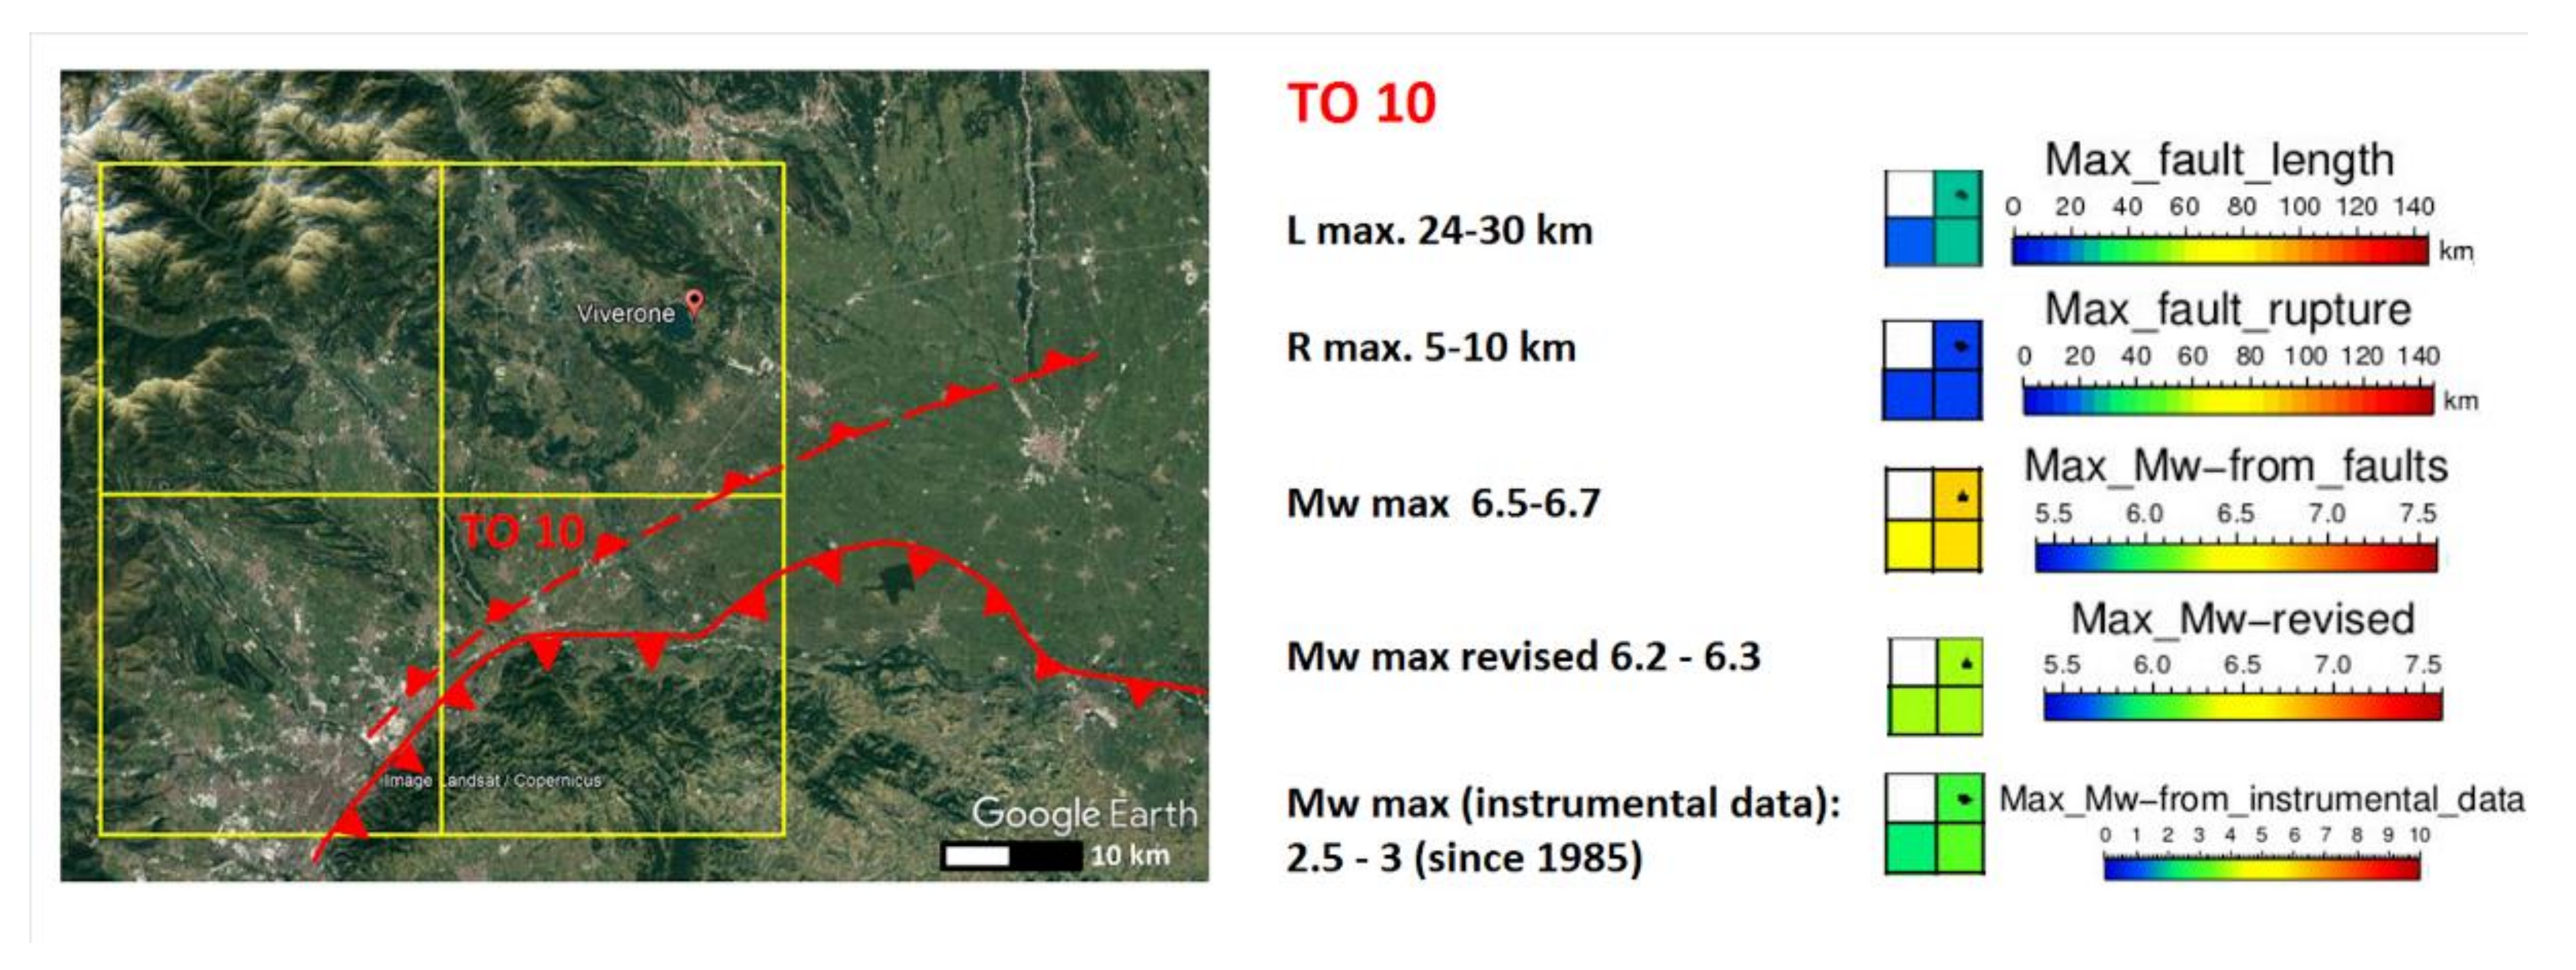
Map of the maximum expected magnitude on geological-geophysical basis” for earthquakes potentially occurring within an area of 25 km × 25 km, some considerations can be done for the TO-10 site.
Figure 4 shows the grid-units close to the Viverone Lake and the TO-10 area. This figure also reports the two main tectonic units underlying the Po plain and the numerical results of the study by La Sapienza University [
23] for the quadrant that includes the TO-10 site. According to
Figure 4, the expected magnitude in the area (6.5–6.7 Mw) is consistent with the one of the major earthquakes occurred within the Po plain in the past (Verona 1117 A.D., Brescia 1222 A.D.). The authors of the map suggest to adopt a “revised magnitude” (6.2–6.3 Mw) to refine those estimates and better fit their model.
With reference to the relationship of Sabetta and Pugliese [
44], integrated with the coefficients of Bommer et al. [
45] for variable focal mechanisms, the horizontal PGA max at the solid bedrock (category A) can be computed as a function of the epicentre distance. For a “precautionary” earthquake of 6.5 Mw (the minimum theoretical Magnitude, but slightly higher than the “Revised Magnitude”) with its epicentre within 5 km from the TO-10 site (R
epi = 5 km), the following accelerations can be found: a
gmax = 0.46×
g for a normal fault, a
gmax = 0.48×
g for a transcurrent fault and 0.59×
g for a reverse fault. Doubling the radius (R
epi = 10 km), values become 0.30×
g, 0.32×
g, and 0.39×
g, respectively. Alternatively, while applying the relationship proposed by Ambraseys et al. [
46] lower values (of about 25%) can be found. Therefore, even using the smaller, and optimistic, values from [
46], maximum accelerations would be >0.25×
g for all types of faults if an earthquake occurred within a distance of 5 km from the TO-10 site. It is worth to remind that this value corresponds to the threshold defined in the EC2 criterion. Similarly, an earthquake occurring within a distance of 10 km from the TO-10 site would generate a maximum acceleration of 0.29×
g for a reverse fault (the most likely to occur in the TO-10 area, given the active compressional tectonics) which is still higher than the 0.25×
g threshold value.
We remark that these results underestimate the actual local seismic acceleration, because the gravel-sands sediments outcropping in the area may amplify the above PGA values.
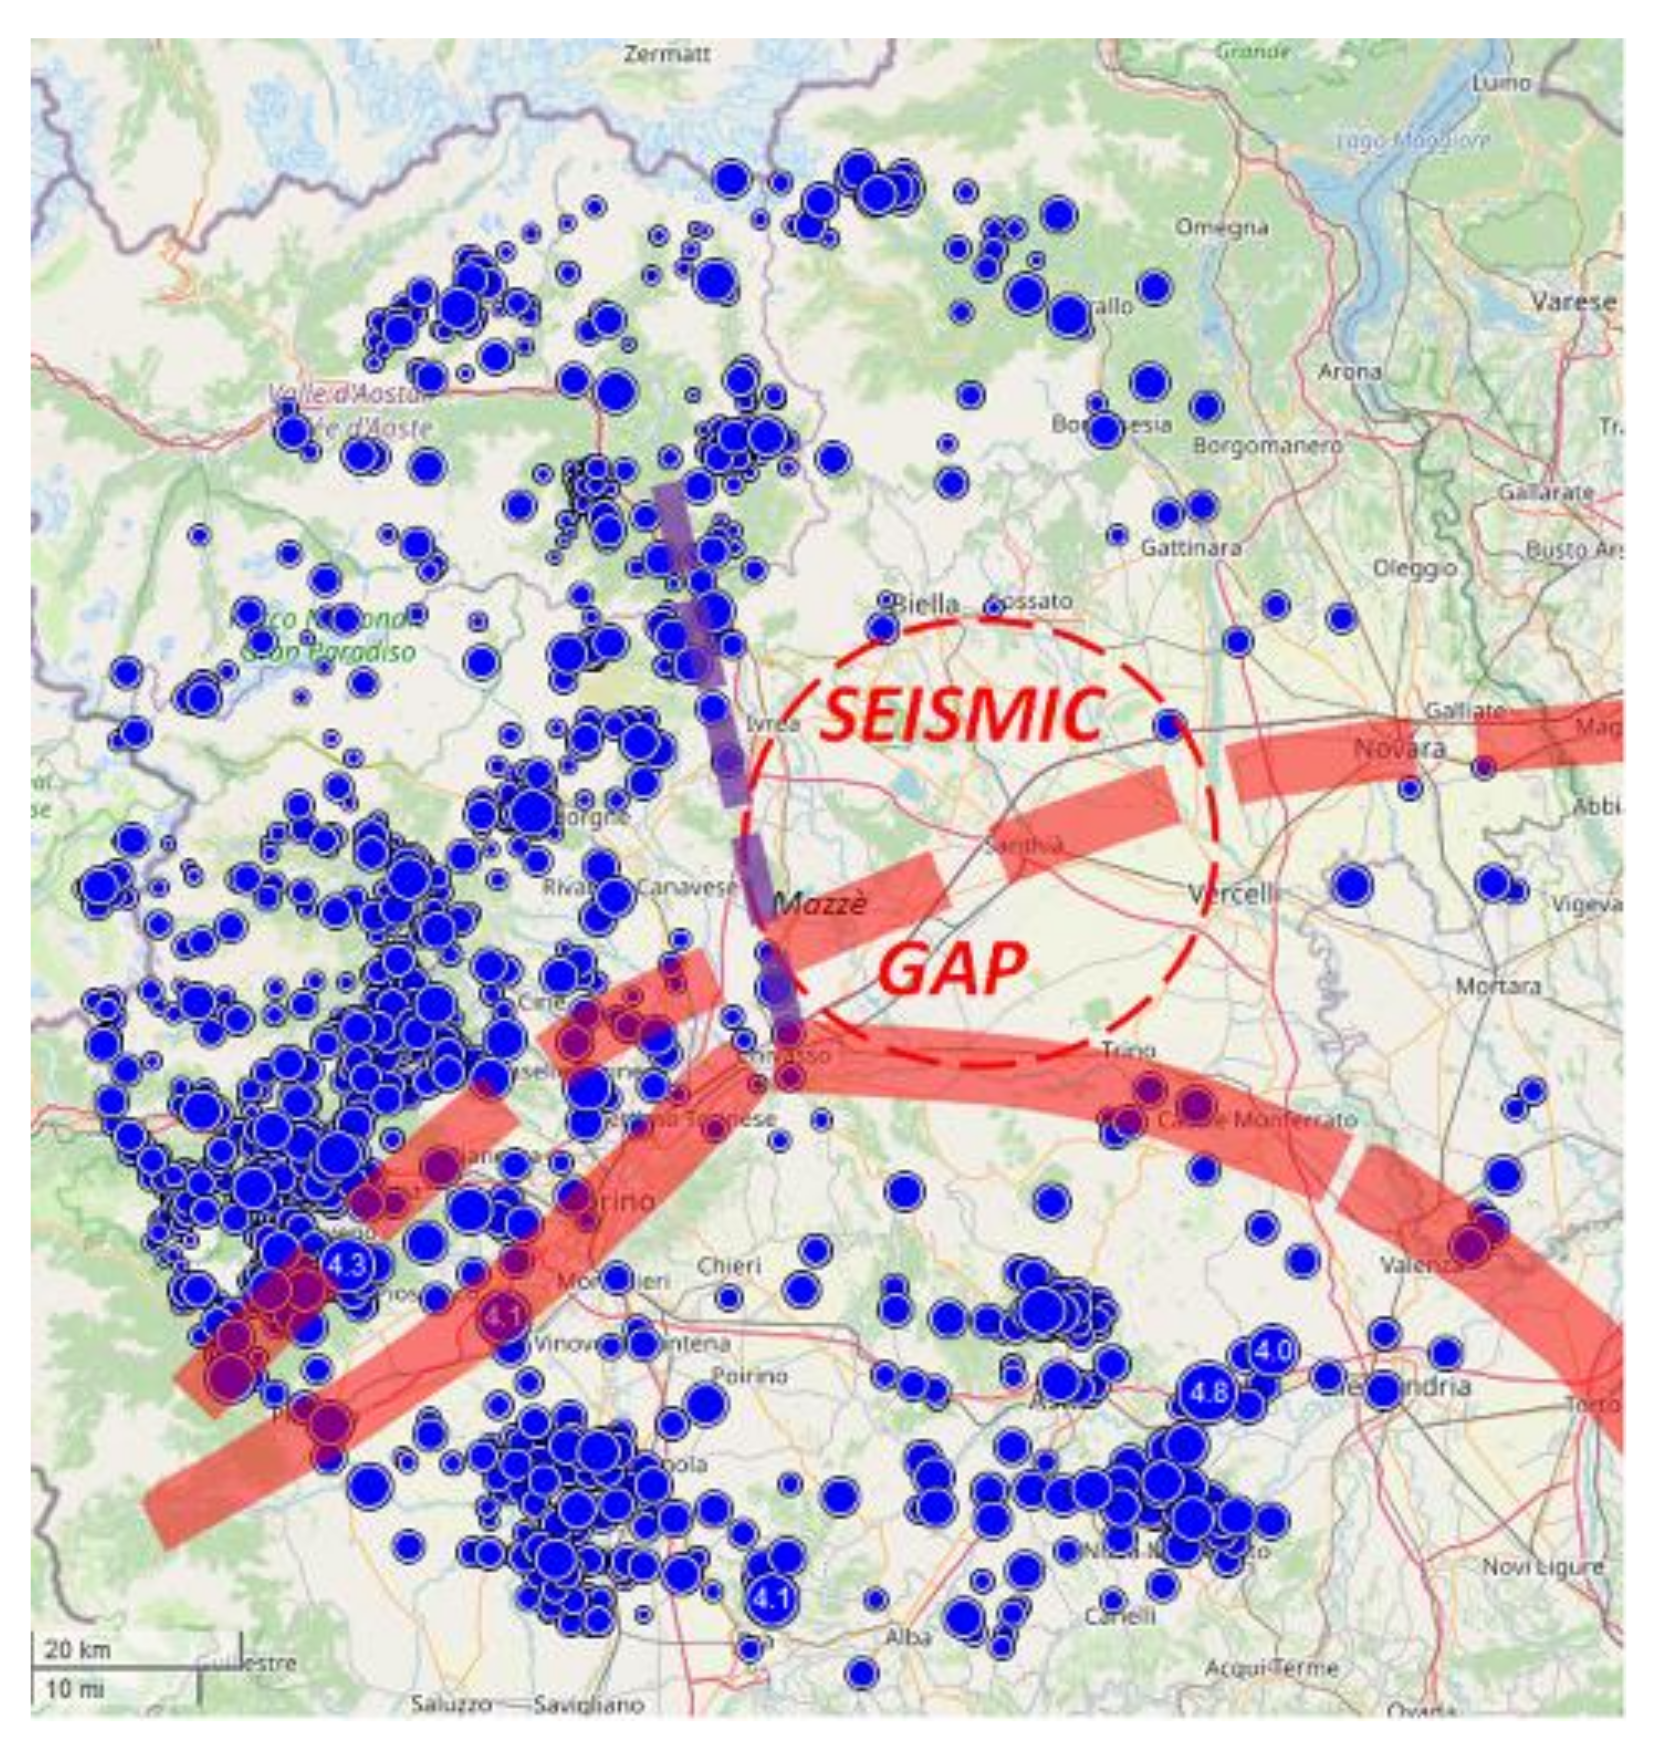
Additionally, the high seismic risk of the area is underscored by the earthquake’s distribution mapped in the ISIDE-INGV Catalogue. The positions of the recorded epicentres within a distance of 70 km from Mazzé show that within a distance of about 25 km from the municipality of Santhià (the area includes the present nuclear sites of Saluggia and Trino Vercellese) no earthquake was recorded with magnitudes M
L ≥ 1.0 (
Figure 5).
This situation, interpreted by considering the active compressional tectonics existing in the area [
47,
48] and the high density of earthquakes epicentres that occur all around, defines a “seismic gap”. As postulated by McCann et al. [
49], these sectors of the lithosphere show a “high seismic risk” since the seismic energy is not regularly dissipated as occurring in the neighbouring areas. Therefore, the accumulation of elastic strain can ultimately favour the rupture of significant portions of the crust, triggering higher magnitude earthquakes [
50,
51].
Figure 5 also shows the innermost position of the underlying alpine units and the western segment of the Apennine frontal thrusts, as reported in the DISS “database” (
http://diss.rm.ingv.it/diss/ accessed on 13 May 2021). These Apennine trusts show a disjunction close to the city of Chivasso, where a NNO-SSE tear-fault apparently follows the distribution of hypocentres at the western edge of the cited seismic gap. Sue et al. [
52] suggest a left-lateral component for this fault that could be linked to a counter-clockwise rotation of the Adria microplate, undergoing compression against the Alpine orogen. In conclusion, although the EC2 criterion of the Technical Guide n. 29 of ISPRA is limited and inaccurate (since the time window for evaluating seismicity is restricted to the actually historically recorded earthquakes, and does not take into account the “effective time-scale” of geological processes), the above data strongly indicate that the TO-10 area can be considered at “high seismic risk” and, therefore, not adequately safe for hosting the National Nuclear Waste Repository.
3.3. Holocene Uplift, Erosion and Sedimentation
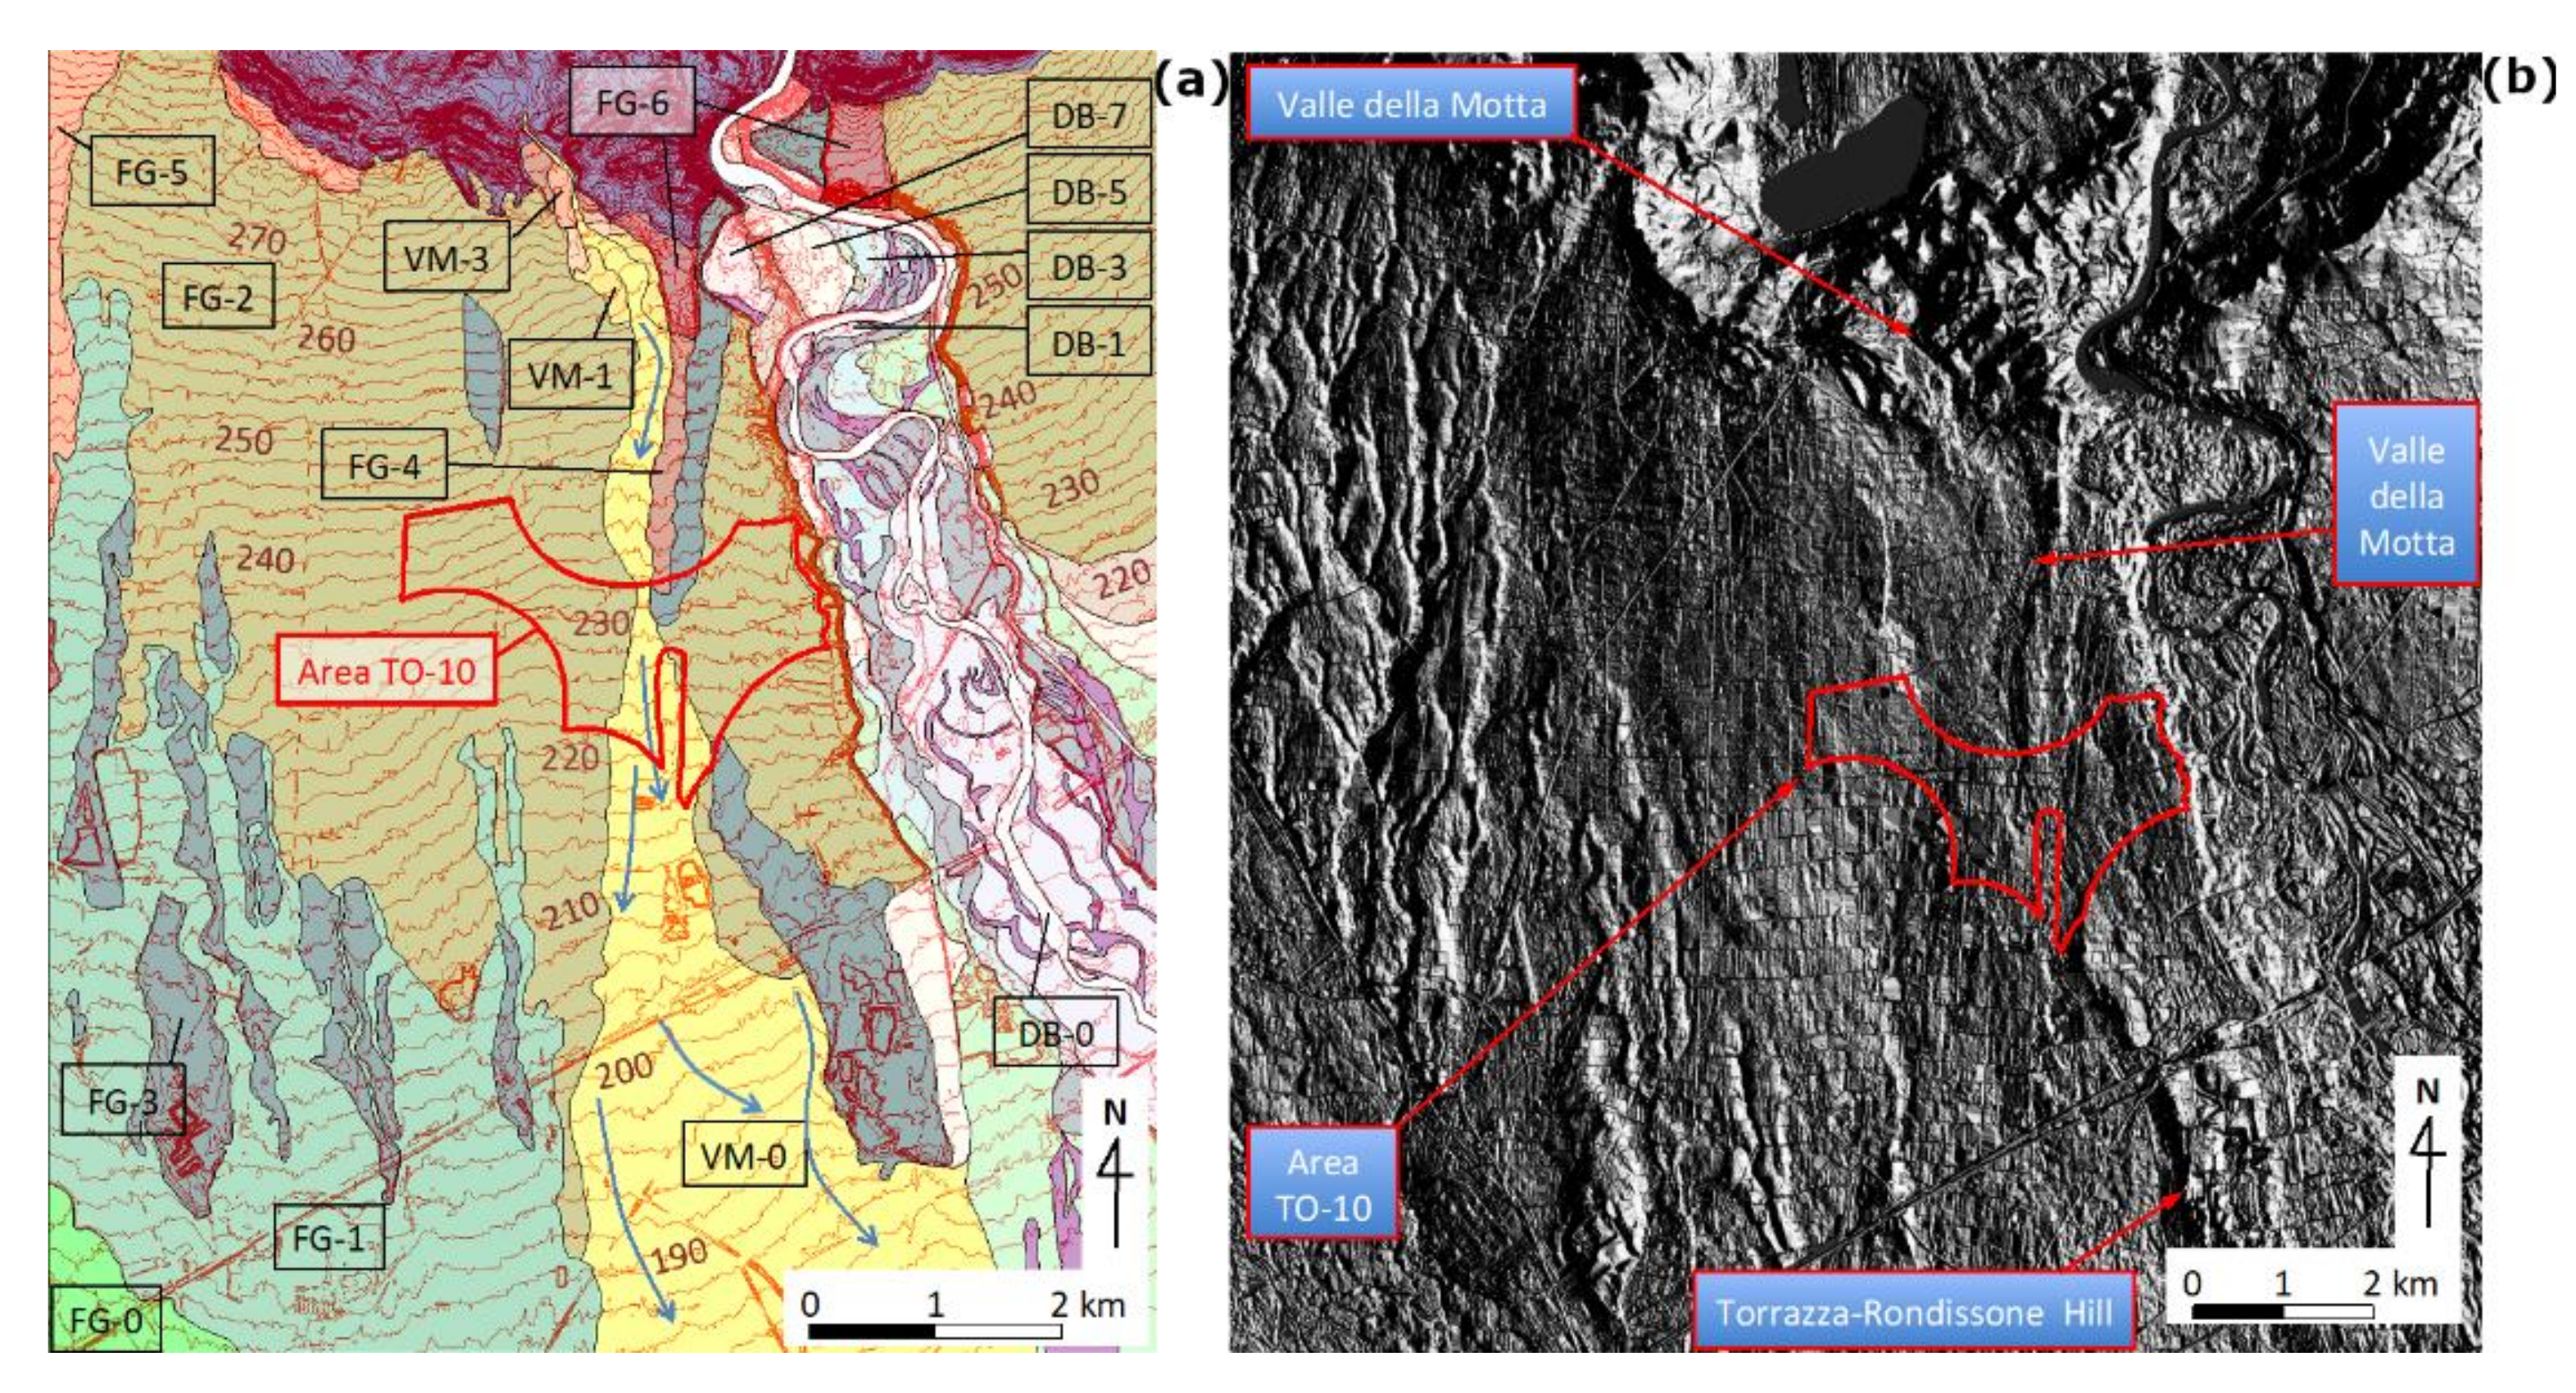
The area, extending Southward of the Ivrea moraine arc, consists of glacio-fluvial sediments deposited in the frontal zones of the Pleistocene glaciers that descended along the Aosta Valley from the Monte Bianco Group [
53,
54,
55]. Area slopes range from 1.6°, close to the frontal moraines in the north, to 0.6° in its southern part, where the Monferrato hills (the front of the Apennine) interrupt the plane and the Po River flows eastward. The fluvio-glacial plane is dissected NW-SE by a deep incision that forms the “cañon” of the Dora Baltea river (
Figure 6—left). This cañon has been, and is currently being, cut in the unconsolidated glacio-fluvial deposits for a depth of about 60 m and a width of 2200 m. The sides of the cañon are occupied by a set of fluvial terraces and abandoned riverbeds, that are mapped in
Figure 6, [
54]. A set of older glacio-fluvial terraces can be also identified in the glacio-fluvial plane bordering the cañon including the “Valle della Motta” (close to the TO-10 area) drainage system. The Dora Baltea cañon exits the Ivrea moraine arc, forming four major entrenched meanders, signed on their top by paleo-meanders, fluvial drainages and terraces; these testify that the river in the past was at a higher altitude than presently, although flowing close to its equilibrium profile. On the flanks of the canon, 7 terraces can be recognized ranging from the younger ones, lying along the river, to the older ones found at higher altitudes. Downhill of this first section, the river anatomizes (with no more entrenched meanders) and flows into several riverbeds with few terraces left on the sides. Loose, easy-erodible, glacio-fluvial sediments that constitute both the sides of the Dora Baltea cañon up to the very top and the high-erosion potential of this river indicate a very young age for the formation of the cañon (younger than the latest Pleistocene glaciation). It is worth to remind that the Dora Baltea is the largest tributary of the NW sector of the Po River basin; in 2000 the Dora Baltea flooded with a flowrate of about 3000 m
3/s at the intersection with the Po River, itself having a flowrate of about 5000 m
3/s [
56].
The fast erosion of the cañon is confirmed by the absence of secondary tributary streams of the Dora Baltea on its flanks, where numerous perched springs can be found. Authors’ interpretation leads to admit that the erosion of the cañon took place after the end of the latest glacial episode about 25,000 years ago [
54], during a continued uplift of the area. This is, also, confirmed by the numerous terraces and abandoned riverbeds of the paleo-Dora Baltea parallel to the Po River east of their junction [
48]. In summary, this complex geomorphological situation, which involves fluvio-glacial terraces, fluvial terraces and entrenched meanders, strongly supports the idea that the area is undergoing an uplift. This is estimated in more than 1.5 mm/y [
57]. If one would assume a reasonable uplift of about 2 mm/y, during the last 30,000 years (i.e., since the latest glacial maximum) the total expected uplift would be in the order of 60 m; this value appears to be consistent with the height difference between the present FG-3 level and the Dora Baltea River.
A recent uplift is also proposed by Giraudi [
47] for the terraces along the Paleo-Dora Baltea and the Po river, at the East of the present confluence between Dora Baltea and Po river. An additional uplift was observed at the west of this area, being responsible of the modification of the course of the Po river [
58]. Consequently, it would appear anomalous if no uplift affected the area comprised between these two sectors, given the identical tectonic settings with the Apennine Frontal Thrusts (AFT) overthrusting the retrovergent units of the Alpine range (which are currently uplifting at a rate of 1.2 mm/y [
59]).
Additionally, looking at
Figure 6, it can be noticed that the TO-10 area is crosscut by the “Valle della Motta” drainage system, where surface and near-surface materials (gravel, sands and discontinuous thin silty-clayey horizons) have been re-worked and redeposited during the Holocene. The Regione Piemonte in [
25] classified the southern sector of this drainage as at high risk for periodic flooding (return times varying between 25 and 50 years). Moreover, the nature and the geometry of the sedimentary cover series, as well as their high hydraulic conductivity (10
−2–10
−3 m/s) [
24], categorically exclude the presence of a “geological barrier” to the escape of radionuclides, that IAEA standards require. All of these considerations make it possible to confirm that the area matches EC4 and EC5 criteria, resulting in not being suitable to host the RW repository also from this point of view.
3.4. Hydrogeological Data
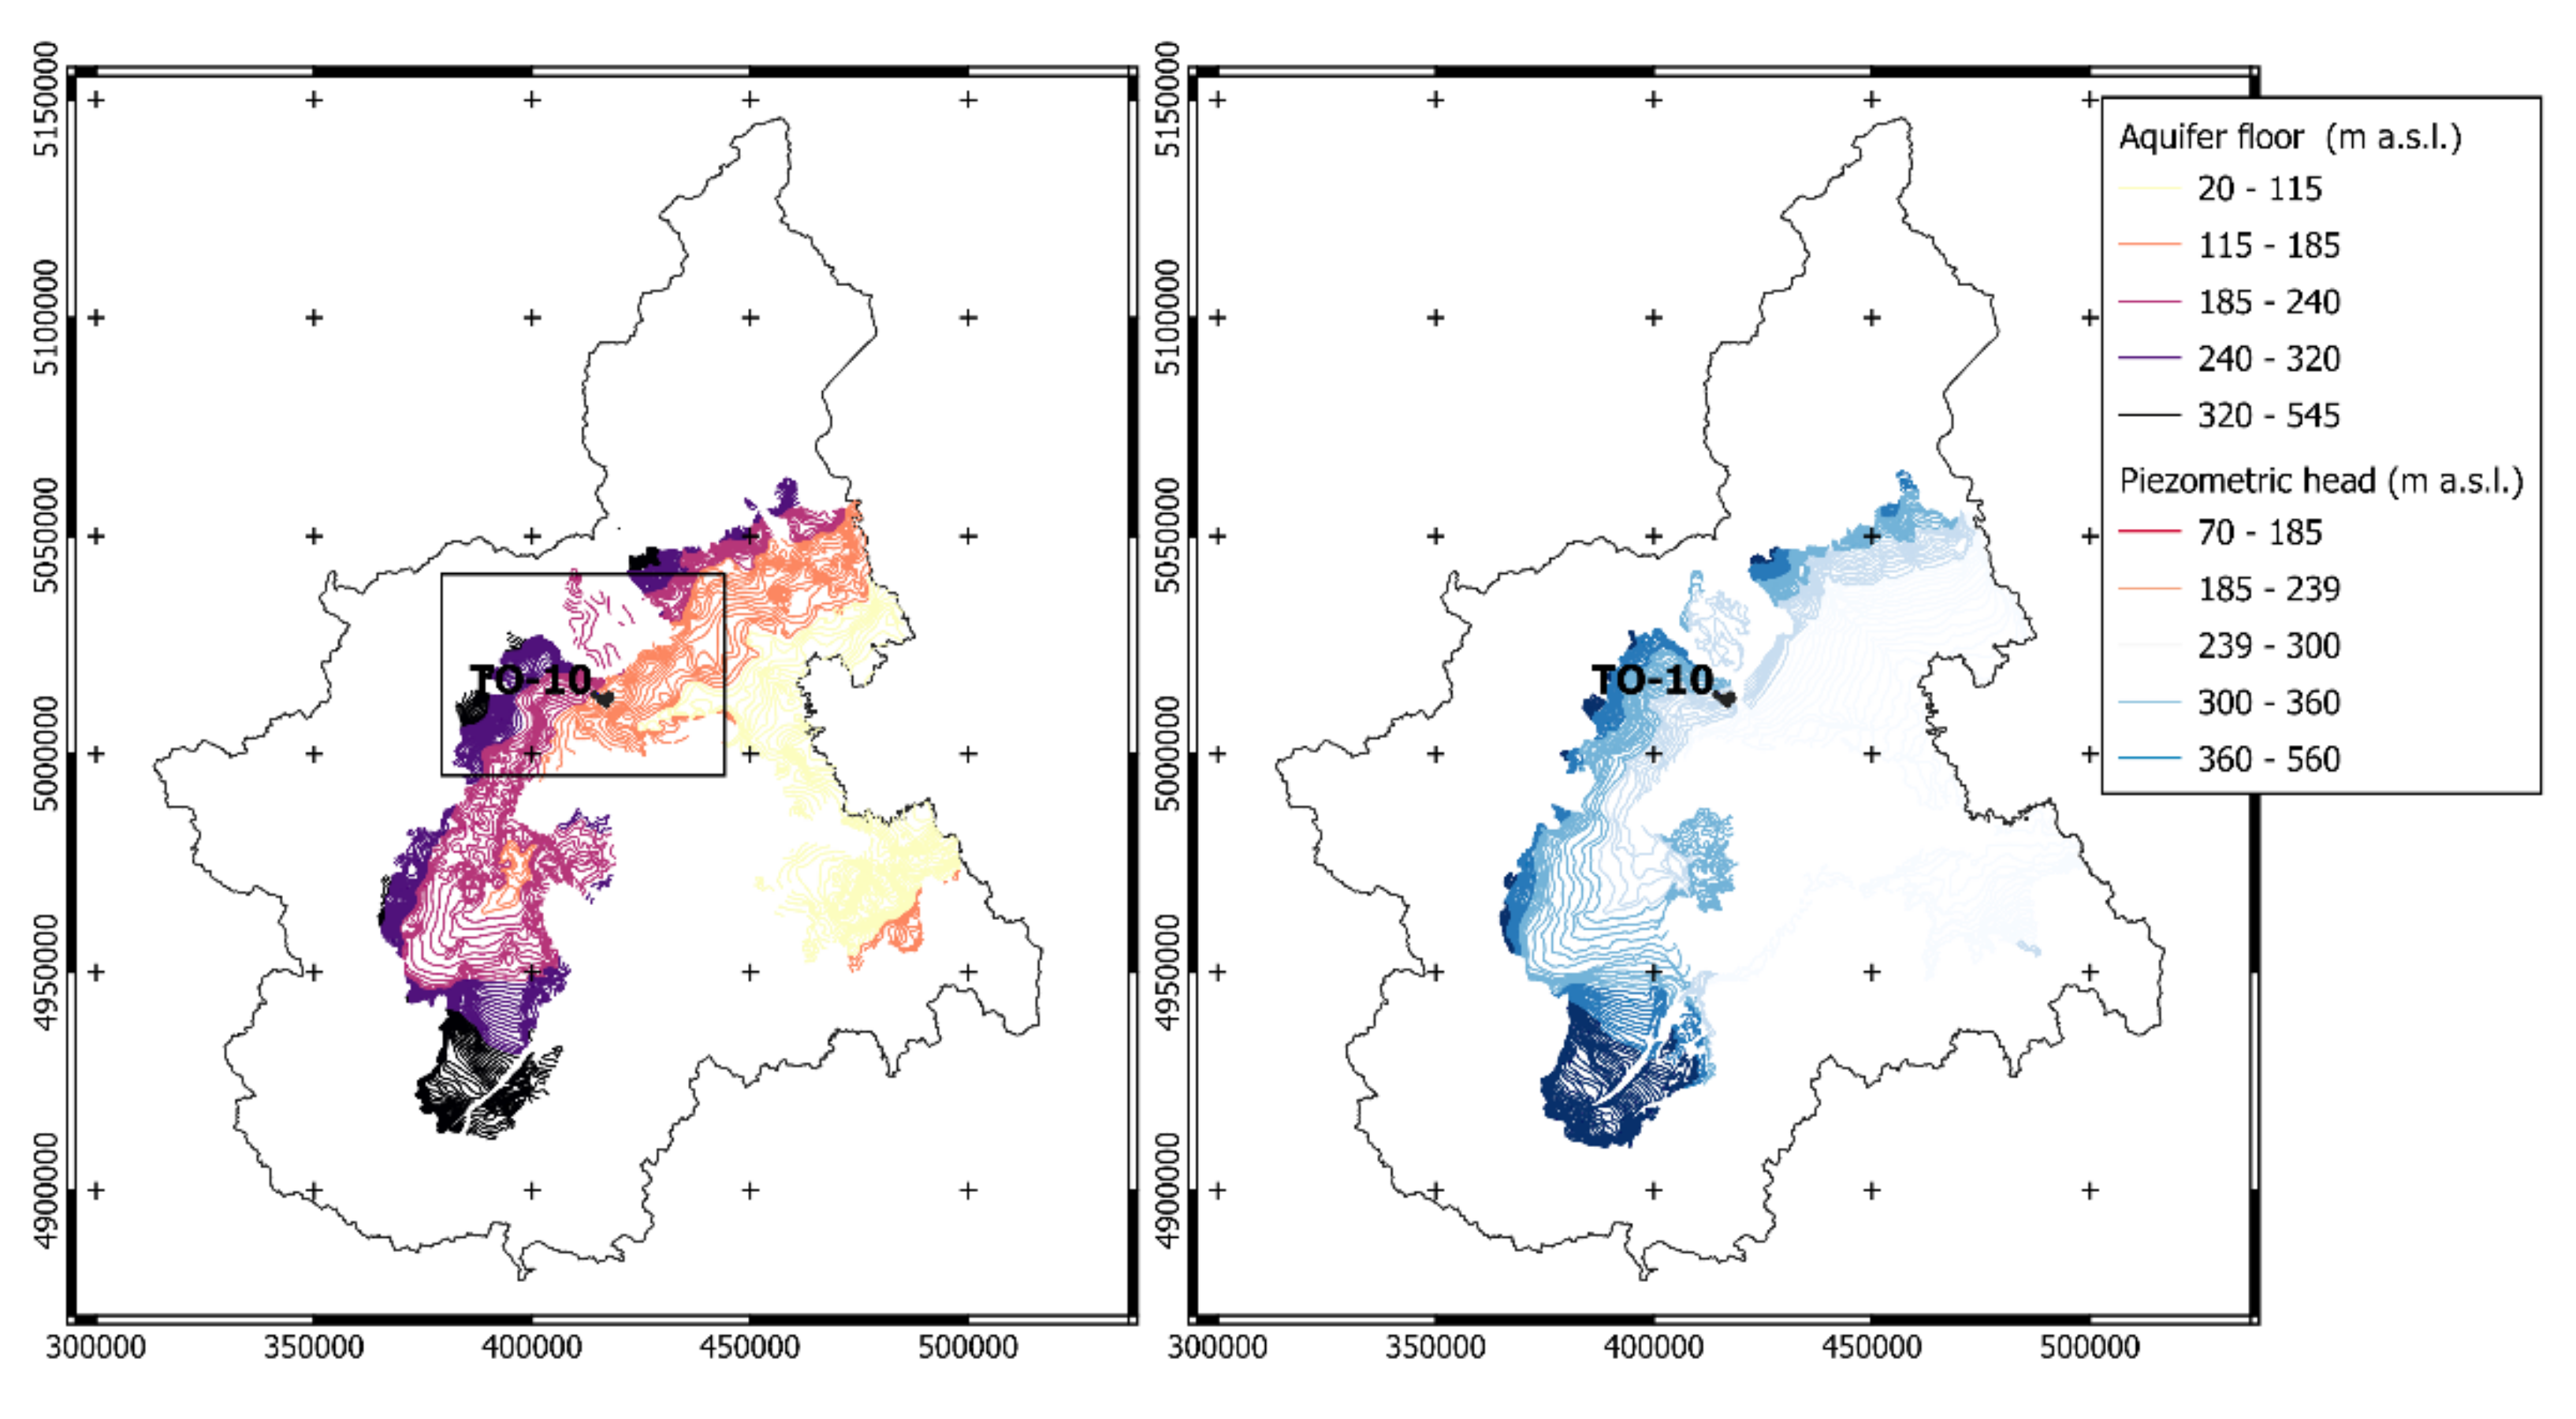
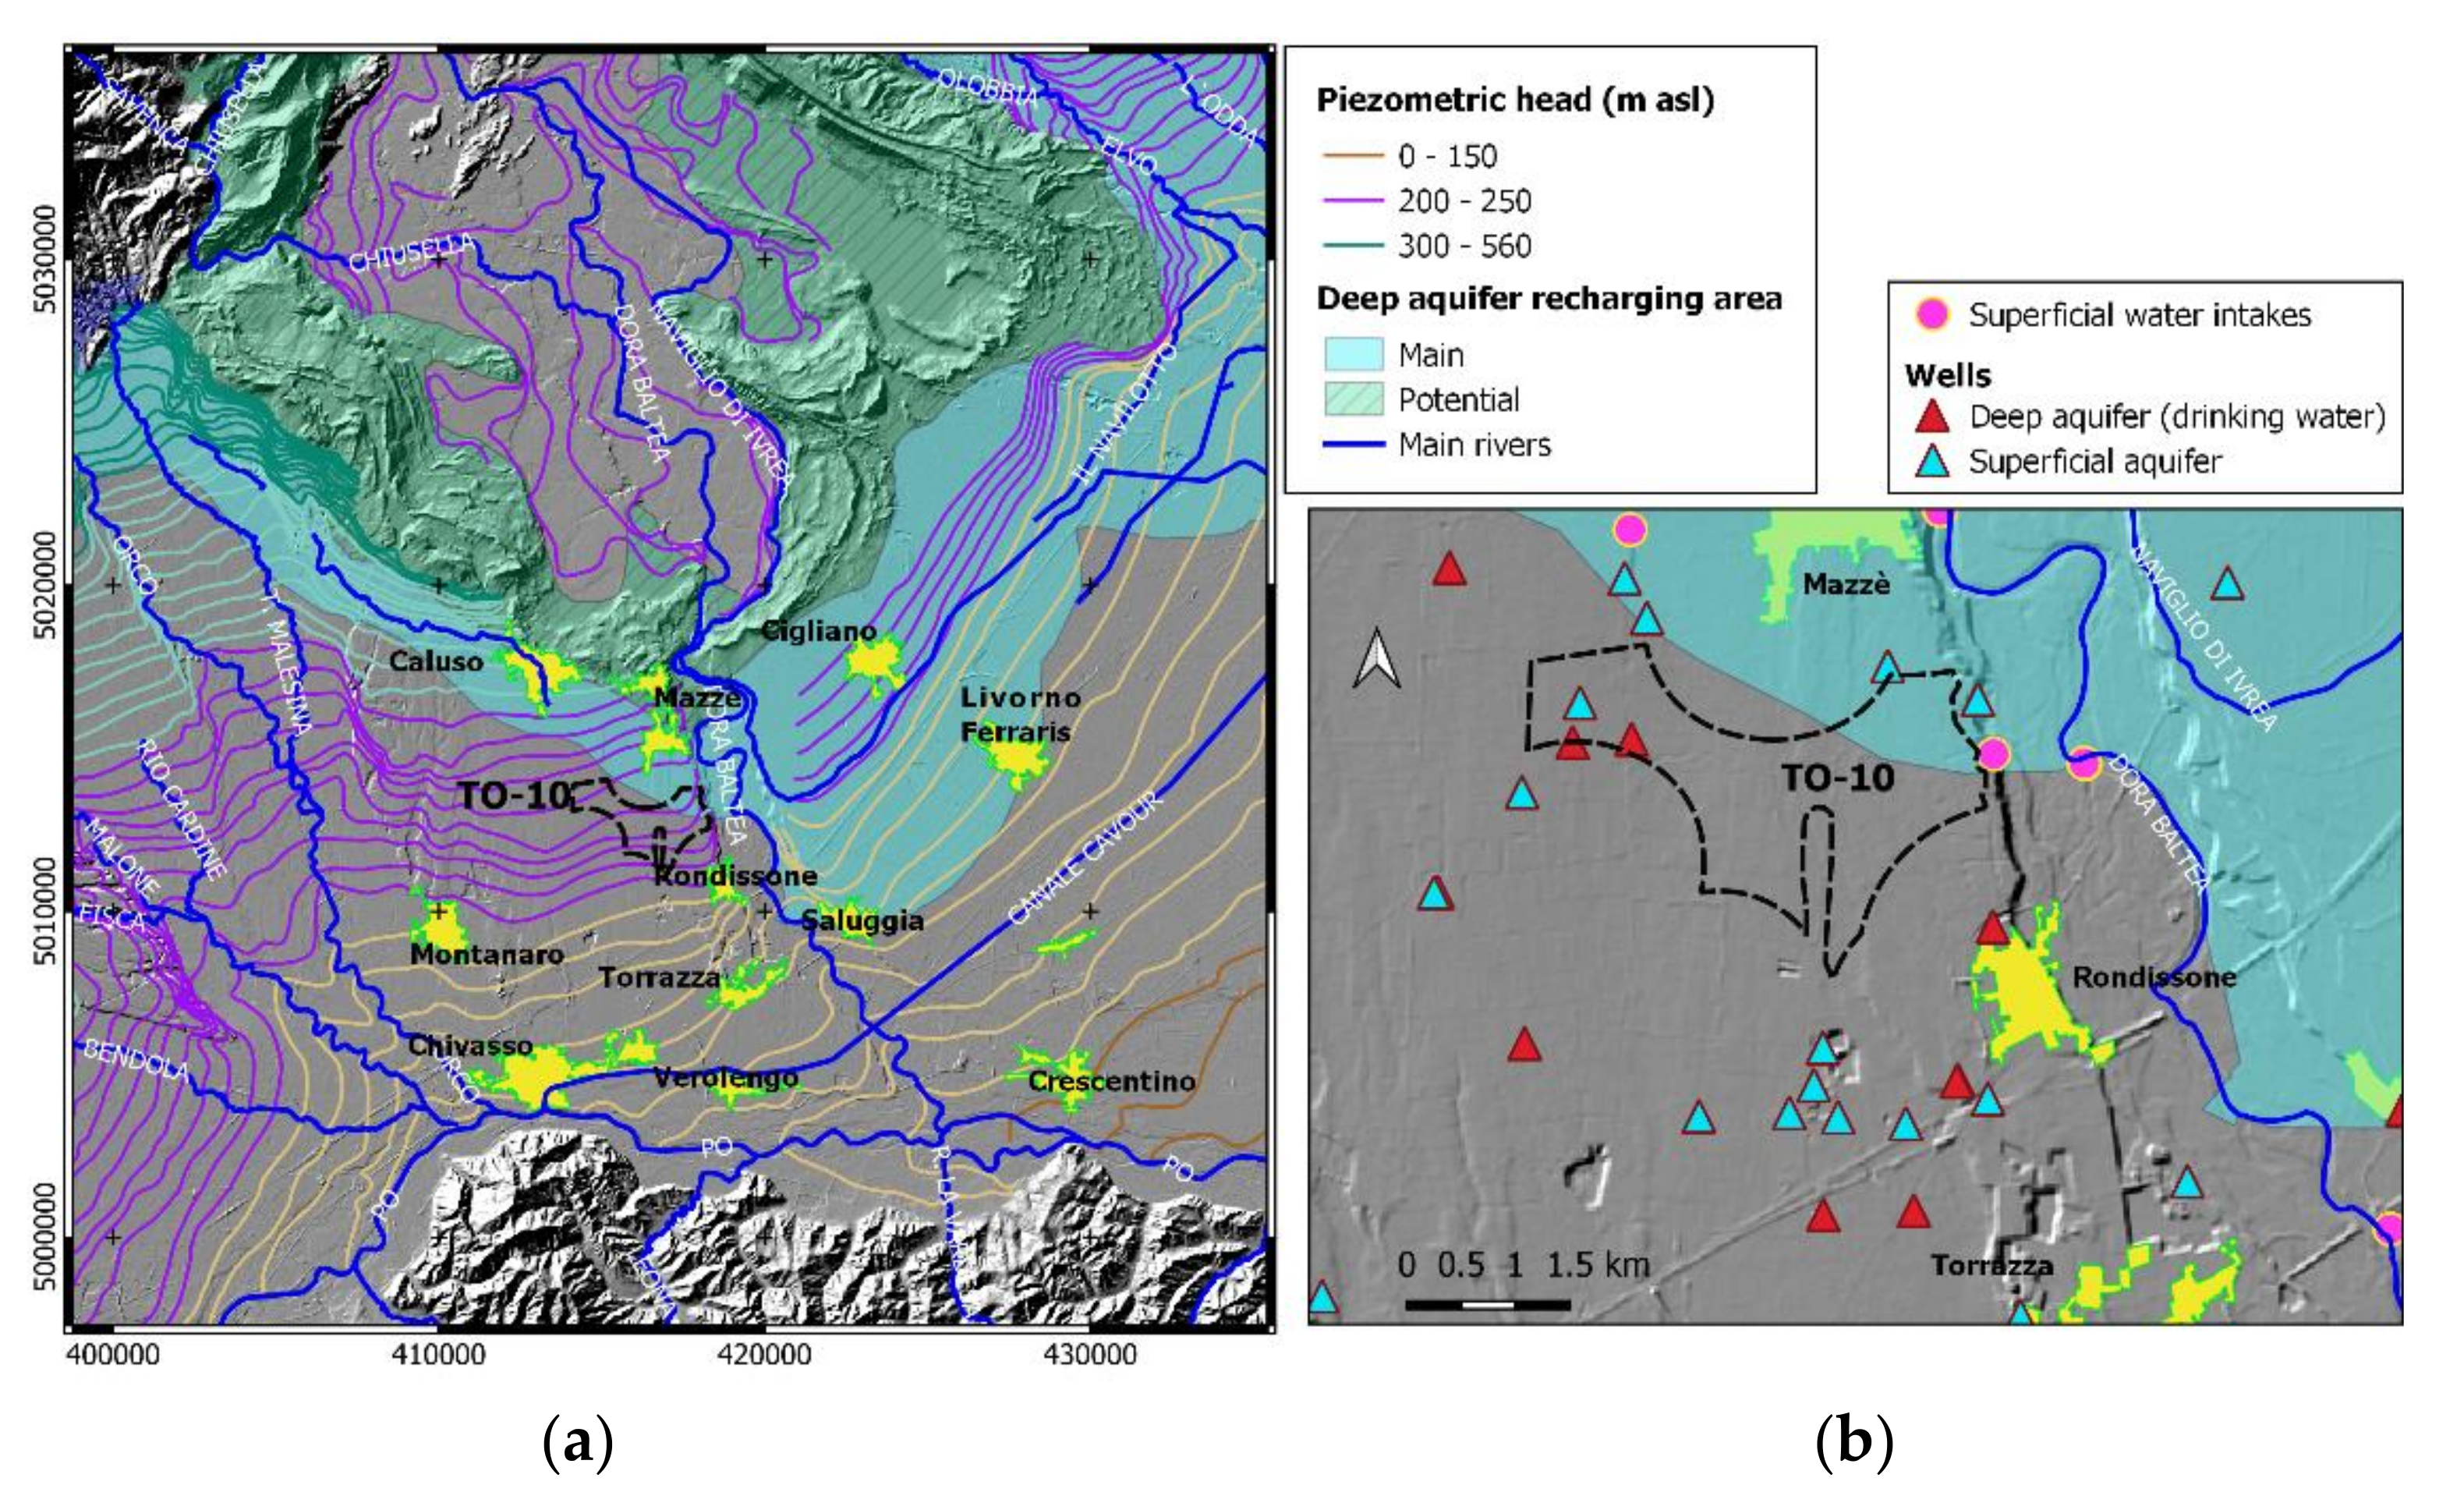
In order to test the EC10 criterion, a preliminary analysis of macro-evidences from open hydrogeological data was achieved. In
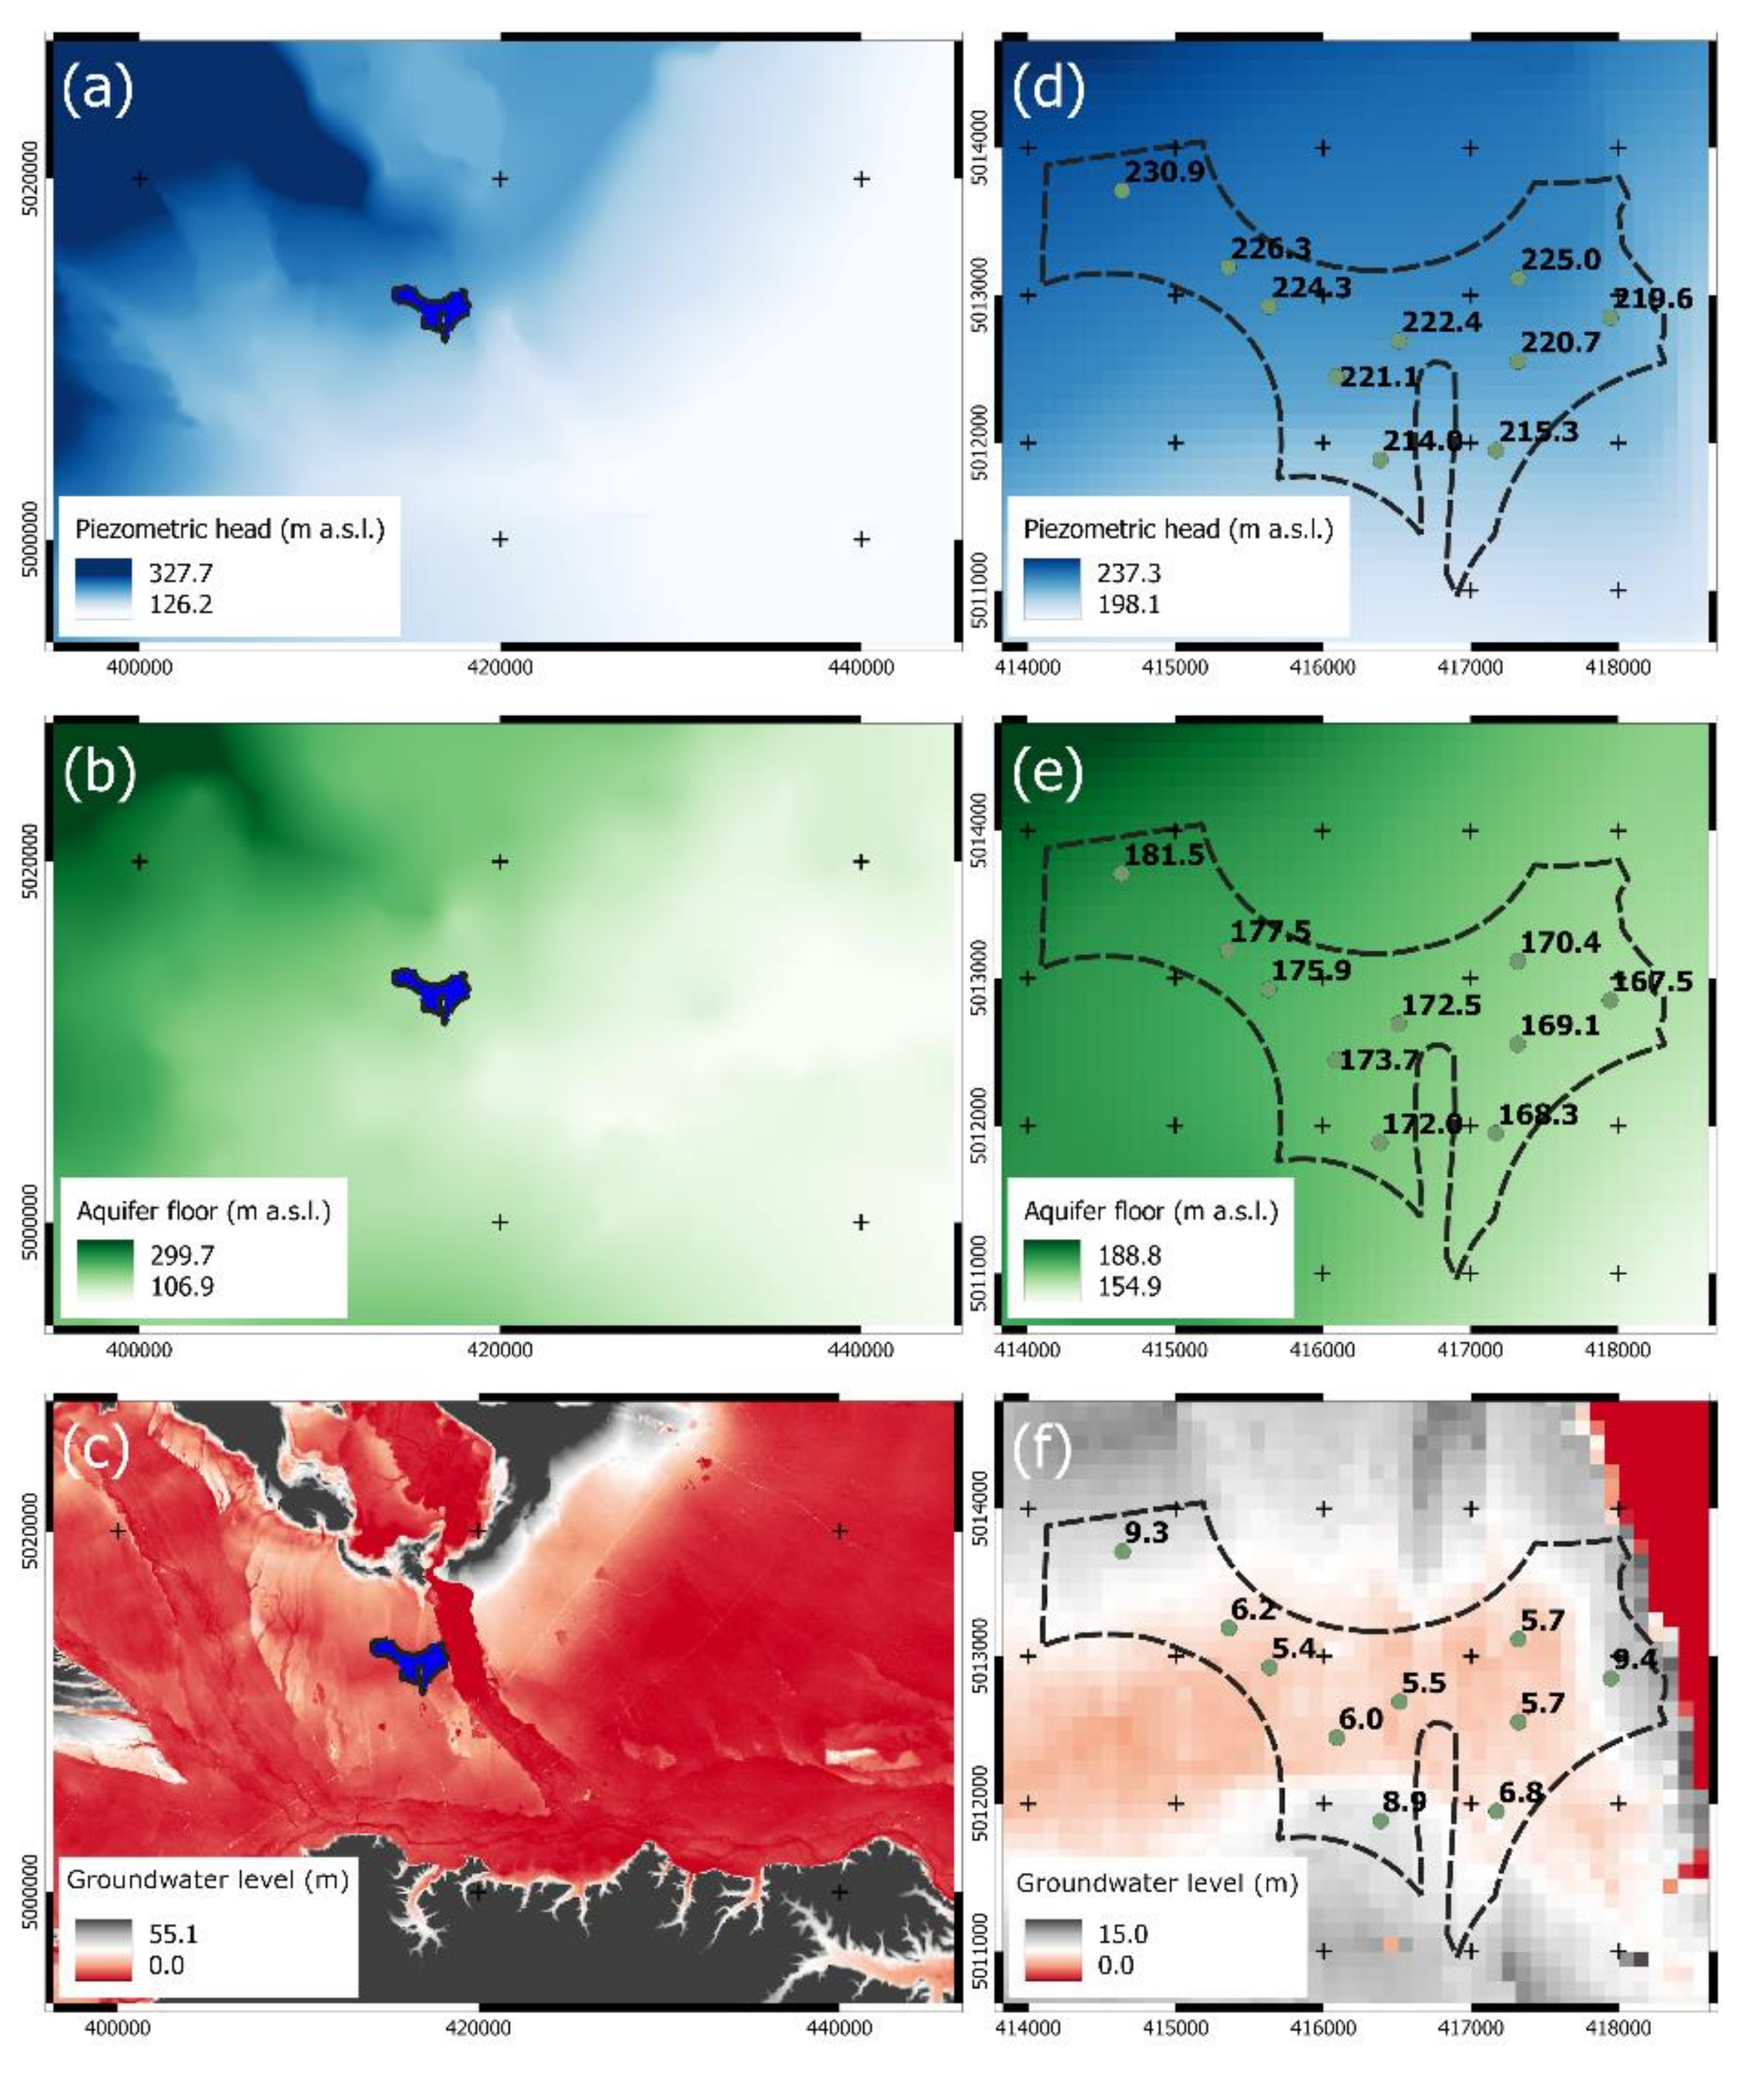
Figure 7, the native layers from the regional geoportal are shown for the whole Piemonte Region to make evident that the TO-10 site is located in one of the most strategic and critical areas for groundwater dynamics. PH and AF layers refer to the superficial aquifer; differently, the RS layer maps the recharging area of the deep aquifer, that provides drinkable water to a great part of the Piemonte region. In
Figure 8, the area hosting the T0-10 site is specifically investigated with respect to the above-mentioned layers, showing that: (a) the site partially lays in the recharging area of the deep aquifer (NE part); (b) a system of wells is present in the area. In particular, eight wells for water catchment from the deeper aquifer (some of them for drinking water supplying) fall in, or nearby the area, making local population and agricultural activities highly exposed to the environmental risk associated with the RW repository.
The whole scenario becomes critical if we consider the possibility of leakage from the repository basement coupled with the location of wells within the site and south of it proceeding downhill and of the nearby Dora Baltea cañon. A possible contamination front of radioactive aqueous solutions, in fact, could not only compromise the local deep aquifer, but also reach the Po river, exponentially increasing the nuclear risk within the whole Po basin.
To give a continuous representation of the main hydrogeological features in the area, native vector layers (namely PH and AF) were rasterized. To verify the suitability of spatial interpolation, correspondent points layers (
Figure 9a), were used to test spatial autocorrelation by variogram (
Figure 9b, for PH only). Variograms proved that spatial autocorrelation exists up to about 20 km, making possible to interpolate.
Interpolation was operated by means of the “natural neighbour” technique generating two raster maps, PH(x,y) and AF(x,y), with a grid size of 100 m (corresponding to about one tenth of the average planar distance between the mapped contour lines). With special concern about the main issue considered in the EC10/IC8 criteria, i.e., the possibility that an interference can occur between the superficial aquifer and the repository structure, S(x,y) was generated, mapping the distance of the groundwater table from the ground surface. S(x,y) was generated by comparing PH(x,y) with the available DTM by grid differencing.
Validation of
PH(
x,
y) was operated with respect to the 20% (4532) of the points obtained while converting the correspondent line vector (a total of 22,660 points). MAE and RMSE values were found to be 0.44 m and 0.79 m, respectively. According to [
35], MAE is a more robust estimator of actual accuracy of model. Consequently, we assumed it as the reference one to get an estimate of the theoretical accuracy of
S(
x,
y).
The latter can be estimated relating uncertainty of DTM (σDTM = ±0.33 m) and PH(x,y) (σPH = ±0.44 m) by the Variance Propagation Law of Equation (1). Accordingly, it was found that the theoretical accuracy of S(x,y) was ±0.55 m.
PH(
x,
y),
AF(
x,
y) and
S(
x,
y) raster maps are reported in
Figure 10. They show the area at two different scales: the landscape one (
Figure 10a–c) aimed at locating the TO-10 site into the general hydrogeological system; the local one (
Figure 10d–f) focusing on the local conditions of the TO-10 site and reporting some numerical values useful to recover the proper quantitative reference.
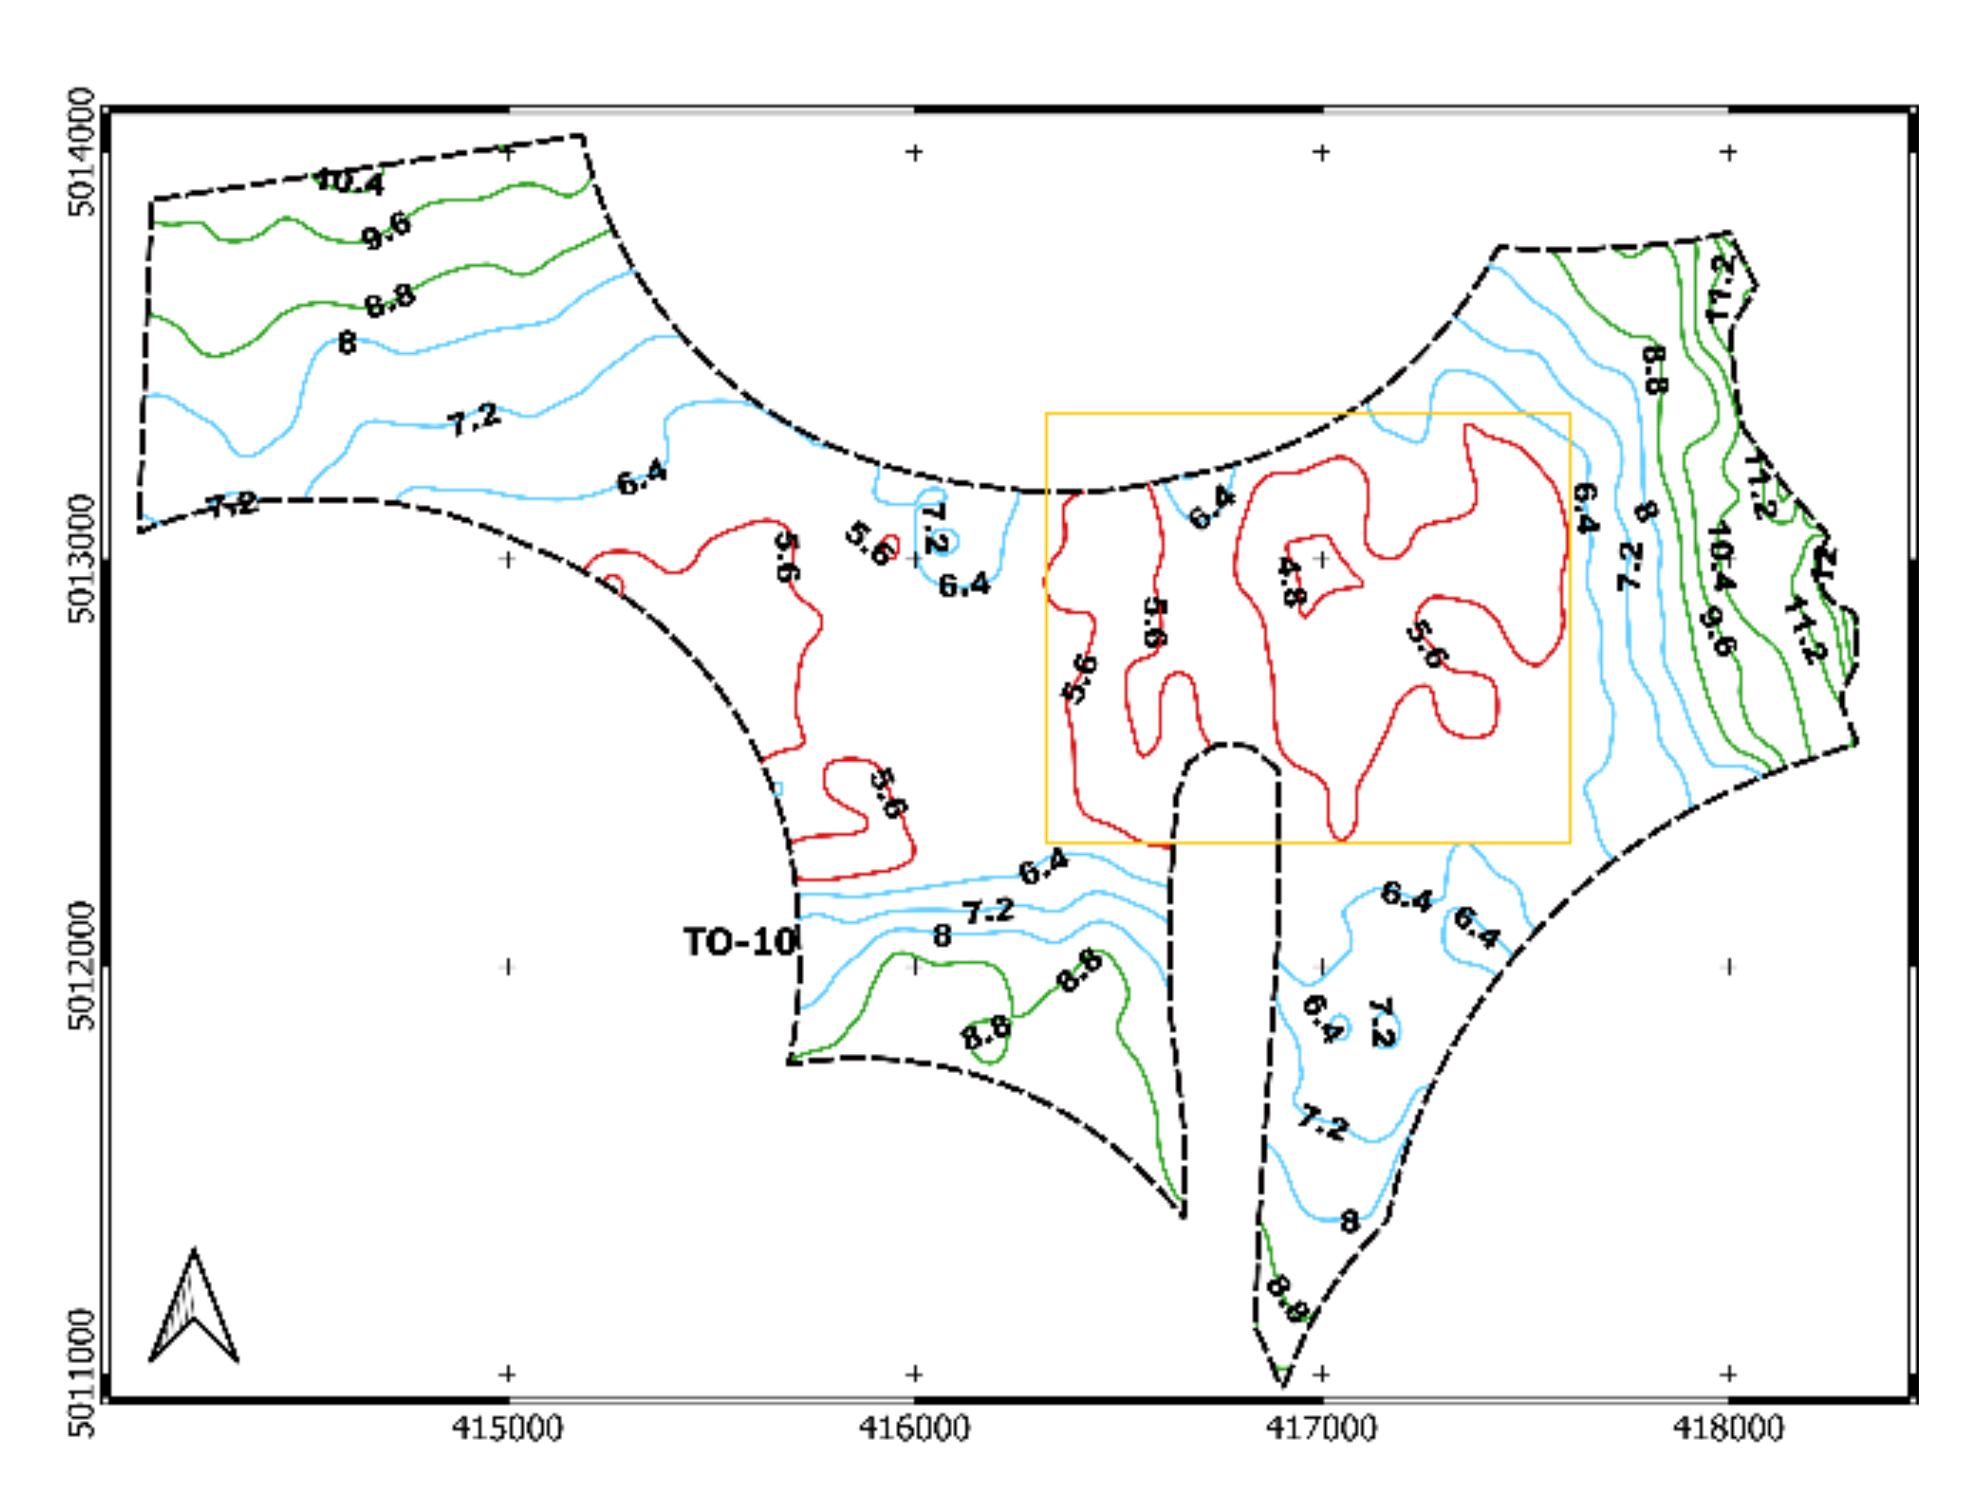
A further specification is given in
Figure 11 where it can be observed that the distance of the groundwater table from the ground ranges between about 11 m (NW part), down to 4.8 m (central/eastern part, yellow squared). If we account for the most cautious conditions, these values have to be refined taking into consideration seasonal variations of PH and uncertainty of
S(x,y). The former can be deduced from [
24] that, for a site located close to the TO-10 site, eastward in the Vercelli plain, reports an average yearly seasonal variation of the local groundwater table of about ±4 m. The joint effect of measure uncertainty and seasonal variation increases to ±4.55 m the cautionary value that one has to consider when mapping the local groundwater. This value makes possible that the actual level of the superficial aquifer in the area could even reach the ground surface and significantly affect the RW repository basement and its foundations.
It is worth stating that the repository lower level, where the higher activity scoriae are supposed to be stored, is expected to be located up to about 10 m depth ([
60] p. 47).
This hydrogeological vulnerability of the area was well known to Sogin since 2005: in a paper published in cooperation with the Politecnico of Torino [
20], the TO-10 site area was indicated as a
high vulnerability one; it is therefore surprising that this site could have entered (and gained the top of) the list of the potential suitable sites to host the RW repository.
This scenario can get worse if we consider the concentrated channel network crosscutting the area and supplying water to the local crops. In the light of the above, it can be easily demonstrated that the data reported by Sogin have not been analysed and rigorously interpreted to assess the vulnerability of the TO-10 site. Sogin itself, in DNG S00102 [
18] and DNG S00304 [
61], indicates that further in-depth studies are needed (by applying the IC8 criterion), thus diverting the problem from the exclusion criterion EC10 to the investigation one IC8. Indeed, the area TO-10 had to be excluded in the first place by Sogin.
3.5. Testing the EC12 Criterion
The first issue about the application of this criterion is the general ambiguity of the procedure outlined by Sogin. Advanced and well-designed strategies of investigation, mainly hierarchical and addressed to evaluate local relationships among neighbouring inhabited centres, are described in [
37] and somehow revisited in [
18,
62] (see [
18] at page 158). Nevertheless, only some of the above indications have been applied by Sogin while redacting the CNAPI map. In particular only the first level of investigation was achieved, that relies on the direct application of a buffer (as previously described) to the LOC2011 polygons having codes 1, 2, 3. Topological relationships related to “local urbanisms” and “metropolitan areas” were not considered at the current stage, although reported in the above mentioned documents. In this work we implemented the analysis related to the “local urbanisms” as described in [
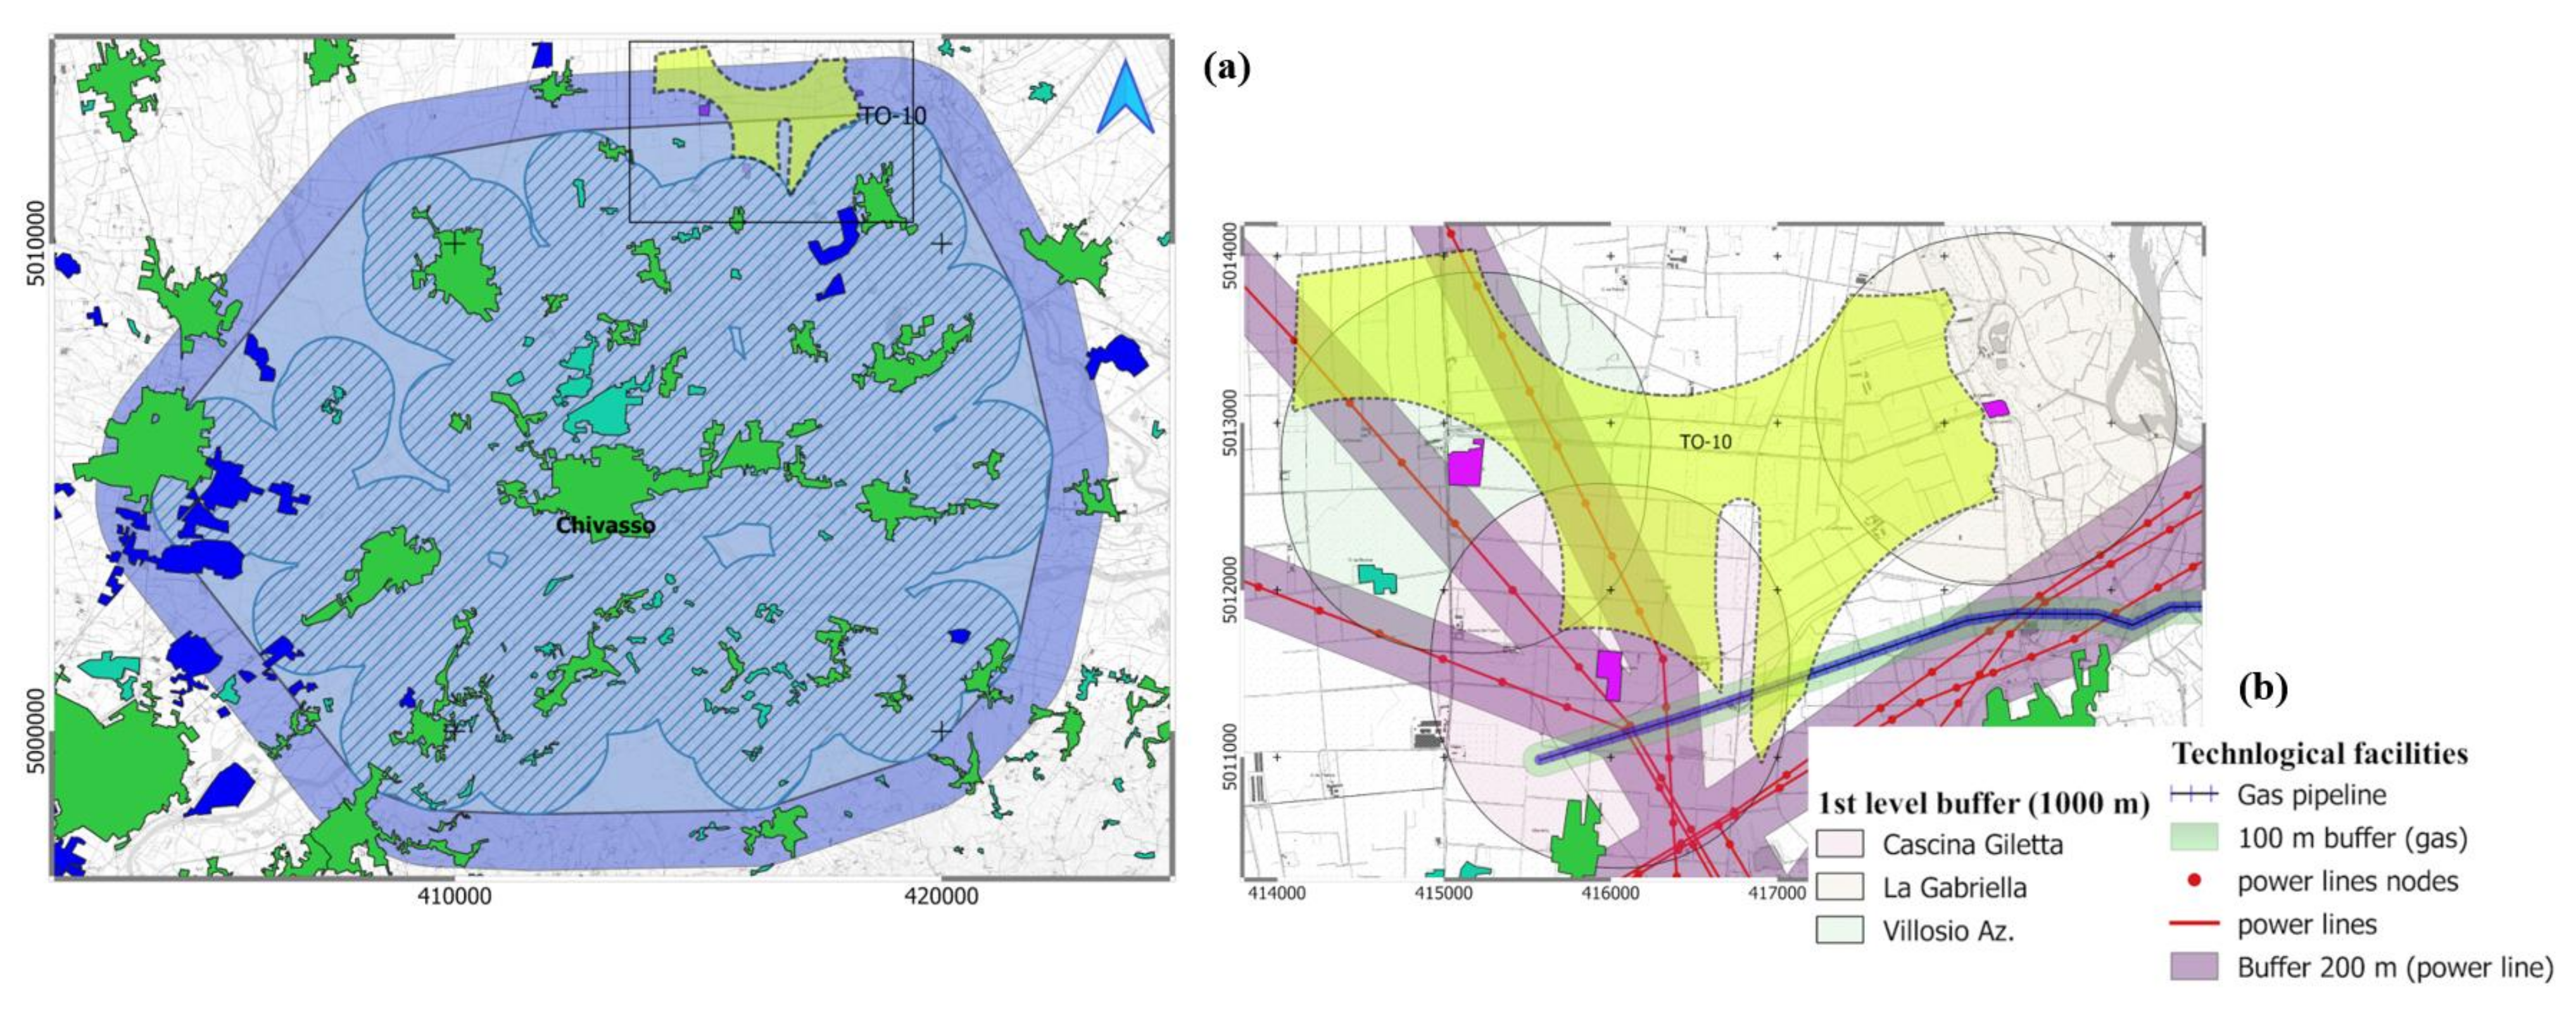
37]; accordingly, the Chivasso municipality (having more than 20,000 inhabitants), located close to the TO-10 site, was considered and the LOC2011 layer used as geometrical basis. We found that the “local urbanism” of Chivasso (relating all the settlements included within a distance of 5 km from the borders of its main centre) impacts definitely the TO-10 area (
Figure 12a). The suitable area of the TO-10 site, that presently sizes about 515 ha, would be reduced to about 44 ha, making it absolutely inadequate for hosting the national repository, whose size is expected to be around 100–110 ha (see [
13]).
Additionally, even neglecting the Chivasso “local urbanism” analysis, strong constraints would come if the three earlier mentioned settlements of “Cascina Giletta”, “Cascina Gabriella” and the Villosio bio-gas plant (
Figure 12b) were considered during the 1st level buffering.
In fact, the correspondent 1 km buffers split the TO-10 site into two separated areas, the greatest reaching about 124 ha. Given the resulting shape of the residual suitable area the preliminary project of the repository proposed by Sogin [
13] is practically unfeasible. Moreover, this remaining area is located exactly where the groundwater table is confined at a lower depth (less than 5 ± 4.55 m from the ground, see
Figure 11).
The TO-10 site is also crosscut by remarkable technological facilities, namely two power lines and a pipeline, whose layouts are reported in (
Figure 12b) together with their proper safety buffers (200 m for power lines and 100 m for pipelines) as required by Italian regulations. Additional concerns may include the possible domino effects related to accident risk involving the coexistence, within a limited space, of the repository, of the cited technological lines and the nearby Villosio bio-gas plant (possibly recalling the CE15 criterion—“
areas characterized by the presence of industrial activities showing a risk of relevant accident, dams and artificial hydraulic barriers, airports or operational military areas” [
18]).
4. Conclusions
The systematic analysis of available geological and geophysical data clearly demonstrates that the area TO-10 is located within a tectonically active geodymamic environment. Moreover, the analysis of recent instrumental seismic data, collected since the early eighties (ISIDE-INGV Catalogue) indicates the existence of a “seismic gap” in this sector of the Po plain that, coupled with the occurrence of regional uplift [
57,
58,
59], supports the idea that this sector of the Po plain could be the “locus” of major future earthquakes. For these reasons the area TO-10 clearly appears, already at this step of the procedure, matching the EC2 and EC3 criteria, definitely resulting not suitable for hosting a safe, long-lasting nuclear repository. Additionally, with special concerns about the analysis of the “Motta Valley” sector, was possible to verify that the TO-10 site also matches the CE4 and CE5 criteria.
As far as the local hydrogeological situation is concerned (EC10 and IC8 criteria), with reference to the available open data from the Piemonte Region geoportal, it was possible to demonstrate that the TO-10 site is located in a critical area. In particular: (a) the recharging area of the deep aquifer providing drinking water to great part of the South Piemonte, partially develops in the TO-10 site; (b) after mapping GL by spatial interpolation from native data, it was found that the depth of the ground water table can significantly interfere with the basement of the repository. All of these facts make possible to definitely state the not suitability of the TO-10 site also from the hydrogeological point of view.
The application, by GIS tools, of the EC12-related procedure, mapping the “local urbanisms”, made possible to highlight that the TO-10 site, greatly develops within the local urbanism buffer of the close municipality of Chivasso. Moreover, it was found that three important settlements (mapped on official maps from the Piemonte Region) were not considered by Sogin; related buffers would erode a great part of the TO-10 site making it drastically smaller. These findings from the CE12 criterion permit to conclude that the TO-10 site is located in a highly populated area and potentially can compromise important social and economic activities in this part of Italy. This situation makes the area compliant with the EC12 criterion and therefore not suitable to be included in the list of potential suitable sites by Sogin.
Additionally, one has to consider that the eventual “commissioning” of the TO-10 site, together with the “decommissioning” of the near Saluggia and Trino sites, currently hosting the most of the Italian nuclear wastes, would involve an accumulation of health and environmental risks for local population, thus making this part of Italy an hot-spot from the nuclear risk point of view. It is also curious that, in case of the TO-10 site selection, nuclear wastes would be transferred from areas showing an “extremely high hydrogeological vulnerability” (Saluggia and Trino) to a new one (TO-10) showing a “high hydrogeological vulnerability” [
20].
Concluding, in this work we tried to synthetically outline the “issues and perplexities” related to the procedure that many Italian territories (67 municipalities) are currently handling for safely preserve the health of their inhabitants and the conservation of their surrounding environment. It is our hope that this document could somehow stimulate a new deal in the Sogin (and future national planning) selection procedure where official open data will play a major and fundamental role, making it possible to speed up the times of the selection itself and saving public money.


