Article

Assessing Heavy Metal Contamination Risk in Soil and Water in the Core Water Source Area of the Middle Route of the South-to-North Water Diversion Project, China

1
School of Public Administration, China University of Geosciences, Wuhan 430074, China
2
School of Public Policy & Management, China University of Mining and Technology, Xuzhou 221008, China
*
Author to whom correspondence should be addressed.
Land 2021, 10(9), 934; https://doi.org/10.3390/land10090934
Submission received: 6 August 2021 / Revised: 2 September 2021 / Accepted: 2 September 2021 / Published: 5 September 2021

Abstract

:
The Middle Route Project of China’s South-to-North Water Diversion Project (SNWDP) is a national-level water source protection zone and the ecological safety of its water quality and surrounding soil is of great significance. In this study, heavy metals in the surface water and topsoil in the core water source area were quantitatively analyzed using a geographic information system (GIS) and geostatistical techniques combined with environmental pollution and ecological risk assessment models to determine their environmental contamination levels, ecological risk levels, and spatial distribution patterns. Cd was identified as an essential factor responsible for the overall slight heavy metal pollution in the topsoil layer. Heavy metal contamination in surface water was primarily driven by alert-level concentrations of Hg and was consistently distributed in areas with high concentrations of Hg in the topsoil. Applying the potential ecological risk index (RI) revealed two key results. First, surface water showed no ecological risk. The concentrations of heavy metals in surface water met the goals set by relevant authorities in China. Second, overall, the topsoil was at low ecological risk, with a spatial pattern primarily influenced by Cd and Hg. Some heavy metals might have similar pollution sources and originate from human activities such as industrial activities, mining and smelting, and pesticide and chemical fertilizer applications. The study is important for improving the soil and water ecology in the reservoir area and ensuring the northward diversion of high-quality water. In addition, it provides a sound basis for making decisions about local heavy-metal remediation and treatment projects.

1. Introduction

Heavy metals are the most common pollutants incorporated into indices that characterize various types of environmental quality. Most heavy metals are carcinogenic and detrimental to the nervous and immune systems and can easily accumulate in living bodies after being concentrated and magnified via the food chain [1,2]. The US Environmental Protection Agency has listed six heavy metals as priority pollutants: cadmium (Cd), chromium (Cr), copper (Cu), mercury (Hg), lead (Pb), and zinc (Zn) [3]. Globally, heavy metals pose a serious threat to human health and ecosystem integrity [4,5,6,7].
Reservoir control reaches are semi-natural and semi-artificial ecosystems that are easily affected by human activities [8]. With rapid population growth, the expansion of industrial and agricultural sectors, and advancing urbanization, large quantities of dangerous chemical substances, particularly heavy metals, are released in various forms into water bodies [9,10,11], causing pollution in aquatic environments which directly or indirectly threatens the safety of humans and other organisms [12,13,14]. Characterized by their long-term hazardous effects, high invisibility, high toxicity, non-biodegradability, and ease of accumulation, circulation, and migration, heavy metals in soils can have a significant adverse impact on regional ecological conditions [15,16]. Heavy metals can not only impair crop growth [17,18], but also enter surface water through aerial dust transported by wind. When they reach a certain concentration, heavy metals in soil will penetrate into groundwater with surface runoff and enter water sediment through sedimentation, which will be rereleased to water bodies under certain conditions, resulting in water environment pollution [19,20,21]. In recent years, the migration and geochemical diffusion of toxic elements in soils and sediments, the soil pollution generated by toxic elements, and the related ecological risks have become an important, burgeoning field of research [22,23,24]. Most published studies tend to focus on heavy metal pollution in either water bodies or soils, while relatively few have simultaneously investigated it in both, and more comprehensive assessments are still lacking [25,26,27,28].
The Middle Route Project of China’s South-to-North Water Diversion Project (SNWDP), currently the largest of its kind in the world, is a strategic inter-basin water diversion project implemented to alleviate severe water shortages in northern China [29,30] and was officially put into operation to supply water on 12 December 2014. By July 2021, the project had provided a total water supply of more than 40 billion m3 to four provinces/municipalities (Beijing, Tianjin, Hebei, and Henan), becoming the water-supply lifeline for 24 large and medium-sized cities along its route. Continuing economic progress in the areas surrounding the Danjiangkou Reservoir has resulted in development in several sectors—aquaculture, forest product processing, and various types of industrial manufacturing—in many villages and townships, causing ecological and environmental damage as well as severe soil erosion, which now poses a discernible threat to the reservoir’s water quality [31,32].
China has now entered the Fourteenth Five-Year Plan period, aiming to achieve green and low-carbon circular development. The plan further clarifies the need to comprehensively strengthen ecological protection and restoration in certain areas, such as national key ecological functional zones, ecological protection redlines, and national nature reserves. On 14 May 2021, Xi Jinping, the General Secretary of the Central Committee of the Communist Party of China, delivered an important speech in Nanyang, Henan Province. He stressed the relationship of the SNWDP to the country’s overall strategic plan and long-term development, and the welfare of the populace; the need to adhere to the appraisal principles for major hydraulic engineering projects that prioritize water conservation and emphasize spatial balance, ecological security, and sustainability; and the need to improve the level of intensive and economical utilization of water resources.
Although it lacks a clear-cut definition, the core water source area (CWSA) of the Middle Route of China’s SNWDP refers to a total of nine counties (cities and districts) which are in relatively close proximity to the Danjiangkou Reservoir’s water surface and produce urban and industrial pollution that directly affects its water quality, according to the Counterpart Cooperation Work Plan for the Danjiangkou Reservoir Area and Its Upstream Areas issued by the National Development and Reform Commission of China and the Office of the SNWDP Construction Committee [33]. The CWSA is responsible for the daunting task of supplying water along the Middle Route Project of the SNWDP. The ecological environmental conditions in the areas along this route, and the high-quality development of their water resources, have consequences for the water safety of several tens of millions of people in North China and play a vital role in ensuring economic and social stability in the water-receiving areas and the northward diversion of clear water from the sole reservoir. To date, however, surprisingly few studies have investigated heavy metal pollution as it pertains to the Middle Route Project of the SNWDP.
In this study, the definition of the CWSA was first optimized based on village- and township-level administrative units. Then, the spatial variability and distribution pattern of the concentrations of six heavy metals (Cd, Cr, Cu, Hg, Pb, and Zn, respectively denoted here as CCd, CCr, CCu, CHg, CPb, and CZn) in the surface water of the Danjiangkou Reservoir area and the surrounding topsoil in the study area (the CWSA) were analyzed by using a combination of a geographic information system (GIS) and geostatistical techniques. In addition, the heavy metals in the surface water and topsoil were quantitatively analyzed using environmental pollution and ecological risk assessment models to determine their environmental contamination levels, potential ecological risk levels, and spatial distribution patterns. Moreover, an attempt was made to identify the sources of heavy-metal pollutants in the CWSA.
In response to China’s new consequential development strategy, the purpose of this study is to (1) mitigate the ecological risk and improve the drinking water safety due to heavy metal pollution in the Danjiangkou Reservoir area, and (2) ensure the availability of high-quality clear water in northern China and protect the environmental resources affected by the water transfer project. This is conducive to promoting the coordinated and sustainable socioeconomic and environmental development of the core water source and receiving areas. The results of the study provide data support and a basis for decision making for local ecological and environmental management and soil and water restoration.

2. Materials and Methods
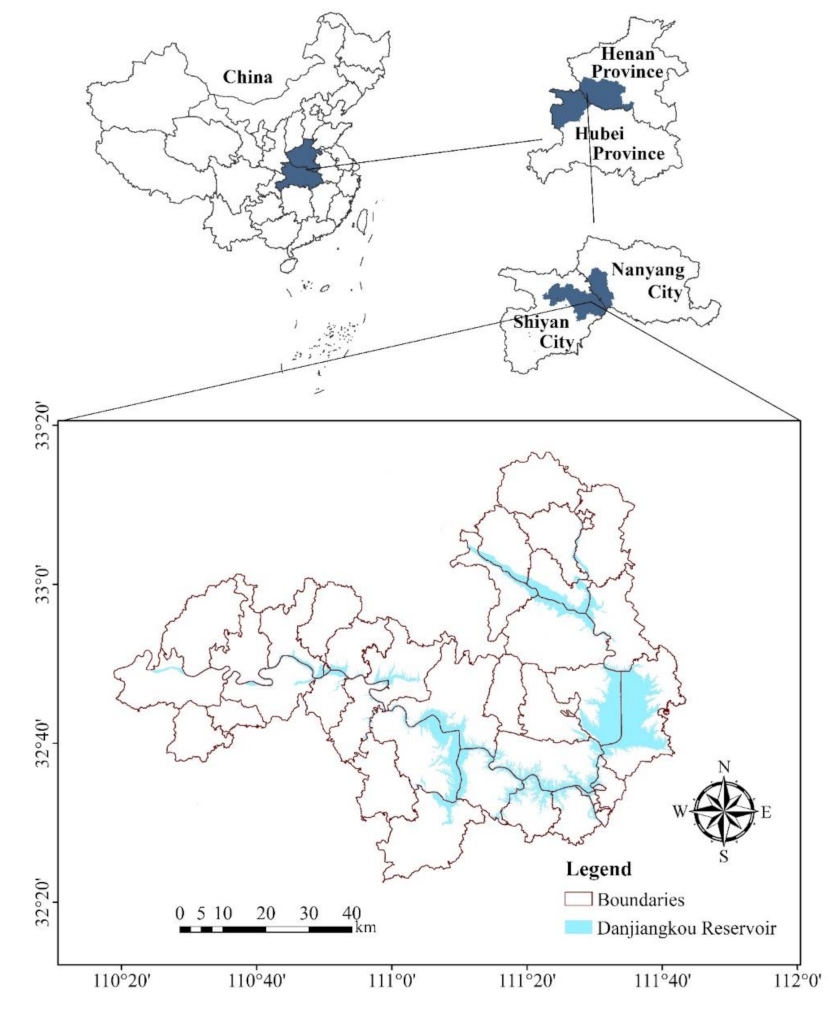
2.1. Study Area

In this study, the CWSA of the Middle Route of China’s SWNDP was defined as consisting of five counties (cities and districts), including Zhangwan District, Maojian District, Danjiangkou City (including the Wudang Mountains Special Zone), Yunyang District, and Yunxi County in Shiyan City, Hubei Province, and 38 villages, townships, and sub-districts under the jurisdiction of Xichuan and Xixia Counties, in Nanyang City, Henan Province. This definition has already been accepted by Chinese researchers [33]. Figure 1 shows the location of the CWSA on a map. The study area, with a total area of 6022.59 km2 (water area accounts for more than 80% of the Danjiangkou Reservoir area), is the core area along the Danjiangkou Reservoir (110°20′–112°00′ E, 32°20′–33°20′ N), which contains two river basins, the Han and Dan River Basins, both of which flow into the reservoir. Here, a monsoon climate prevails, with an annual average temperature of 15–16 °C and an annual average precipitation of 800–1000 mm. The geological formations in the study area are complex; most are from the Proterozoic and Mesozoic Eras, while a few are Paleozoic and Cenozoic in age, being composed of a variety of rocks (mostly metamagmatic and carbonate rocks). Situated at the southern foot of Funiu Mountain (a branch of the Qinling Mountains), Nanyang City comprises the eastern part of the study area, with a terrain that generally declines in elevation from northwest to southeast, primarily characterized by three types of landforms: eroded low mountains, eroded hills, and accumulation plains. Due to the presence of the Qinling Mountains, the terrain of Shiyan City, in the western part of the study area, has elevation that is, overall, high in the northwest and low in the southeast and geomorphologically consists mainly of hills and mountains of low and medium stature. With most of its population employed in the agricultural sector, the study area is, overall, relatively less developed from both the economic and social perspective. Agricultural production is the main socioeconomic activity and source of income in the study area.

2.2. Sample Collection and Testing

Surface-water samples were collected at 85 sites in the Danjiangkou Reservoir and topsoil samples were collected at 7735 sites from August to October in 2017 and 2018. The surface water of Danjiangkou Reservoir is classified as class II water type (i.e., class I protection zone for domestic drinking water sources of surface water) according to the classification standard of water environmental functions and protection objectives in China. The specification for Multi-Purpose Regional Geochemical Survey (1: 250,000) (DD2005-01) issued by the China Geological Survey was strictly followed during the sample collection and testing processes [34].
In this research, surface water samples were collected along the Danjiangkou Reservoir of the study area according to the collection density of 1/12 km2 and fine-tuned considering the reservoir shape, proximity to the main water source inlet, location of sewage facilities, and other factors. A vertical plexiglass water sampler meeting the requirements was used to collect surface-water samples from the reservoir at 0.5 m below the surface. Each sample was placed in a 500 mL HNO3-washed polyethylene plastic bottle and left to settle naturally for 30 min, then the upper clear liquid was taken and acidized to pH <2. After being sealed, the bottles were brought to the laboratory in a timely fashion and stored in a refrigerator at 4 °C. Meanwhile, topsoil samples were collected using the grid sampling approach according to the specification of land quality geochemical assessment in China (DZ/T 0295-2016) [35] to ensure evenly distributed sampling points within the grid. Grid selection was closely related to the water quality of the reservoir area and the cultivated land and gardens around the reservoir with frequent human activities. For mountainous areas and woodlands with weak human activities, sampling grids could be appropriately reduced or not arranged. Specifically, within each 1 km2 grid cell in the study, 6 topsoil samples (total mass > 1 kg) were collected at depths of 0–20 cm and placed in a sample-labeled cloth bag. Each sample was air-dried, after which it was gently struck with a mallet and then passed through a 10-mesh standard sieve. A total of 400 g of sieved soil was placed in another sample-labeled cloth bag, and all topsoil samples were delivered in a timely fashion to the facility for testing and analysis. In addition, efforts were made to ensure that the required sample thickness of the soil layer was achieved and that the samples were uniform and representative. Finally, the actual numbers of topsoil and surface water samples collected were 7735 and 85, respectively, and all of them were tested and statistically analyzed based on the comprehensive sampling.
Six heavy metals (Cd, Cr, Cu, Hg, Pb, and Zn) were tested to determine their concentration in the surface water and topsoil samples by Hubei Geological Research Laboratory. The test method and equipment are shown in Table 1. The reporting rate of each heavy metal reaches 100%, indicating that the detection limit of analytical method fully meets the requirements. Two specific methods were used: (1) We weighed 0.1 g of each topsoil sample, decomposed it by HF, HCl, HNO3, and HClO4, and extracted it with HCl into a 100 mL volumetric flask. Nitric acid was added to the surface water as a protective agent. Inductively coupled plasma mass spectrometry was used to quantify the CCd, CCr, CCu, CPb, and CZn contents in the topsoil and surface water. (2) We weighed 0.5 g of each topsoil sample, added 5 mL of aqua regia (volume ratio of concentrated hydrochloric acid to nitric acid was 3:1) and 5 mL of distilled water, and boiled the water bath for 2 h. Then we transferred it to a 50 mL volumetric flask after natural cooling, fixed the volume with deionized water, and shook it well. Then 10 mL of each surface water sample was taken, mixed in a solution of hydrochloric acid, potassium bromate, and potassium bromide, and shaken well. After it was left standing for 20 min, a few drops of hydroxylamine hydrochloride were added for reduction. Atomic fluorescence spectrometry was used to measure the CHg in the topsoil and surface water. Relevant national standards and methods, as well as the Regulations on Quality Management of Environmental Monitoring (2006) [36], the Water Quality Technical Regulation on the Design of Sampling Programs (HJ 495-2009) [37], and the Technical Specification for Soil Environmental Monitoring (HJ/T 166-2004) [38] (all issued by the Ministry of Ecology and Environment of China), were followed throughout the storing, analysis, and testing of samples. Quality control (QC) was performed using a combination of external and internal methods with national primary reference materials (GBW). In addition, a three-level verification process was carried out. The required detection limit and pass rate were both achieved for each heavy metal.

2.3. Data Processing and Spatial Analysis Methods

2.3.1. Statistical Analysis

Outliers were identified in the 85 surface-water samples and 7735 topsoil samples by comparing the concentration of heavy metals in each sample to their average concentration. If the difference between the concentration of a heavy metal and its corresponding average concentration was greater than 3 times the standard deviation (SD) of the water and soil data sets, that value was considered an outlier. Each outlier was then replaced by the corresponding normal maximum value [39]. To prevent an increase in their regularity, the original data were only subjected to this outlier elimination treatment [40].
All statistical analyses were completed by SPSS 19.0 software and the results were analyzed by descriptive statistics. Correlation analysis is a statistical method for determining whether there is a correlation between samples and, if so, the strength of that correlation [41]. For heavy metals, there generally exists a certain link between their sources and their migration and transformation processes. Pearson correlation coefficient analysis (PCCA) is used to measure whether two data sets are on a line so as to judge the linear relationship between distance variables and help to determine possible sources of heavy metal pollution [42]. In recent years, it has been widely used to evaluate the relationships between different heavy metals in soil and water [42,43,44]. The significance values are based on the p-test value in PCCA.
Principal component analysis (PCA) can interpret the variance of a large dataset with several variables as effective pattern recognition [45,46]. To further identify associations among and common sources of metals, PCA was performed with a varimax rotation which can facilitate interpreting the results by minimizing variable numbers with high loading on each component [47]. The Kolmogorov–Smirnov test was used to analyze the normality of the data. A p-value above 0.05 was used to accept the hypothesis of the normally distributed dataset [48,49]. After completing the outlier elimination process, the data of heavy metal concentration in topsoil and surface water basically followed normal distribution. The data of samples in topsoil and surface water were subjected to Kaiser–Meyer–Olkin and Bartlett tests. The results met the PCA requirements. The number of principal components was determined according to Kaiser rule (characteristic value >1) [50]. Subsequently, a PCA-based method, absolute principal component scores (APCS)- multiple linear regression (MLR), was used to quantify the contribution of each PC [51]. This provides a quantitative characterization of the contribution of each pollution source to the overall pollution [52,53].

2.3.2. Spatial Analysis Methods

In this study, semi-variogram calculations and theoretical model fitting were completed in GS+ 9.0 software. Relevant distribution maps (of heavy metal concentrations, environmental contamination levels, and ecological risk levels) were plotted using the ordinary kriging and inverse distance weighting interpolation methods in ArcGIS 10.2.

2.4. Heavy Metal Pollution and Its Risk Assessment Methods

2.4.1. Nemerow Pollution Index (NPI)

The NPI is a measure now commonly used to assess the quality of a surface water environment. It is useful for identifying the elements that cause the most pollution [54]. The NPI is derived as follows:
P i = C i S i P N = max P i 2 + a v g P i 2 2
where P i is the single-factor pollution index for heavy metal i in the surface water; C i is the measured concentration of heavy metal i; S i is the corresponding water-quality reference standard, according to the class II water-quality standard stipulated in China’s Environmental Quality Standards for Surface Water (EQSSW) (GB 3838-2002); P N is the NPI for heavy metals in the surface water; and max( P i ) is the maximum value and a v g P i is the mean value of the single-factor pollution index for heavy metals in the surface water. The P i and P N assessment standards for heavy metals in surface water are as follows: P i ≤ 1, safe; 1 < P i ≤ 2, alert; 2 < P i ≤ 3, mild concentration; and P i > 3, serious concentration; likewise, P N ≤ 0.7, safe; 0.7 <   P N i ≤ 1, alert; 1 < P N ≤ 2, mild concentration; and P N > 2, serious concentration [54].

2.4.2. Pollution Load Index (PLI)

The PLI can convey total heavy metal contamination levels in different areas and the temporal and spatial variation patterns [55]. The PLI is calculated as follows:
C F i = C i B i PLI = C F 1 ×     C F 2 ×         × C F n n
where C F i is the single-factor contamination index for heavy metal i in the soil; C i is the measured concentration of heavy metal i; B i is the soil background concentration of heavy metal i, for which the average concentration of a given heavy metal in the topsoil in Hubei and Henan Provinces was used as the reference concentration; PLI is the pollution load index for heavy metals in the soil; and n is the number of heavy metals assessed. The C F i and PLI assessment standards for soils are as follows: C F i   ≤ 1, not polluted; 1 < C F i ≤ 2, slightly polluted; 2 < C F i ≤ 3, moderately polluted; and C F i > 3, highly polluted; likewise, PLI   ≤ 1, not polluted; 1 < PLI ≤ 2, slightly polluted; 2 < PLI ≤ 3, moderately polluted; and PLI > 3, highly polluted [56].

2.4.3. Potential Ecological Risk Index (RI)

The RI can facilitate the assessment of the combined effects of various heavy metals and their differential toxicity to organisms [57]. This index is used extensively to assess the ecological risk posed by heavy metals and to quantify potential ecological risk levels [58,59,60,61]. The RI can be calculated using these equations:
E r i = T r i × C r i = T r i × C s i C n i RI = i = 1 n E r i
where E r i is the single-factor potential ecological risk index for heavy metal i at sampling site r; C i r is the single-factor contamination index for heavy metal i at sampling site r; C s i is the measured concentration of heavy metal i; C n i is the reference concentration for heavy metal i; T r i is the toxicity factor for heavy metal i, whose values for Cd, Cr, Cu, Hg, Pb, and Zn are 30, 2, 5, 40, 5, and 1, respectively [52]; and RI is the sum of E r i . and represents the overall potential ecological risk index. Table 2 summarizes the E i r and RI classification standards [60].

3. Results

3.1. Analysis of Heavy Metal Pollution in Surface Water

3.1.1. Statistical Characteristics Analysis of Surface Water

Table 3 summarizes the measured concentrations of the six heavy metals in the CWSA of the Middle Route of China’s SNWDP. The average value of each heavy metal did not exceed the class II standards stipulated in China’s EQSSW (GB 3838-2002) [62] or the standards stipulated in China’s Standard for Drinking Water (SDW) (GB 5749-2006) [63]. This result suggests that the surface-water quality in the study area met the goal set by relevant authorities in China (which was to achieve a long-term stable water-quality level in the Danjiangkou Reservoir area conforming with the class II standards) and reached the level required for water-supply purposes. The coefficient of variation (CV) reflects the degree of dispersion in the data for a set of samples. Generally, a CV of <10% indicates weak variability, a CV of 10–100% indicates moderate variability, whereas a CV of >100% indicates strong variability [64]. This pattern suggests moderate variability in CHg (69.50%) and CCd (34.69%) and strong variability in CCr (278.21%), CCu (177.55%), CPb (171.18%), and CZn (121.55%). In particular, the CV for CCr was the greatest. Clearly, the spatial distribution of heavy metal concentrations was relatively highly dispersed and variable, as well as non-uniform.

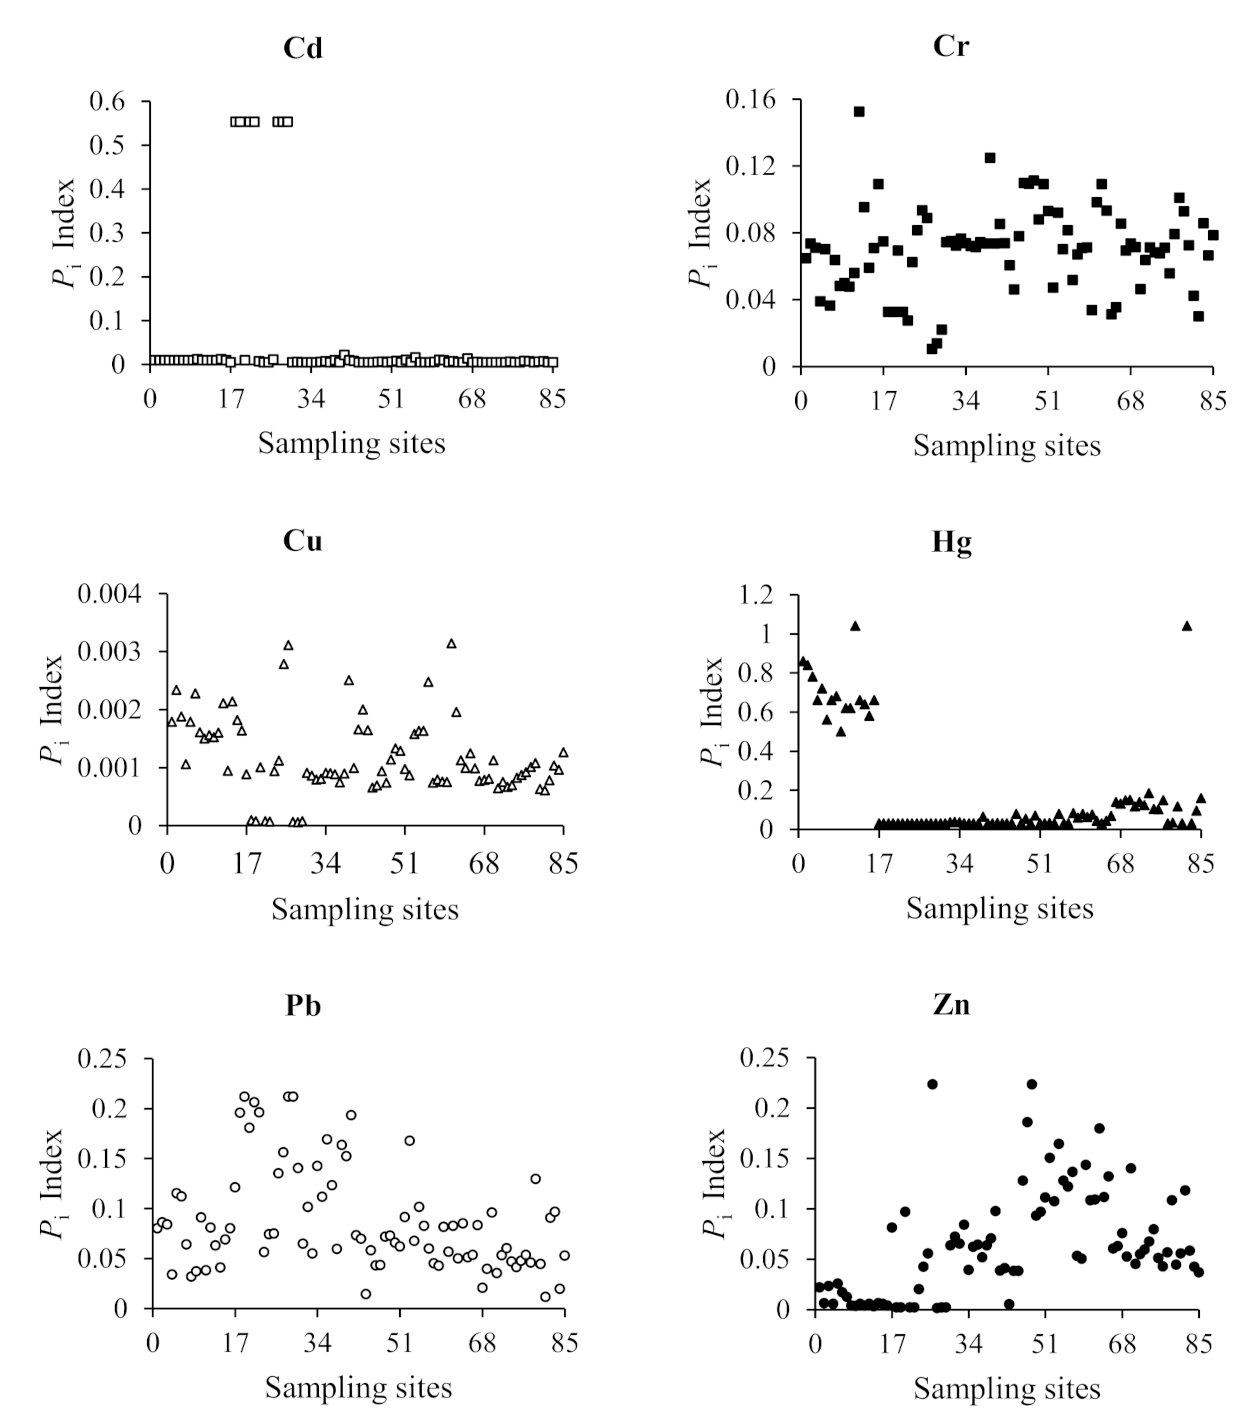
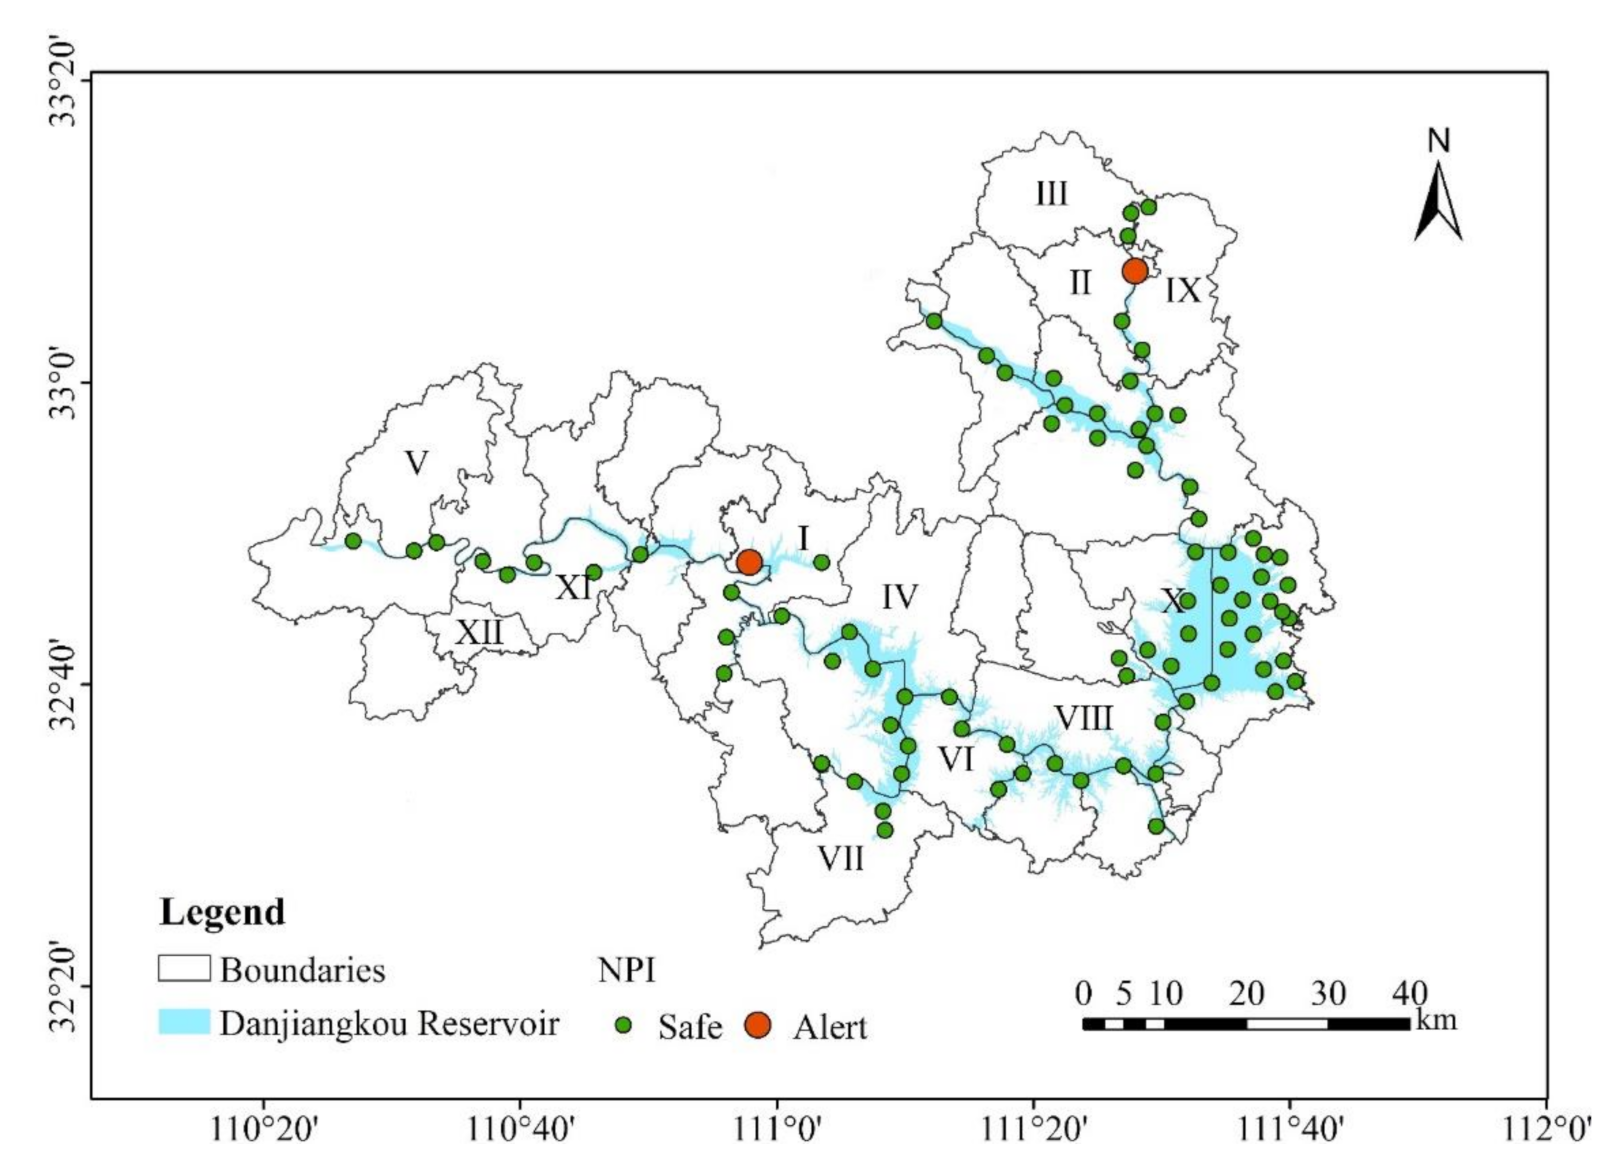
3.1.2. Assessment of Current Heavy Metal Contamination Levels in Surface Water

Figure 2 and Table 4 summarize the assessment of P i for heavy metals in the surface water in the study area. Overall, the contamination level of each heavy metal was relatively low. The values of P i for Cd, Cr, Cu, Pb, and Zn were all less than 1, suggesting that the concentrations of these metals were at a safe level. For Hg, P i was between 1 and 2 at only two sampling sites ( P i = 1.04 at both sites), suggesting that CHg was at the alert level at both sites. Overall, CHg was at the alert and safe level at 2.35 and 97.65% of all sampling sites, respectively.
Similarly, the assessment of NPI revealed alert- and safe-level heavy metal concentrations at 2.35 and 97.65%, respectively, at all sampling sites (Table 4). Further, sampling sites with alert-level heavy metal concentrations per the NPI were consistent with those with alert-level CHg values, suggesting that the heavy metal pollution in the surface water in the study area was primarily caused by an alert-level CHg. From a spatial distribution perspective (as shown in Figure 3), sampling sites with alert-level heavy metal concentrations are located in the runoff areas along the Danjiangkou Reservoir in western Anyang (I) and eastern Jinhe (II).

3.2. Analysis of Environmental Quality of Heavy Metals in Topsoil

3.2.1. Analysis of Topsoil Concentrations

Table 5 summarizes the statistics for the six heavy metals at 7735 topsoil sampling sites in the CWSA of the Middle Route of China’s SNWDP. The mass concentrations of elements varied rather significantly. A comparison of the average concentration of each element to the corresponding topsoil background value (referring to China’s Soil Element Background Values (1990) published by the China Environmental Monitoring Center) revealed that, except for Hg and Pb, all metals exceeded their ambient levels in the study area. Specifically, the CCd, CCr, CCu, and CZn were 1.77-, 1.90-, 1.24-, and 1.19-fold higher than their background values, respectively, indicating considerable enrichment. Nevertheless, the CV values indicated strong variability in the concentrations of heavy metals; the CV values for CPb and CZn were the highest (302.64 and 344.24%, respectively), which suggests that both metals are distributed in a notably varied pattern and are relatively significantly affected by human activities.

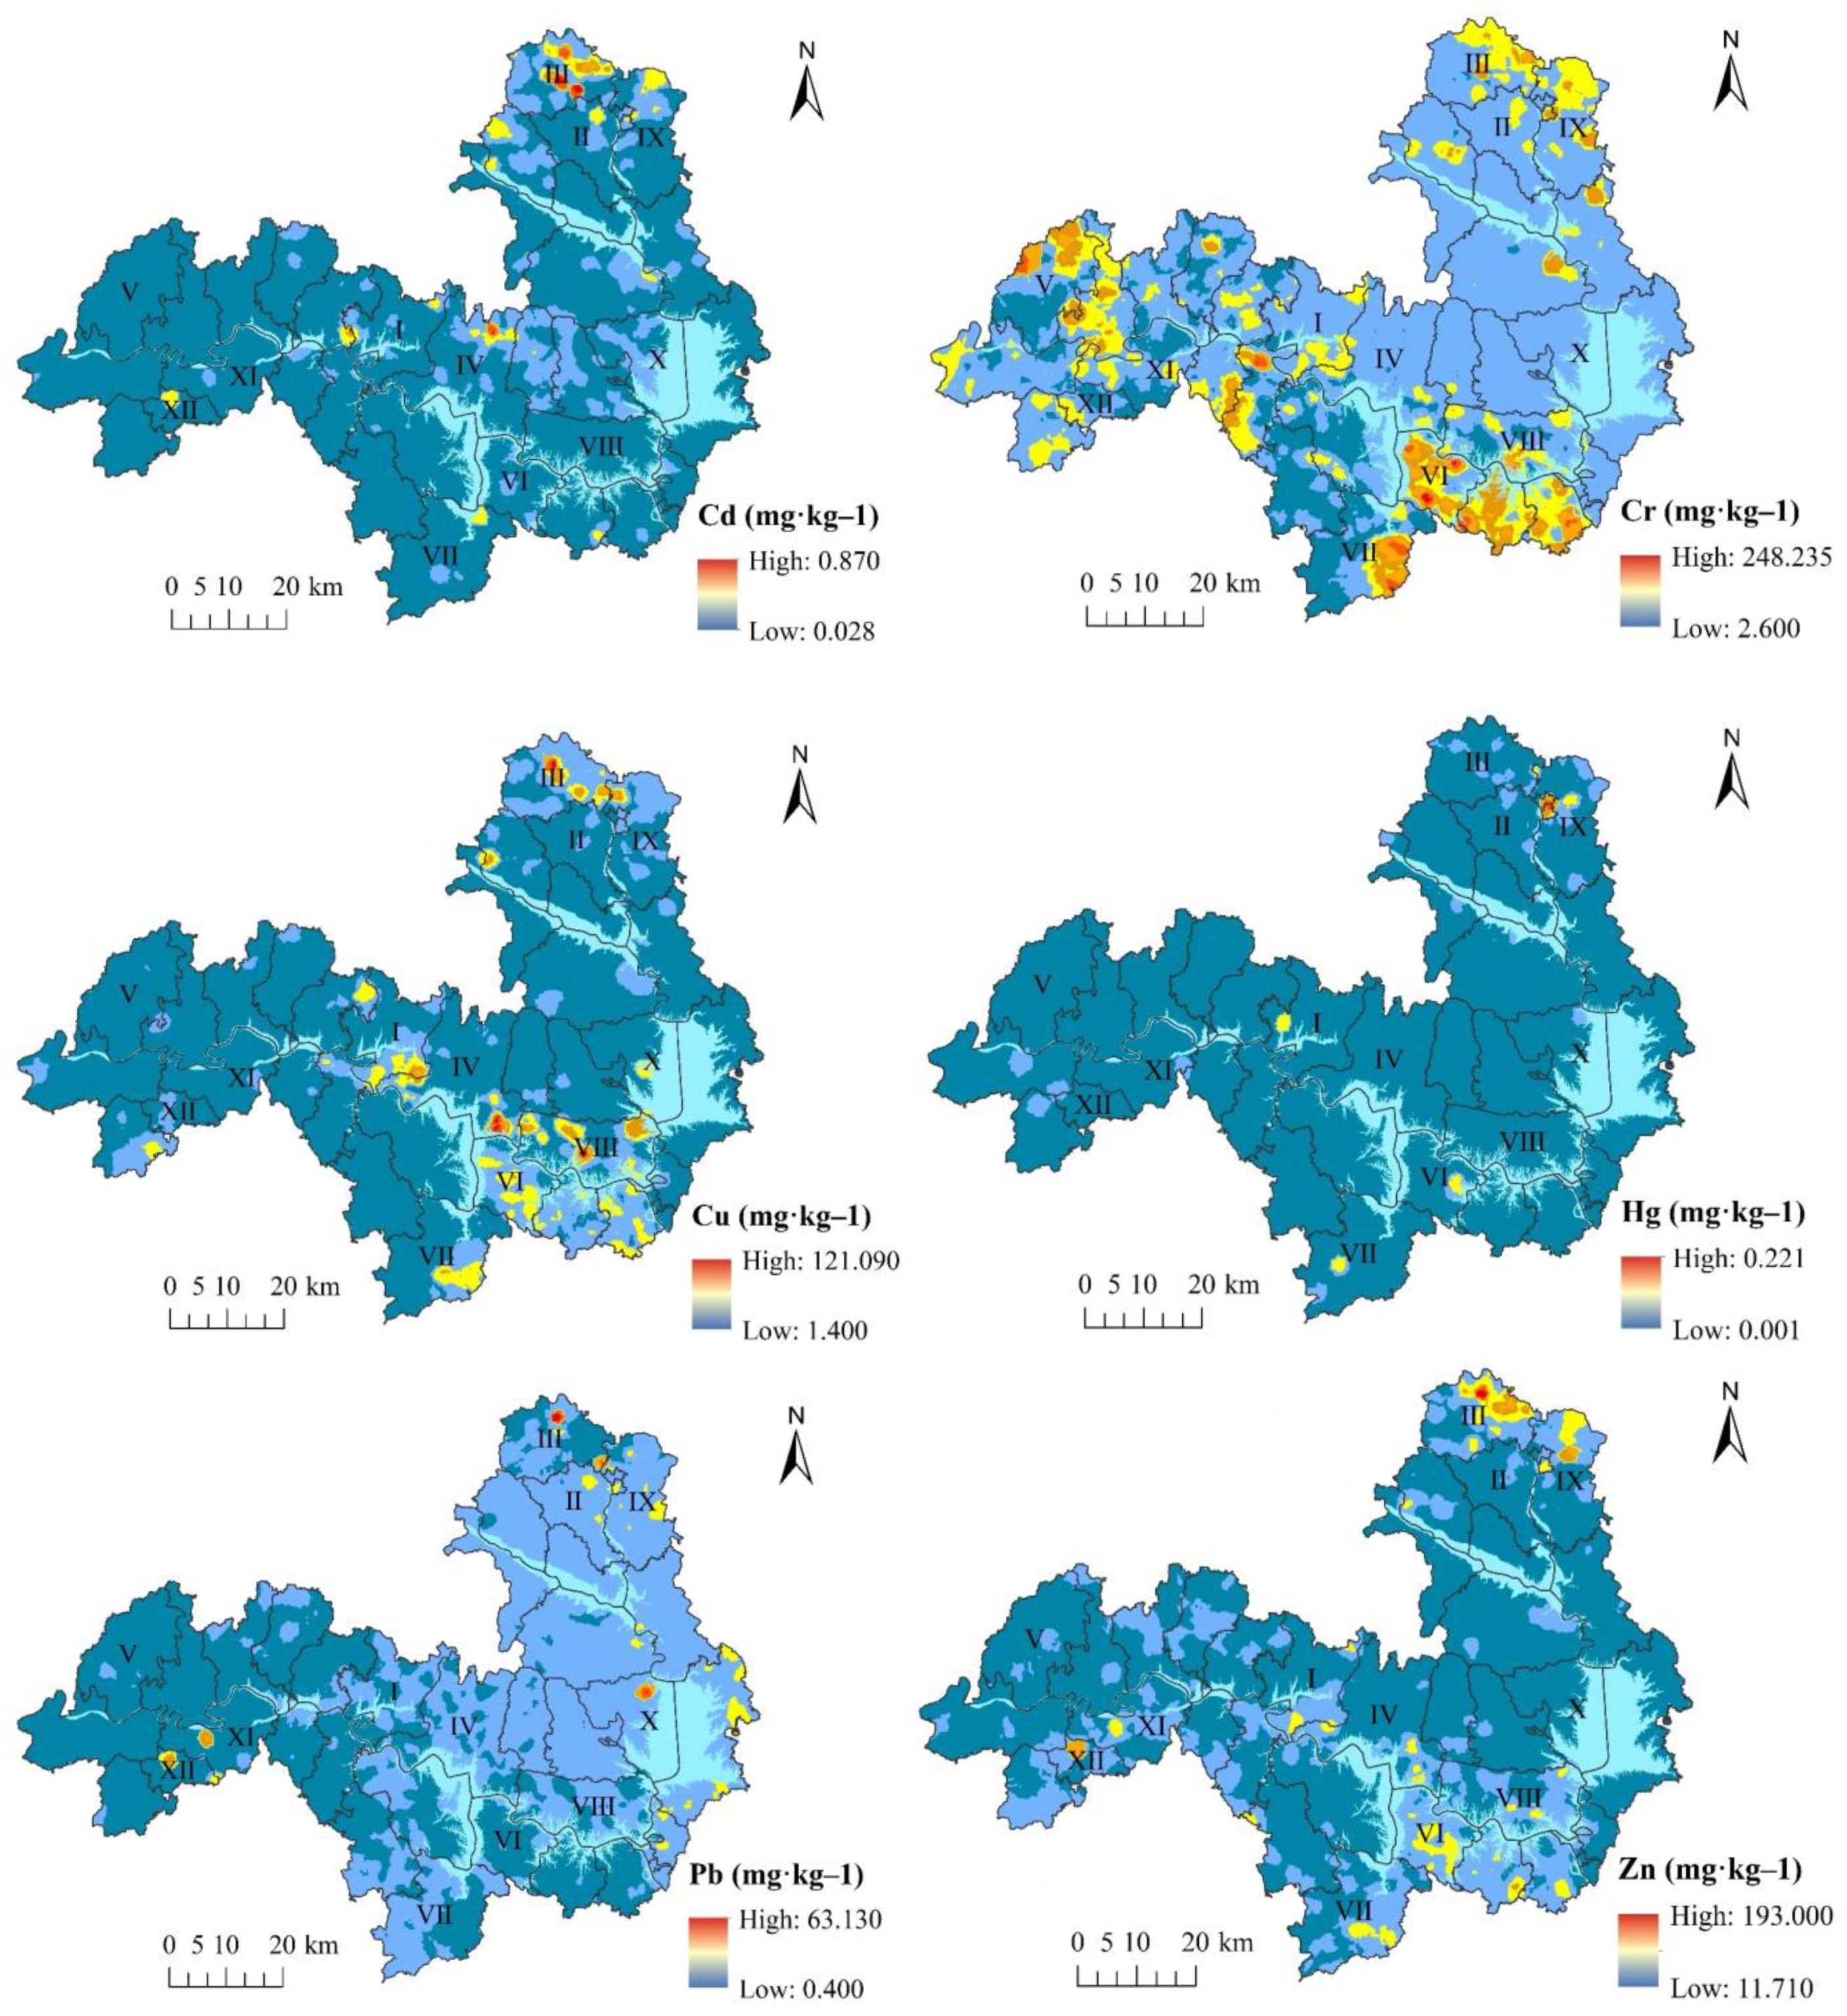
3.2.2. Spatial Variability and Distribution Pattern of the Heavy Metals in the Topsoil

The concentrations of the six heavy metals in the topsoil were then analyzed using a semi-variogram. The spatial variability of each metal’s concentration in topsoil was characterized with the nugget, sill, and range parameters. The exponential model exhibited the best goodness of fit for CCd and CCu; the Gaussian model was used to fit CHg, CPb, and CZn; and the linear model was used to fit CCr. The nugget/sill ratio not only reflects the importance of natural and human factors contributing to spatial variability, but also the strength of spatial autocorrelation between the variables of a system. In terms of structural factors, a nugget/sill ratio of <25%, 25–75%, and >75% indicates strong, moderate, and weak spatial autocorrelation within the system, respectively [65]. As Table 6 shows, the nugget/sill ratio for the six heavy metals in the topsoil ranged from 25 to 75%, suggesting moderate spatial correlations in their concentrations across space. This pattern in spatial variability within the system emerged from the combined action of key structural factors (e.g., the parent soil material, landforms and topography, and climate) and random factors related to human activities.
The coefficient of determination, R2, measures the goodness of fit of a theoretical model. The R2 values for the concentrations of the six heavy metals were all above 0.80, suggesting an overall relatively high goodness of fit. The range parameter reflects the range of spatial autocorrelation at a certain observational scale; that is, a given variable is spatially autocorrelated within a range and is not outside that range. The range for CHg was the largest (47.17 km), suggesting its distribution was relatively homogeneous, varying insignificantly within a small range and tending to display a simple pattern overall. This is in stark contrast to CCr, with the smallest range (13.44 km), characterized by relatively strong variability within a small range in the study area. Further, the range for heavy metal concentration was much greater than the sampling interval; hence, the unbiased estimation produced for the study area based on the sampling sites was reliable and met the requirement for assessing spatial variability.
A spatial distribution map of the concentration of the six heavy metals in the topsoil in the study area was plotted using the ordinary kriging interpolation method in ArcGIS 10.2, as shown in Figure 4. For cadmium, the overall CCd was relatively low. High-CCd areas were distributed primarily in Maotang (III), in the northern part of the study area. Relatively small high-CCd areas were found in Xijiadian (IV), but everywhere else the level was relatively low. Compared with the concentrations of other metals, overall CCr was relatively high. High- and moderate-CCr areas occurred in the north and south and some parts in the west. Notably, high-CCr clusters appeared in Hejia (V), Longshan (VI), and the Wudang Mountains (VII). In the rest of the study area, CCr gradually decreased from northeast to southwest. For copper, high- and moderate-CCu areas were distributed primarily in the northern and southern parts of the study area. From a structural perspective, there were three high-CCu centers, located in Maotang (III), Xijiadian (IV), and Liangshuihe (VIII). The CCu values were low in most of the rest of the study area. Compared with other heavy metals, the concentration of CHg was the lowest. A single notable high-CHg cluster appeared in western Shangji (IX); CHg values were low in most of the study area and moderate in a few spots. Regarding lead, the distribution of CPb varied significantly from area to area and was high in places near Nanyang and lower close to Shiyan. There were two high-CPb centers located in Maotang (III) and Cangfang (X), while moderate CPb values radiated from Liubei (XI) and Fangtan (XII). CPb gradually decreased in the rest of the study area; in particular, CPb values were low in the west and south. For zinc, the distribution pattern of CZn was similar to that of CCd. A notable single high-CZn appeared in Maotang (III). Relatively small high-CZn areas occurred in Fangtan (XII) and Shangji (IX), with a few moderate-CZn areas distributed in the south. Low CZn values were observed in the rest of the study area.

3.2.3. Characteristics and Distribution of Heavy Metal Pollution in the Topsoil

Table 7 summarizes the PLI-based assessment of heavy metal pollution in the topsoil of the study area. The C F i value suggests that the topsoil was slightly polluted with Cd, Cu, Zn, and Cr but not polluted by Hg and Pb. Proportionally, most of the sampling sites were not polluted with Hg and Pb (88.14 and 99.43%, respectively); in contrast, 68.16, 60.56, 53.63, and 47.96% of the sites were slightly polluted with Zn, Cd, Cu, and Cr, respectively; 20.09% of the sites were moderately polluted with Cd; and a relatively small proportion of sites were moderately polluted with the other metals. Notably, 6.87, 4.34, 2.51, and 1.37% of the sampling sites were highly polluted with Cd, Cu, Cr, and Hg, respectively. The PLI for the combination of all six heavy metals ranged from 0.17 to 3.20; on average it was 0.90, suggesting that the sampling sites were generally not polluted. In addition, the PLI values showed that 70.60, 28.93, 0.44, and 0.03% of the sampling sites were not polluted, slightly, moderately, and highly polluted, respectively. Overall, we can infer that the study area is currently not polluted. Further, among the polluted areas found, most were only at a slightly polluted level; very few moderately and highly polluted areas were detected. Cd and Cu are the principal elements causing pollution in the study area.
Figure 5 shows the spatial distribution of the PLI. Clearly, the polluted areas were concentrated primarily in the northern and southern sections of the study area. The majority of the study area was in a slightly polluted state. Moderately and highly polluted areas formed discernible clusters, mainly concentrated in central Maotang (III) and northwestern Shangji (IX) in the north. A few moderately and highly polluted areas were noted in northeastern Anyang (I) and central southern Jinhe (II), although only two highly polluted sampling sites were found, both located in central Maotang (III).

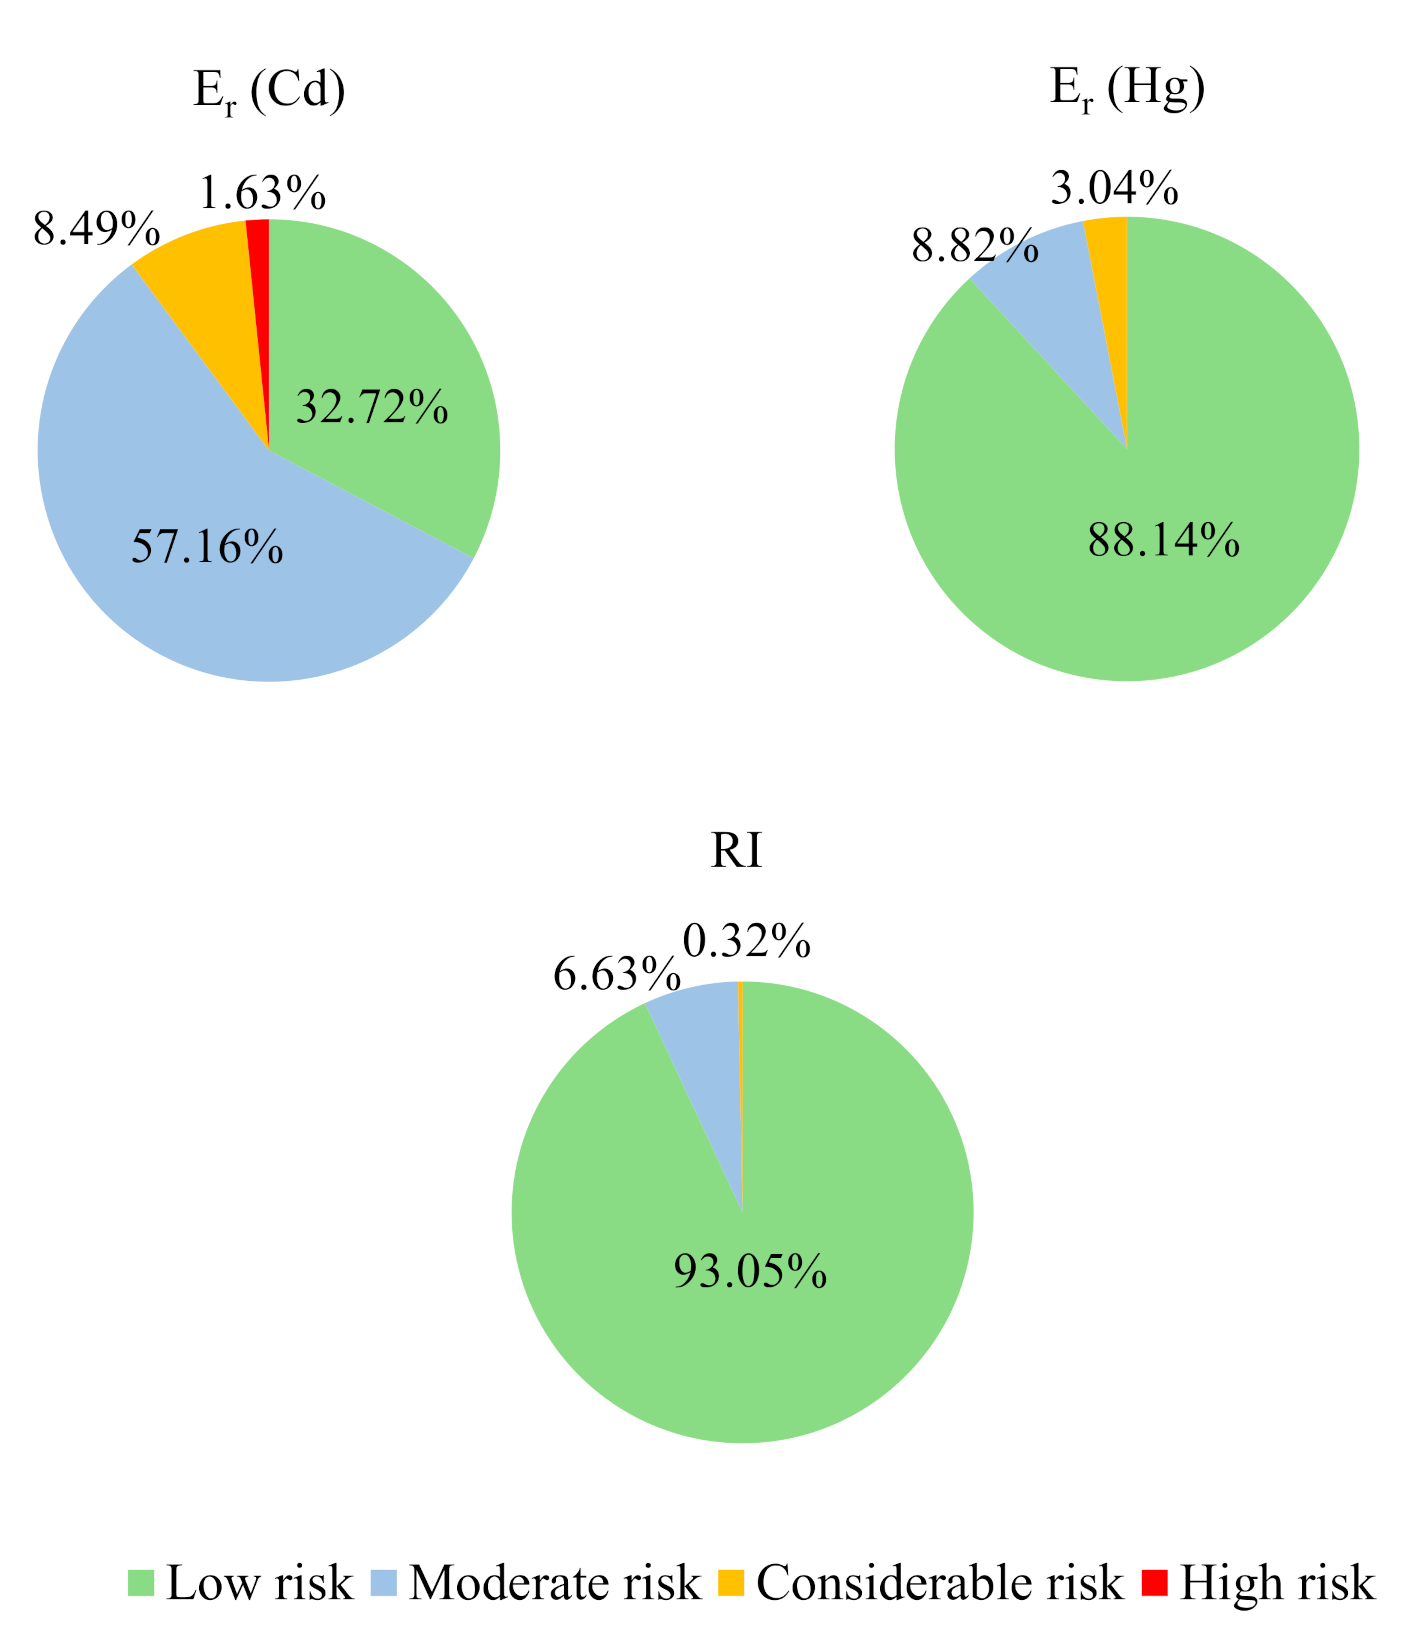
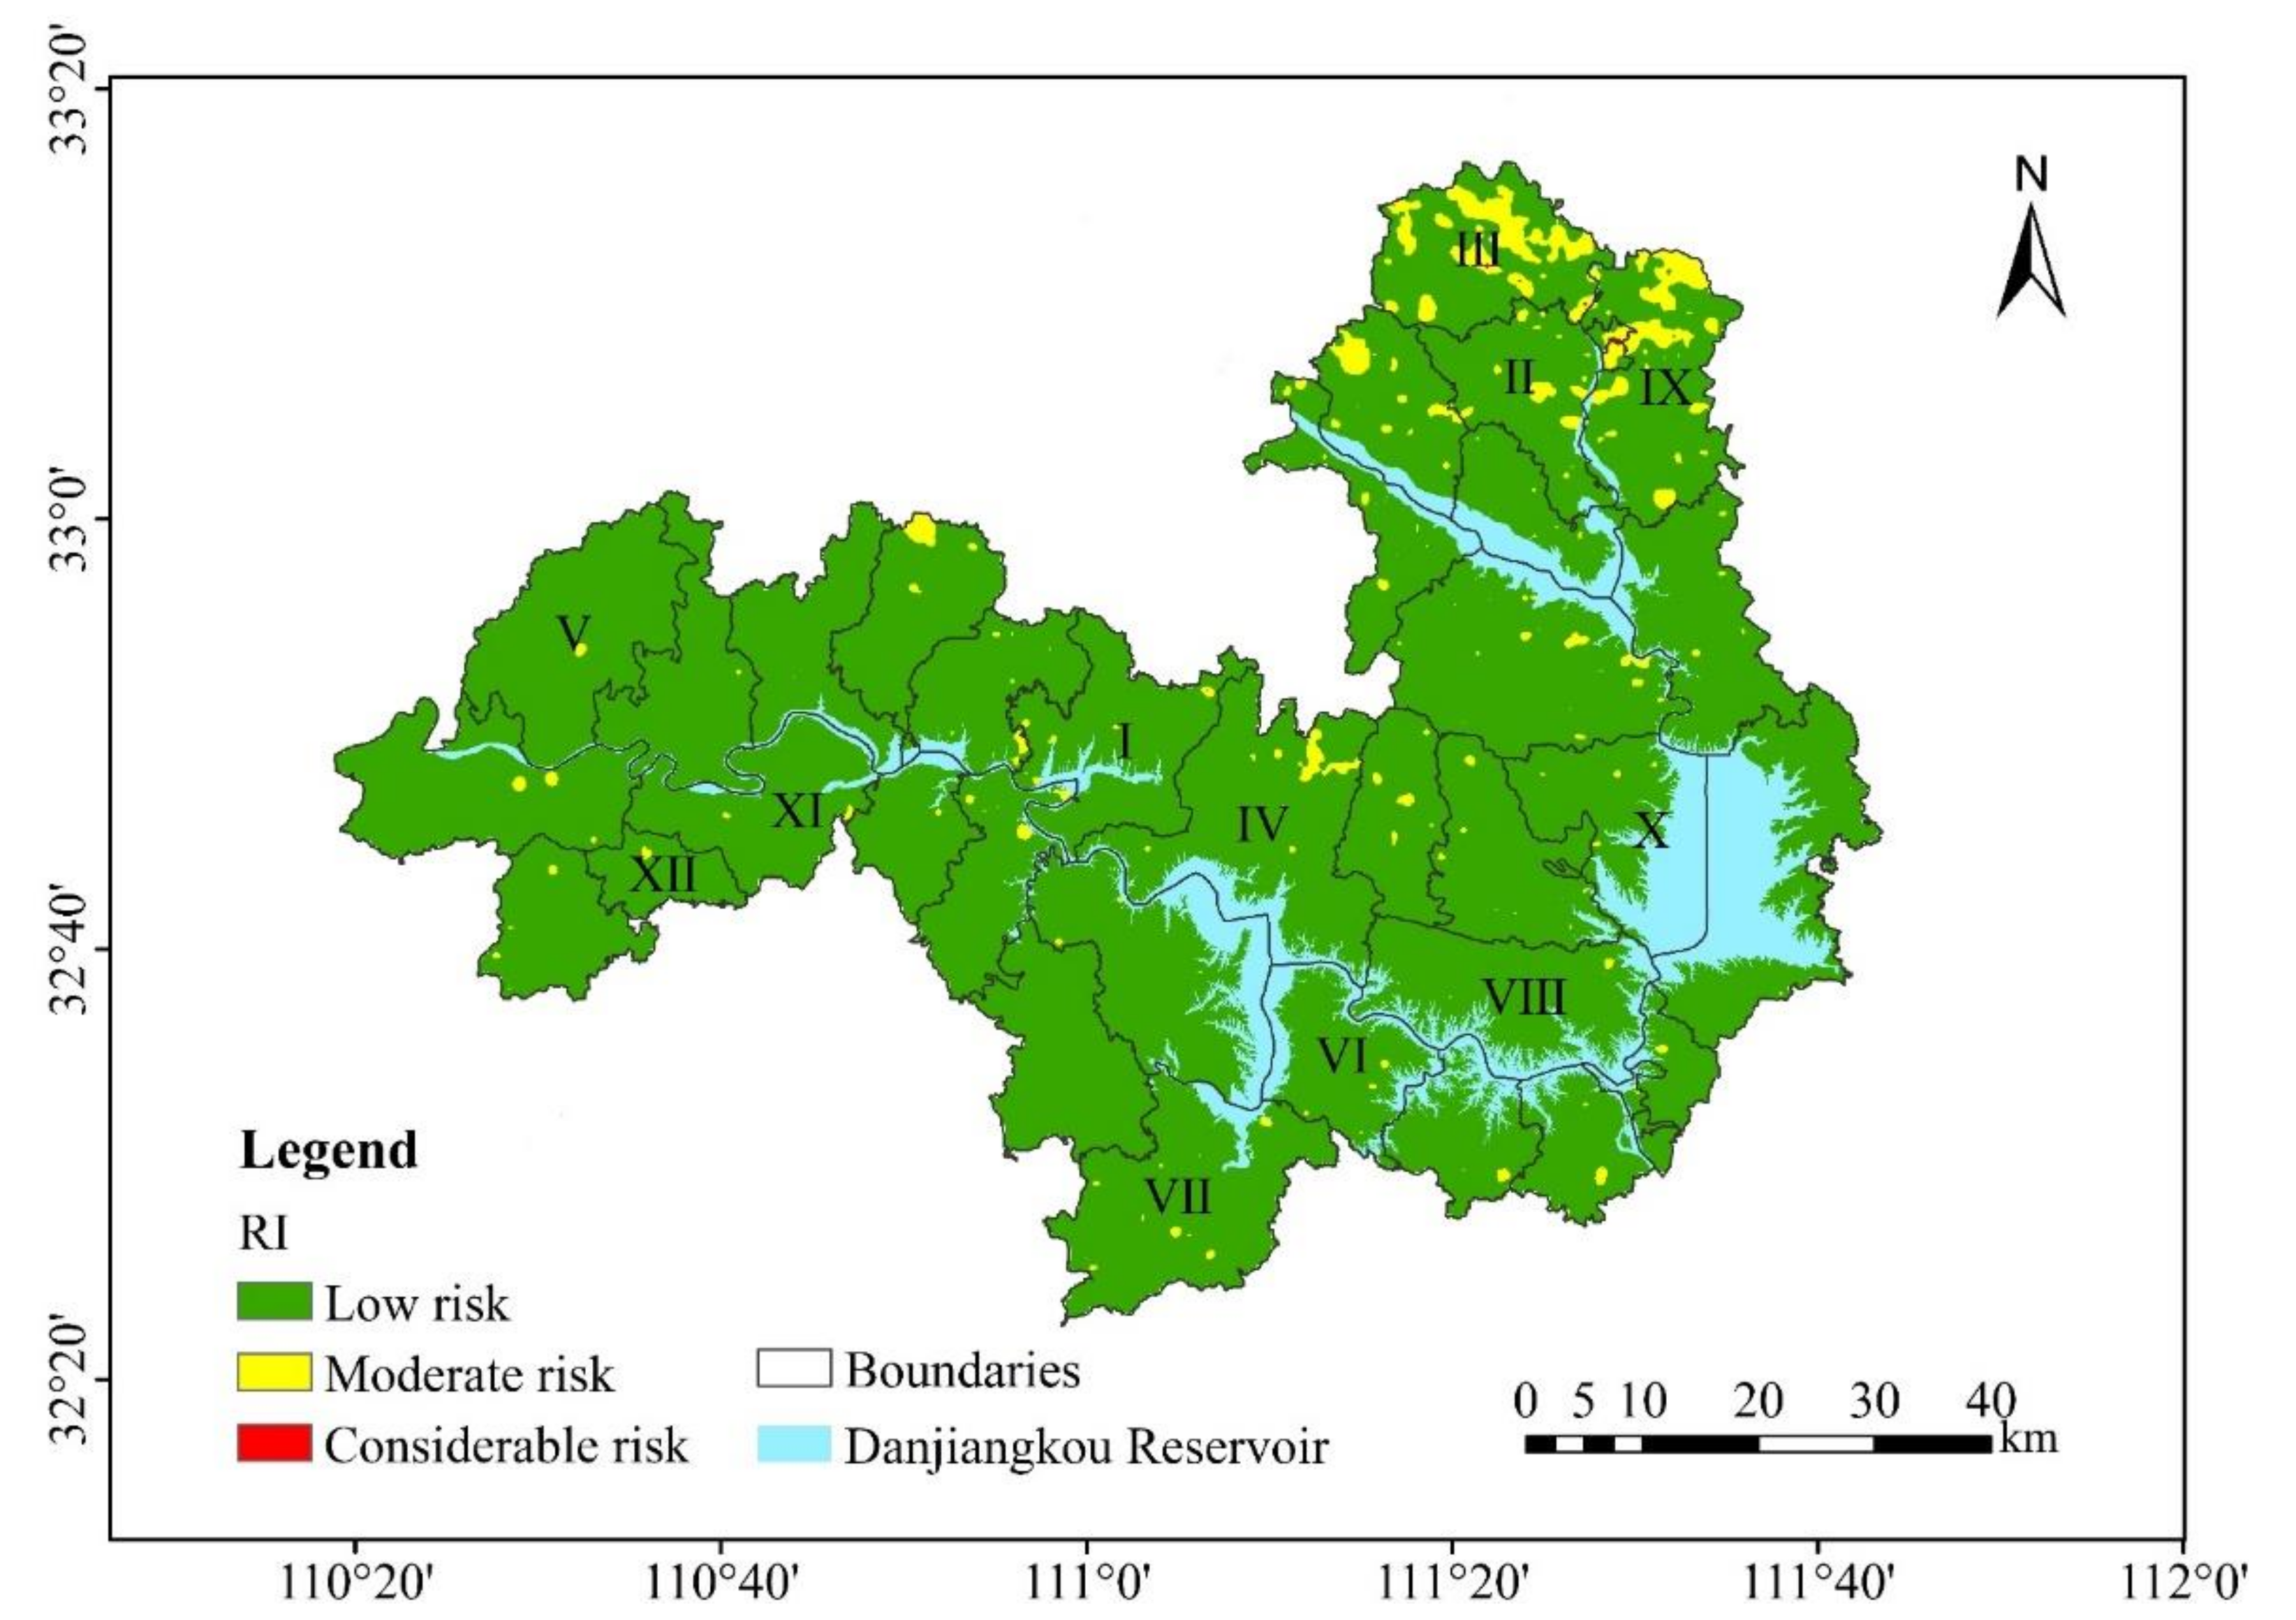
3.3. Ecological Risk Assessment of Heavy Metals in Surface Water and Topsoil

The RI values for the 85 surface-water sampling sites ranged from 1.55 to 42.63, suggesting a generally low ecological risk (Table 8). An analysis of the maximum values of E r i for the six heavy metals showed the following: There were only two sampling sites where Hg posed a moderate ecological risk, matching the sites with alert-level CCu values according to P i . The other heavy metals posed a low ecological risk.
Of the six heavy metals at the 7735 topsoil sampling sites, Cd had the highest average RI value, followed by Hg, Cu, Pb, Cr, and Zn. Moreover, Cd was the only metal with an average RI value (53.25) above 40, suggesting that it poses a moderate ecological risk, whereas the other five metals pose a low ecological risk (Table 8). The values of E r i for Cd and Hg were relatively high, ranging from 6.83 to 212.20 and from 0.58 to 155.41, respectively. As shown in Figure 6, the ecological risk associated with Cd was moderate, considerable, and high at 57.16, 8.49, and 1.63% of the sampling sites, respectively, and the risk associated with Hg was moderate and considerable at 8.82 and 3.04% of sites, respectively. All the other metals posed a low risk at all sampling sites. Clearly, Cd and Hg were the main contributors to ecological risk in the study area. The RI for heavy metals in the topsoil ranged from 15.66 to 405.49, with an average of 89.73; this also indicates that heavy metals, overall, pose a low ecological risk (Table 8). However, the ecological risk was moderate and considerable at 6.63 and 0.32% of the sampling sites, respectively (Figure 6). Figure 7 depicts the spatial distribution of the RI, showing a moderate ecological risk from heavy metals mainly in the north of the study area and in some places in the central and southern parts. Notably, the heavy metals posed a considerable ecological risk primarily in central eastern Maotang (III), northwestern Shangji (IX), and northeastern Anyang (I). The spatial pattern for ecological risk was predominantly affected by Cd and Hg pollution.

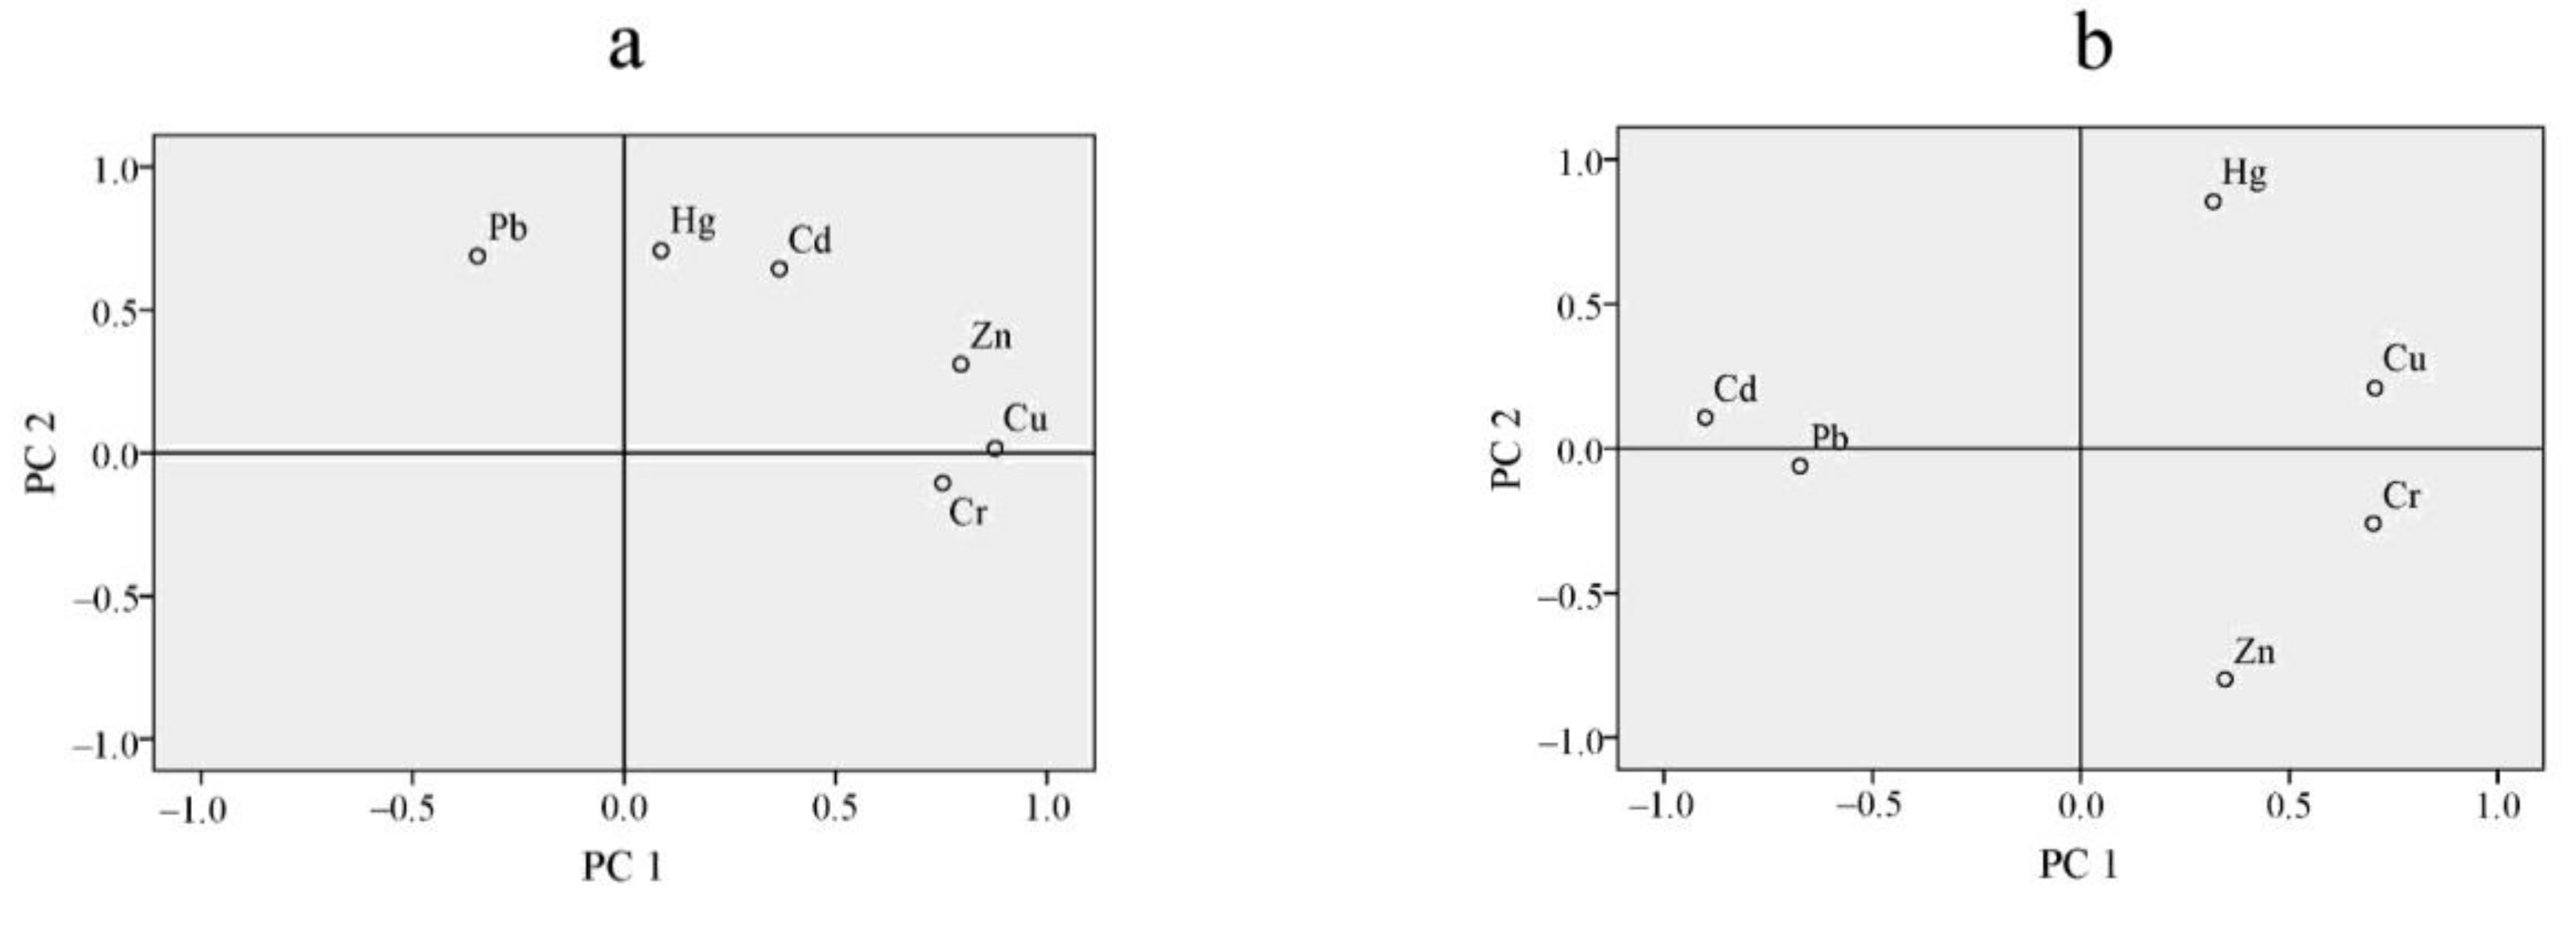
3.4. Analysis of PCCA and PCA-APCS-MLR

Table 9 and Table 10 summarize the results of PCCA for heavy metal concentrations in the topsoil and surface water of the study area. Significant positive correlations were found between CCd and CZn, between CCr and CCu, and between CCu and CZn (all at p < 0.01), with correlation coefficients of 0.452, 0.561, and 0.639, respectively (Table 9). These results suggest that Cd, Zn, Cr, and Cu might have originated from similar sources in the topsoil. The PCCA of the surface water has three results: (1) There was a significant positive correlation between CCd and CCr, CCd and CPb, CCr and CCu, CCu and CHg (at p < 0.01), with correlation coefficients of 0.537, 0.662, 0.438, and 0.355, respectively. (2) CHg and CZn showed a significant negative correlation (at p < 0.01), with a correlation coefficient of 0.406. (3) CCr and CPb presented a significant negative correlation (at p < 0.05), with a correlation coefficient of 0.242 (Table 10). These data indicate that Cd and Cr, Cd and Pb, Cr and Cu, and Cu and Hg in surface water might have originated from similar sources.
With regard to the topsoil, the KOM value (0.652) was above 0.6, and the p-value (0.000) of the Bartlett sphericity test was below 0.05. Hence, the data met the PCA requirements. Based on the PCA results (Table 11), two principal components (PCs) were obtained, the corresponding eigenvalues of which were 2.232 and 1.597, respectively. Their cumulative explained variance reached 62.143% (variance explained in the data by the first and second PCs was 37.194 and 24.949%, respectively), which explains the variation of data well in PCA. Figure 8a shows the factor loading map after rotation. CCr, CCu, and CZn had high loading on the first PC (0.753, 0.877, and 0.796, respectively). Elements with high loadings on the same component can be considered to originate from the same source. Therefore, Cr, Cu, and Zn likely originated from the same pollution source, which is consistent with the PCCA findings. Conversely, CCd, CHg, and CPb had high loading on the second PC, with corresponding characteristic values of 0.644, 0.708, and 0.788, respectively. We can thus infer that those three metals likely originated from the same sources in the topsoil.
In surface water, the KOM value (0.687) was above 0.6, and the p-value (0.000) of the Bartlett sphericity test was below 0.05, which also met the PCA requirements. As Table 11 shows, two principal components (PCs) were obtained, the corresponding eigenvalues of which were 2.478 and 1.494, respectively. Their cumulative explained variance reached 66.198% (variance explained in the data by the first and second PCs was 41.300 and 24.898%, respectively). Figure 8b shows CCr and CCu had high loading on the first PC (0.702 and 0.706, respectively); CHg (0.854) had high loading and CZn (−0.799) had high negative loading on the second PC, which is consistent with the PCCA results that CHg and CZn showed a significant negative correlation. These indicate that Cr and Cu might have originated from similar pollution sources, which is consistent with the PCCA results in surface water.
PC1 (topsoil) and PC2 (surface water) can be regarded as industrial and mining pollution factors; PC2 (topsoil) can be considered an agricultural pollution factor. The contribution rate of each common factor to heavy metals is calculated by APCS-MLR. Most of the fitting coefficients (R2) between the estimated result and measured result are bigger than 0.8, showing that there was a good consistency between them. The ratio of estimated concentration to measured concentration was close to 1, indicating that APCS-MLR has good feasibility for the calculation of heavy metallic pollution sources. As shown in Table 12, the contribution rates of PC1 (topsoil) to Cr, Cu, and Zn respectively were 69.03, 72.81, and 75.67%. The sources of these three elements were consistent. In addition, the contribution rate to Hg and Pb was more than 20%, indicating that industrial and mineral pollution in the research area also has some impacts on these elements. The contribution rate of PC2 (topsoil) to Cd, Hg, and Pb was 71.03, 52.19, and 48.76%, whilst for the other heavy metals it was between 2.12 and 11.38%, indicating that agricultural activities in the research area had fewer effect on Cr, Cu, and Zn in topsoil. The contribution rate of PC2 (surface water) to Cr and Cu was 68.81 and 81.92%. The sources of these two elements were well consistent. Moreover, they also had a great impact on Hg (52.37%) and Zn (60.48%). Other pollution sources have a great influence on Cd, Hg, and Pb, but the specific sources need to be further explored.

4. Discussion

4.1. Contamination Risk Characteristics of Heavy Metals in Topsoil and Surface Water

The migration and transformation of heavy metal pollutants in topsoil and surface water are, to some extent, prone to double pollution of soil and groundwater, and with industrial drainage, rainfall, etc., heavy metal elements from the soil are brought into the water environment, leading to more serious pollution of water resources [66]. Water pollution is particularly important for the Danjiangkou Reservoir, which is a national-level water source protection zone and an important drinking water source [67]. The heavy metal pollution in the surface water in the study area was primarily caused by two sites with alert-level CHg, one located in the west of Anyang Town and one in the east of Jinhe Town. There were a few areas of high-density distribution of CHg in the topsoil. The comparison between surface water and topsoil sampling sites showed that western Shangji Town, an area with high CHg in the topsoil, closely bordered eastern Jinhe Town, and that western Anyang Town, an area with moderate CHg in the topsoil, corresponded to the surface-water site with an alert-level CHg. These findings suggest that Hg pollution in the surface water, specifically alert-level CHg, was likely caused by Hg in the surrounding soil that was eroded and transported by rainfall or runoff into the reservoir.
The overall RI of surface water was low, indicating that the ecological risk of surface water in the reservoirs of the study area is low. Since the initiation of the SNWDP, strict ecological control measures have been implemented in the reservoir area, and residents have a strong awareness of environmental protection. A relevant study confirmed that the ecological safety in the water source areas of the SNWDP around Danjiangkou Reservoir has been improved by reducing chemical inputs [68]. The PLI and RI of topsoil were most affected by Cd, causing a moderate risk in parts of Xichuan County, Nanyang City, Henan Province, in the northern part of the study area. As a national poverty-stricken area, Xichuan aims to build a strong agricultural county with peppers, fruits, wheat, maize, and sweet potatoes. Although traditional agriculture in the county has been transformed to organic farming and is encouraged to be run by agribusinesses [68], the long-term farming practice of increasing fertilizer application to improve crop yields still results in lower potential ecological risk.

4.2. Analysis of Heavy Metal Sources

Cr, Cu, and Zn in the topsoil and Cr and Cu in surface water may have originated from similar contamination sources. Based on earlier statistical analysis and spatial distribution patterning, CCr, CCu, and CZn in the surface water exhibited strong variability, while in the topsoil they surpassed their corresponding background values and similarly had very high CV values. Moreover, CCr had the highest distribution across the study area. Collectively, these findings suggest that Cr, Cu, and Zn are primarily affected by external anthropogenic factors. In the last few decades, the release of Cd was about 22,000 metric tons, whereas Zn and Cu were 350,000 and 939,000 metric tons, respectively [69]. These dumped heavy metals pollute soil and water, resulting in reduced agricultural productivity [70,71]. Activities such as mining and chemical industries are the main causes of Cr, Cu, and Zn contamination in soil and water beyond tolerable limits [72]. There are also ore resources (e.g., Cu and Zn ores) in the study area. The wastewater and waste gases and residues generated during the mining and smelting of these ores, as well as the industrial pollutants discharged from other industrial activities, can all become sources of Cr, Cu, and Zn.
Cd, Hg, and Pb in the topsoil might have originated from similar pollution sources. The earlier analysis of pollution risk revealed that Hg and Cd affected the combined pollution in the surface water and topsoil environments. The potential ecological risk in the topsoil was shown to be driven by Cd and Hg. CPb in surface water displayed strong variability; CV values for both CCd and CPb in the topsoil were very high, with the former 1.77-fold higher than its corresponding background value. Cd and Pb are similarly significantly affected by human activities. Cd, Hg, and Pb in contaminated soils play a greater role in inhibiting plant growth [69]. The presence of the coal mining industry in the vicinity of the study area and the entry of coal mine drainage or rainwater into the soil can cause the occurrence of heavy metal pollution in the soil. The mining of coal and the discharge of mine sludge lead to Cd and Pb contamination in the soil [73,74]; these elements can also come from the emissions of fertilizers and pesticides and vehicle exhaust. In addition, there might be a close correlation between the Hg in topsoil and surface water in the study area. The Hg in the water body originated from two main sources: (1) wastewater discharged by the manufacturing of products such as chlor-alkali, plastics, batteries, and electronics; and (2) disposed medical equipment waste. Hence, this situation warrants attention in the relevant areas.

4.3. Strategy Recommendations

(1) Increased Cd content in the soil is mainly caused by agricultural activities, such as the use of irrigation water and fertilizers containing heavy metal contamination [75]. This may be related to the fact that Cd is a major ecological risk factor in topsoil in the district. The relevant authorities need to strengthen the supervision of Cd contamination in the agricultural soils of Maotang Town and Xijiadian Town, strengthen the management of factory pollutant discharge and domestic waste dumping, and implement treatment measures, such as solidification of residues after refining, as soon as possible. At the same time, optimization and control of agricultural production management is also important to mitigate the ecological risk to the soil in the study area.
(2) The area of Hg contamination in surface water corresponds to the area of high Hg content in the surrounding topsoil, and it is likely that elemental Hg in the soil enters the reservoir sediment through migration and is released back into the surface water through human activities and natural factors [76]. Monitoring and evaluation of reservoir sediment quality needs to be strengthened. A high proportion of the upper Danjiangkou Reservoir sediment comes from industrial activities, and agricultural activities are the main factor contributing to the higher metal sediment at the bottom of the reservoir [77]. The government needs to be alerted to strengthen supervision and management to limit the input of these activities.
(3) It is essential to treat pollution in areas where ecological risk already exists, explore more reasonable methods of technical restoration, and establish and improve ecological compensation mechanisms. The study area involves multiple regions across provinces and municipalities, and political barriers should be broken down to strengthen inter-regional cooperation. China has enacted laws related to the comprehensive prevention and control of heavy metal pollution, and all departments should achieve legal governance to improve the heavy metal pollution status of the CWSA of the Middle Route of China’s SNWDP.

5. Conclusions

In this study, six heavy metals in the surface water and topsoil of the CWSA of the Middle Route of China’s SNWDP were investigated based on robust assessment models (NPI, PLI, and RI) to determine their environmental contamination levels, potential ecological risk levels, and spatial distribution patterns. A semi-variogram analysis revealed the extent of variability in the concentration of heavy metals in the topsoil. In addition, through a correlation analysis combined with PCA, this paper attempted to identify the main sources of heavy metals in surface water and topsoil. The results show the following.
The heavy metal concentrations in the surface water met the class II standards stipulated in China’s EQSSW (GB 3838-2002) and the standards stipulated in the SDW (GB 5749-2006). The pollution at two surface-water sampling sites, in Anyang Town and Jinhe Town, as indicated by the NPI, was caused by alert-level CHg. These two sites correspond to areas with high CHg values in their topsoil. Attention should be paid to the Hg discharged in those areas.
The concentration of heavy metals in the topsoil generally exhibited moderate variability. The PLI values revealed a level of slight pollution in most of the areas where pollution was present. Cd and Cu were the principal elements causing pollution, and the most polluted areas were concentrated in the north and south of the study area. The RI values indicate a low ecological risk in the surface water and an overall low ecological risk in the topsoil. However, the ecological risk was moderate and considerable at 6.63 and 0.32% of sampling sites, respectively. The spatial pattern of ecological risk was mainly influenced by Cd and Hg. The PCCA and PCA results are in agreement, showing that Cr, Cu, and Zn and Cd, Hg, and Pb in the topsoil and Cu and Cr in the surface water could have originated from the same pollution sources. The APCS-MLR shows that these pollution sources are primarily linked to human activities, such as industrial activities, mining and smelting, and the application of chemical fertilizers and pesticides. This paper also puts forward brief strategy recommendations.
In the future, it is necessary to further enhance the assessment of pollution in both soil and water from several perspectives in tandem, such as examining the sources of anthropogenic factors, enacting policies and regulations, and ensuring the remediation and control of heavy metal contamination, and to strengthen the method of identifying pollution sources.

Author Contributions

Conceptualization, L.T. and Z.W.; methodology, L.T.; software, L.T. and B.Y.; formal analysis, L.T.; investigation, L.T., B.Y. and Z.X.; resources, Z.W.; data curation, L.T. and Z.X.; writing—original draft preparation, L.T.; writing—review and editing, B.Y. and Z.W.; supervision, Z.W.; funding acquisition, Z.W. All authors have read and agreed to the published version of the manuscript.

Funding

This research was funded by Danjiangkou Nanyang-Shiyan Water Source Area 1:50,000 Environmental Geological Survey Project (2016–2018), led by the Wuhan Geological Survey Center Project of China Geological Survey, grant number DD20160256, and the National Natural Science Foundation of China, grant number 71673258.

Institutional Review Board Statement

Not applicable.

Informed Consent Statement

Not applicable.

Data Availability Statement

The data presented in this paper are available on request from the corresponding author.

Acknowledgments

We would like to thank Mengjiao Fan and Wenwen Wang for their help with sample collection and analysis.

Conflicts of Interest

The authors declare no conflict of interest.

References

  1. Chowdhury, S.; Mazumder, M.J.; Al-Attas, O.; Husain, T. Heavy metals in drinking water: Occurrences, implications, and future needs in developing countries. Sci. Total Environ. 2016, 569, 476–488. [Google Scholar] [CrossRef]
  2. Li, R.; Tang, X.; Guo, W.; Lin, L.; Zhao, L.; Hu, Y.; Liu, M. Spatiotemporal distribution dynamics of heavy metals in water, sediment, and zoobenthos in mainstream sections of the middle and lower Changjiang River. Sci. Total Environ. 2020, 714, 136779. [Google Scholar] [CrossRef] [PubMed]
  3. USEPA. Guidelines for the health risk assessment of chemical mixtures. Fed. Reg. 1986, 51, 34014–34025. [Google Scholar]
  4. Ezemonye, L.I.; Adebayo, P.O.; Enuneku, A.A.; Tongo, I.; Ogbomida, E. Potential health risk consequences of heavy metal con-centrations in surface water, shrimp (Macrobrachium macrobrachion) and fish (Brycinus longipinnis) from Benin River, Nigeria. Toxicol. Rep. 2019, 6, 1–9. [Google Scholar] [CrossRef]
  5. Radhouan, E.Z.; Lamia, Y.; Takwa, W.; Sylvie, C.; Michel, G.; Lamjed, M.; Pierre, C.; Lotfi, R. Surface sediment enrichment with trace metals in a heavily human-impacted lagoon (Bizerte Lagoon, Southern Mediterranean Sea): Spatial distribution, ecological risk assess-ment, and implications for environmental protection. Mar. Pollut. Bull. 2021, 169, 112512. [Google Scholar]
  6. Cafer, M.Y.; Yasar, K. Spatial characteristics of ecological and health risks of toxic heavy metal pollution from road dust in the Black Sea coast of Turkey. Geoderma Reg. 2021, 25, e00388. [Google Scholar]
  7. Nsikak, U.B.; Essien, D.U.; Joseph, P.E.; Winifred, U.A.; Adebusayo, E.A.; Oyeronke, A.A.; Omowunmi, H.F.; Abass, A.O. Geochemical fractionation and ecological risks assessment of benthic sediment-bound heavy metals from coastal ecosystems off the Equatorial Atlantic Ocean. Int. J. Sediment Res. 2017, 32, 410–420. [Google Scholar]
  8. Zhang, J.; Li, X.; Guo, L.; Deng, Z.; Wang, D.; Liu, L. Assessment of heavy metal pollution and water quality characteristics of the res-ervoir control reaches in the middle Han River, China. Sci. Total. Environ. 2021, 799, 149472. [Google Scholar] [CrossRef] [PubMed]
  9. Saleem, M.; Iqbal, J.; Shah, M.H. Seasonal variations, risk assessment and multivariate analysis of trace metals in the freshwater reservoirs of Pakistan. Chemosphere 2019, 216, 715–724. [Google Scholar] [CrossRef]
  10. Nawab, J.; Khan, S.; Xiaoping, W. Ecological and health risk assessment of potentially toxic elements in the major rivers of Pakistan: General population vs. Fishermen. Chemosphere 2018, 202, 154–164. [Google Scholar] [CrossRef]
  11. Diwakar, K.; Calvin, D.W.; Tapan, K.C.; Srimoyee, G. Assessment of heavy metals in some natural water bodies in Meghalaya, India. Environ. Nanotechnol. Monit. Management. 2021, 16, 100512. [Google Scholar]
  12. Väänänen, K.; Leppänen, M.T.; Chen, X.; Akkanen, J. Metal bioavailability in ecological risk assessment of freshwater ecosystems: From science to environmental management. Ecotoxicol. Environ. Saf. 2018, 147, 430–446. [Google Scholar] [CrossRef] [PubMed]
  13. Magaly, V.A.; Rebecca, S.; Anthony, S.; Robert, J.G.M. Evaluating water quality and ecotoxicology assessment techniques using data from a lead and zinc effected upland limestone catchment. Water Res. 2018, 128, 49–60. [Google Scholar]
  14. Baken, K.A.; Sjerps, R.M.A.; Schriks, M.; Wezel, A.P. Toxicological risk assessment and prioritization of drinking water relevant con-taminants of emerging concern. Environ. Int. 2018, 118, 293–303. [Google Scholar] [CrossRef]
  15. Park, B.; Lee, J.; Ro, H.; Kim, Y.H. Effects of heavy metal contamination from an abandoned mine on nematode community structure as an indicator of soil ecosystem health. Appl. Soil Ecol. 2011, 51, 17–24. [Google Scholar] [CrossRef]
  16. Zhang, H.; Zhang, F.; Song, J.; Tan, M.L.; Kung, H.; Johnson, V.C. Pollutant source, ecological and human health risks assessment of heavy metals in soils from coal mining areas in Xinjiang, China. Environ. Res. 2021, 202, 111702. [Google Scholar] [CrossRef] [PubMed]
  17. Yuan, X.; Xue, N.; Han, Z. A meta-analysis of heavy metals pollution in farmland and urban soils in China over the past 20 years. J. Environ. Sci. 2021, 101, 217–226. [Google Scholar] [CrossRef] [PubMed]
  18. Liu, R.; Xu, Y.; Zhang, J.; Wang, W.; Elwardany, R.M. Effects of heavy metal pollution on farmland soils and crops: A case study of the Xiaoqinling Gold Belt, China. China Geol. 2020, 3, 402–410. [Google Scholar]
  19. Qiao, D.; Wang, G.; Li, X.; Wang, S.; Zhao, Y. Pollution, sources and environmental risk assessment of heavy metals in the surface AMD water, sediments and surface soils around unexploited Rona Cu deposit, Tibet, China. Chemosphere 2020, 248, 125988. [Google Scholar] [CrossRef] [PubMed]
  20. Rodríguez, L.; Ruiz, E.; Alonso-Azcárate, J.; Rincón, J. Heavy metal distribution and chemical speciation in tailings and soils around a Pb–Zn mine in Spain. J. Environ. Manag. 2009, 90, 1106–1116. [Google Scholar] [CrossRef] [PubMed]
  21. Wang, Y.; Yang, L.; Kong, L.; Liu, E.; Wang, L.; Zhu, J. Spatial distribution, ecological risk assessment and source identification for heavy metals in surface sediments from Dongping Lake, Shandong, East China. Catena 2015, 125, 200–205. [Google Scholar] [CrossRef]
  22. Meena, R.S.; Kumar, S.; Datta, R.; Lal, R.; Vijayakumar, V.; Brtnicky, M.; Sharma, M.P.; Yadav, G.S.; Jhariya, M.K.; Jangir, C.K.; et al. Impact of Agrochemicals on Soil Microbiota and Management: A Review. Land 2020, 9, 34. [Google Scholar] [CrossRef] [Green Version]
  23. Surya, B.; Saleh, H.; Suriani, S.; Sakti, H.H.; Hadijah, H.; Idris, M. Environmental Pollution Control and Sustainability Management of Slum Settlements in Makassar City, South Sulawesi, Indonesia. Land 2020, 9, 279. [Google Scholar] [CrossRef]
  24. Alexakis, D.E. Contaminated Land by Wildfire Effect on Ultramafic Soil and Associated Human Health and Ecological Risk. Land 2020, 9, 409. [Google Scholar] [CrossRef]
  25. Zhao, Y.; Xu, M.; Liu, Q.; Wang, Z.; Zhao, L.; Chen, Y. Study of heavy metal pollution, ecological risk and source apportionment in the surface water and sediments of the Jiangsu coastal region, China: A case study of the Sheyang Estuary. Mar. Pollut. Bull. 2018, 137, 601–609. [Google Scholar] [CrossRef]
  26. Olatunde, K.A.; Sosanya, P.A.; Bada, B.S.; Ojekunle, Z.O.; Abdussalaam, S.A. Distribution and ecological risk assessment of heavy metals in soils around a major cement factory, Ibese, Nigeria. Sci. Afr. 2020, 9, e00496. [Google Scholar] [CrossRef]
  27. Cui, X.; Geng, Y.; Sun, R.; Xie, M.; Feng, X.; Li, X.; Cui, Z. Distribution, speciation and ecological risk assessment of heavy metals in Jinan Iron & Steel Group soils from China. J. Clean. Prod. 2021, 295, 126504. [Google Scholar]
  28. Nasrin, Y.A.; Behnam, K. Geochemical characteristics, partitioning, quantitative source apportionment, and ecological and health risk of heavy metals in sediments and water: A case study in Shadegan Wetland, Iran. Mar. Pollut. Bull. 2019, 149, 110495. [Google Scholar]
  29. Zhu, J.; Zhang, Z.; Lei, X.; Jing, X.; Wang, H.; Yan, P. Ecological scheduling of the middle route of south-to-north water diversion project based on a reinforcement learning model. J. Hydrol. 2021, 596, 126107. [Google Scholar] [CrossRef]
  30. Sheng, J.; Michael, W. Using incentives to coordinate responses to a system of payments for watershed services: The middle route of South–North Water Transfer Project, China. Ecosyst. Serv. 2018, 32, 1–8. [Google Scholar] [CrossRef]
  31. Dong, G.; Hu, Z.; Liu, X.; Fu, Y.; Zhang, W. Spatio-Temporal Variation of Total Nitrogen and Ammonia Nitrogen in the Water Source of the Middle Route of the South-To-North Water Diversion Project. Water 2020, 12, 2615. [Google Scholar] [CrossRef]
  32. Zhu, J.; Lei, X.; Quan, J.; Yue, X. Algae Growth Distribution and Key Prevention and Control Positions for the Middle Route of the South-to-North Water Diversion Project. Water 2019, 11, 1851. [Google Scholar] [CrossRef] [Green Version]
  33. Tan, L.; Wang, Z.; Xue, Z.; Yang, B. Spatial variability and pollution risk assessment of soil fluorine in the core area of the Middle Route of the South-to-North Water Transfer Project. Resources Science 2021, 43, 368–379. (In Chinese) [Google Scholar]
  34. China Geological Survey. Specification for Multi-Purpose Regional Geochemical Survey (1:250000) (DD2005-01); China Geological Survey: Beijing, China, 2005. (In Chinese)
  35. Ministry of Natural Resources of the People’s Republic of China. Specification of Land Quality Geochemical Assessment (DZ/T 0295-2016). In Geological and Mineral Industry Standard of the People’s Republic of China 2016; Ministry of Natural Resources of the People’s Republic of China: Beijing, China, 2016. (In Chinese) [Google Scholar]
  36. Ministry of Ecology and Environment of China. Regulations on Quality Management of Environmental Monitoring; China Environmental Science Press: Beijing, China, 2006. (In Chinese) [Google Scholar]
  37. Ministry of Ecology and Environment of China. Water Quality Technical Regulation on the Design of Sampling Programs (HJ 495–2009); China Environmental Science Press: Beijing, China, 2009. (In Chinese) [Google Scholar]
  38. Ministry of Ecology and Environment of China. Technical Specification for Soil Environmental Monitoring (HJ/T 166-2004); China Environmental Science Press: Beijing, China, 2004. (In Chinese) [Google Scholar]
  39. Wang, S.; Zhu, S.; Zhou, C. Characteristics of spatial variability of soil thickness in China. Geogr. Res. 2001, 20, 161–169. (In Chinese) [Google Scholar]
  40. White, J.G.; Welch, R.M.; Norvell, W.A. Soil Zinc Map of the USA using Geostatistics and Geographic Information Systems. Soil Sci. Soc. Am. J. 1997, 61, 185–194. [Google Scholar] [CrossRef]
  41. Ogunkunle, C.O.; Fatoba, P.O. Contamination and spatial distribution of heavy metals in topsoil surrounding a mega cement factory. Atmos. Pollut. Res. 2014, 52, 270–282. [Google Scholar] [CrossRef] [Green Version]
  42. Omwene, P.I.; Öncel, M.S.; Çelen, M.; Kobya, M. Heavy metal pollution and spatial distribution in surface sediments of Mustafake-malpaşa stream located in the world’s largest borate basin (Turkey). Chemosphere 2018, 208, 782–792. [Google Scholar] [CrossRef]
  43. Wang, X.; Zhang, C.; Wang, C.; Zhu, Y.; Cui, Y. Probabilistic-fuzzy risk assessment and source analysis of heavy metals in soil consid-ering uncertainty: A case study of Jinling Reservoir in China. Ecotoxicol. Environ. Saf. 2021, 222, 112537. [Google Scholar] [CrossRef] [PubMed]
  44. Rahman, Z.; Singh, V.P. Assessment of heavy metal contamination and Hg-resistant bacteria in surface water from different regions of Delhi, India. Saudi J. Biol. Sci. 2016, 25, 1687–1695. [Google Scholar] [CrossRef] [PubMed] [Green Version]
  45. Khadija, D.; Hicham, A.; Rida, A.; Hicham, E.; Nordine, N.; Najlaa, F. Surface water quality assessment in the semi-arid area by a combination of heavy metal pollution indices and statistical approaches for sustainable management. Environ. Challenges 2021, 5, 100230. [Google Scholar] [CrossRef]
  46. Facchinelli, A.; Sacchi, E.; Mallen, L. Multivariate statistical and GIS-based approach to identify heavy metal sources in soils. Environ. Pollut. 2001, 114, 313–324. [Google Scholar] [CrossRef]
  47. Liao, Z.; Chen, Y.; Ma, J.; Islam, S.; Weng, L.; Li, Y. Cd, Cu, and Zn Accumulations Caused by Long-Term Fertilization in Greenhouse Soils and Their Potential Risk Assessment. Int. J. Environ. Res. Public Health 2019, 16, 2805. [Google Scholar] [CrossRef] [Green Version]
  48. Kelepertzis, E. Accumulation of heavy metals in agricultural soils of Mediterranean: Insights from Argolida basin, Peloponnese, Greece. Geoderma 2014, 221-222, 82–90. [Google Scholar] [CrossRef]
  49. Cai, L.; Xu, Z.; Bao, P.; He, M.; Dou, L.; Chen, L.; Zhou, Y.; Zhu, Y.-G. Multivariate and geostatistical analyses of the spatial distribution and source of arsenic and heavy metals in the agricultural soils in Shunde, Southeast China. J. Geochem. Explor. 2015, 148, 189–195. [Google Scholar] [CrossRef]
  50. Kaiser, H.F. An index of factorial simplicity. Psychometrika 1974, 39, 31–36. [Google Scholar] [CrossRef]
  51. Thurston, G.D.; Spengler, J.D. A quantitative assessment of source contributions to inhalable particulate matter pollution in metropolitan Boston. Atmospheric Environ. 1985, 19, 9–25. [Google Scholar] [CrossRef]
  52. Meng, L.; Zuo, R.; Wang, J.; Yang, J.; Teng, Y.; Shi, R.; Zhai, Y. Apportionment and evolution of pollution sources in a typical riverside groundwater resource area using PCA-APCS-MLR model. J. Contam. Hydrol. 2018, 218, 70–83. [Google Scholar] [CrossRef] [PubMed]
  53. Jin, G.; Fang, W.; Shafi, M.; Wu, D.; Li, Y.; Zhong, B.; Ma, J.; Liu, D. Source apportionment of heavy metals in farmland soil with application of APCS-MLR model: A pilot study for restoration of farmland in Shaoxing City Zhejiang, China. Ecotoxicol. Environ. Saf. 2019, 184, 109495. [Google Scholar] [CrossRef] [PubMed]
  54. Chai, L.; Wang, Y.; Wang, X.; Ma, L.; Cheng, Z.; Su, L. Pollution characteristics, spatial distributions, and source apportionment of heavy metals in cultivated soil in Lanzhou, China. Ecol. Indic. 2021, 125, 107507. [Google Scholar] [CrossRef]
  55. Ahmed, M.; Mahmoud, K.E.; Ayman, A.E.; Ahmed, M.K.; Ahmed, E. Temporal distribution of trace metals pollution load index in the Nile Delta coastal surface sediments. Mar. Pollut. Bull. 2021, 167, 112290. [Google Scholar]
  56. El-Magd, S.; Taha, T.H.; Pienaar, H.H.; Breil, P.; Amer, R.A.; Namour, P. Assessing heavy metal pollution hazard in sediments of Lake Mariout, Egypt. J. Afr. Earth Sci. 2021, 176, 104116. [Google Scholar] [CrossRef]
  57. Zhuang, S.; Lu, X. Environmental Risk Evaluation and Source Identification of Heavy Metal(loid)s in Agricultural Soil of Shangdan Valley, Northwest China. Sustainability 2020, 12, 5806. [Google Scholar] [CrossRef]
  58. Xiang, M.; Li, Y.; Yang, J.; Lei, K.; Li, Y.; Li, F.; Zheng, D.; Fang, X.; Cao, Y. Heavy metal contamination risk assessment and correlation analysis of heavy metal contents in soil and crops. Environ. Pollut. 2021, 278, 116911. [Google Scholar] [CrossRef]
  59. Wang, N.; Han, J.; Wei, Y.; Li, G.; Sun, Y. Potential Ecological Risk and Health Risk Assessment of Heavy Metals and Metalloid in Soil around Xunyang Mining Areas. Sustainability 2019, 11, 4828. [Google Scholar] [CrossRef] [Green Version]
  60. Talal, A.; El-Sorogy, A.S. Spatial distribution and risk assessment of heavy metals pollution in soils of marine origin in central Saudi Arabia. Mar. Pollut. Bull. 2021, 170, 112605. [Google Scholar]
  61. Wu, Q.; Hu, W.; Wang, H.; Liu, P.; Wang, X.; Huang, B. Spatial distribution, ecological risk and sources of heavy metals in soils from a typical economic development area, Southeastern China. Sci. Total Environ. 2021, 780, 146557. [Google Scholar] [CrossRef]
  62. Ministry of Ecology and Environment of China. Environmental Quality Standards for Surface Water (GB 3838-2002); Ministry of Ecology and Environment of China: Beijing, China, 2002. (In Chinese)
  63. National Health Commission of the People’s Republic of China. Standard for Drinking Water (GB 5749-2006). In Translated English of Chinese Standard; National Health Commission of the People’s Republic of China: Beijing, China, 2006. (In Chinese) [Google Scholar]
  64. Zhou, J.; Feng, K.; Pei, Z.; Lu, M. Pollution assessment and spatial variation of soil heavy metals in Lixia River Region of Eastern China. J. Soils Sediments 2016, 16, 748–755. [Google Scholar] [CrossRef]
  65. Guo, W.; Wu, T.; Jiang, G.; Pu, L.; Zhang, J.; Xu, F.; Yu, H.; Xie, X. Spatial Distribution, Environmental Risk and Safe Utilization Zoning of Soil Heavy Metals in Farmland, Subtropical China. Land 2021, 10, 569. [Google Scholar] [CrossRef]
  66. Wang, W.; Wang, X.; Bai, Z.; Alimu, M.; Liu, D.; Guo, Z. Pollution characteristics of forest surface water and the relationship with the soil heavy metal content in Tianshan. J. For. Environ. 2020, 40, 398–405. (In Chinese) [Google Scholar]
  67. Guo, C.; Chen, Y.; Xia, W.; Qu, X.; Yuan, H.; Xie, S.; Lin, L.-S. Eutrophication and heavy metal pollution patterns in the water suppling lakes of China’s south-to-north water diversion project. Sci. Total Environ. 2019, 711, 134543. [Google Scholar] [CrossRef]
  68. Feng, D.; Zhao, G. Footprint assessments on organic farming to improve ecological safety in the water source areas of the South-to-North Water Diversion project. J. Clean. Prod. 2020, 254, 120130. [Google Scholar] [CrossRef]
  69. Yuvaraj, A.; Thangaraj, R.; Karmegam, N.; Ravindran, B.; Chang, S.W.; Awasthi, M.K.; Kannan, S. Activation of biochar through exoenzymes prompted by earthworms for vermibiochar production: A viable resource recovery option for heavy metal contaminated soils and water. Chemosphere 2021, 278, 130458. [Google Scholar] [CrossRef] [PubMed]
  70. Srivastava, V.; Sarkar, A.; Singh, S.; Singh, P.; Araujo, A.; Singh, R.P. Agroecological Responses of Heavy Metal Pollution with Special Emphasis on Soil Health and Plant Performances. Front. Environ. Sci. 2017, 5. [Google Scholar] [CrossRef] [Green Version]
  71. Hu, Y.; Liu, X.; Bai, J.; Shih, K.; Zeng, E.Y.; Cheng, H. Assessing heavy metal pollution in the surface soils of a region that had undergone three decades of intense industrialization and urbanization. Environ. Sci. Pollut. Res. 2013, 20, 6150–6159. [Google Scholar] [CrossRef] [PubMed]
  72. Bello, S.; Nasiru, R.; Garba, N.; Adeyemo, D. Carcinogenic and non-carcinogenic health risk assessment of heavy metals exposure from Shanono and Bagwai artisanal gold mines, Kano state, Nigeria. Sci. Afr. 2019, 6, e00197. [Google Scholar] [CrossRef]
  73. Li, Q.; Ji, H.; Qin, F.; Tang, L.; Guo, X.; Feng, J. Sources and the distribution of heavy metals in the particle size of soil polluted by gold mining upstream of Miyun Reservior, Beijing: Implications for assessing the potential risks. Environ. Monit. Assess 2014, 186, 6605–6626. [Google Scholar] [CrossRef]
  74. Xiao, J.; Yuan, X.; Li, J. Characteristics and transformation of heavy metal pollution in soil and rice of Yangtze River Delta Region. Agric. Sci. Technol. 2010, 11, 148–151. [Google Scholar]
  75. Sun, C.; Liu, J.; Wang, Y.; Sun, L.; Yu, H. Multivariate and geostatistical analyses of the spatial distribution and sources of heavy metals in agricultural soil in Dehui, Northeast China. Chemosphere 2013, 92, 517–523. [Google Scholar] [CrossRef]
  76. Kumar, S.; Islam, A.R.M.T.; Hasanuzzaman, M.; Salam, R.; Khan, R.; Islam, M.S. Preliminary assessment of heavy metals in surface water and sediment in Nakuvadra-Rakiraki River, Fiji using indexical and chemometric approaches. J. Environ. Manag. 2021, 298, 113517. [Google Scholar] [CrossRef]
  77. Zhuang, W.; Ying, S.C.; Frie, A.L.; Wang, Q.; Song, J.; Liu, Y.; Chen, Q.; Lai, X. Distribution, pollution status, and source apportionment of trace metals in lake sediments under the influence of the South-to-North Water Transfer Project, China. Sci. Total Environ. 2019, 671, 108–118. [Google Scholar] [CrossRef]
Figure 1. Location map of core water source area of Middle Route of South-to-North Water Diversion Project, China.
Land 10 00934 g001
Figure 2. Results for the Pi index of six heavy metals in surface water of the study area.
Land 10 00934 g002
Figure 3. Spatial distribution of NPI for six heavy metals in surface water of study area. I: Anyang Town; II: Jinhe Town; III: Maotang Town; IV: Xijiadian Town; V: Hejia Town; VI: Longshan Town; VII: Wudang Mountains, D.C.; VIII: Liangshuihe Town; IX: Shangji Town; X: Cangfang Town; XI: Liubei Town; XII: Fangtan Town.
Land 10 00934 g003
Figure 4. Spatial distribution of heavy metal concentration in topsoil across study area. I: Anyang Town; II: Jinhe Town; III: Maotang Town; IV: Xijiadian Town; V: Hejia Town; VI: Longshan Town; VII: Wudang Mountains, D.C.; VIII: Liangshuihe Town; IX: Shangji Town; X: Cangfang Town; XI: Liubei Town; XII: Fangtan Town.
Land 10 00934 g004
Figure 5. Spatial distribution of PLI for heavy metals in topsoil of the study area. I: Anyang Town; II: Jinhe Town; III: Maotang Town; IV: Xijiadian Town; V: Hejia Town; VI: Longshan Town; VII: Wudang Mountains, D.C.; VIII: Liangshuihe Town; IX: Shangji Town; X: Cangfang Town; XI: Liubei Town; XII: Fangtan Town.
Land 10 00934 g005
Figure 6. Percentage contributions of Cd and Hg to E r i and RI for heavy metals in topsoil.
Land 10 00934 g006
Figure 7. Spatial distribution of RI for heavy metals in topsoil of study area. I: Anyang Town; II: Jinhe Town; III: Maotang Town; IV: Xijiadian Town; IV: Hejia Town; VI: Longshan Town; VII: Wudang Mountains, D.C.; VIII: Liangshuihe Town; IX: Shangji Town; X: Cangfang Town; XI: Liubei Town; XII: Fangtan Town.
Land 10 00934 g007
Figure 8. Factor loading for two principal components after varimax rotation. (a): Topsoil; (b): Surface water.
Land 10 00934 g008
Table 1. Testing methods for heavy metal elements.
TypeItemCdCrCuPbZnHg
TopsoilTesting methodInductively coupled plasma mass spectrometry (HJ 766-2015)Atomic fluorescence spectrometry (HJ 680-2013)
EquipmentInductively coupled plasma spectrometer (NexION 350D)Atomic fluorescence spectrometer (AFS-8510)
Detection limit (mg·kg−1)0.021.001.200.203.200.0005
Surface waterTesting methodInductively coupled plasma mass spectrometry (HJ 700-2014)Atomic fluorescence spectrometry (HJ 694-2014)
EquipmentInductively coupled plasma spectrometer (NexION 350D)Atomic fluorescence spectrometer (SA-7800)
Detection limit (µg·L−1)0.020.110.050.090.670.0004
Table 2. Evaluation index and grading standard of potential ecological risk (RI).
Potential Ecological Risk Index
Threshold interval E r i ≤ 40, RI ≤ 15040 < E r i ≤ 80,
150 < RI ≤ 300
80 < E r i ≤ 160,
300 < RI ≤ 600
160 < E r i ≤ 320, 600 < RI ≤ 1200 E r i > 320, RI > 1200
Ecological risk levelLow riskModerate riskConsiderable riskHigh riskSignificantly high risk
Table 3. Statistics for six heavy metals in surface water in study area.
StatisticCdCrCuHgPbZn
Maximum (µg·L−1)2.777.623.140.0522.12223.00
Minimum (µg·L−1)0.030.530.060.0020.121.57
Median (µg·L−1)0.033.570.980.0020.7255.63
Average (µg·L−1)0.263.491.170.0090.8763.93
SD (µg·L−1)0.751.260.660.0140.5152.60
CV (%)34.69278.21177.5569.50171.18121.55
EQSSW I (µg·L−1)110100.051050
EQSSW II (µg·L−1)55010000.05101000
EQSSW III (µg·L−1)55010000.1501000
EQSSW IV (µg·L−1)55010001502000
EQSSW V (µg·L−1)10100100011002000
SDW (µg·L−1)55010001102000
Table 4. Proportions (%) of Nemerow pollution index (NPI) levels of six heavy metals in surface water.
LevelCdCrCuHgPbZnNPI
Safe100.00100.00100.0097.65100.00100.0097.65
Alert0.000.000.002.350.000.002.35
Mild concentration0.000.000.000.000.000.000.00
Serious concentration0.000.000.000.000.000.000.00
Table 5. Statistics for six heavy metals in topsoil of study area.
StatisticCdCrCuHgPbZn
Maximum (mg·kg−1)0.87248.24121.090.22163.13193.00
Minimum (mg·kg−1)0.032.601.400.0010.4011.71
Median (mg·kg−1)0.1977.8227.640.02722.4680.40
Average (mg·kg−1)0.2281.6031.290.03522.4685.71
SD (mg·kg−1)0.1242.0620.040.0317.4224.90
CV (%)187.84194.03156.17112.16302.64344.24
Topsoil background value (mg·kg−1)0.1274.9025.200.0646.3071.85
Table 6. Parameters of semi-variogram models for six heavy metals in topsoil.
ItemCdCrCuHgPbZn
ModelExponentialLinearExponentialGaussianGaussianGaussian
Nugget0.011595.00350.100.000735.19533.00
Sill0.033969.35944.380.0025103.622631.88
Nugget/Sill (%)30.3040.1837.0728.0033.9620.25
Range (km)29.5813.4421.7147.1731.4716.75
R20.900.810.940.850.810.83
Table 7. Classes and statistics for the contamination factor (CF) and pollution load index (PLI) for six heavy metals in topsoil.
ContaminationProportion of Contaminated Sites (%)
CFPLI
CdCrCuHgPbZn
Not polluted12.4845.6136.9588.1499.4327.8370.60
Slightly polluted60.5647.9653.638.820.5768.1628.93
Moderately polluted20.093.925.081.670.004.010.44
Highly polluted6.872.514.341.370.000.000.03
Statistics of CF and PLI
Maximum7.073.314.813.891.362.693.20
Minimum0.230.030.060.010.010.160.17
Average1.771.091.240.610.491.190.90
Classification of contaminationSlightly pollutedSlightly pollutedSlightly pollutedNot pollutedNot pollutedSlightly pollutedNot polluted
Table 8. Ecological risk index ( E r i ) and potential ecological risk index (RI) for six heavy metals in topsoil and surface water of study area.
ItemType E r i RI
CdCrCuHgPbZn
MaxSurface water16.610.300.0241.601.060.2242.63
Topsoil212.206.6324.03155.416.822.69405.49
MinSurface water0.150.020.001.200.060.001.55
Topsoil6.830.070.280.580.040.1615.66
AverageSurface water1.550.140.017.540.430.069.74
Topsoil53.252.186.2124.472.431.1989.73
Ecological risk levelSurface waterLow riskLow riskLow riskLow riskLow riskLow riskLow risk
TopsoilModerate riskLow riskLow riskLow riskLow riskLow riskLow risk
Table 9. Pearson correlation matrix of heavy metals in topsoil.
CdCrCuHgPbZn
Cd1.000
Cr0.1171.000
Cu0.2180.561 **1.000
Hg0.2430.0490.0991.000
Pb0.153−0.159−0.1870.2361.000
Zn0.452 **0.3860.639 **0.186–0.0661.000
Note: ** Correlation significant at 0.01 level (bilateral).
Table 10. Pearson correlation matrix of heavy metals in surface water.
CdCrCuHgPbZn
Cd1.000
Cr0.537 **1.000
Cu−0.4870.438 **1.000
Hg−0.1660.9970.355 **1.000
Pb0.662 **−0.242 *−0.172−0.1901.000
Zn−0.3550.3050.140−0.406 **−0.1231.000
Note: ** Correlation significant at 0.01 level (bilateral), * Correlation significant at 0.05 level (bilateral).
Table 11. Principal component analysis results.
ComponentCdCrCuHgPbZnCharacteristic ValueVariance (%)Cumulative Variance (%)
PC1 (topsoil)0.3670.7530.8770.088−0.3460.7962.23237.19437.194
PC2 (topsoil)0.644−0.1050.0170.7080.6880.3111.49724.94962.143
PC1 (surface water)−0.9070.7230.6830.235−0.6650.4202.47841.30041.300
PC2 (surface water)0.021−0.1920.2750.881−0.125−0.7621.49424.89866.198
Table 12. Common factor contribution rate of heavy metals.
ItemCdCrCuHgPbZn
PC1 (topsoil) (%)13.4869.0372.8126.7420.0175.67
PC2 (topsoil) (%)71.0311.385.2152.1948.762.12
Other15.4919.5921.9821.0731.2322.21
Measured average concentration (mg·kg−1)0.22 ± 0.1281.60 ± 42.0631.29 ± 20.040.035 ± 0.03122.46 ± 7.4285.71 ± 24.90
Estimated average concentration (mg·kg−1)0.26 ± 0.1081.97 ± 42.5130.83 ± 21.880.035 ± 0.03622.37 ± 7.5386.33 ± 24.79
Ratio (E/O)1.051.011.031.081.030.99
R20.820.790.880.830.910.84
PC1(surface water)8.6968.8181.9252.3729.2360.48
Other91.3131.1918.0847.6370.7739.52
Measured average concentration (µg·L−1)0.26 ± 0.753.49 ± 1.261.17 ± 0.660.009 ± 0.0140.87 ± 0.5163.93 ± 52.60
Estimated average concentration (µg·L−1)0.29 ± 0.743.44 ± 1.351.22 ± 0.650.009 ± 0.0150.88 ± 0.5463.79 ± 54.46
Ratio (E/O)1.021.011.021.041.031.01
R20.870.940.920.810.860.75
Publisher’s Note: MDPI stays neutral with regard to jurisdictional claims in published maps and institutional affiliations.

