Article

Micro-Analysis of Price Spillover Effect among Regional Housing Submarkets in Korea: Evidence from the Seoul Metropolitan Area

1
Division of Urban Environment Research, Goyang Research Institute, Goyang-si 10393, Korea
2
Department of Urban Planning and Real Estate, Chung-Ang University, Seoul 06974, Korea
*
Author to whom correspondence should be addressed.
Land 2021, 10(8), 879; https://doi.org/10.3390/land10080879
Submission received: 18 July 2021 / Revised: 18 August 2021 / Accepted: 19 August 2021 / Published: 21 August 2021
(This article belongs to the Section Urban Contexts and Urban-Rural Interactions)

Abstract

:
This study examined the price spillover effect of housing submarkets in cities in the Seoul metropolitan area in South Korea by using the Granger causality test and vector autoregressive model (VAR). We found that housing prices showed a higher spillover effect within regions with similar housing market characteristics. Additionally, the spatial spillover of housing prices revealed a difference between sales price and jeonse price. The spillover of jeonse price was characterized by mutual influence among neighboring cities, while that of sales price was characterized by the influence being transferred in one direction hierarchically. Furthermore, the effects of housing price indicated a slight difference between sales price and jeonse price. Although jeonse price was mainly affected by a neighboring area (geographic boundary), sales price was more influenced by the city with the highest housing prices. Lastly, the housing price spillover tended to be expansive around the city with the highest price. These results suggest that housing price policies targeting specific regions or areas in Korea must be differentiated according to the type of occupancy (jeonse or sales), and it is essential to consider the externalities when promoting policies in the housing market wherein externalities may be significant.

1. Introduction

The housing submarket can be defined as a series of houses that have relatively low substitutability between houses belonging to different submarkets, but are close substitutes for each other within the same submarket. There are several methods to classify housing markets, such as attributional methods and data-driven methods [1,2,3]. The former are typically based on physical characteristics (such as spatial and political boundaries), type of house (e.g., apartment and detached house), and socioeconomic characteristics (such as housing price, consumer housing preferences, income, and race). The latter are mainly based on data algorithms and hierarchical clustering [4,5].
Since each housing submarket has different characteristics, they require policies that are tailored to them for maximum effectiveness [1,6]. In particular, when promoting policies related to housing prices, uniform pricing policies should be avoided as they do not account for regional situations with different supply and demand conditions, which may exacerbate market distortion caused by price imbalances [7,8].
Seoul, the capital of South Korea and its largest city, and Gyeonggi-do, which is a megalopolis directly adjacent to Seoul, comprise the metropolitan area (Seoul metropolitan area). Most national functions, such as society, culture, economy, and politics, are concentrated in this region and it is a key area of concern for the government due to emerging housing problems [9]. The housing policy of the Korean government has primarily focused on solving the housing problems in Seoul, especially the instability of housing prices. Consequently, it was inevitable that the housing policy of Gyeonggi-do would be influenced by the Seoul-centered policy direction [10]. Therefore, it can be said that Gyeonggi-do has been the subject of policies that are limited to the subordinate role of making up for the housing shortage in Seoul, despite having a much larger population (approximately 40% larger than that of Seoul) and unique characteristics as a considerable housing submarket. The Seoul metropolitan area is a conurbation wherein 50% of Korea’s population is concentrated, and is sometimes referred to as a single housing submarket despite being composed of 56 cities with differentiated housing market characteristics. The outskirts of Seoul and Gyeonggi-do have an organic relationship with each other despite their different housing market characteristics. In other words, although the administrative scope differs, there is a large spillover phenomenon in which changes in housing prices within one region affect other regions [10,11]. In particular, a number of the policies (e.g., 1st new city project, 3rd new city project, and public transportation system expansion) to solve the housing problems in Seoul have been implemented in the Gyeongeui region, which is in the northwest of Gyeonggi-do. In this regard, this region can be an area where complex price spillover occurs with the adjacent Northwest region of Seoul (see Figure 1).
Housing prices have soared rapidly in recent years, especially in the metropolitan area in Korea. In addition to involuntary internal migration to the outskirts due to an increase in sales prices, housing instability due to a sharp rise in the jeonse (the lease of a house on a deposit basis) price is rapidly increasing [11]. Here, jeonse refers to Korea’s most popular housing rental system, where a renter pays a deposit of approximately 40–80% of the housing price in lieu of a monthly rent. The deposit is then returned to the renter at the end of the contract [12,13,14]. Therefore, the government is making efforts to stabilize the housing market by promulgating various policies, such as strong loan regulation, housing transaction permit system, and heavy taxation for multi-house owners, predominantly in areas experiencing a surge in housing prices. However, the housing market continues to be chaotic as these policies have caused a bubble effect, a phenomenon in which areas adjacent to regulated areas experience rising housing prices [15]. For this reason, the Northwest region of Seoul and the Gyeongeui region of Gyeonggi-do, where housing prices are relatively cheap, are the key targets of policies to solve the housing problems in Seoul and can be considered important places for a careful examination of existing issues.
Analyzing the price spillover effect in the housing submarkets can contribute to understanding the spatial impact of government policies and the characteristics of the housing submarket. Therefore, the purpose of this study is to empirically analyze the price spillover of the housing submarkets in depth, with a focus on the housing sales price and jeonse price, using the Granger causality test and vector autoregressive model (VAR). Further, we aim to review their implications on the government’s housing price policy that targets major cities in the Gyeongeui and Northwest regions, where the price spillover of the Korean housing market can be scrutinized owing to these regions’ unique submarket characteristics and subordinate relationships.
The remainder of this study is organized as follows. Section 2 and Section 3 examine the research background and analytical framework, respectively. Section 4 explains the empirical analysis, and finally, Section 5 concludes and summarizes the results of this study.

2. Research Background

There is a phenomenon unique to the housing market, in which housing price changes in one area are transferred to neighboring areas. The bubble effect, which has appeared frequently in recent Korean media, refers to a phenomenon in which price policies and regulations in a specific area cause surges in housing prices in other areas [15,16]. This bubble effect is regarded as an important phenomenon that can predict the instability of the local housing market in the future [17]. The price transition between regions can be explained through the ripple effect [11,18,19,20,21], price movements [22,23], spillover [24,25,26,27,28,29], and spatial volatility [30]. All these effects comprise a chain of spillover effects through which changes in housing prices in a specific country or region directly affect the housing markets in other neighboring countries or regions. Many studies have used these various phenomena to explain the spillover effect between housing markets, but some studies have questioned whether the appearance of a significant spillover effect [18,31], or reported spillover effect, depends on the various characteristics of the region [19].
Several related studies have identified the spillover between individual housing submarkets and other neighboring housing submarkets. First, Zhang and Fan [29] analyzed the housing price spillover in 70 individual cities in China. Consequently, they found that the price linkage between cities has been getting stronger in recent years, and that large cities such as Shanghai and Beijing showed a stronger spillover effect with respect to neighboring small and medium-sized cities. Further, Chiang [32] identified the interregional spillover of housing prices in six Chinese cities including Beijing, and found that there was a significant spillover effect between regions. Moreover, it was found that the housing prices in Beijing have a bubble effect on the housing prices in surrounding areas, indicating that the housing market around the metropolitan area has a close relationship with the price fluctuations in large cities. Lan et al. [25] stated that economic power is concentrated in large cities, so neighboring cities with relatively weak economic power are inevitably subordinated to large cities, and this situation causes the spillover of housing prices.
Pollakowski and Ray [33] identified the spillover between large American cities and neighboring cities in New York and surrounding areas. They found that changes in housing prices in New York have a close causal relationship with those of neighboring cities, proving that the aforementioned relationship between China’s large cities and the housing market in surrounding areas is not a unique case. Additionally, Giussani and Hadjinmtheou [34] examined whether there was a transition effect between regions in the UK local housing market. Similar to Lan et al. [25], they found that the transition effect appeared mainly in regions with high population density and large economic scale. Similarly, Tsai [35] identified the spillover of housing prices between regions in London, England, and 10 major regions. The results indicated that the southeastern region has a close relationship with the UK housing market, and housing price fluctuations in this region affected housing prices within the UK with a time lag of one month. However, London exhibited results that were different from those of previous studies; London’s house price fluctuation caused fluctuations in London itself, but no significant regional transition was found.
The spillover of the housing market is treated as an important research topic in Korea because the Korean housing market has a mononuclear structure that is dependent on a specific region, that is, the Seoul metropolitan area. Resultingly, other housing markets, excluding Seoul, constitute individual submarkets but inevitably play the role of a hinterland in resolving the housing problems in Seoul. Therefore, the Korean housing market inevitably exhibits a strong spillover phenomenon in areas surrounding Seoul. In the 2000s, studies were conducted to examine whether housing prices in the Gangnam area, the core area of Seoul, cause a spillover phenomenon in neighboring areas or the whole country. The results reveal that the rise in housing prices in the Gangnam area had an effect on the rise in housing prices in other areas, and thus, it was necessary to suppress the price rise in this area, which was the primary reason for the general rise in housing prices [36,37,38,39].
Recent related studies have indicated that there is a clear causal movement of prices between regions around Seoul; Kim [40] revealed that the causal movement of prices between Seoul and Gyeonggi-do is stronger than in other regions. Additionally, Park and Kim [41] found that individual housing markets in the metropolitan area have strong mutual transferability. Specifically, Gangnam in Seoul serves as a starting point for changes in the housing market in Gyeonggi-do. Moreover, Jin and Lee [42] analyzed the movement of the rental housing market mainly in the Gangnam area and found a significant causal relationship with the rental housing market in Seoul and neighboring cities. Seo and Kim [11] examined the spillover effect of the housing markets in the Seoul metropolitan area from a more detailed point of view and concluded that Seoul affects neighboring regions based on its independent housing market status. This trend appeared both in the housing sales market and the jeonse market. In particular, it was found that the spillover of the housing market from Seoul to Gyeonggi-do was the result of involuntary movement due to the difficulties of living in Seoul, regardless of the sales and jeonse prices.
In sum, previous studies have revealed that there is a significant spillover effect between Seoul, the largest housing market in Korea, and the neighboring housing submarkets. However, the microscopic spillover between individual submarkets in Seoul and Gyeonggi-do has been largely overlooked as most previous studies have dealt with the macroscopic spillover between Seoul and Gyeonggi-do, or the macroscopic spillover with respect to Gyeonggi-do, by focusing on Gangnam, which has the highest housing price in Seoul. In addition, the Northwest region of Seoul and Gyeongeui region of Gyeonggi-do can be considered as the optimal research target areas to examine the validity and rationality of the government’s housing policy, and the housing price policy in particular. However, studies have rarely dealt with the housing market spillover in these areas. Accordingly, our study aimed at bridging the gaps in existing studies by microscopically examining the price spillover of individual housing submarkets in the Seoul metropolitan area where government policies have been concentrated.

3. Analytical Framework

3.1. Research Area and Housing Price Trends

This study aimed to confirm the existence of a price spillover effect among cities in terms of housing prices (sales and jeonse). For this purpose, the housing prices (sales and jeonse) of individual cities were used as a key variable, with the spatial scope comprising metropolitan cities such as Seoul and Gyeonggi-do. This study targeted areas where the price spillover can be clearly observed (the Northwest region of Seoul and the Gyeongeui region of Gyeonggi-do), because these regions not only have unique submarket characteristics but also have a subordinate relationship. The Gyeongeui region includes the cities of Goyang, Gimpo, and Paju, which, in addition to exhibiting characteristics of individual housing markets, are adjacent to each other and are characterized by the same living boundaries. Particularly, Goyang, Gimpo, and Paju are representative areas that have always been included in new city development projects to solve Seoul’s population dispersion when implementing important housing policies. In this respect, the spillover phenomenon observed in these areas are specifically related to cities in the Northwest region of Seoul. The Northwest region of Seoul, which is a higher-priced housing market adjacent to the Gyeongeui region, includes the cities of Mapo, Eunpyeong, and Seodaemun (see Figure 1).
The Gangnam district in Seoul has the highest housing prices in Korea, and it greatly influences the housing markets in the metropolitan area regardless of geographical proximity [43]. Accordingly, we examined whether price changes in the Gangnam region and the housing market in the study area are related, or whether there is a causal relationship.
The analysis was conducted from September 2003 to October 2020, which is the most recent period for which data are available, because the price data for all cities in the study area were only gathered after September 2003. These data were gathered from Kookmin Bank, a private financial institution that collects and provides data on the housing market in Korea. Finally, a total of 206 months’ worth of data was used to analyze price spillover among regions.
To understand the spillover effect of the housing markets in the study area, it is necessary to check the price trend of the markets in advance. Overall trends of sales and jeonse prices between 2003 and 2020 in the area (cities in the Gyeongeui and Northwest regions) are shown in Figure 2. The analysis result shows that, although the overall price fluctuation pattern is similar, the range of price fluctuation in each city is different. Therefore, it was confirmed that the cities share characteristics of housing submarkets in terms of price.

3.2. Research Methodology

For the empirical analysis, the Granger causality analysis, impulse response analysis, and variance decomposition analysis based on the VAR were used. We used the Granger causality analysis to identify if a relationship among regional (city) price changes exists, and if there is a causal relationship among them. The impulse response analysis and variance decomposition analysis were used to assess how the impact of the price changes between cities and regions materializes. This study illustrates the price spillover impact using spillover plots instead of spillover tables because it would be more effective to visualize the time series trends rather than to view them as just numbers on price changes [28,44,45].
To use time series data, it is necessary to check the time series stability of the data. In this study, the stability was reviewed by conducting the augmented Dickey−Fuller unit root test (ADF test). In addition, the Johansen co-integration test was used to identify whether a long-term equilibrium relationship was established due to the existence of co-integration between variables [11]. Based on this, VAR was used when long-term equilibrium did not exist, and vector error correction model (VECM), a type of VAR, was used when there was a long-term equilibrium [46]. The data used in this study was found to have no long-term equilibrium, and consequently the VAR was set as the basic model for empirical analysis. The basic formulas of the VAR are presented in Equations (1) and (2) when assuming two random variables [11,47]. Here, yt and zt represent time series random variables observed over time (t = 1,..., T), c is a constant, and ϵ is the error term.
y t = c 1 + i = 1 k α i y t 1 + j = 1 l β j z ( t j ) + ε 1 t    
z t = c 2 + i = 1 m σ i y t 1 + j = 1 n τ j z ( t j ) + ε 2 t

4. Empirical Analysis

4.1. Spatial Spillover Effect of Housing Jeonse Prices

To analyze the spatial spillover of jeonse prices, we performed the ADF unit root test to identify the stability of the time series data. The ADF test was performed using the jeonse price index and the rate of change in the jeonse price (jeonse price change rate) compared to the previous month. Consequently, we found that a unit root exists in the jeonse price index, but the jeonse price change rate was statistically significant within the 5% significance level, indicating the lack of a unit root (see Table 1). Therefore, a time series analysis was performed based on the jeonse price change rate in which there was no unit root of the raw data. Further, using the actual change data is advantageous as it can easily explain the analysis results.
Table 2 presents the descriptive statistics of jeonse price. The region with the largest increase in jeonse price during the research period was Gangnam (Seoul), which exhibited an average monthly increase of about 0.35%. The location with the next highest upward trend was Goyang, which is located in the Gyeongeui region, with an average monthly increase of 0.304%. Eunpyeong in the Northwest region exhibited the largest increase (maximum) in jeonse price, with a monthly average of about 3.7%, while Gangnam had the largest drop (minimum), with a monthly average of 3.65% in December 2008.
Following this, we conducted a correlation analysis to examine the changes in jeonse price between regions. The price between regions was found to have a higher correlation within the same region, implying that the spillover effect could be higher in regions with similar housing market characteristics. In addition, the correlation between cities in the Northwest region was found to be higher than that of the Gyeongeui region, and the correlation with other cities in the Gangnam area was found to be lower than that of the Northwest and Gyeongeui regions. However, the difference was not significant. Accordingly, it can be inferred that the price spillover effect of the jeonse market within the Seoul area is noticeable, and the influence of the Gangnam jeonse market appears over a relatively wide spatial range (see Table 3).
Additionally, we examined the relationship of jeonse price changes between cities through the correlation analysis. The price change in Goyang indicates a high correlation with neighboring cities such as Paju and Mapo. Moreover, Mapo shows a high correlation with Goyang, Seodaemun, and Gangnam, while Gimpo and Paju exhibit a relatively low correlation. Eunpyeong shows a relatively high correlation with Gimpo, Mapo, and Goyang, but a relatively low correlation with Paju. Seodaemun has a high correlation with Mapo, Goyang, and Eunpyeong, but a low correlation with Paju and Gimpo. In the case of Gimpo, jeonse price has the highest correlation with Goyang, followed by Eunpyeong, while Paju has the highest correlation with Goyang. Lastly, Mapo and Goyang were the cities with high correlation with Gangnam, and other cities show a slightly lower correlation than Mapo and Goyang (see Table 4).
A correlation analysis merely identifies the relationship between two regions, and it has limited scope in examining whether this relationship causes the price change. Although it is possible to infer a relationship between two regions through correlation analysis, it is not possible to identify a causal relationship such as whether a price change in one region has an effect or can cause a price change in another region. Since the Granger causality analysis can explain the causes that affect the variation of one variable, it can compensate for the shortcomings of the correlation analysis results. However, since the judgment of inter-variable influences was limited with the results of solely the Granger causal analysis, a VAR was constructed to examine the influences by region. To establish an analysis model, the long-term balance relationship and the appropriate time lag were tested.
The test result reveals that the appropriate lag length was 1, indicating that there was no long-term balance relationship. Therefore, we identified the regions that cause price changes between regions through the Granger causality analysis; Table 5 presents the results of this analysis. On the one hand, the results reveal that jeonse price in the Gangnam area, the core housing market in Korea, is a strong Granger cause of the changes in jeonse prices in Mapo, Eunpyeong, and Seodaemun in the Northwest region. Moreover, jeonse prices in Goyang, Paju, and Gimpo, which are in the Gyeongeui region, were found to be a strong Granger cause of changes in jeonse prices in Gangnam, which is geographically distant. On the other hand, we found that there was no significant Granger causality in other regions regarding the price changes in Gangnam. However, Mapo, which has a relatively high jeonse price because it is located close to the center of Seoul, was the cause of the changes in jeonse price in Gangnam after the 2nd period (Lag 2). These results indicate that the change in jeonse price in Mapo was affected by the price in Gangnam and vice-versa.
Similar to the previous correlation results, the results of the Granger causality analysis reveal that jeonse prices in neighboring cities may have a positive (+) relationship. In other words, Gangnam, which is considered to be the core housing market in Korea, has a significant effect on the jeonse price changes in other housing submarkets (cities) within the same region, and also exerts a considerable influence on the jeonse market in geographically distant outskirts.
Next, Table 6 presents the results of the Granger causality analysis of jeonse prices in the Northwest and Gyeongeui regions’ cities, excluding Gangnam. First, Goyang exhibited a mutual Granger causality with Mapo. Second, the change in jeonse price in Eunpyeong was the Granger cause of the jeonse price change in Goyang from the outset, and Gimpo and Paju showed a Granger causality with Goyang from the outset as well. This result indicates that there was a statistically significant Granger causal relationship for jeonse price in most cities in the Northwest and Gyeongeui regions and in their neighboring cities. However, we found that cities in the Gyeongeui region did not show a significant Granger causality with the jeonse prices of cities in the Northwest region, suggesting that the cities in Seoul maintain a subordinate relationship with those in neighboring Gyeonggi-do.
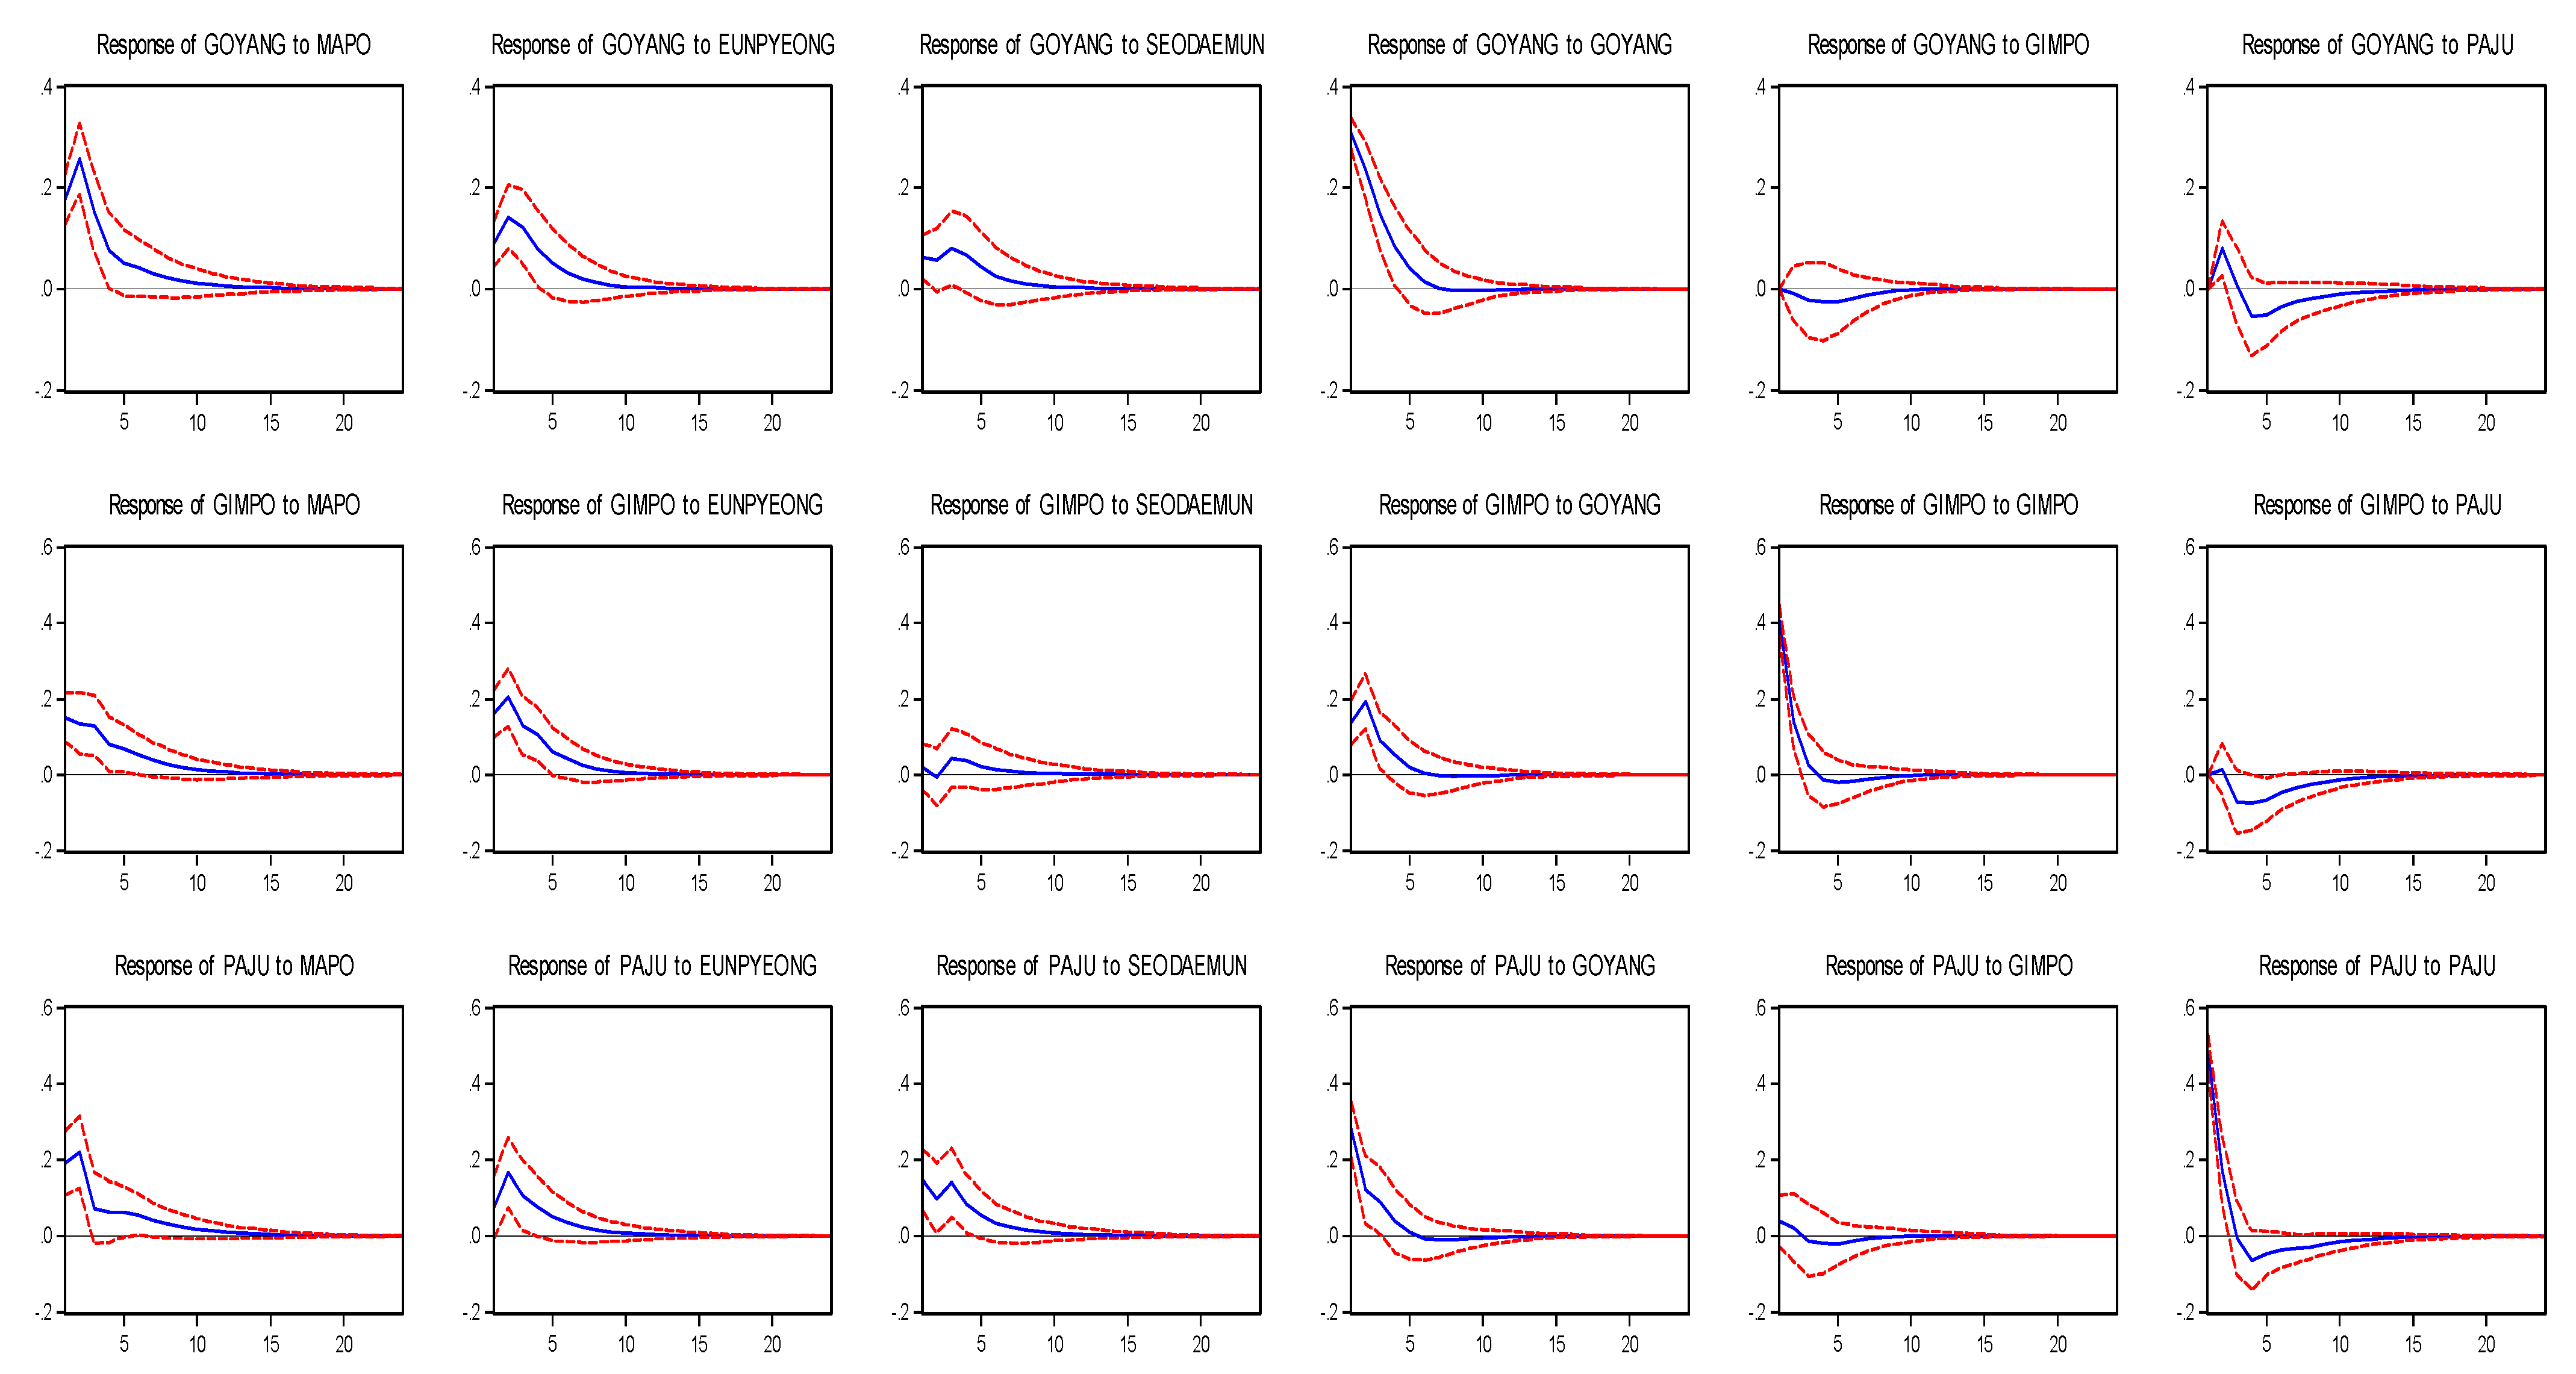
Based on the VAR, we performed the impulse response analysis and variance decomposition analysis. The results of the impulse response analysis reveal that the spillover effect affecting the jeonse price varied for each region and individual city. Specifically, the jeonse price of Mapo was most affected by Mapo itself, and the effect lasted for more than 10 months. Further, Mapo was found to have a short-term effect on price changes in the neighboring cities of Eunpyeong, Seodaemun and Goyang, but had a relatively weak or negative effect on Paju, which is at a distance. Eunpyeong and Seodaemun exhibited a spillover effect with adjacent cities such as Mapo. This indicated that the cities in the Northwest region had a large spillover effect and a differential effect on the neighboring cities in the Gyeongeui region depending on the geographical distance (see Figure 3).
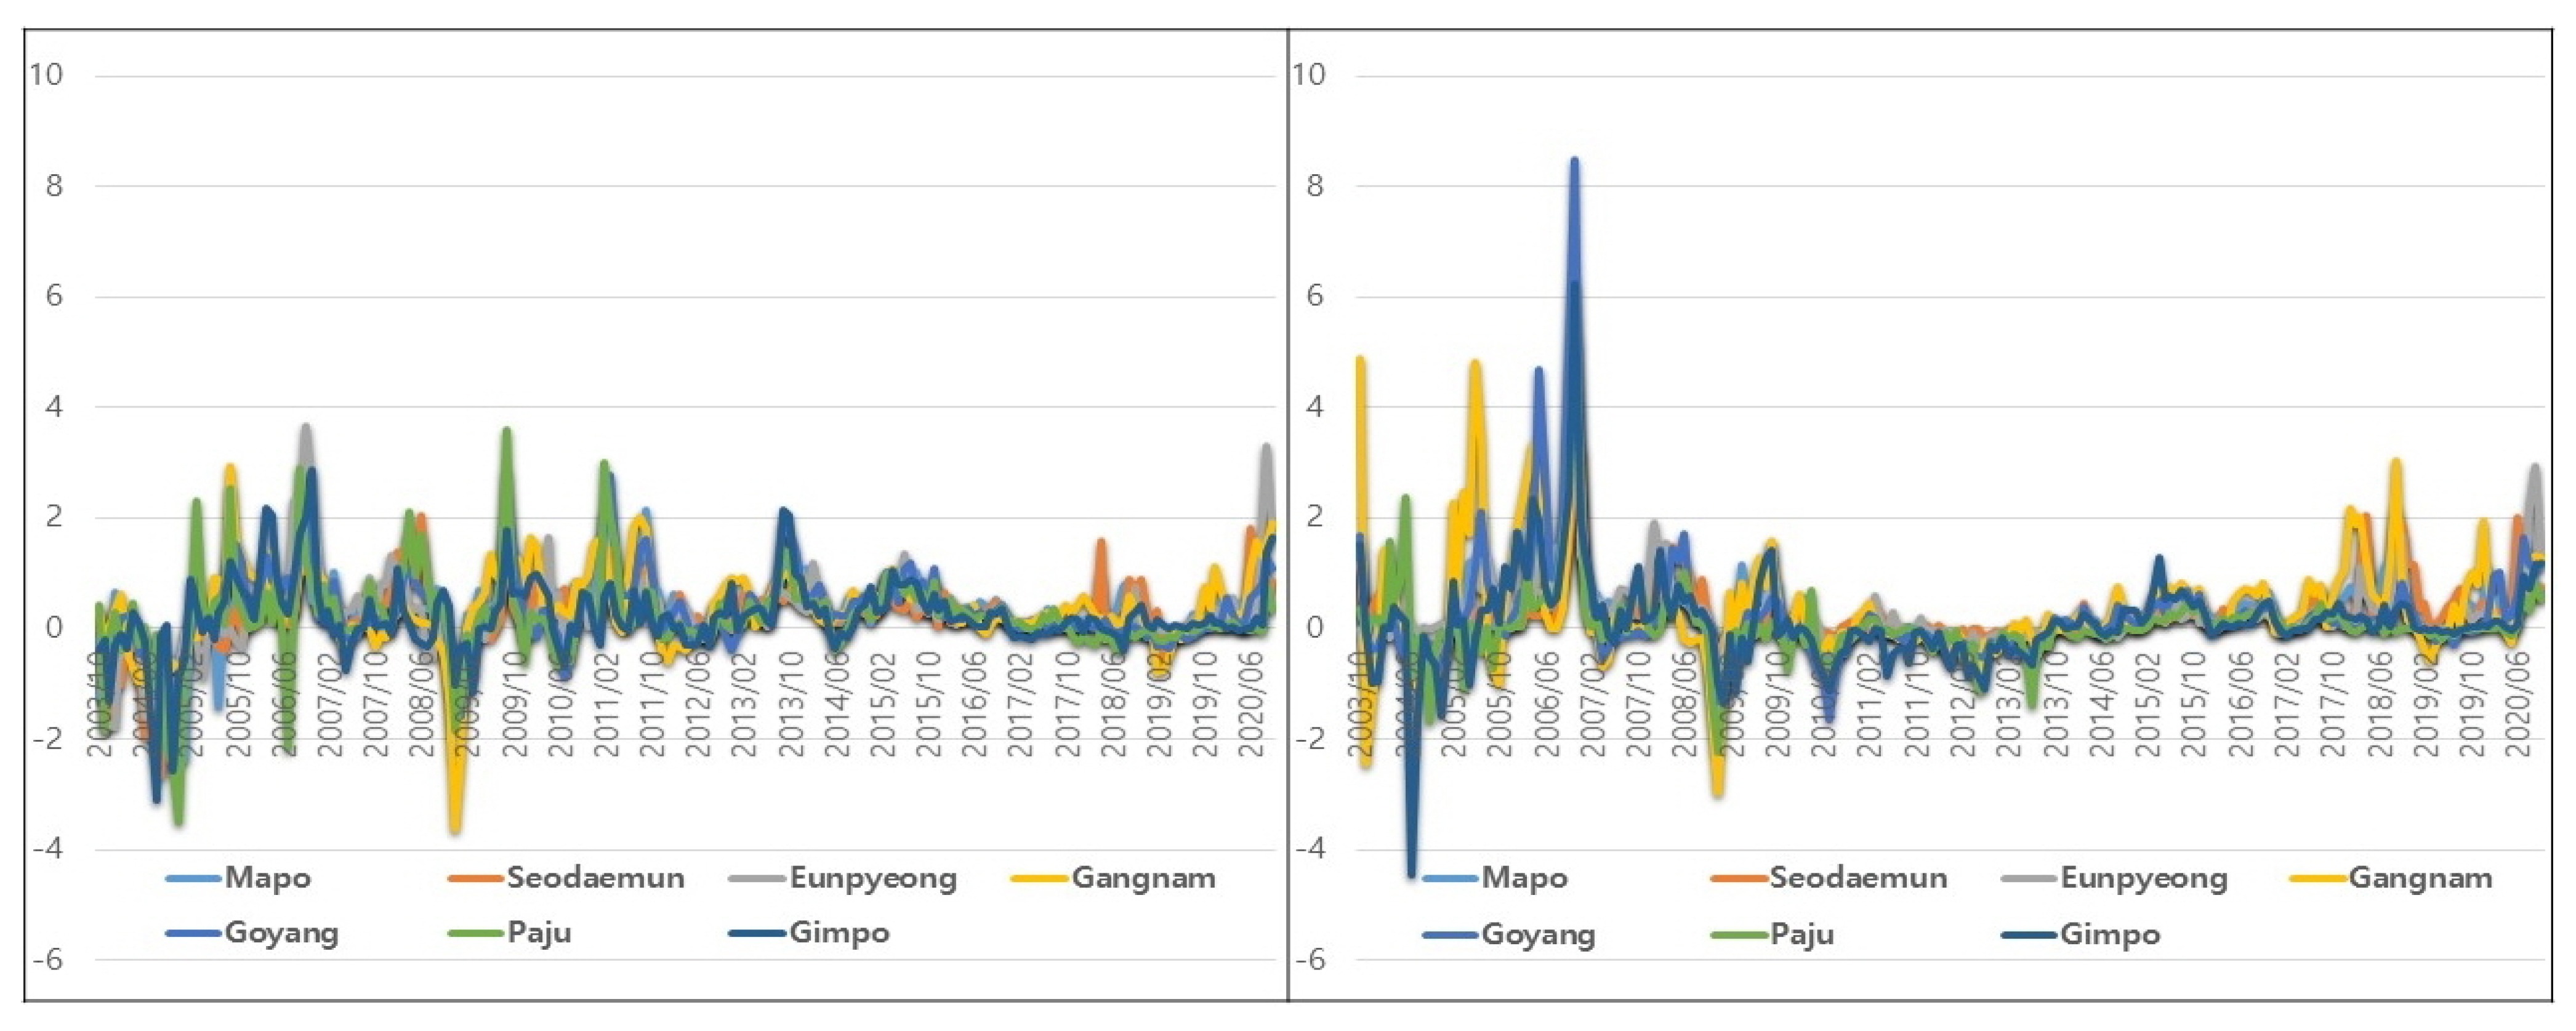
Moreover, individual cities in the Gyeongeui region exhibited their own significant influence on the change in jeonse prices, but the period of this influence was approximately 30% shorter than that of the Northwest region. In addition, unlike the Northwest region, the effect of jeonse price spillover in the cities in the Gyeongeui region was closely related to the cities in the Northwest region, and the price spillover between cities in the Gyeongeui region was relatively low. In the case of Paju, we found that the relationship with other regions was the weakest, which appears to be due to the limitation of the spatial constraint in that Paju is located in the far northwestern part of Korea and has a border to its north, which is not the case for the other cities (See Figure 1 and Figure 4).
The results can be summarized as follows: In the jeonse market, the price spillover between cities in the Northwest region (Seoul) was large, which in turn had a sizeable influence on the neighboring Gyeongeui region (Gyeonggi-do). However, the price spillover in the Gyeongeui region was more closely related to the Northwest region (Seoul) rather than being significant within the region. This suggests that Seoul leads the jeonse market, and that cities in the neighboring Gyeonggi-do may experience notable price changes due to the changes in jeonse prices in Seoul.
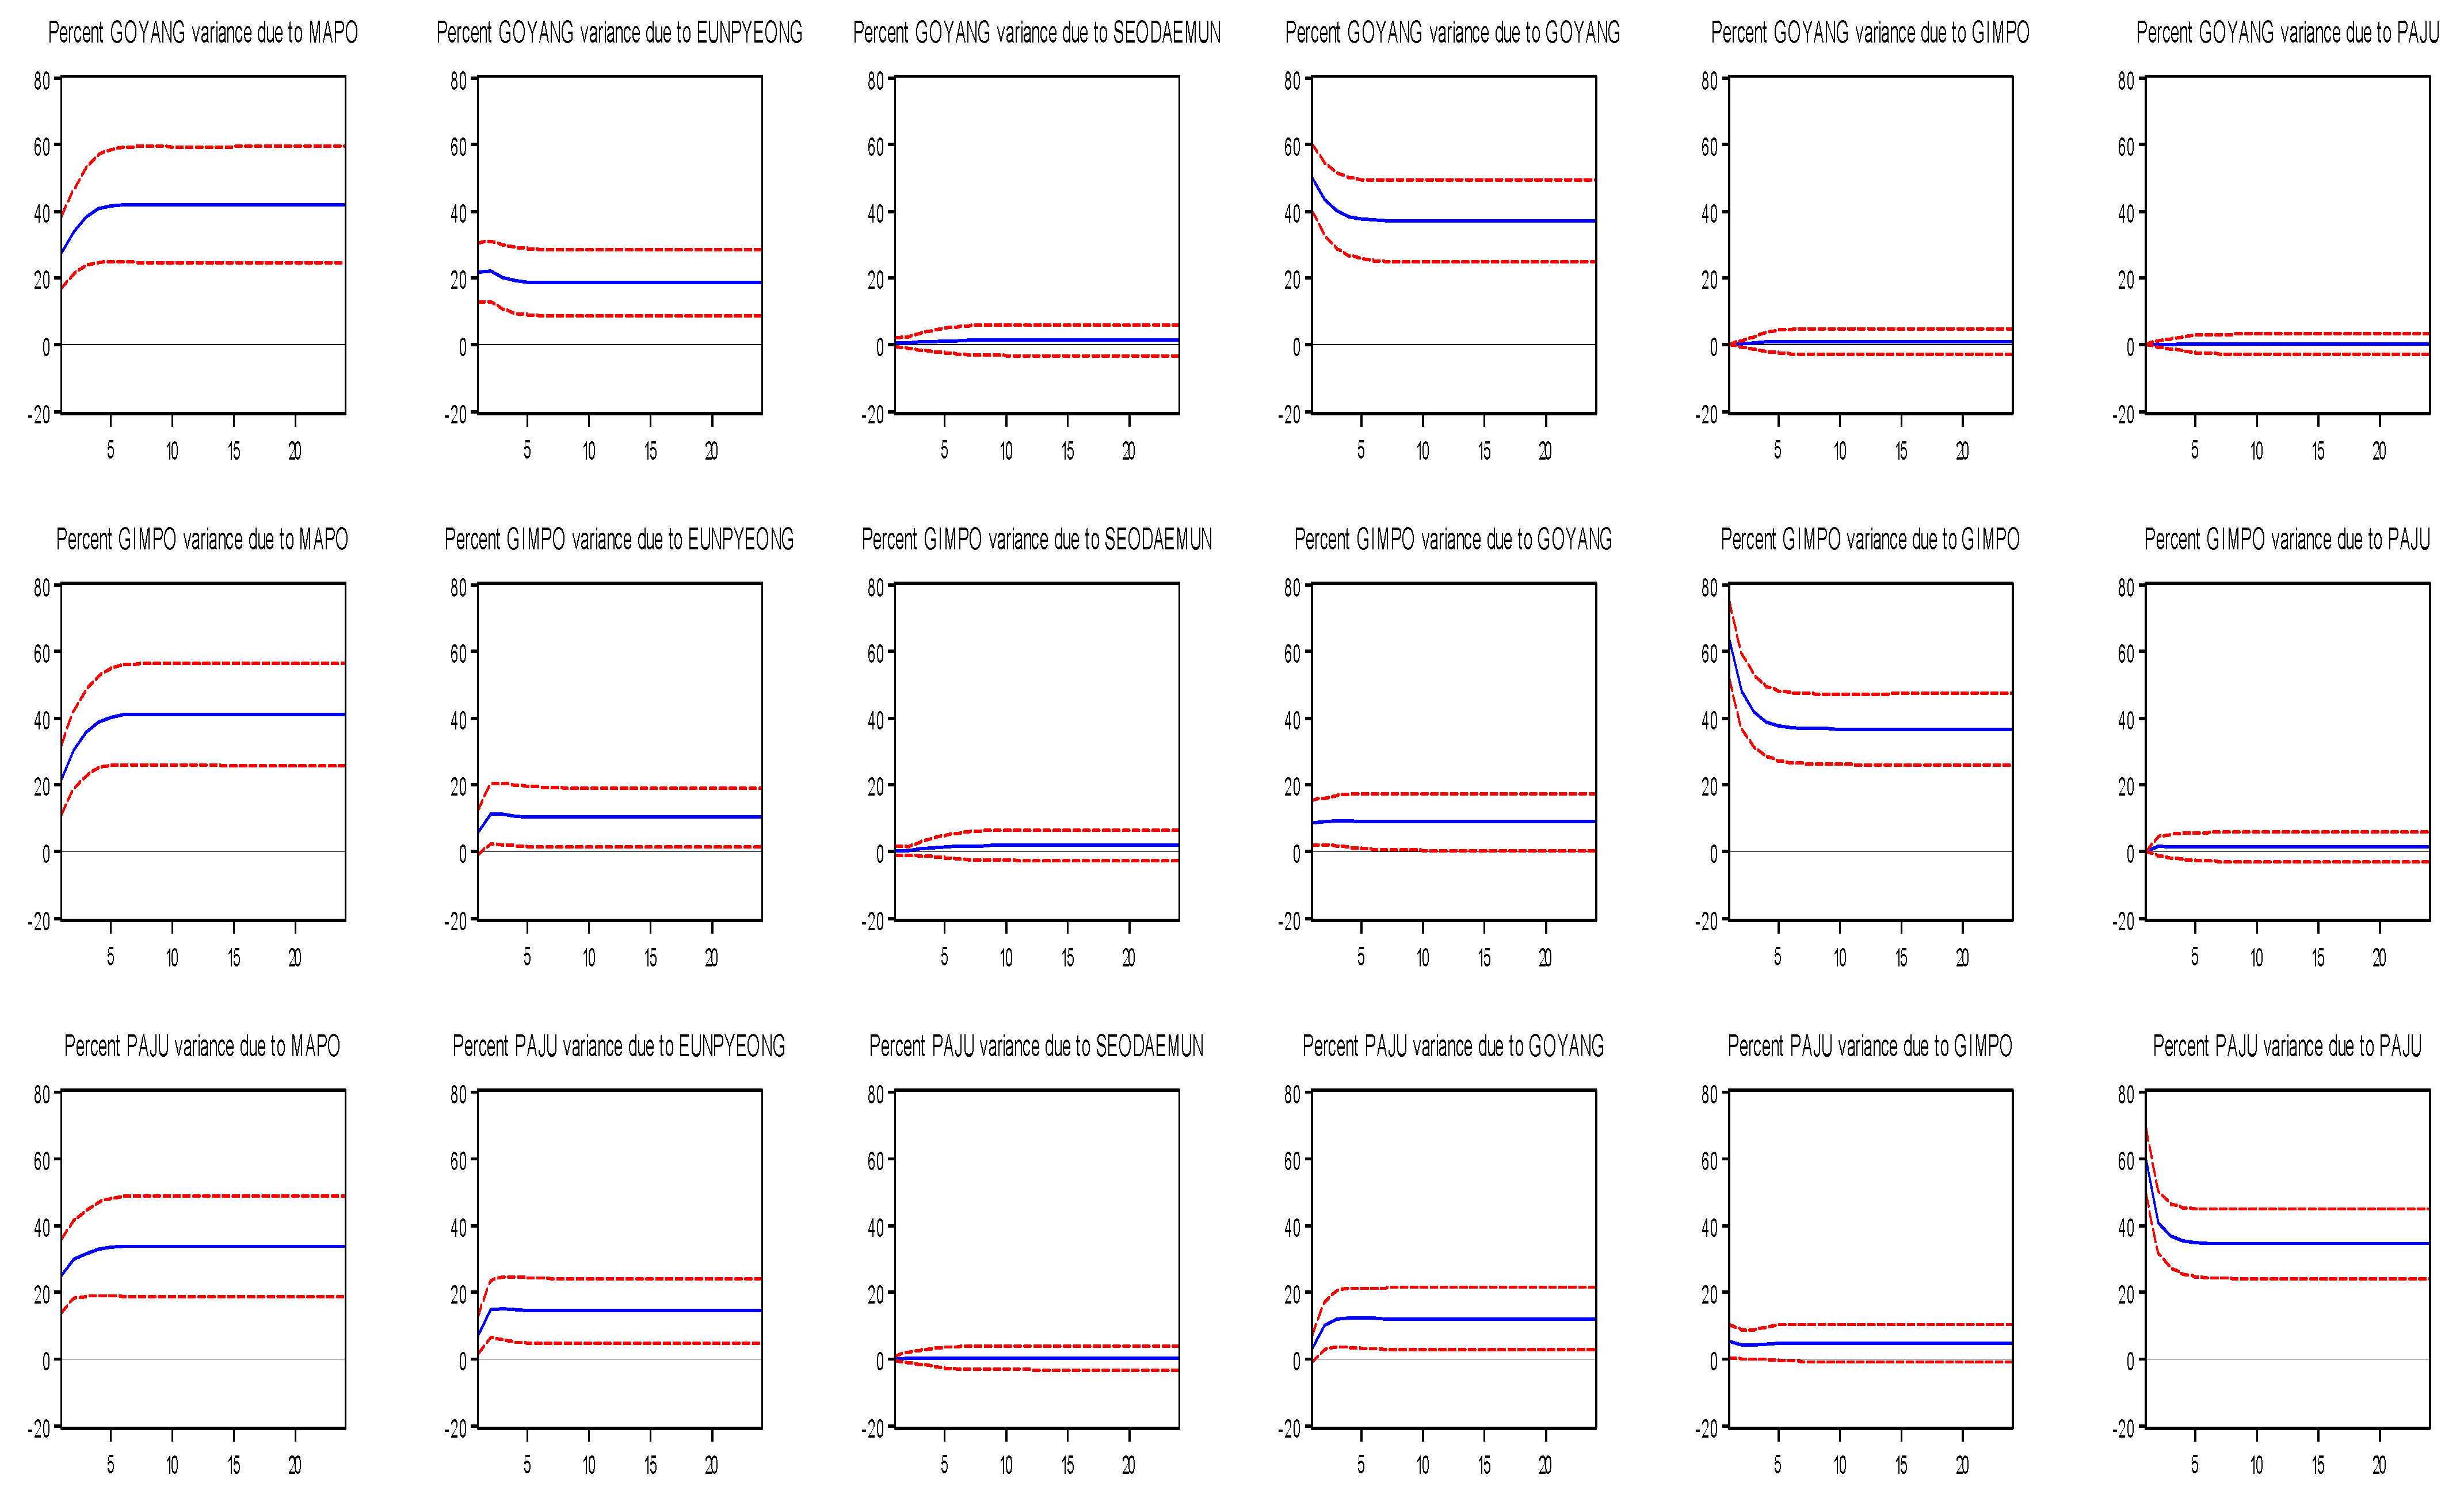
On examining the results of the variance decomposition analysis, which can confirm the contribution of other cities to the change in jeonse price, we found that in the Northwest region, the price changes in individual cities contributed the most to their own price changes. In particular, Mapo in the Northwest region had the highest influence (over 80%) on its own jeonse prices and greatly influenced the jeonse price changes in other cities in the Northwest region. Furthermore, in other cities, their own price changes were found to be an important factor regarding the changes in their own jeonse markets, but the effect was found to be lower than that of Mapo. These results reveal that the highest-priced city (primary city) drove the spillover, causing price changes in other cities (See Figure 5).
In the Gyeongeui region, the influence of Mapo, which has the highest average jeonse price, was found to be higher than that of other cities in the Northwest region. This served to indicate that the price spillover effect from the highest-priced city in the adjacent area may be quite strong. In addition, we found that the change in the jeonse price of Goyang, the highest-priced city in the Gyeongeui region, had the greatest effect on the jeonse market of cities within the same region. This indicated that the primary city in an adjacent region and within the same region has a significant influence on the market price changes of neighboring cities, and the higher the primary city’s average price level, the greater the spillover effect (See Figure 6).

4.2. Spatial Spillover Effect of Housing Sales Price

Like jeonse price, the stability of the time series data was verified using the sales price index and the sales price change rate through the ADF unit root test. In this regard, we found that a unit root exists in the sales price index, so we used the sales price change rate data to investigate the spatial spillover effect of sales price (See Table 7).
The descriptive statistics of the time series data reveal that the housing sales price in Gangnam (Seoul) recorded the steepest drop of −2.97% in December 2008, and other cities in Gyeonggi-do and Seoul recorded the largest decline during this period as well. The prices in Goyang in the Gyeongeui region (Gyeonggi-do) increased by 0.21% per month, which was the highest in the region, and rose by 8.5%, which was the largest increase, in November 2006. The largest decline occurred in July 2010, recording a −1.65% drop. When the rate of increase in sales price in Goyang was at the highest, the prices in the Northwest and Gyeongeui regions rose significantly as well, but they did not reach the rate of increase recorded in Goyang. In Mapo and Eunpyeong (Northwest region), the period with the steepest drop in sales prices was December 2008, which was during the Korean financial crisis, and the period with the largest increase was November 2006 (See Table 8).
Table 9 presents the relationship of sales price changes between regions through correlation analysis. We found that the correlation between inter-regional sales price change rates was higher within the same region. This implies that the spillover effect may be higher in regions with similar housing market characteristics. In addition, the correlation effect between cities within the Gyeongeui region was found to be higher than that of the Northwest region, but the difference was not very significant. These results confirmed that the correlation between Gangnam and other regions was lower than the correlation between the Northwest and Gyeongeui regions.
According to the correlation among individual cities, Eunpyeong (Northwest region) and Goyang (Gyeongeui region) had the highest correlation. Although Eunpyeong and Goyang are associated with Seoul and Gyeonggi-do, respectively, the price correlation was found to be high as they are immediately adjacent. In the case of Mapo, it maintained a high correlation with cities within the same region, such as Eunpyeong and Seodaemun. In addition, Mapo had the highest price correlation with Gangnam. This could indicate that Mapo has certain characteristics such that various patterns of spillover occur between high-priced areas (Gangnam) and lower-priced areas (Eunpyeong, Seodaemun) within the same region. The price spillover between the rest of the cities exhibited a pattern similar to the result of the jeonse price correlation (see Table 10).
The Granger causality analysis was conducted to examine the causal relationship among the sales prices in Gangnam, Gyeongeui region, and the Northwest region. Table 11 presents the results, which indicate that Gangnam was the Granger cause of sales price changes in most cities. Interestingly, the price change in Gangnam shows a significant causal relationship to Paju, which is about 40 km away. This indicates that sales price in Gangnam had a significant impact on the housing market in the Seoul metropolitan area as a whole.
Table 12 presents the results of the Granger causality analysis on the sales price changes in the cities of the Northwest and Gyeongeui regions, excluding Gangnam. We found that the sales price changes in Mapo, Eunpyeong, and Seodaemun in the Northwest region have a mutual Granger causal relationship, for the most part. In particular, Mapo, the highest-priced city in the Northwest region, was identified as a strong Granger cause of change in the sales price of cities in the same region. Additionally, Goyang, the highest-priced city in Gyeongeui region, was found to be a strong Granger cause of sales price change in cities in the same region. This indicates that the primary city can lead the price spillover effect in the housing sales market as well as in the housing jeonse market.
Regarding inter-regional influence, the cities in the Gyeongeui region were greatly impacted by price changes in the adjacent Northwest region, exhibiting a stronger causal relationship to price changes in geographically adjacent regions. Specifically, it was confirmed that the changes in sales price in Mapo affected the changes in sales prices in cities in the same region. Further, the change in sales price in the Northwest region affected the change in sales price in Goyang, which in turn affected changes in sales prices in cities in the same region. This indicates that there is a unilinear (unidirectional) spillover effect among cities and regions depending on the sales price.
The results of the impulse response analysis that was performed to check the impact of change in sales price by city indicated that the spillover between cities’ sales prices exhibited a different pattern from that of the jeonse price. In the Northwest region, the change in sales price in Mapo had a significant effect over the long-term for more than 10 months, but the price impact of cities other than Mapo was relatively shorter (see Figure 7).
According to the previous result, the change in the jeonse price was greatly affected by Goyang in the Gyeongeui region, however, Goyang exerted relatively little influence on the change in sales prices. Moreover, the influence of Eunpyeong in the Northwest region was relatively significant (see Figure 8).
The results of the variance decomposition analysis indicate that the influence of individual cities, especially the primary city, was more pronounced than that of jeonse price regarding the change in sales price. The contributions of Eunpyeong and Seodaemun to the change in the sales price in Mapo in the Northwest region were very low, amounting to less than 2%, and the contributions of cities in the Gyeongeui region were also very low, amounting to less than 1%. Moreover, the contributions of cities to the change in their own sales prices, excluding Mapo, decreased, while the contribution of the primary city (Mapo) to changes in the sales prices in all cities gradually increased.
This indicates that the change in jeonse price has a mutual interaction between neighboring cities, but the sales price is transferred in one direction. In other words, price spillover in the city with the highest sale price (Mapo) affects the neighboring cities (Eunpyeong, Seodaemun), and this effect goes on to affect Goyang, the primary city of the Gyeongeui region that is subordinate to the Northwest region. Further, this effect, in turn, affects other cities in the Gyeongeui region as well. However, the opposite price effect was found to be negligible, indicating that the unilateral spillover of the sales price is very strong compared to that of the jeonse price (see Figure 9 and Figure 10).

5. Discussion and Conclusions

In this study, we empirically analyzed the price spillover effect of the housing sales market and the jeonse market using the Granger causality analysis and the VAR to target individual cities in the Gyeongeui region of Gyeonggi-do and the Northwest region of Seoul, wherein the price spillover of the Korean housing market can be examined in detail because these regions have unique submarket characteristics and form subordinate relationships.
The main findings are fourfold: First, housing prices exhibited a higher spillover effect within the same regions with similar housing market characteristics. Second, the spatial spillover of housing prices varied between jeonse market and sales market. On the one hand, the jeonse price spillover was characterized by mutual influence between neighboring cities, while the sales price was characterized by the influence being transferred in one direction hierarchically. In other words, the changes in sales price in the Gyeongeui and Northwest regions tend to proceed in one direction rather than having a two-way causal relationship, which implies that the price spillover in a specific region has a sequential effect. On the other hand, the change in the jeonse price tends to exhibit a close relationship between adjacent regions with similar housing market characteristics. Third, the effects of changes in price exhibited a slight difference between the sales and jeonse prices. Although jeonse price was mainly affected by a neighboring area (geographic boundary), sales price was more influenced by a specific city, especially cities with high prices. Lastly, the housing price spillover has spread around the city with the highest price.
Therefore, housing price policies targeting specific areas or regions need to be differentiated according to the type of occupancy (jeonse or sales). While the policies for stabilizing jeonse price might be effective across inter-regional interactions, if the sales price stabilization policies fail to address the highest-priced cities, the bubble effect caused by the spatial spillover of prices might intensify across regions.
In addition, given that the housing submarket is a market that can have large externalities, it is essential to consider these externalities when implementing governmental policies. In particular, if the policies are expected to affect the neighboring regions, a careful analysis of the possibility of unexpected externalities must be performed. It can be said that a policy implemented without such analysis cannot achieve its goal, and there is a high possibility of negative effects due to distortion of the housing market.
Currently, the Korean government is promoting price suppression policies for specific areas by designating anti-speculation areas in the Seoul metropolitan area, including the Northwest and Gyeongeui regions. However, this study’s findings indicate a high probability that these policies will not achieve their intended effect. In other words, after designating anti-speculation areas, the price spillover effect might surface in adjacent areas and begin spreading to surrounding areas. In this respect, regulations that do not tackle the root of the problems in areas with high demand are further fueling the price spillover effect. Therefore, it is necessary to promote a supply policy that meets the demand simultaneously with the current regulatory policies. In addition, it is important to proactively identify the comprehensive externalities not only in these areas but also in areas where the spillover effect might surface.
In the case of the jeonse market, the same tenant protection policy currently applies to all areas of the Seoul metropolitan area. However, since not all areas are experiencing problems due to the spillover effect, it is necessary to apply the tenant protection policy focusing only on the areas facing serious problems.
This study has limitations regarding generalizing the study results to all regions of Korea in that it identified the spatial spillover of housing prices only for the Northwest region of Seoul and the Gyeongeui region of Gyeonggi-do. Therefore, future studies must make an effort to derive general results pertaining to the housing price spillover by targeting wider areas. Despite this limitation, the findings of this study provide valuable implications regarding a policy direction for stabilizing housing prices in countries where population and urban functions are concentrated in specific areas, such as Korea. However, it is necessary to review whether the results of this study can be applied to countries where urban functions are dispersed. Therefore, in the future, it is necessary to respond to these limitations by understanding the housing price spillover according to urban form types such as concentration or dispersion of cities.

Author Contributions

Conceptualization, L.K. and W.S.; methodology, L.K. and W.S.; formal analysis, L.K.; investigation, L.K. and W.S.; data curation, L.K.; writing—original draft preparation, L.K. and W.S.; writing—review and editing, W.S.; supervision, W.S. All authors have read and agreed to the published version of the manuscript.

Funding

This research received no external funding.

Institutional Review Board Statement

Not applicable.

Informed Consent Statement

Not applicable.

Data Availability Statement

Not applicable.

Conflicts of Interest

The authors declare no conflict of interest.

References

  1. Ha, S. Housing Policy; Parkyoungsa: Seoul, Korea, 2011. [Google Scholar]
  2. Palm, R. Spatial segmentation of the urban housing market. Econ. Geogr. 1978, 54, 201–221. [Google Scholar] [CrossRef]
  3. Wu, C.; Sharma, R. Housing submarket classification: The role of spatial contiguity. Appl. Geogr. 2012, 32, 746–756. [Google Scholar] [CrossRef]
  4. Bourassa, S.C.; Hoelsi, M.; Peng, V.S. Do housing submarkets really matter? J. Hous. Econ. 2003, 12, 12–28. [Google Scholar] [CrossRef] [Green Version]
  5. Goodman, A.C.; Thibodeau, T.G. Housing market segmentation and hedonic prediction accuracy. J. Hous. Econ. 2003, 12, 181–201. [Google Scholar] [CrossRef] [Green Version]
  6. Chung, K.-S.; Lee, S.-Y. The concrete procedure of housing submarket distinction with and without heteroskedasticity. Korean J. Policy Anal. Eval. 2004, 3, 219–241. [Google Scholar]
  7. Jang, H.; Song, Y.; Ahn, K. Can government stabilize the housing market? The evidence from South Korea. Phys. A Stat. Mech. Its Appl. 2020, 550, 124114. [Google Scholar] [CrossRef]
  8. Lee, H. A study on the characteristics of new towns and the redevelopment of project-canceled areas: A case study of Seoul, South Korea. Sustainability 2019, 11, 5733. [Google Scholar] [CrossRef] [Green Version]
  9. Seo, W.; Nam, H.K. Trade-off relationship between public transportation accessibility and household economy: Analysis of subway access values by housing size. Cities 2019, 87, 247–258. [Google Scholar] [CrossRef]
  10. Lee, H.S.; Lee, W.S. Cross-regional connectedness in the Korean housing market. J. Hous. Econ. 2019, 46, 101654. [Google Scholar] [CrossRef]
  11. Seo, W.; Kim, L. Investigating the ripple effect through the relationship between housing markets and residential migration in Seoul, South Korea. Sustainability 2020, 12, 1225. [Google Scholar] [CrossRef] [Green Version]
  12. Ambrose, B.; Kim, S. Modeling the Korean chonsei lease contract. Real Estate Econ. 2003, 31, 53–74. [Google Scholar] [CrossRef]
  13. Yoon, J. Structural changes in South Korea’s rental housing market: The rise and fall of the Jeonse system. J. Comp. Asian Dev. 2003, 2, 151–168. [Google Scholar] [CrossRef]
  14. Yoon, S. Neighborhood effects of housing program using Jeonse in Korea. Int. J. Hous. Mark. Anal. 2020, 14, 305–316. [Google Scholar] [CrossRef]
  15. Chung, D.; Ji, I.Y. Effects of policy shocks on housing prices: Evidence from South Korea. J. Soc. Sci. 2020, 27, 7–32. [Google Scholar] [CrossRef]
  16. Brzezicka, J. Towards a typology of housing price bubbles: A literature review. Hous. Theory Soc. 2020, 38, 320–342. [Google Scholar] [CrossRef]
  17. Oust, A.; Hrafnkelsson, K. What is a housing bubble? Econ. Bull. 2017, 37, 806–836. [Google Scholar]
  18. Blake, J.; Gharleghi, B. The ripple effect at an inter-suburban level in the Sydney metropolitan area. Int. J. Hous. Mark. Anal. 2018, 11, 2–33. [Google Scholar] [CrossRef]
  19. Meen, G. Regional house prices and the ripple effect: A new interpretation. Hous. Stud. 1999, 14, 733–753. [Google Scholar] [CrossRef]
  20. Munro, M.; Mclennan, D. Intra-urban changes in house prices: Glasgow 1972–83. Hous. Stud. 1987, 2, 65–81. [Google Scholar] [CrossRef]
  21. Wilson, P.; White, M.; Dunse, N.; Cheong, C.; Zurbruegg, R. Modelling price movements in housing micro market: Identifying long-term components in local housing market dynamics. Urban Stud. 2011, 48, 1853–1874. [Google Scholar] [CrossRef]
  22. Shi, S.; Young, M.; Hargreaves, B. The ripple effect of local housing price movements in New Zealand. J. Prop. Res. 2009, 26, 1–24. [Google Scholar] [CrossRef]
  23. Tiwari, P.; Turner, B. Intra-metropolitan house price movements: An analysis of Stockholm 1981–1993. Stud. Reg. Sci. 2000, 30, 27–58. [Google Scholar] [CrossRef] [Green Version]
  24. Jun, H. Spillover effects in neighborhood housing value change: A spatial analysis. Hous. Stud. 2020. [Google Scholar] [CrossRef]
  25. Lan, F.; Jiao, C.; Deng, G.; Da, H. Urban agglomeration, housing price, and space-time spillover effect: Empirical evidences based on data from hundreds of cities in China. Manag. Decis. Econ. 2021, 42, 898–919. [Google Scholar] [CrossRef]
  26. Shih, Y.; Li, H.; Qin, B. Housing price bubbles and inter-provincial spillover: Evidence from China. Habit Int. 2014, 43, 142–151. [Google Scholar] [CrossRef]
  27. Tsai, I.; Chiang, S. Exuberance and spillovers in housing markets: Evidence from first- and second-tier cities in China. Reg. Sci. Urban Econ. 2019, 77, 75–86. [Google Scholar] [CrossRef]
  28. Tomal, M. Spillovers across house price convergence clubs: Evidence from the polish housing market. Real Estate Manag. Valuat. 2020, 28, 13–20. [Google Scholar] [CrossRef]
  29. Zhang, D.; Fan, G. Regional spillover and rising connectedness in China’s urban housing prices. Reg. Stud. 2019, 53, 861–873. [Google Scholar] [CrossRef]
  30. Cooper, C.; Orford, S.; Webster, C.; Jones, C.B. Exploring the ripple effect and spatial volatility in house prices in England and Wales: Regressing interaction domain cross-correlations against reactive statistics. Environ. Plan. B Urban Anal. City Sci. 2013, 40, 763–782. [Google Scholar] [CrossRef]
  31. Tsai, I. Ripple effect in house prices and trading volume in the UK housing market: New viewpoint and evidence. Econ. Model. 2014, 40, 68–75. [Google Scholar] [CrossRef]
  32. Chiang, S. Housing markets in China and policy implications: Comovement or ripple effect. China World Econ. 2014, 22, 103–120. [Google Scholar] [CrossRef]
  33. Pollakowski, H.O.; Ray, T.S. Housing price diffusion patterns at different aggregation level: An examination of housing market efficiency. J. Hous. Res. 1997, 8, 107–124. [Google Scholar]
  34. Giussani, B.; Hadjimatheou, G. Modeling regional house prices in the United Kingdom. Pap. Reg. Sci. 1991, 70, 201–219. [Google Scholar] [CrossRef]
  35. Tsai, I. Spillover effect between the regional and the national housing markets in the UK. Reg. Stud. 2015, 49, 1957–1976. [Google Scholar] [CrossRef]
  36. Choi, C. A study on the volatility of housing price in Seoul. World J. Account. Financ. Eng. 2019, 3, 1–6. [Google Scholar] [CrossRef]
  37. Choi, H.; Yim, B. An empirical study on the influence between the housing price and the rental price of Gangnam apartment. Daehan J. Bus. 2011, 24, 3707–3722. [Google Scholar]
  38. Jeon, H.; Hyung, N. Spillover effects in the housing market: Shocks originating from Gangnam. Hous. Stud. Rev. 2018, 26, 63–88. [Google Scholar] [CrossRef] [Green Version]
  39. Suh, S. An empirical study on the existence and the cause of ripple effect: The case of Kangnam-gu. Seoul Stud. 2007, 8, 1–13. [Google Scholar]
  40. Kim, J. A study of the relationship between housing markets. J. Korean Reg. Dev. Assoc. 2017, 30, 161–177. [Google Scholar]
  41. Park, Y.; Kim, K. Housing price co-movements and volatility spillovers in Seoul metropolitan area. Korea Real Estate Acad. Rev. 2017, 69, 131–145. [Google Scholar]
  42. Jin, C.; Lee, G. Exploring spatiotemporal dynamics in a housing market using the spatial vector autoregressive Lasso: A case study of Seoul, Korea. Trans. GIS 2020, 24, 27–43. [Google Scholar] [CrossRef]
  43. Al-Yahyaee, K.H.; Mensi, W.; Ko, H.; Caporin, M.; Kang, S.H. Is the Korean housing market following Gangnam style? Empir. Econ. 2020. [Google Scholar] [CrossRef]
  44. Diebold, F.X.; Yilmaz, K. Measuring financial asset return and volatility spillovers, with application to global equity markets. Econ. J. 2009, 119, 158–171. [Google Scholar] [CrossRef] [Green Version]
  45. Yang, J.; Yu, Z.; Deng, Y. Housing price spillovers in China: A high-dimensional generalized VAR approach. Reg. Sci. Urban Econ. 2018, 68, 98–114. [Google Scholar] [CrossRef]
  46. Oikarinen, E. The diffusion of housing price movements from center to surrounding areas. J. Hous. Res. 2004, 15, 3–28. [Google Scholar] [CrossRef]
  47. Kuethe, T.H.; Pede, V.O. Regional housing price cycles: A spatio-temporal analysis using US state-level data. Reg. Stud. 2011, 45, 563–574. [Google Scholar] [CrossRef] [Green Version]
Figure 1. Research area.
Land 10 00879 g001
Figure 2. Trends in jeonse price (left) and sales price (right) in the study area.
Land 10 00879 g002
Figure 3. Impulse response analysis of the jeonse market in the Northwest region.
Land 10 00879 g003
Figure 4. Impulse response analysis of the jeonse market in the Gyeongeui region.
Land 10 00879 g004
Figure 5. Variance decomposition analysis of the jeonse market in the Northwest region.
Land 10 00879 g005
Figure 6. Variance decomposition analysis of the jeonse market in the Gyeongeui region.
Land 10 00879 g006
Figure 7. Impulse response analysis of the sales market in the Northwest region.
Land 10 00879 g007
Figure 8. Impulse response analysis of the sales market in the Gyeongeui region.
Land 10 00879 g008
Figure 9. Variance decomposition analysis of the housing sales markets in the Northwest region.
Land 10 00879 g009
Figure 10. Variance decomposition analysis of the housing sales markets in the Gyeongeui region.
Land 10 00879 g010
Table 1. ADF test result of jeonse price.
ClassificationSignificance Level (p)
Jeonse Price IndexJeonse Price Change Rate
Northwest region
(Seoul)
Mapo0.9990.000
Eunpyeong0.9960.000
Seodaemun0.9980.000
Gyeongeui region
(Gyeonggi-do)
Goyang0.9570.000
Gimpo0.9670.000
Paju0.9210.000
Gangnam (Seoul)0.9950.0001
Table 2. Descriptive statistics of jeonse price change rate.
ClassificationMeanMedianMaximumMinimum
Northwest regionMapo0.2980.3152.159−2.365
Eunpyeong0.2630.2083.653−2.370
Seodaemun0.2140.2162.060−2.681
Gyeongeui regionGoyang0.3040.2202.833−1.596
Gimpo0.2180.1062.882−3.097
Paju0.2010.1243.586−3.486
Gangnam0.3490.3022.926−3.648
Table 3. Correlation analysis of jeonse price between regions.
Northwest RegionGyeongeui RegionGangnam
Northwest region0.6460.5940.585
Gyeongeui region0.5940.6570.566
Gangnam0.5950.566-
Table 4. Correlation analysis of jeonse price between individual cities.
ClassificationNorthwest RegionGyeongeui RegionGangnam
MapoEunpyeongSeodaemunGoyangGimpoPaju
Northwest regionMapo-0.6240.6900.7160.5660.5690.654
Eunpyeong0.624-0.6230.6240.6260.4710.555
Seodaemun0.6900.623-0.6460.5310.5970.546
Gyeongeui regionGoyang0.7160.6240.646 0.6930.7390.642
Gimpo0.5660.6260.5310.693 0.5380.568
Paju0.5690.4710.5970.7390.538-0.487
Gangnam0.6540.5550.5460.6420.5680.487-
Table 5. Granger causality analysis of jeonse prices in Gangnam, Northwest region, and Gyeongeui region.
HypothesesLag 1Lag 2Lag 3Lag 4
F-StatisticProb.F-StatisticProb.F-StatisticProb.F-StatisticProb.
Mapo→Gangnam0.0060.9385.5640.0054.5310.0044.6840.001
Gangnam→Mapo26.3350.00013.7460.00010.1820.0007.2090.000
Seodaemun→Gangnam0.1210.7280.1100.8960.3310.8030.6990.594
Gangnam→Seodaemun20.4760.00012.5900.0008.6920.0007.1010.000
Eunpyeong→Gangnam2.1760.1421.9630.1431.4900.2193.2690.013
Gangnam→Eunpyeong9.5580.0024.7260.0103.4490.0183.1640.015
Goyang→Gangnam0.5210.4710.2440.7840.7960.4971.2410.295
Gangnam→Goyang25.9920.00014.8080.0009.4370.0007.0190.000
Gimpo→Gangnam0.0140.9050.1460.8640.4650.7073.7360.006
Gangnam→Gimpo19.0500.00010.5610.0008.1780.0006.3950.000
Paju→Gangnam1.8020.1810.9220.3990.5690.6361.4660.214
Gangnam→Paju11.1480.0018.1240.0005.4290.0014.1220.003
Table 6. Granger causality analysis of jeonse prices in Northwest and Gyeongeui regions.
HypothesesLag 1Lag 2Lag 3Lag 4
F-StatisticProb.F-StatisticProb.F-StatisticProb.F-StatisticProb.
Mapo→Goyang13.4740.0008.4700.0005.5040.0014.5180.002
Goyang→Mapo6.5410.0114.0600.0192.7170.0462.5530.040
Eunpyeong→Goyang10.0870.0026.4330.0024.6000.0043.4970.009
Goyang→Eunpyeong2.5550.1122.3840.0951.6810.1721.5760.182
Seodaemun→Goyang1.5000.2221.6820.1891.0280.3810.7680.548
Goyang→Seodaemun6.6930.0107.9910.0015.0420.0024.0940.003
Gimpo→Goyang0.6530.4200.8380.4341.0350.3780.6100.656
Goyang→Gimpo14.9500.0009.9040.0006.2520.0006.0380.000
Paju→Goyang8.2910.0048.1300.0006.4710.0005.7860.000
Goyang→Paju5.0340.0263.3440.0372.7430.0442.3390.057
Eunpyeong→Mapo14.0930.0008.1520.0005.9280.0014.1740.003
Mapo→Eunpyeong15.9730.0005.1390.0073.1250.0272.1380.078
Seodaemun→Mapo13.9260.0007.8320.0016.5280.0004.9790.001
Mapo→Seodaemun20.3560.0006.9000.0014.7570.0033.7830.006
Gimpo→Mapo4.7120.0312.2600.1071.8810.1342.4280.049
Mapo→Gimpo5.4930.0203.6010.0291.5250.2091.3300.260
Paju→Mapo6.7580.0109.1740.0005.6690.0013.0160.019
Mapo→Paju14.9980.0006.7390.0026.7940.0005.0930.001
Seodaemun→Eunpyeong2.0330.1550.4370.6460.6750.5680.5080.730
Eunpyeong→Seodaemun35.8340.00021.0140.00012.2660.0009.2200.000
Gimpo→Eunpyeong0.2100.6471.5110.2232.6090.0532.1780.073
Eunpyeong→Gimpo23.7910.00012.2660.0007.1950.0007.4570.000
Paju→Eunpyeong0.2000.6551.3560.2600.8410.4730.7210.579
Eunpyeong→Paju16.7620.0008.5460.0006.7220.0005.8810.000
Gimpo→Seodaemun9.9210.0027.4030.0015.9580.0015.7880.000
Seodaemun→Gimpo3.3520.0692.7540.0661.6190.1861.5460.191
Paju→Seodaemun1.6600.1995.6230.0043.6490.0142.7670.029
Seodaemun→Paju8.7720.0035.9890.0035.1640.0023.7320.006
Paju→Gimpo6.0890.0145.2210.0063.0840.0292.2210.068
Gimpo→Paju5.7530.0172.8540.0601.7910.1502.0680.087
Table 7. ADF test result of sales price.
ClassificationSignificance Level (p)
Sales Price IndexSales Price Change Rate
Northwest region
(Seoul)
Mapo0.9960.000
Eunpyeong0.9070.000
Seodaemun1.0000.000
Gyeongeui region
(Gyeonggi-do)
Goyang0.4440.000
Gimpo0.7260.000
Paju0.2810.000
Gangnam (Seoul)0.9970.000
Table 8. Descriptive statistics of sales price change rate.
ClassificationMeanMedianMaximumMinimum
Northwest regionMapo0.27670.19734.1046−1.7060
Eunpyeong0.28930.12045.2740−1.0828
Seodaemun0.26610.15523.2470−1.0749
Gyeongeui regionGoyang0.21330.05758.4711−1.6471
Gimpo0.12300.04416.2333−4.4693
Paju0.06050.00005.6233−2.2635
Gangnam0.35080.13955.1497−2.9666
Table 9. Correlation analysis of sales price between regions.
Northwest Region Gyeongeui RegionGangnam
Northwest region-0.6560.572
Gyeongeui region0.656-0.551
Gangnam0.5720.551-
Table 10. Correlation analysis of sales price between individual cities.
ClassificationNorthwest Region Gyeongeui RegionGangnam
MapoEunpyeongSeodaemunGoyangGimpoPaju
Northwest regionMapo-0.7330.7420.7440.7030.6700.738
Eunpyeong0.733-0.6080.7810.6710.6580.513
Seodaemun0.7420.608-0.5750.5490.5540.466
Gyeongeui regionGoyang0.7440.7810.575-0.7560.7310.604
Gimpo0.7030.6710.5490.756-0.6780.583
Paju0.6700.6580.5540.7310.678-0.465
Gangnam0.7380.5130.4660.6040.5830.465-
Table 11. Granger causality analysis of sales prices in Gangnam, Northwest region, and Gyeongeui region.
HypothesesLag 1Lag 2Lag 3Lag 4
F-StatisticProb.F-StatisticProb.F-StatisticProb.F-StatisticProb.
Mapo→Gangnam2.0370.1551.3590.2590.5220.6680.3510.843
Gangnam→Mapo3.7890.05313.4740.0008.3810.0005.6410.000
Eunpyeong→Gangnam3.7690.0543.0470.0503.1510.0262.6850.033
Gangnam→Eunpyeong0.9830.3232.1730.1172.4420.0663.2510.013
Seodaemun→Gangnam0.3100.5781.2640.2850.5790.6290.6200.648
Gangnam→Seodaemun3.7160.0554.6930.0104.5800.0043.6890.006
Goyang→Gangnam0.1420.7071.1550.3170.6760.5680.7000.593
Gangnam→Goyang3.2420.0732.3720.0962.1540.0951.9390.106
Gimpo→Gangnam0.0420.8380.4780.6211.1400.3340.7700.546
Gangnam→Gimpo4.2030.0423.7860.0242.9520.0342.1180.080
Paju→Gangnam2.4830.1173.5960.0292.0280.1111.7280.145
Gangnam→Paju2.9760.0863.4310.0344.5530.0044.4760.002
Table 12. Granger causality analysis of sales price in Northwest region and Gyeongeui region.
HypothesesLag 1Lag 2Lag 3Lag 4
F-StatisticProb.F-StatisticProb.F-StatisticProb.F-StatisticProb.
Eunpyeong→Mapo 9.4840.0024.7060.0102.8430.0392.2210.068
Mapo→Eunpyeong 4.8860.0284.5270.0123.0410.0302.2370.067
Seodaemun→Mapo0.3940.5316.5670.0024.1610.0072.9240.022
Mapo→Seodaemun 26.5260.00014.5820.00010.4620.0008.5260.000
Goyang→Mapo 7.5670.0079.1320.0005.9610.0015.8700.000
Mapo→Goyang 1.5780.2112.4700.0871.5380.2064.2380.003
Gimpo→Mapo 2.8940.0912.1040.1251.4140.2401.8170.127
Mapo→Gimpo 14.6630.0007.5660.0014.7760.0034.5390.002
Paju→Mapo 1.6960.1942.0570.1311.8900.1331.2680.284
Mapo→Paju 5.6750.0184.0800.0183.3050.0212.5080.043
Seodaemun→Eunpyeong 0.0010.9780.1050.9000.9060.4390.5340.711
Eunpyeong→Seodaemun41.1750.00022.6580.00016.1160.00012.4930.000
Goyang→Eunpyeong 2.7510.0992.8790.0592.9700.0335.1900.001
Eunpyeong→Goyang 3.1970.0751.1690.3131.7590.1564.1910.003
Gimpo→Eunpyeong 0.4430.5070.8620.4240.6300.5961.7830.134
Eunpyeong→Gimpo 23.5940.00011.4540.0007.6110.0005.9930.000
Paju→Eunpyeong 0.0550.8140.2820.7540.3940.7570.1660.955
Eunpyeong→Paju16.6610.00011.2370.0007.8500.0007.1140.000
Goyang→Seodaemun 25.6030.00022.3920.00016.4460.00012.4690.000
Seodaemun→Goyang 0.0740.7850.7380.4792.1730.0932.5320.042
Gimpo→Seodaemun 21.9400.00012.1410.0008.6040.0006.9560.000
Seodaemun→Gimpo 3.0300.0832.2190.1121.1480.3311.3710.246
Paju→Seodaemun17.4150.00010.4690.0007.4210.0005.7000.000
Seodaemun→Paju 4.0440.0463.0880.0483.2410.0232.1670.074
Gimpo→Goyang 0.5530.4581.0930.3370.5520.6470.3680.831
Goyang→Gimpo 16.8730.0008.9250.0005.7810.0014.6810.001
Paju→Goyang 0.0000.9890.7340.4821.6740.1742.1380.078
Goyang→Paju 25.5630.00019.5860.00014.2070.00013.7440.000
Paju→Gimpo 0.4050.5250.3390.7130.1800.9102.6570.034
Gimpo→Paju 7.0010.0094.2340.0162.7820.0423.4350.010
Publisher’s Note: MDPI stays neutral with regard to jurisdictional claims in published maps and institutional affiliations.

