
Combining Co$ting Nature and Suitability Modeling to Identify High Flood Risk Areas in Need of Nature-Based Services


Abstract
:1. Introduction
2. Literature Review
2.1. Applications of Co$ting Nature
2.2. Gaps in the Literature
3. Methods
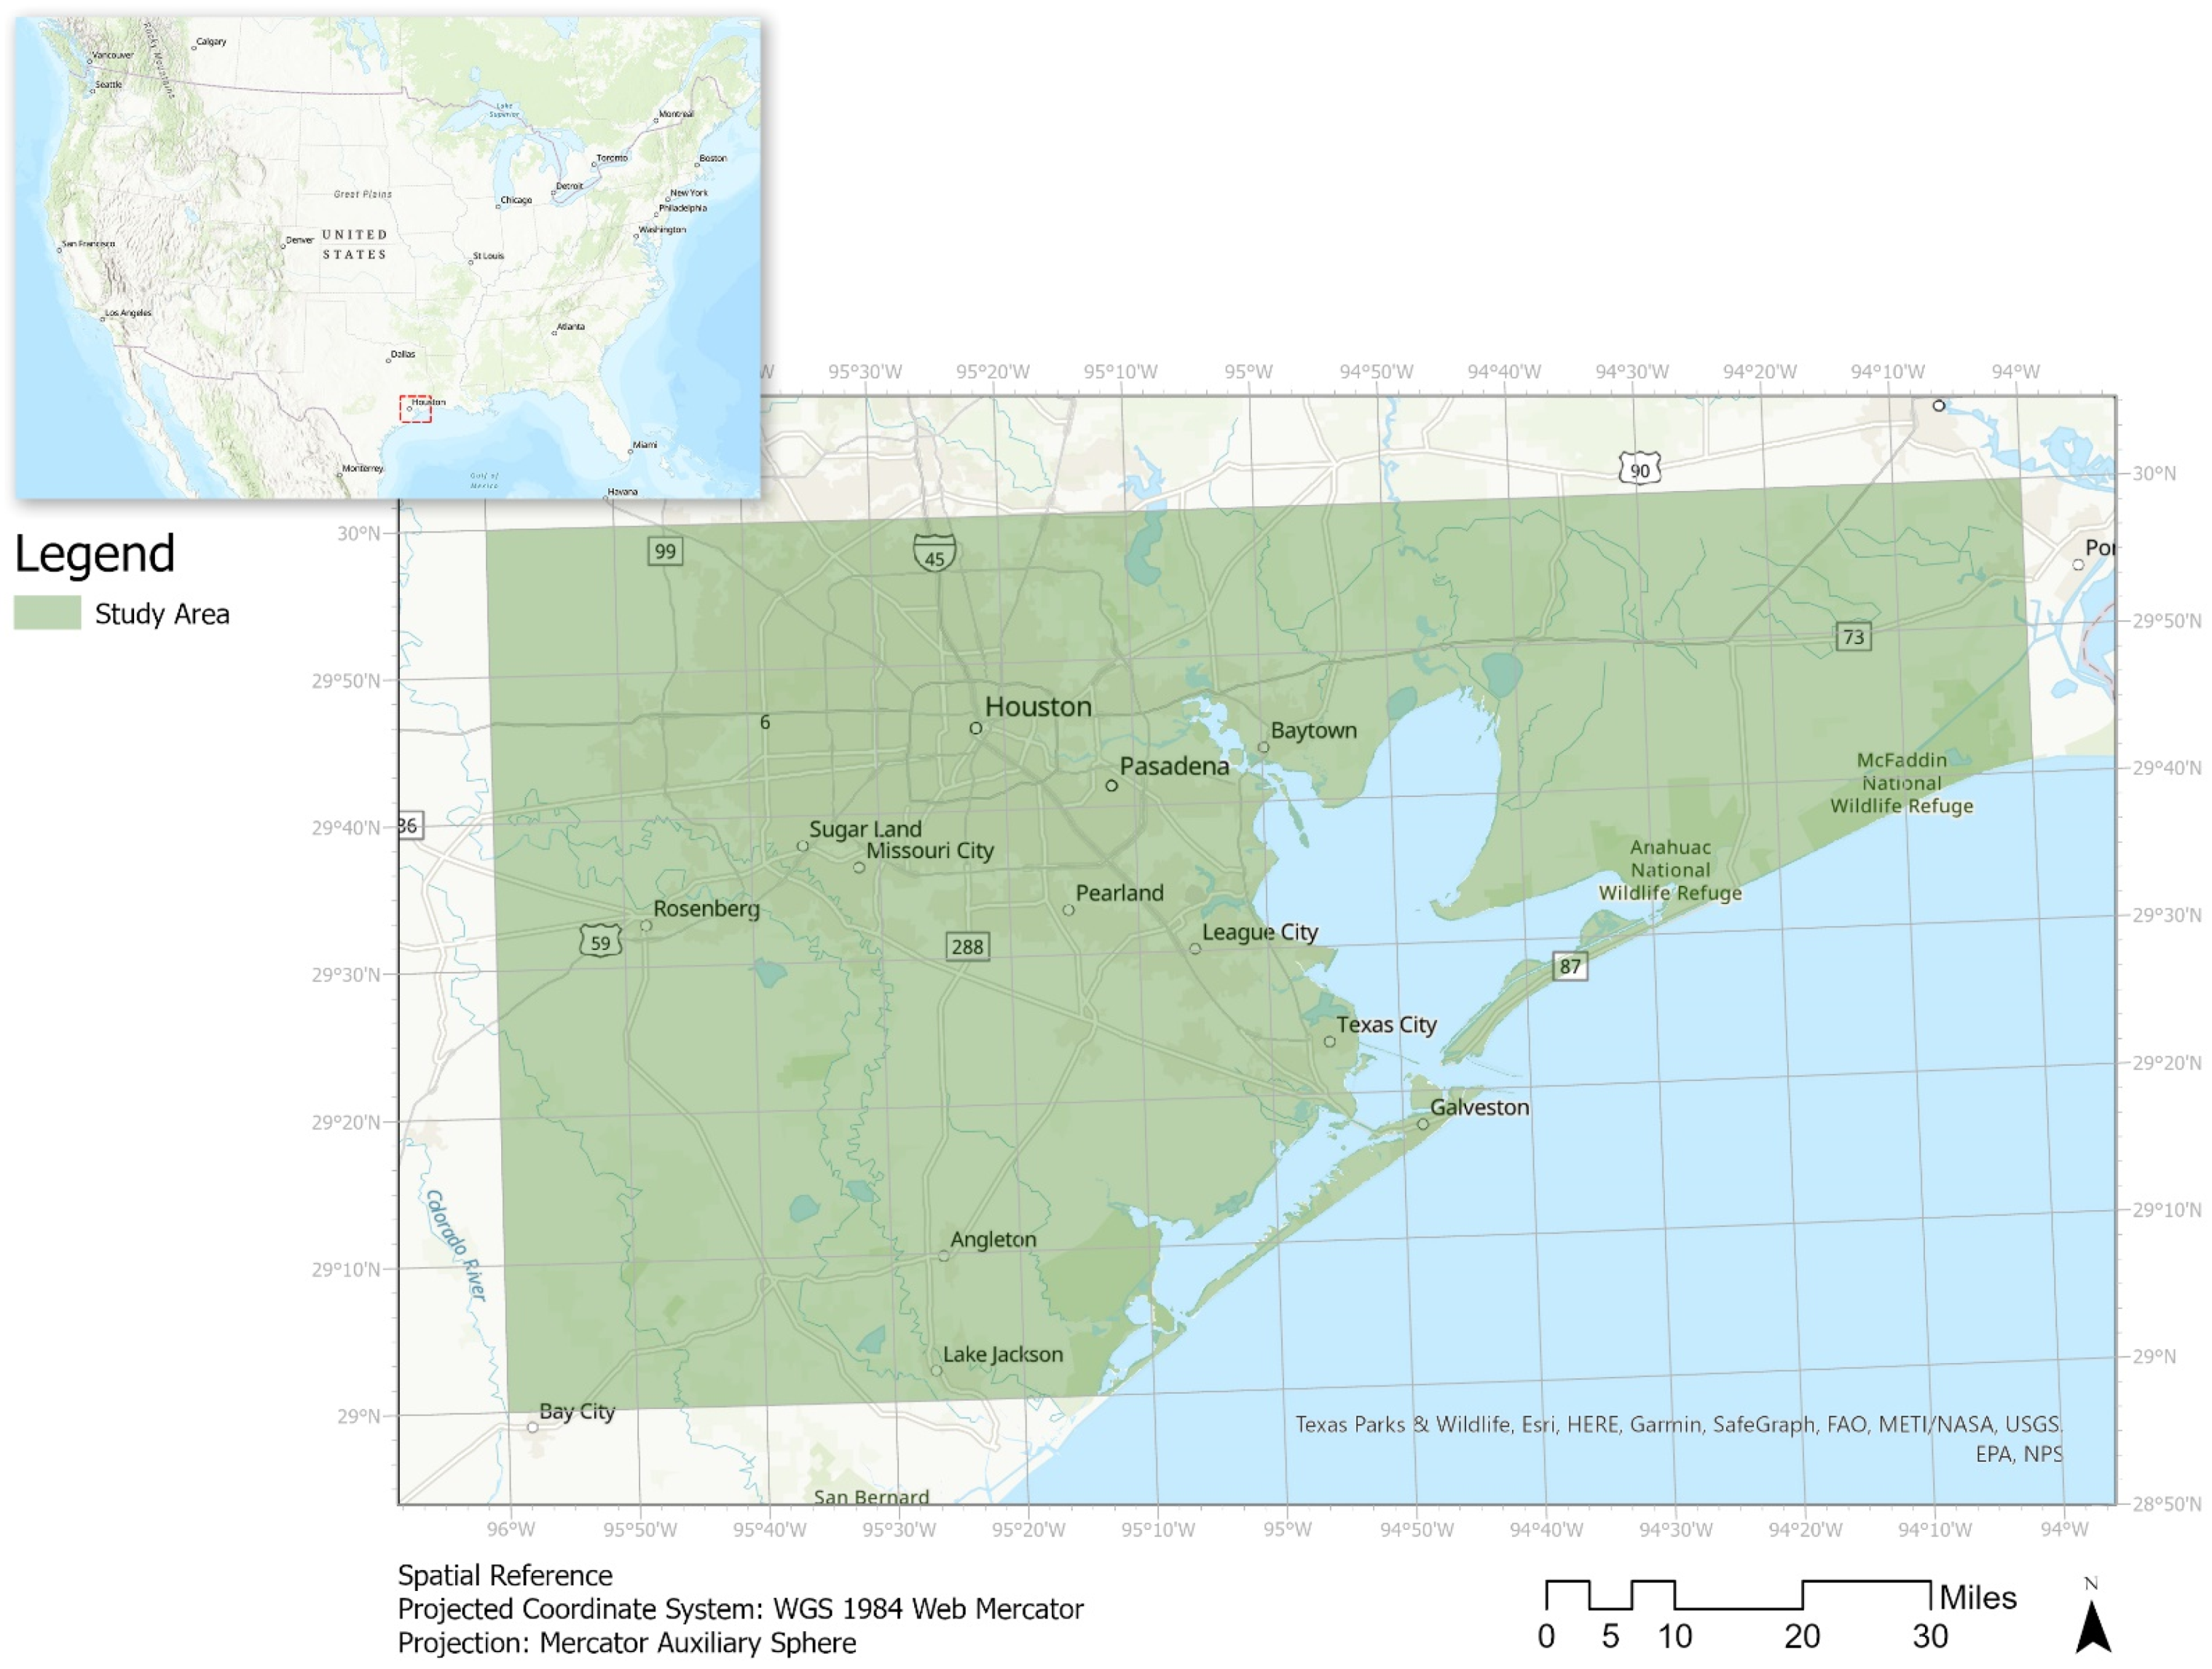
3.1. Data Collection and Study Area
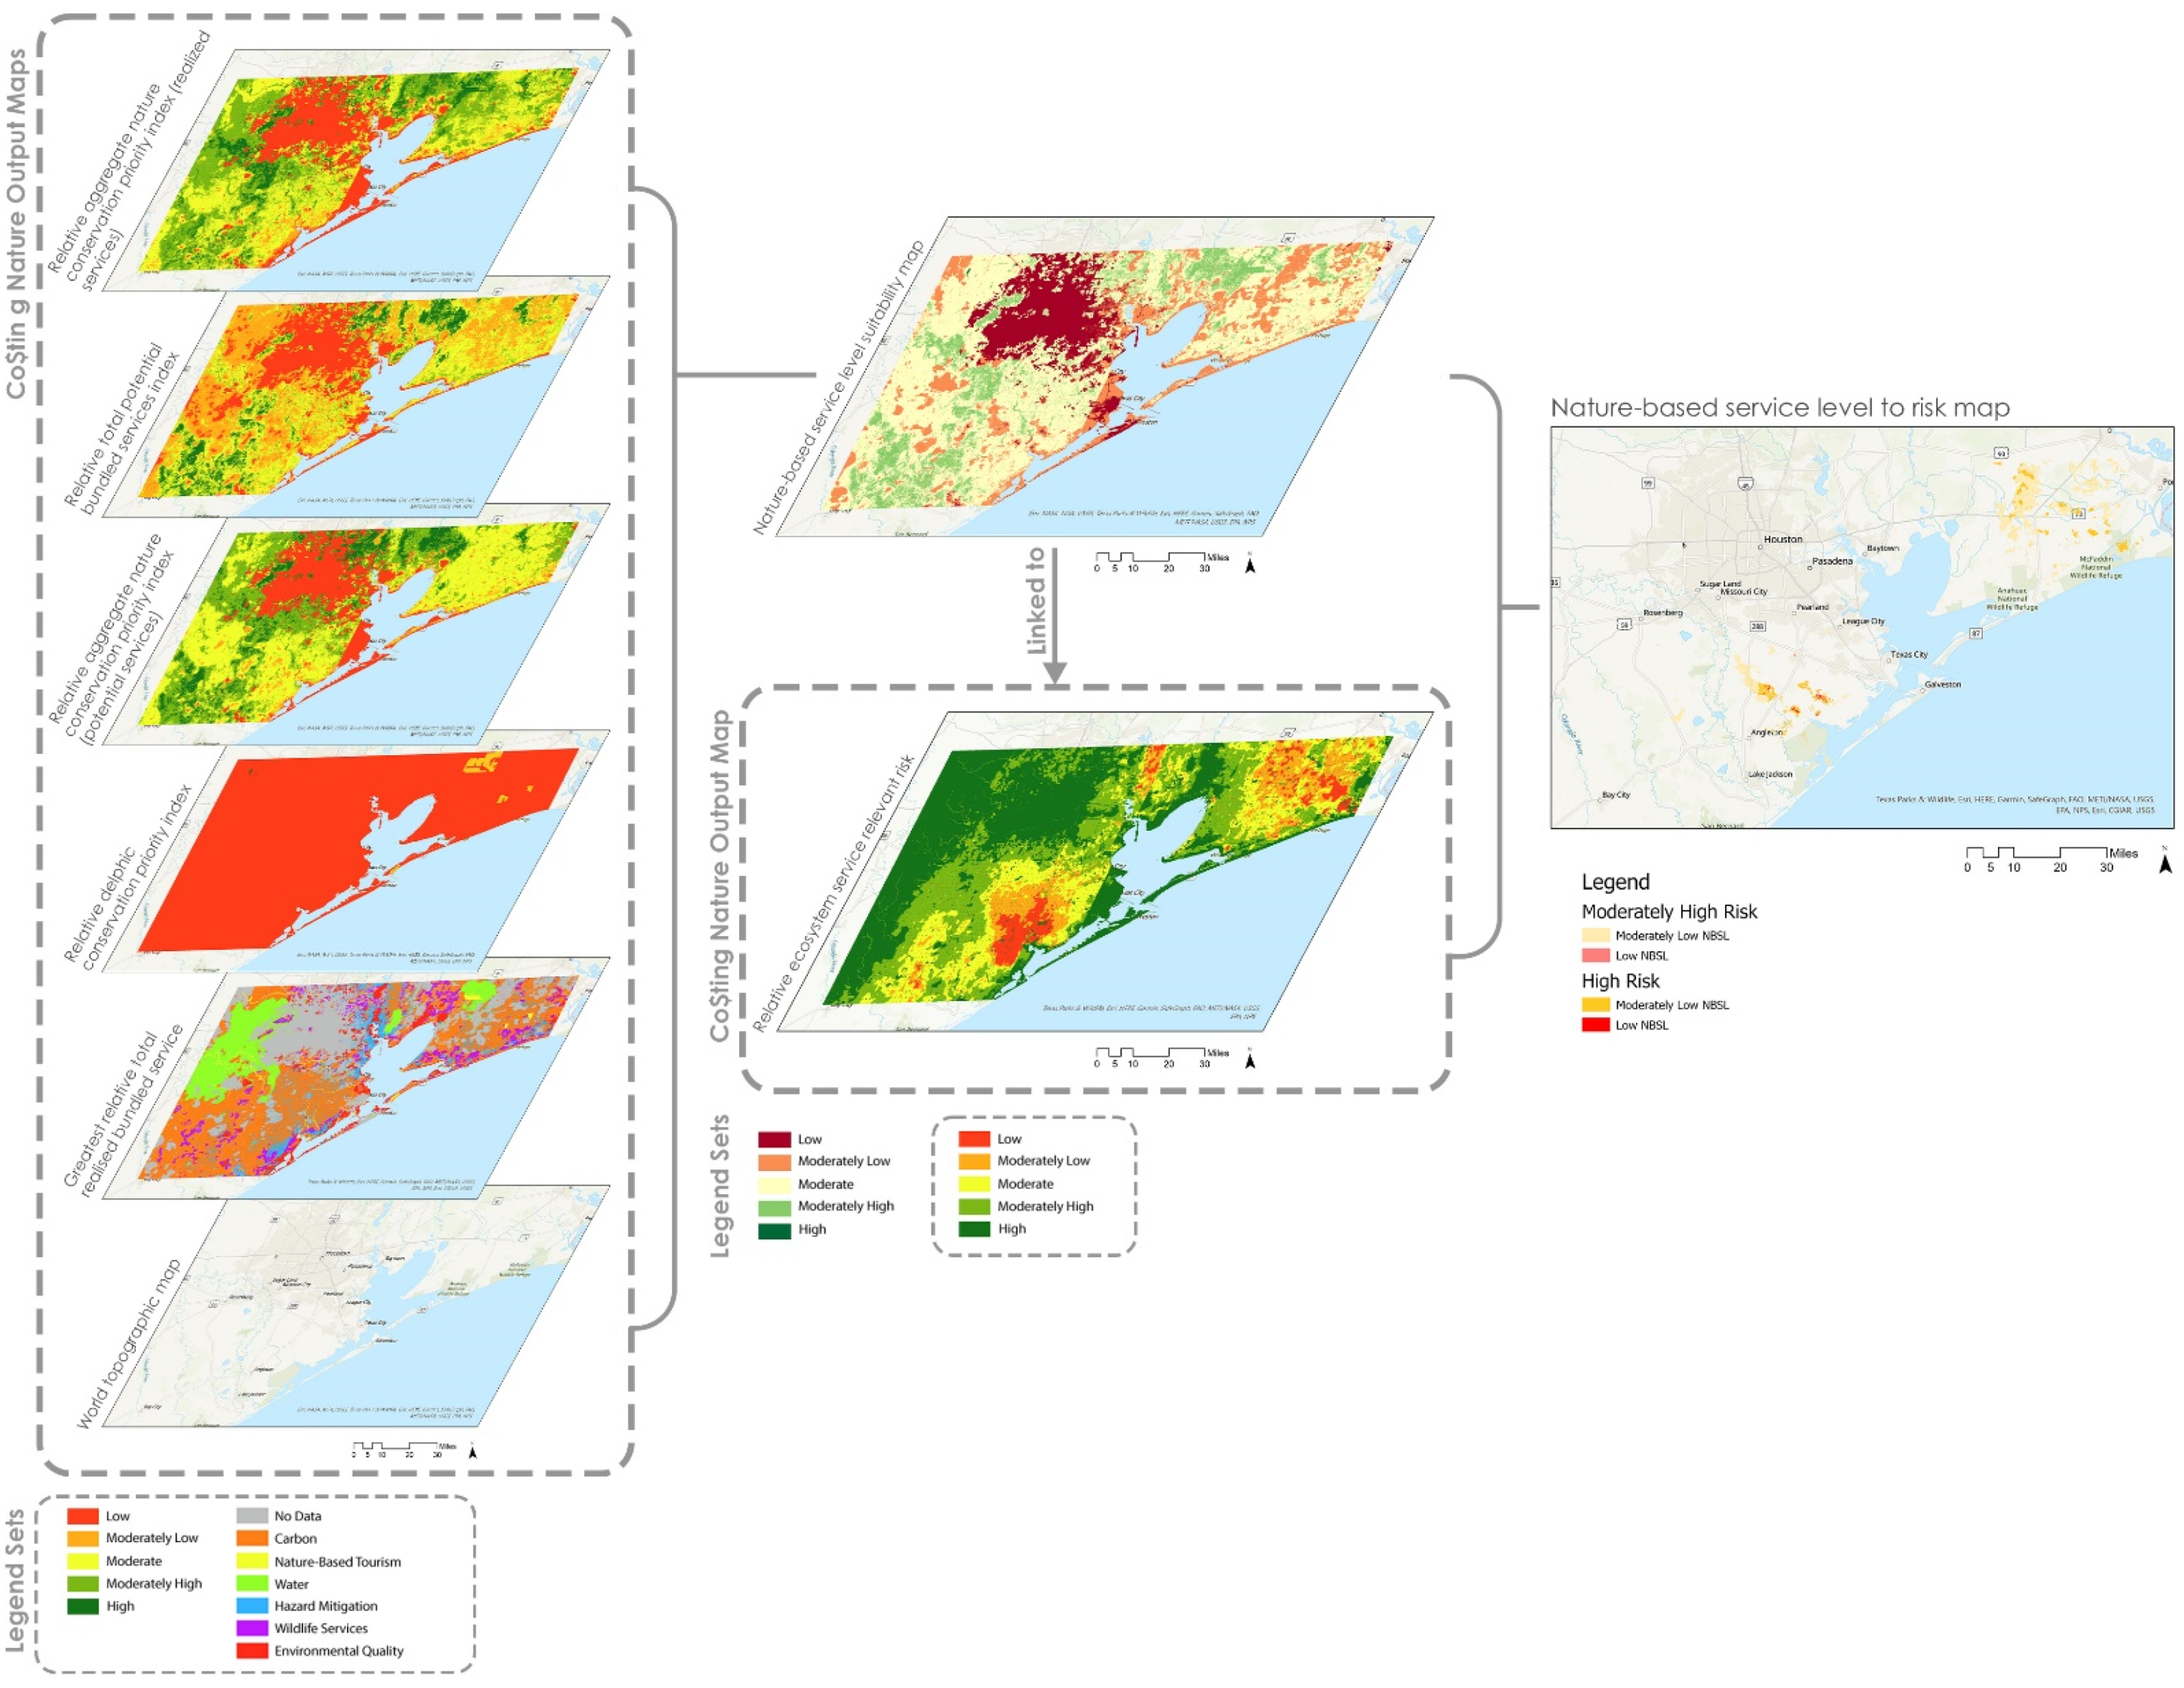
3.2. Data Analysis
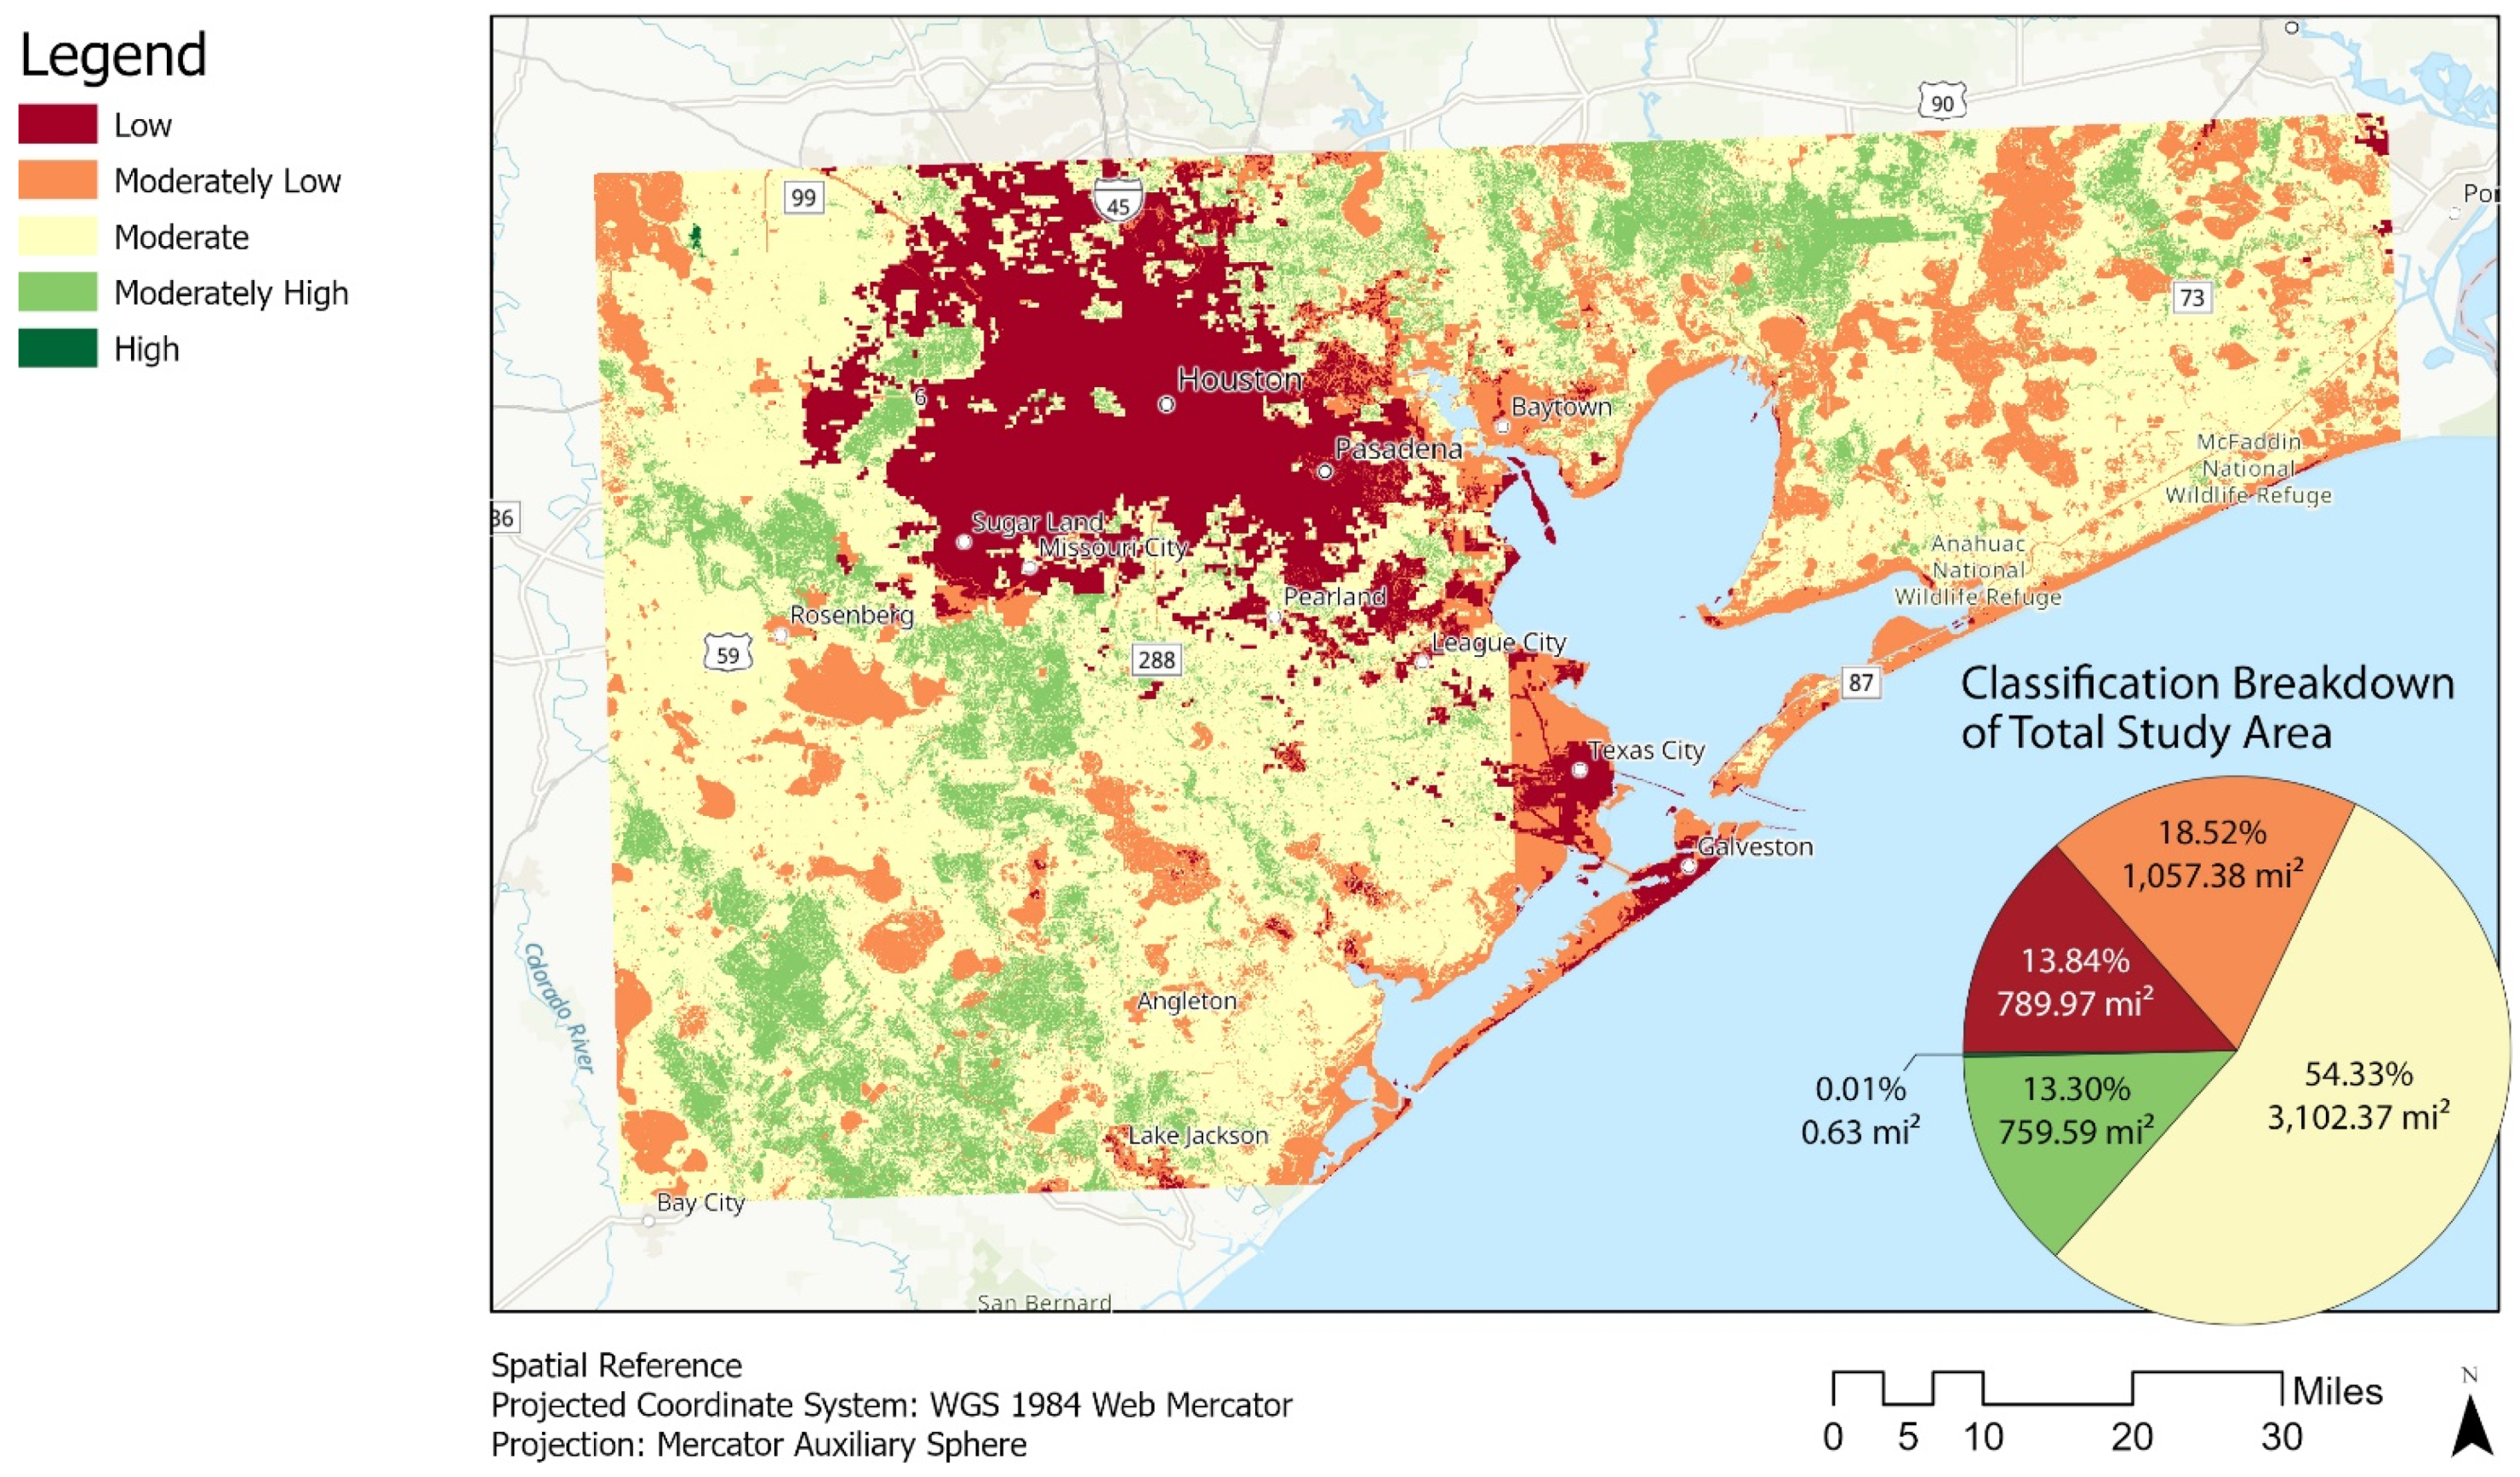
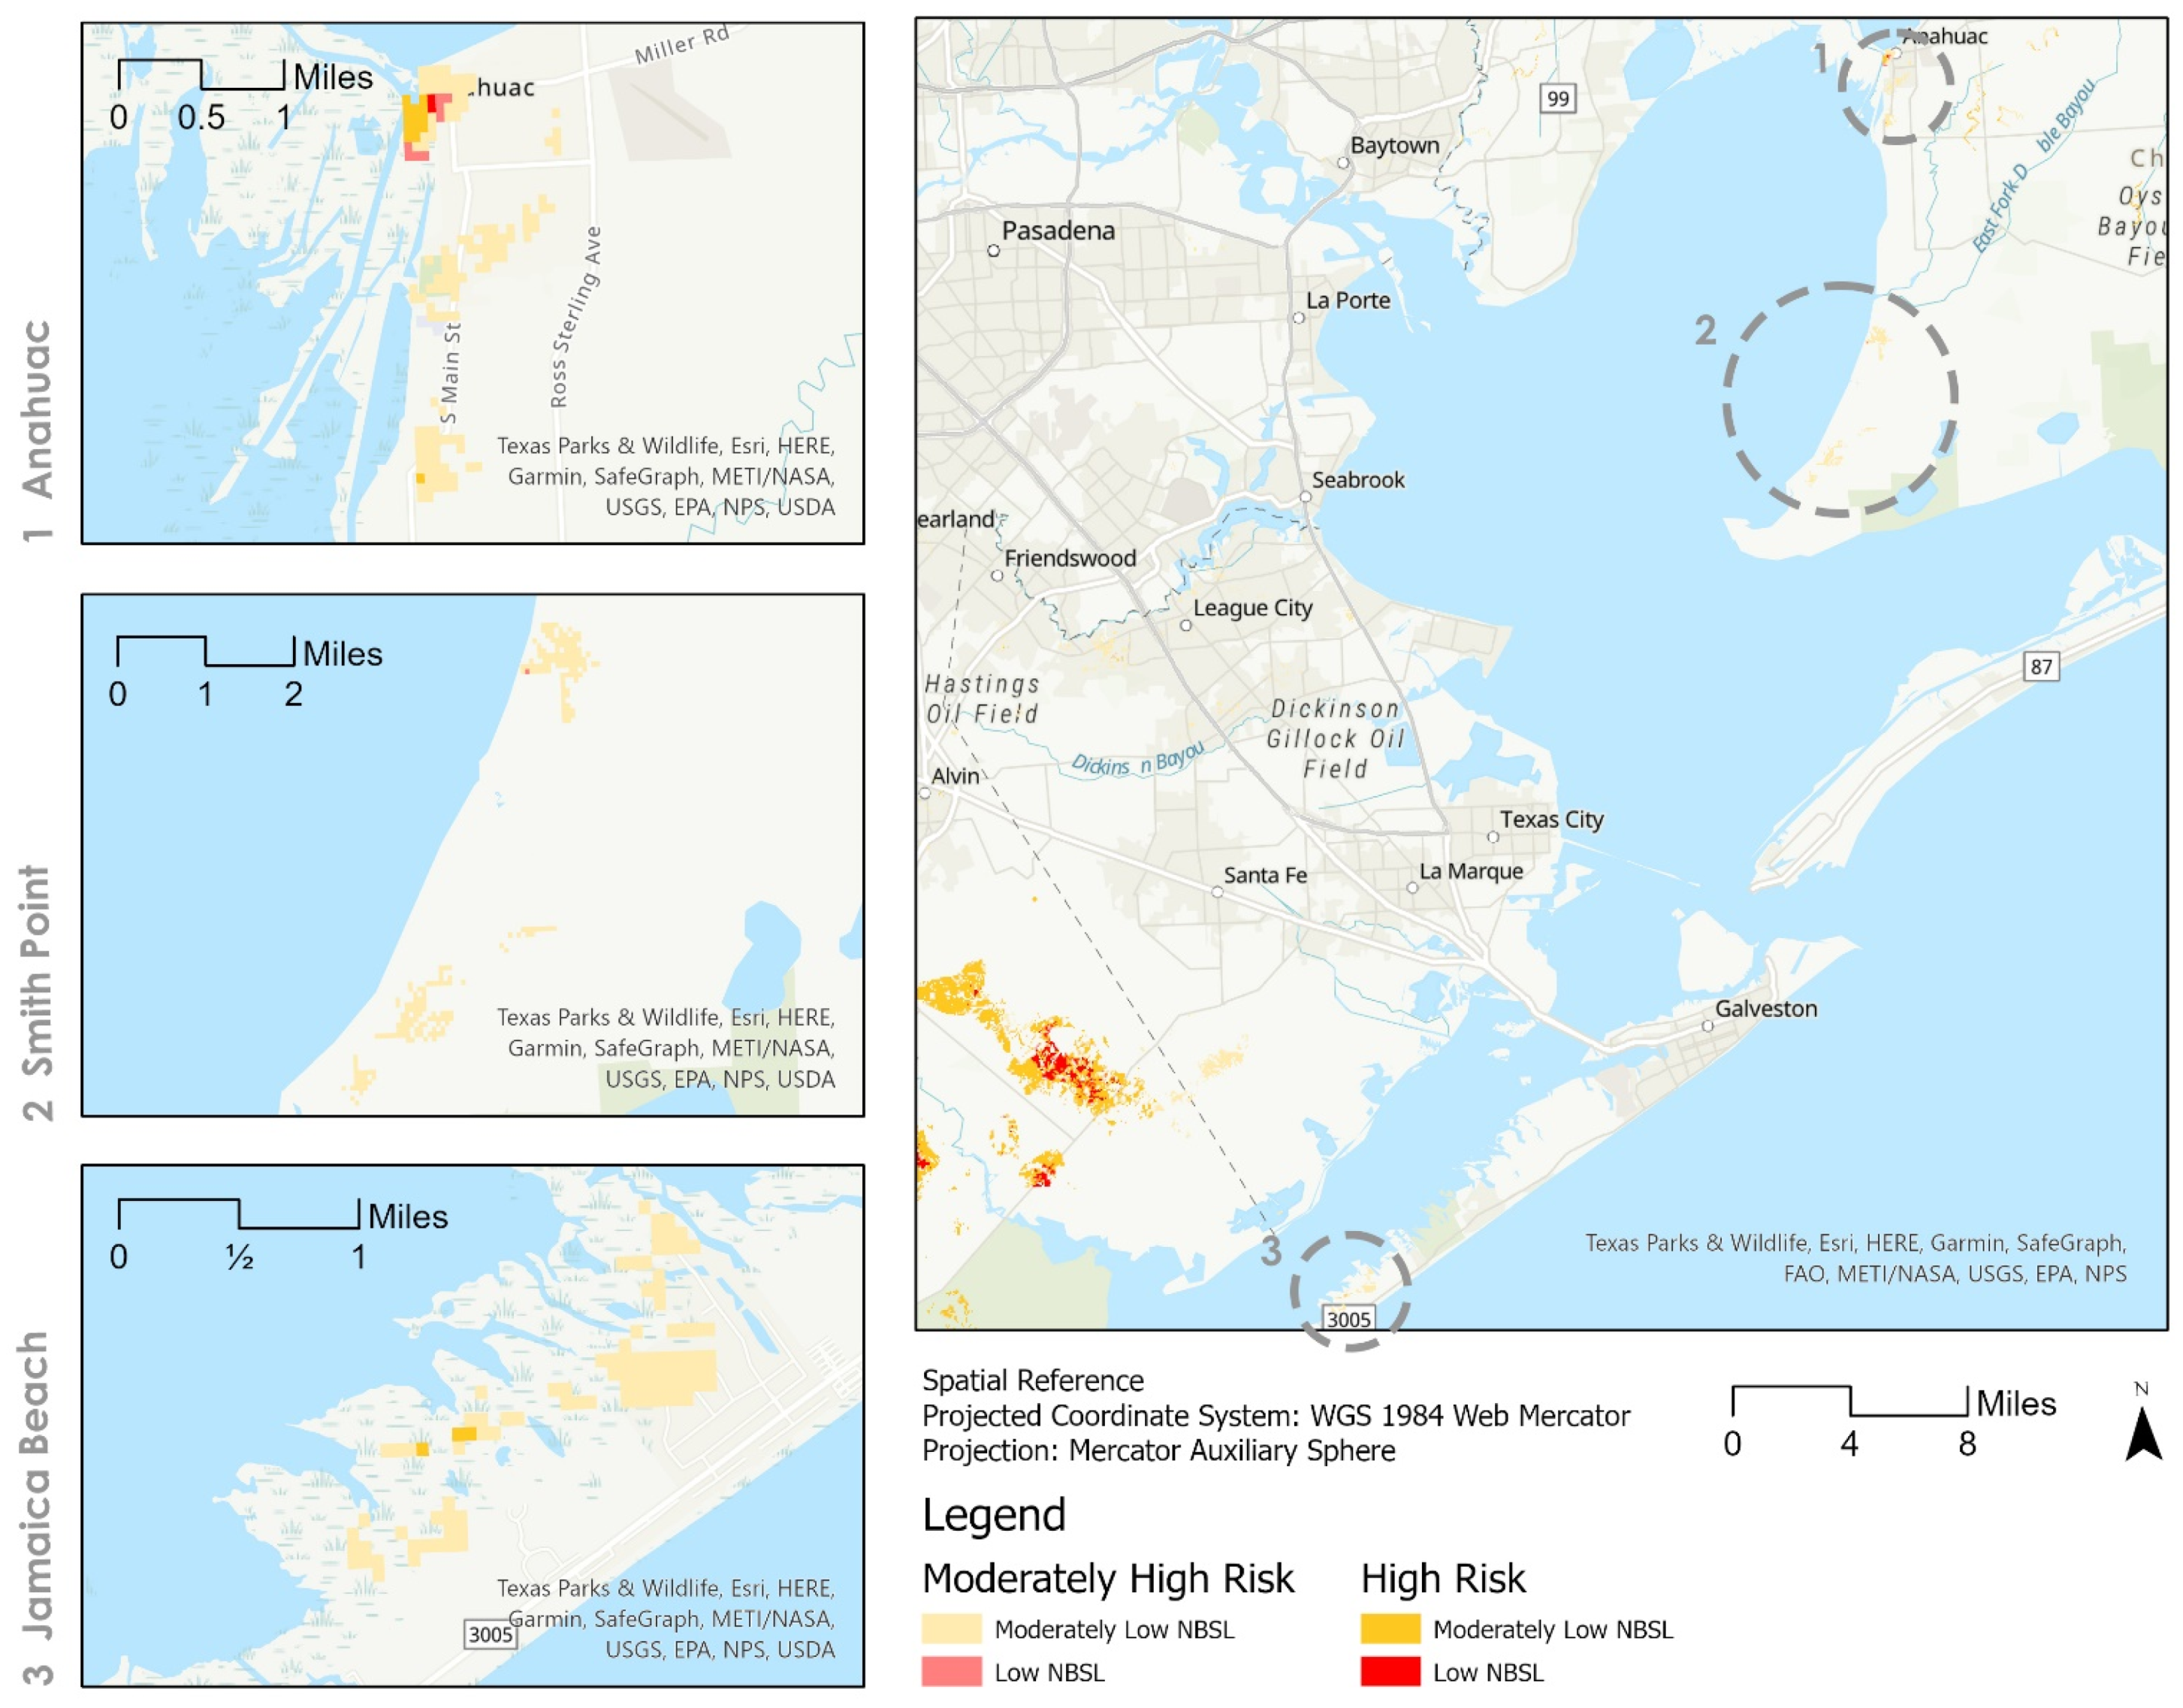
4. Results
5. Discussion and Conclusions
Author Contributions
Funding
Institutional Review Board Statement
Informed Consent Statement
Data Availability Statement
Conflicts of Interest
References
- Malecha, M.L.; Kirsch, K.R.; Karaye, I.; Horney, J.A.; Newman, G. Advancing the Toxics Mobility Inventory: Development and Application of a Toxics Mobility Vulnerability Index to Harris County, Texas. Sustain. J. Rec. 2020, 13, 282–291. [Google Scholar] [CrossRef]
- Zhang, W.; Villarini, G.; Vecchi, G.; Smith, J.A. Urbanization exacerbated the rainfall and flooding caused by hurricane Harvey in Houston. Nat. Cell Biol. 2018, 563, 384–388. [Google Scholar] [CrossRef]
- Khan, S.D. Urban development and flooding in Houston Texas, inferences from remote sensing data using neural network technique. Environ. Earth Sci. 2005, 47, 1120–1127. [Google Scholar] [CrossRef]
- Brody, S.D.; Gunn, J.; Peacock, W.; Highfield, W.E. Examining the Influence of Development Patterns on Flood Damages along the Gulf of Mexico. J. Plan. Educ. Res. 2011, 31, 438–448. [Google Scholar] [CrossRef]
- Faccini, F.; Luino, L.; Paliaga, G.; Roccati, A.; Turconi, L. Flash Flood Events along the West Mediterranean Coasts: Inunda-tions of Urbanized Areas Conditioned by Anthropic Impacts. Land 2021, 10, 620. [Google Scholar] [CrossRef]
- López Díez, A.; Máyer Suárez, P.; Díaz Pacheco, J.; Dorta Antequera, P. Rainfall and Flooding in Coastal Tourist Areas of the Canary Islands (Spain). Atmosphere 2019, 10, 809. [Google Scholar] [CrossRef] [Green Version]
- Génova, M.; Máyer, P.; Ballesteros-Cánovas, J.; Rubiales, J.M.; Saz, M.; Diez-Herrero, A. Multidisciplinary study of flash floods in the Caldera de Taburiente National Park (Canary Islands, Spain). Catena 2015, 131, 22–34. [Google Scholar] [CrossRef]
- Fragoso, M.; Trigo, R.; Pinto, J.G.; Lopes, S.; Lopes, A.; Ulbrich, S.; Magro, C. The 20 February 2010 Madeira flash-floods: Synoptic analysis and extreme rainfall assessment. Nat. Hazards Earth Syst. Sci. 2012, 12, 715–730. [Google Scholar] [CrossRef] [Green Version]
- Newman, G.; Shi, T.; Yao, Z.; Li, D.; Sansom, G.; Kirsch, K.; Casillas, G.; Horney, J. Citizen Science-Informed Community Master Planning: Land Use and Built Environment Changes to Increase Flood Resilience and Decrease Con-taminant Exposure. Int. J. Environ. Res. Public Health 2020, 17, 486. [Google Scholar] [CrossRef] [PubMed] [Green Version]
- Salzman, J.; Thompson, B.H.; Daily, G.C. Protecting Ecosystem Services: Science, Economics, and Law. Stanf. Environ. Law J. 2001, 20, 309–332. [Google Scholar]
- Roberts, C.M.; O’Leary, B.C.; Hawkins, J.P. Climate change mitigation and nature conservation both require higher protected area targets. Philos. Trans. R. Soc. B Biol. Sci. 2020, 375, 20190121. [Google Scholar] [CrossRef] [Green Version]
- Hendricks, M.D.; Newman, G.; Yu, S.; Horney, J. Leveling the Landscape: Landscape Performance as a Green In-frastructure Evaluation Tool for Service-Learning Products. Landsc. J. 2018, 37, 19–39. [Google Scholar] [CrossRef] [PubMed]
- Song, Y.; Kirkwood, N.; Maksimović, Č.; Zheng, X.; O’Connor, D.; Jin, Y.; Hou, D. Nature based solutions for contaminated land remediation and brownfield redevelopment in cities: A review. Sci. Total. Environ. 2019, 663, 568–579. [Google Scholar] [CrossRef] [PubMed]
- Thiagarajan, M.; Newman, G.; Van Zandt, S. The Projected Impact of a Neighborhood-Scaled Green-Infrastructure Retrofit. Sustainability 2018, 10, 3665. [Google Scholar] [CrossRef] [Green Version]
- Mulligan, M.; van Soesbergen, A. Mapping Ecosystem Services in the Volta Basin Using Co$ting Nature ES Assessment Model. Colombo, Sri Lanka: CGIAR Research Program on Water, Land and Ecosystems (WLE). 2017. Available online: https://cgspace.cgiar.org/handle/10568/83039 (accessed on 13 March 2021).
- Meyer, M.A.; Hendricks, M.; Newman, G.D.; Masterson, J.H.; Cooper, J.T.; Sansom, G.; Gharaibeh, N.; Horney, J.; Berke, P.; van Zandt, S.; et al. Participatory action research: Tools for disaster resilience education. Int. J. Disaster Resil. Built Environ. 2018, 9, 402–419. [Google Scholar] [CrossRef] [PubMed]
- Aziz, T.; Van Cappellen, P. Comparative valuation of potential and realized ecosystem services in Southern On-tario, Canada. Environ. Sci. Policy 2019, 100, 105–112. [Google Scholar] [CrossRef]
- Choi, H.-A.; Song, C.; Lee, W.-K.; Jeon, S.; Gu, J.H. Integrated Approaches for National Ecosystem Assessment in South Korea. KSCE J. Civ. Eng. 2017, 22, 1634–1641. [Google Scholar] [CrossRef]
- Hemati, T.; Pourebrahim, S.; Monavari, M.; Baghvand, A. Species-specific nature conservation prioritization (a combination of MaxEnt, Co$ting Nature and DINAMICA EGO modeling approaches). Ecol. Model. 2020, 429, 109093. [Google Scholar] [CrossRef]
- Liu, P.; Jiang, S.; Zhao, L.; Li, Y.; Zhang, P.; Zhang, L. What are the benefits of strictly protected nature reserves? Rapid assessment of ecosystem service values in Wanglang Nature Reserve, China. Ecosyst. Serv. 2017, 26, 70–78. [Google Scholar] [CrossRef]
- Neugarten, R.A.; Honzák, M.; Carret, P.; Koenig, K.; Andriamaro, L.; Cano, C.A.; Grantham, H.S.; Hole, D.; Juhn, D.; McKinnon, M.; et al. Rapid Assessment of Ecosystem Service Co-Benefits of Biodiversity Priority Areas in Madagascar. PLoS ONE 2016, 11, e0168575. [Google Scholar] [CrossRef]
- Office for Coastal Management Digital Coast Data. 2019; National Oceanic and Atmospheric Administration. Available online: https://coast.noaa.gov/digitalcoast/data/home.html (accessed on 19 November 2020).
- The Center for Texas Beaches and Shores (CTBS). Galveston, Texas A&M University at Galveston. 2020. Available online: https://www.tamug.edu/ctbs/web-tools.html (accessed on 19 November 2020).
- TPWD Spatial Data. Austin, Texas Parks and Wildlife Department. Available online: https://tpwd.texas.gov/gis/#data (accessed on 20 November 2020).
- H-GAC Regional Data Hub. Houston-Galveston Area Council. 2021. Available online: https://gishub-h-gac.hub.arcgis.com (accessed on 3 November 2020).
- Co$ting Nature. Policy Support Systems. London, King’s College London. 2011. Available online: http://www.policysupport.org/costingnature (accessed on 19 November 2020).
- Georgian, S.E.; Anderson, O.F.; Rowden, A.A. Ensemble habitat suitability modeling of vul-nerable marine eco-system indicator taxa to inform deep-sea fisheries management in the South Pacific Ocean. Fish. Res. 2019, 211, 256–274. [Google Scholar] [CrossRef]
- Store, R.; Jokimäki, J. A GIS-based multi-scale approach to habitat suitability modeling. Ecol. Model. 2003, 169, 1–15. [Google Scholar] [CrossRef]
- Chen, T.-Y. Bivariate models of optimism and pessimism in multi-criteria decision-making based on intuitionistic fuzzy sets. Inf. Sci. 2011, 181, 2139–2165. [Google Scholar] [CrossRef]
- Wild, T.C.; Henneberry, J.; Gill, L. Comprehending the multiple ‘values’ of green infrastructure–Valuing na-ture-based solutions for urban water management from multiple perspectives. Environ. Res. 2017, 158, 179–187. [Google Scholar] [CrossRef] [Green Version]
- Atoba, K.O.; Brody, S.D.; Highfield, W.E.; Shepard, C.C.; Verdone, L.N. Strategic property buyouts to enhance flood resilience: A multi-criteria spatial approach for incorporating ecological values into the selection process. Environ. Hazards 2021, 20, 229–247. [Google Scholar] [CrossRef]
- Atoba, K.; Newman, G.; Brody, S.; Highfield, W.; Kim, Y.; Juan, A. Buy them out before they are built: Evaluating the proactive acquisition of vacant land in flood-prone areas. Environ. Conserv. 2021, 48, 118–126. [Google Scholar] [CrossRef]
- Nature-Based Solutions to Climate Change Adaptation in Urban Areas. In Urban Sustainability Transitions; Springer Science and Business Media LLC: Berlin/Heidelberg, Germany, 2017; pp. 123–138.
- Greer, A.; Binder, S.B. A Historical Assessment of Home Buyout Policy: Are We Learning or Just Failing? Hous. Policy Debate 2016, 27, 1–21. [Google Scholar] [CrossRef]
- Siders, A.R. Social justice implications of US managed retreat buyout programs. Clim. Chang. 2018, 152, 239–257. [Google Scholar] [CrossRef]
- Fraser, J.; Elmore, R.; Godschalk, D.; Rohe, W. Implementing Floodplain Land Acquisition Programs in Urban Localities; The Center for Houring and Urban Studies: Chapel Hill, NC, USA, 2003. [Google Scholar]
- Ahiablame, L.M.; Engel, B.A.; Chaubey, I. Effectiveness of Low Impact Development Practices: Literature Review and Suggestions for Future Research. Water Air Soil Pollut. 2012, 223, 4253–4273. [Google Scholar] [CrossRef]
- Pyke, C.; Warren, M.P.; Johnson, T.; LaGro, J.; Scharfenberg, J.; Groth, P.; Freed, R.; Schroeer, W.; Main, E. Assess-ment of low impact development for managing stormwater with changing precipitation due to climate change. Landsc. Urban Plan. 2011, 103, 166–173. [Google Scholar] [CrossRef]
- Eckart, K.; McPhee, Z.; Bolisetti, T. Performance and implementation of low impact development–A review. Sci. Total Environ. 2017, 607–608, 413–432. [Google Scholar] [CrossRef] [PubMed]
- Hughes, C.M. Watershed-Scale Distributed Hydrologic Modeling and Assessment of Low Impact Development Features in White Oak Bayou. Ph.D. Thesis, Rice University, Houston, TX, USA, 2015. Available online: https://scholarship.rice.edu/handle/1911/87835 (accessed on 20 April 2021).
- Brown, C.; Reyers, B.; Ingwall-King, L.; Mapendembe, A.; Nel, J.; O’farrell, P.; Bowles-Newark, N.J. Measuring Ecosystem Services: Guidance on Developing Ecosystem Service Indicators; UNEP-WCMC: Cambridge, UK, 2014. [Google Scholar]


| Datasets | Date | Data Sources |
|---|---|---|
| NLCD Land Cover | 2001–2019 | Multi-Resolution Land Characteristic Consortium |
| Land Cover | 2010–2011 | The Center for Texas Beaches and Shores (CTBS) |
| Flood Vulnerability | 2013 | The Center for Texas Beaches and Shores (CTBS) |
| Hazards and Hazard Mitigation | 2011 | Co$ting Nature |
| Key Output Maps | 2011 | Co$ting Nature |
| Workspace Data | 2011 | Co$ting Nature |
| Group | Map Title | Description | Weighted Overlay (%) | Numeric Classification |
|---|---|---|---|---|
| Eco-Services | Relative aggregate nature conservation priority index (potential services) | Pressured and threatened conservation priority areas with high potential service provision into five equal value classifications for the combined Houston and Galveston focus areas. | 20 | 1: ≤0.20 and No Data 2: ≤0.40 3: ≤0.60 4: ≤0.80 5: ≤1.00 |
| Relative total potential bundled services index | Total potential services including water, carbon, nature-based tourism, hazard mitigation services, timber (commercial and domestic), fuelwood, grazing, wildlife services, non-wood forest products, wildlife dis-services, aquatic fisheries (commercial and artisanal), and environmental quality into five equal value classifications for the combined Houston and Galveston focus areas. | 20 | 1: ≤0.20 and No Data 2: ≤0.40 3: ≤0.60 4: ≤0.80 5: ≤1.00 | |
| Relative aggregate nature conservation priority index (realized services) | Pressured and threatened conservation priority areas with high realized service provision into five equal value classifications for the combined Houston and Galveston focus areas. | 20 | 1: ≤0.20 and No Data 2: ≤0.40 3: ≤0.60 4: ≤0.80 5: ≤1.00 | |
| Relative delphic conservation priority index | Conservation priority by overlap of EBAs (Birdlife), Global200 Ecoregions (WWF), Hotspots (CI), Last of the Wild (WCS, CIESIN), Important Bird Areas (Birdlife), and Key Biodiversity areas (IUCN, BI, PI, CI) into five value classifications (0.1, 0.25, 0.5, 0.75, 1.0) for the combined Houston and Galveston focus areas. | 20 | 1: ≤0.10 and No Data 2: ≤0.25 3: ≤0.50 4: ≤0.75 5: ≤1.00 | |
| Greatest relative total realized bundled service | Greatest realized service from: water, carbon, nature- and culture-based tourism, hazard mitigation, timber (commercial and domestic), fuelwood, grazing, wildlife services, non-wood forest products, wildlife dis-services, aquatic fisheries (commercial and artisanal), and environmental quality for the combined Houston and Galveston focus areas. | 20 | 1: No Data 5: Carbon 5: Nature-Based Tourism 5: Water 5: Hazard Mitigation 5: Wildlife Services 5: Environmental Quality | |
| Hazard Mitigation | Relative ecosystem services (ES) relevant risk | Relative ecosystem service (ES) relevant risk (exposure x vulnerability), 0–1 locally into five equal value classifications for the combined Houston and Galveston focus areas. | N/A | 1: ≤0.20 and No Data 2: ≤0.40 3: ≤0.60 4: ≤0.80 5: ≤1.00 |
Publisher’s Note: MDPI stays neutral with regard to jurisdictional claims in published maps and institutional affiliations. |
© 2021 by the authors. Licensee MDPI, Basel, Switzerland. This article is an open access article distributed under the terms and conditions of the Creative Commons Attribution (CC BY) license (https://creativecommons.org/licenses/by/4.0/).
Share and Cite
Prybutok, S.; Newman, G.; Atoba, K.; Sansom, G.; Tao, Z. Combining Co$ting Nature and Suitability Modeling to Identify High Flood Risk Areas in Need of Nature-Based Services. Land 2021, 10, 853. https://doi.org/10.3390/land10080853
Prybutok S, Newman G, Atoba K, Sansom G, Tao Z. Combining Co$ting Nature and Suitability Modeling to Identify High Flood Risk Areas in Need of Nature-Based Services. Land. 2021; 10(8):853. https://doi.org/10.3390/land10080853
Chicago/Turabian StylePrybutok, Sara, Galen Newman, Kayode Atoba, Garett Sansom, and Zhihan Tao. 2021. "Combining Co$ting Nature and Suitability Modeling to Identify High Flood Risk Areas in Need of Nature-Based Services" Land 10, no. 8: 853. https://doi.org/10.3390/land10080853
APA StylePrybutok, S., Newman, G., Atoba, K., Sansom, G., & Tao, Z. (2021). Combining Co$ting Nature and Suitability Modeling to Identify High Flood Risk Areas in Need of Nature-Based Services. Land, 10(8), 853. https://doi.org/10.3390/land10080853