
Historical GIS as a Tool for Monitoring, Preserving and Planning Forest Landscape: A Case Study in a Mediterranean Region


Abstract
:1. Introduction
2. Materials and Methods
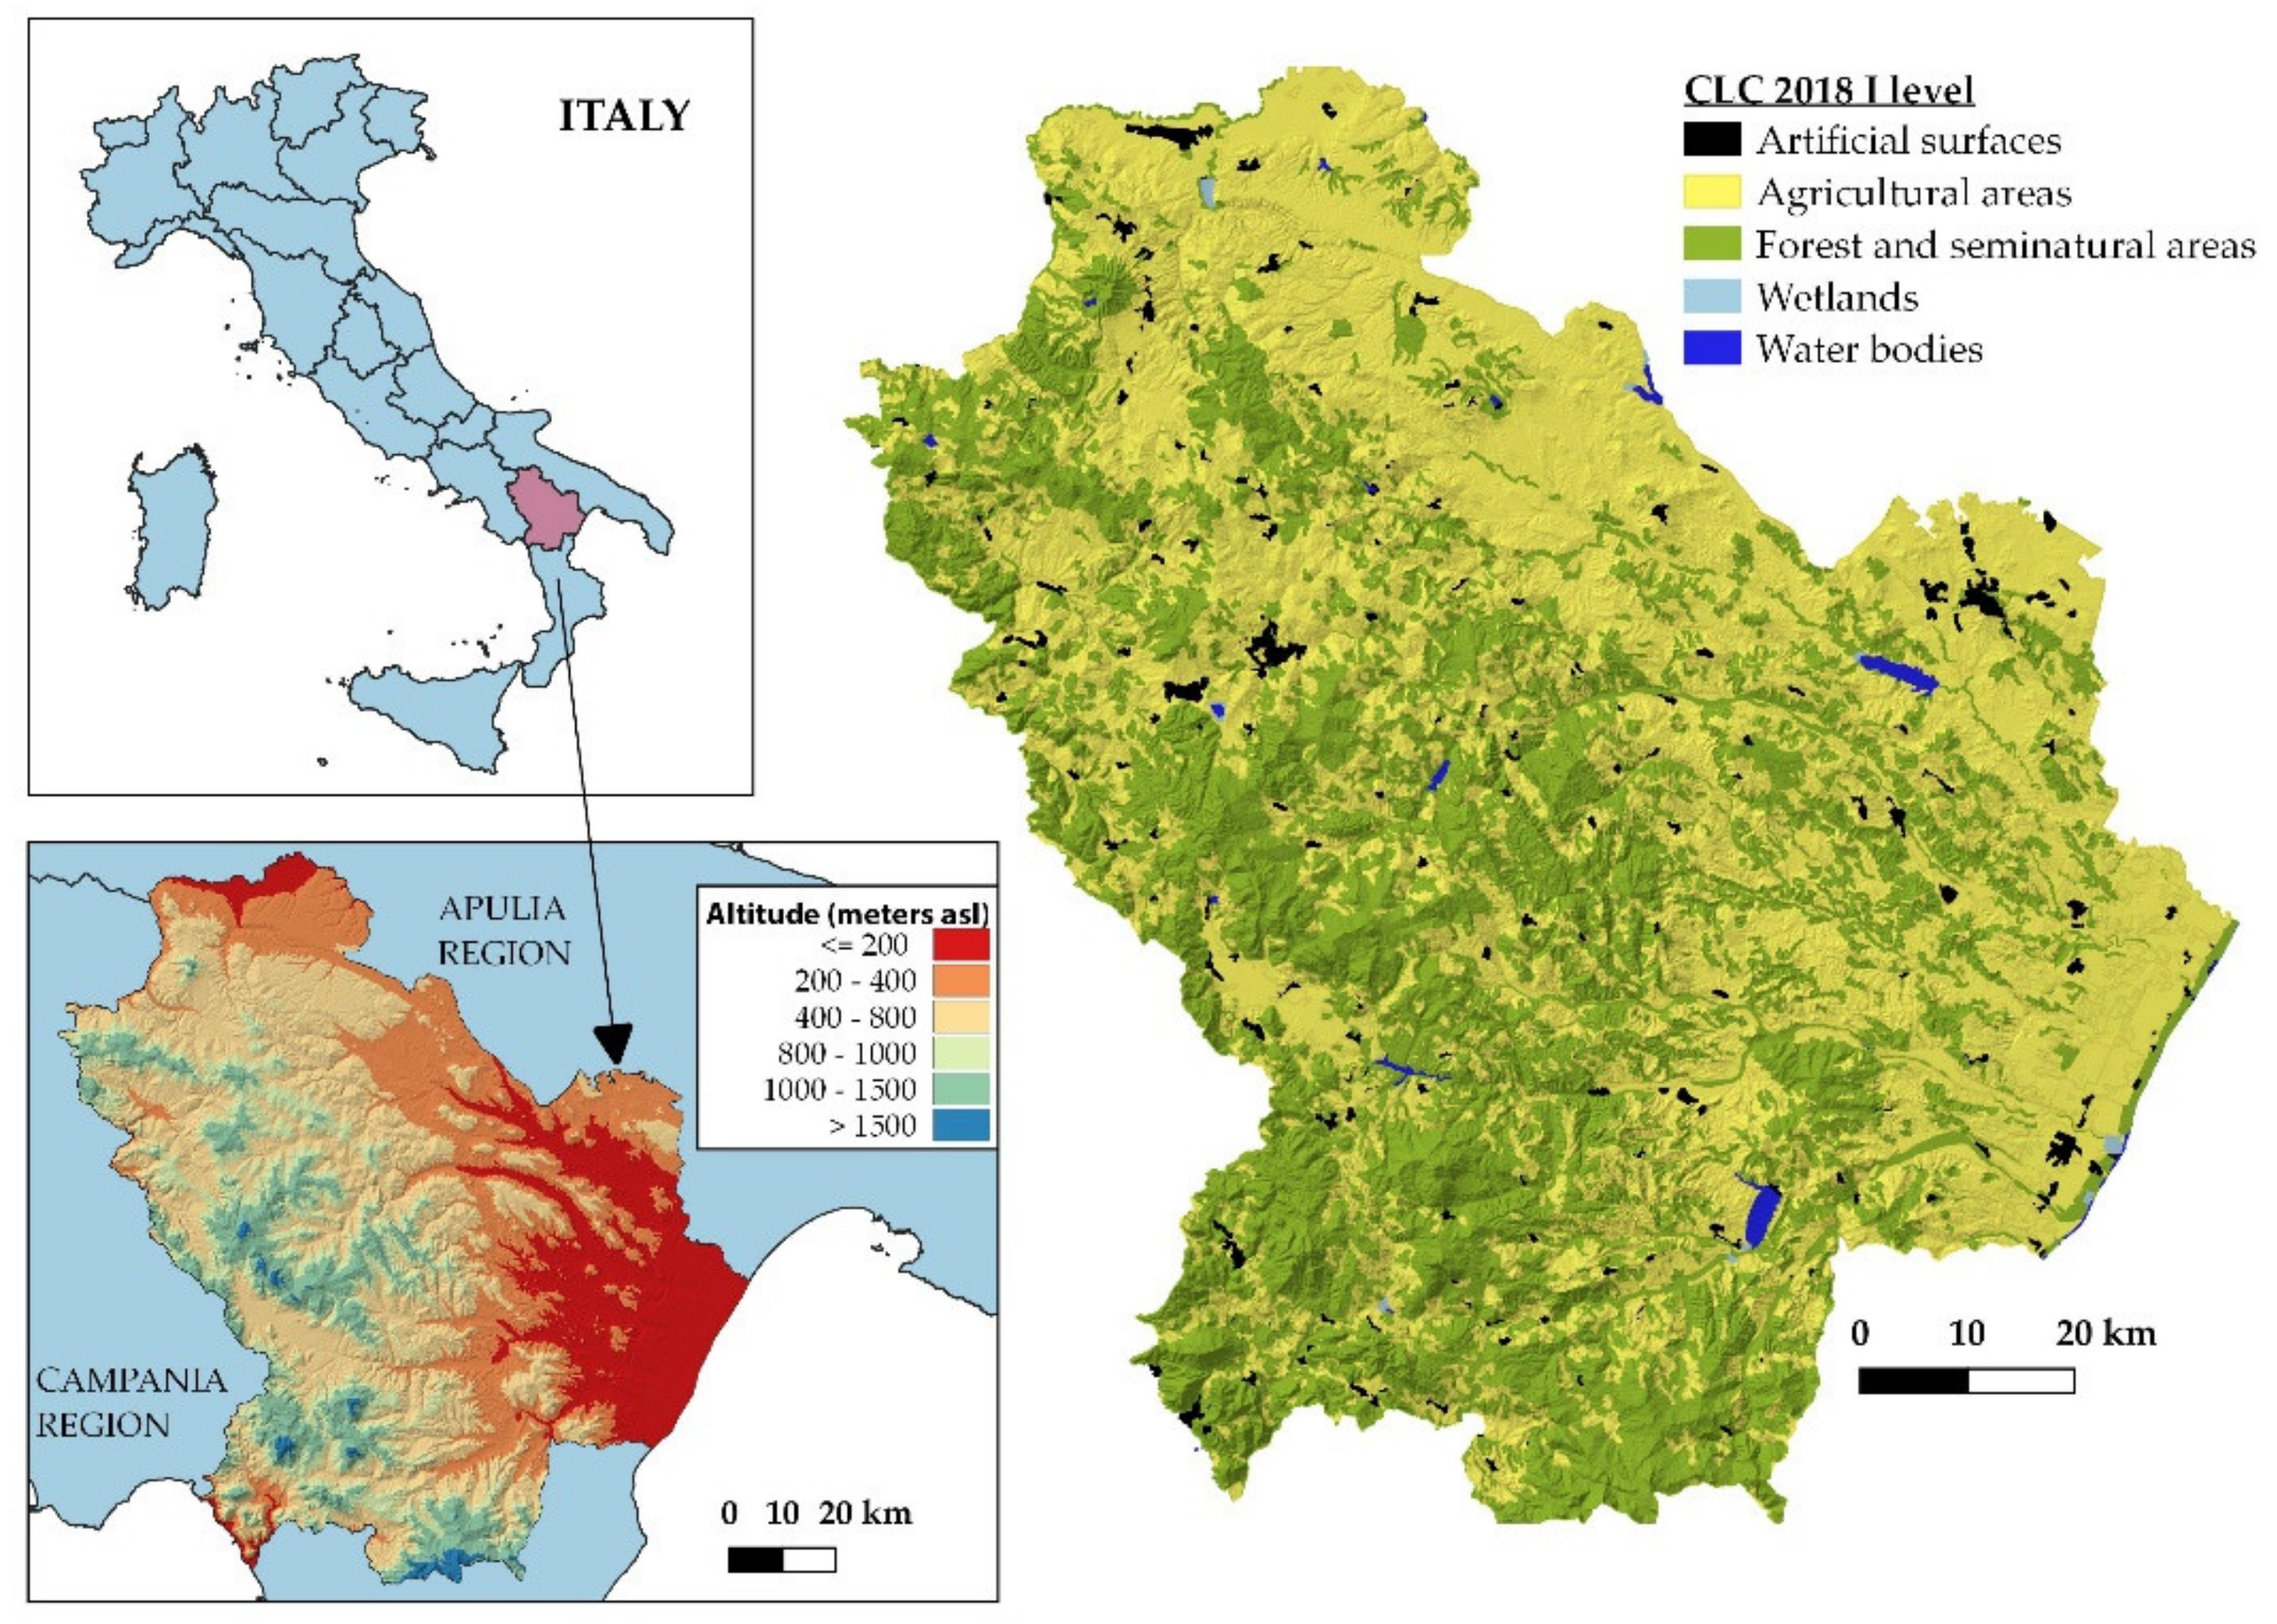
2.1. Study Area
2.2. Preliminary Cartographic and Geospatial Operations
2.3. Implementation of Historical GIS
2.4. Forest Dynamics Geodatabase
2.5. Stastistic Analysis on Forest Areas
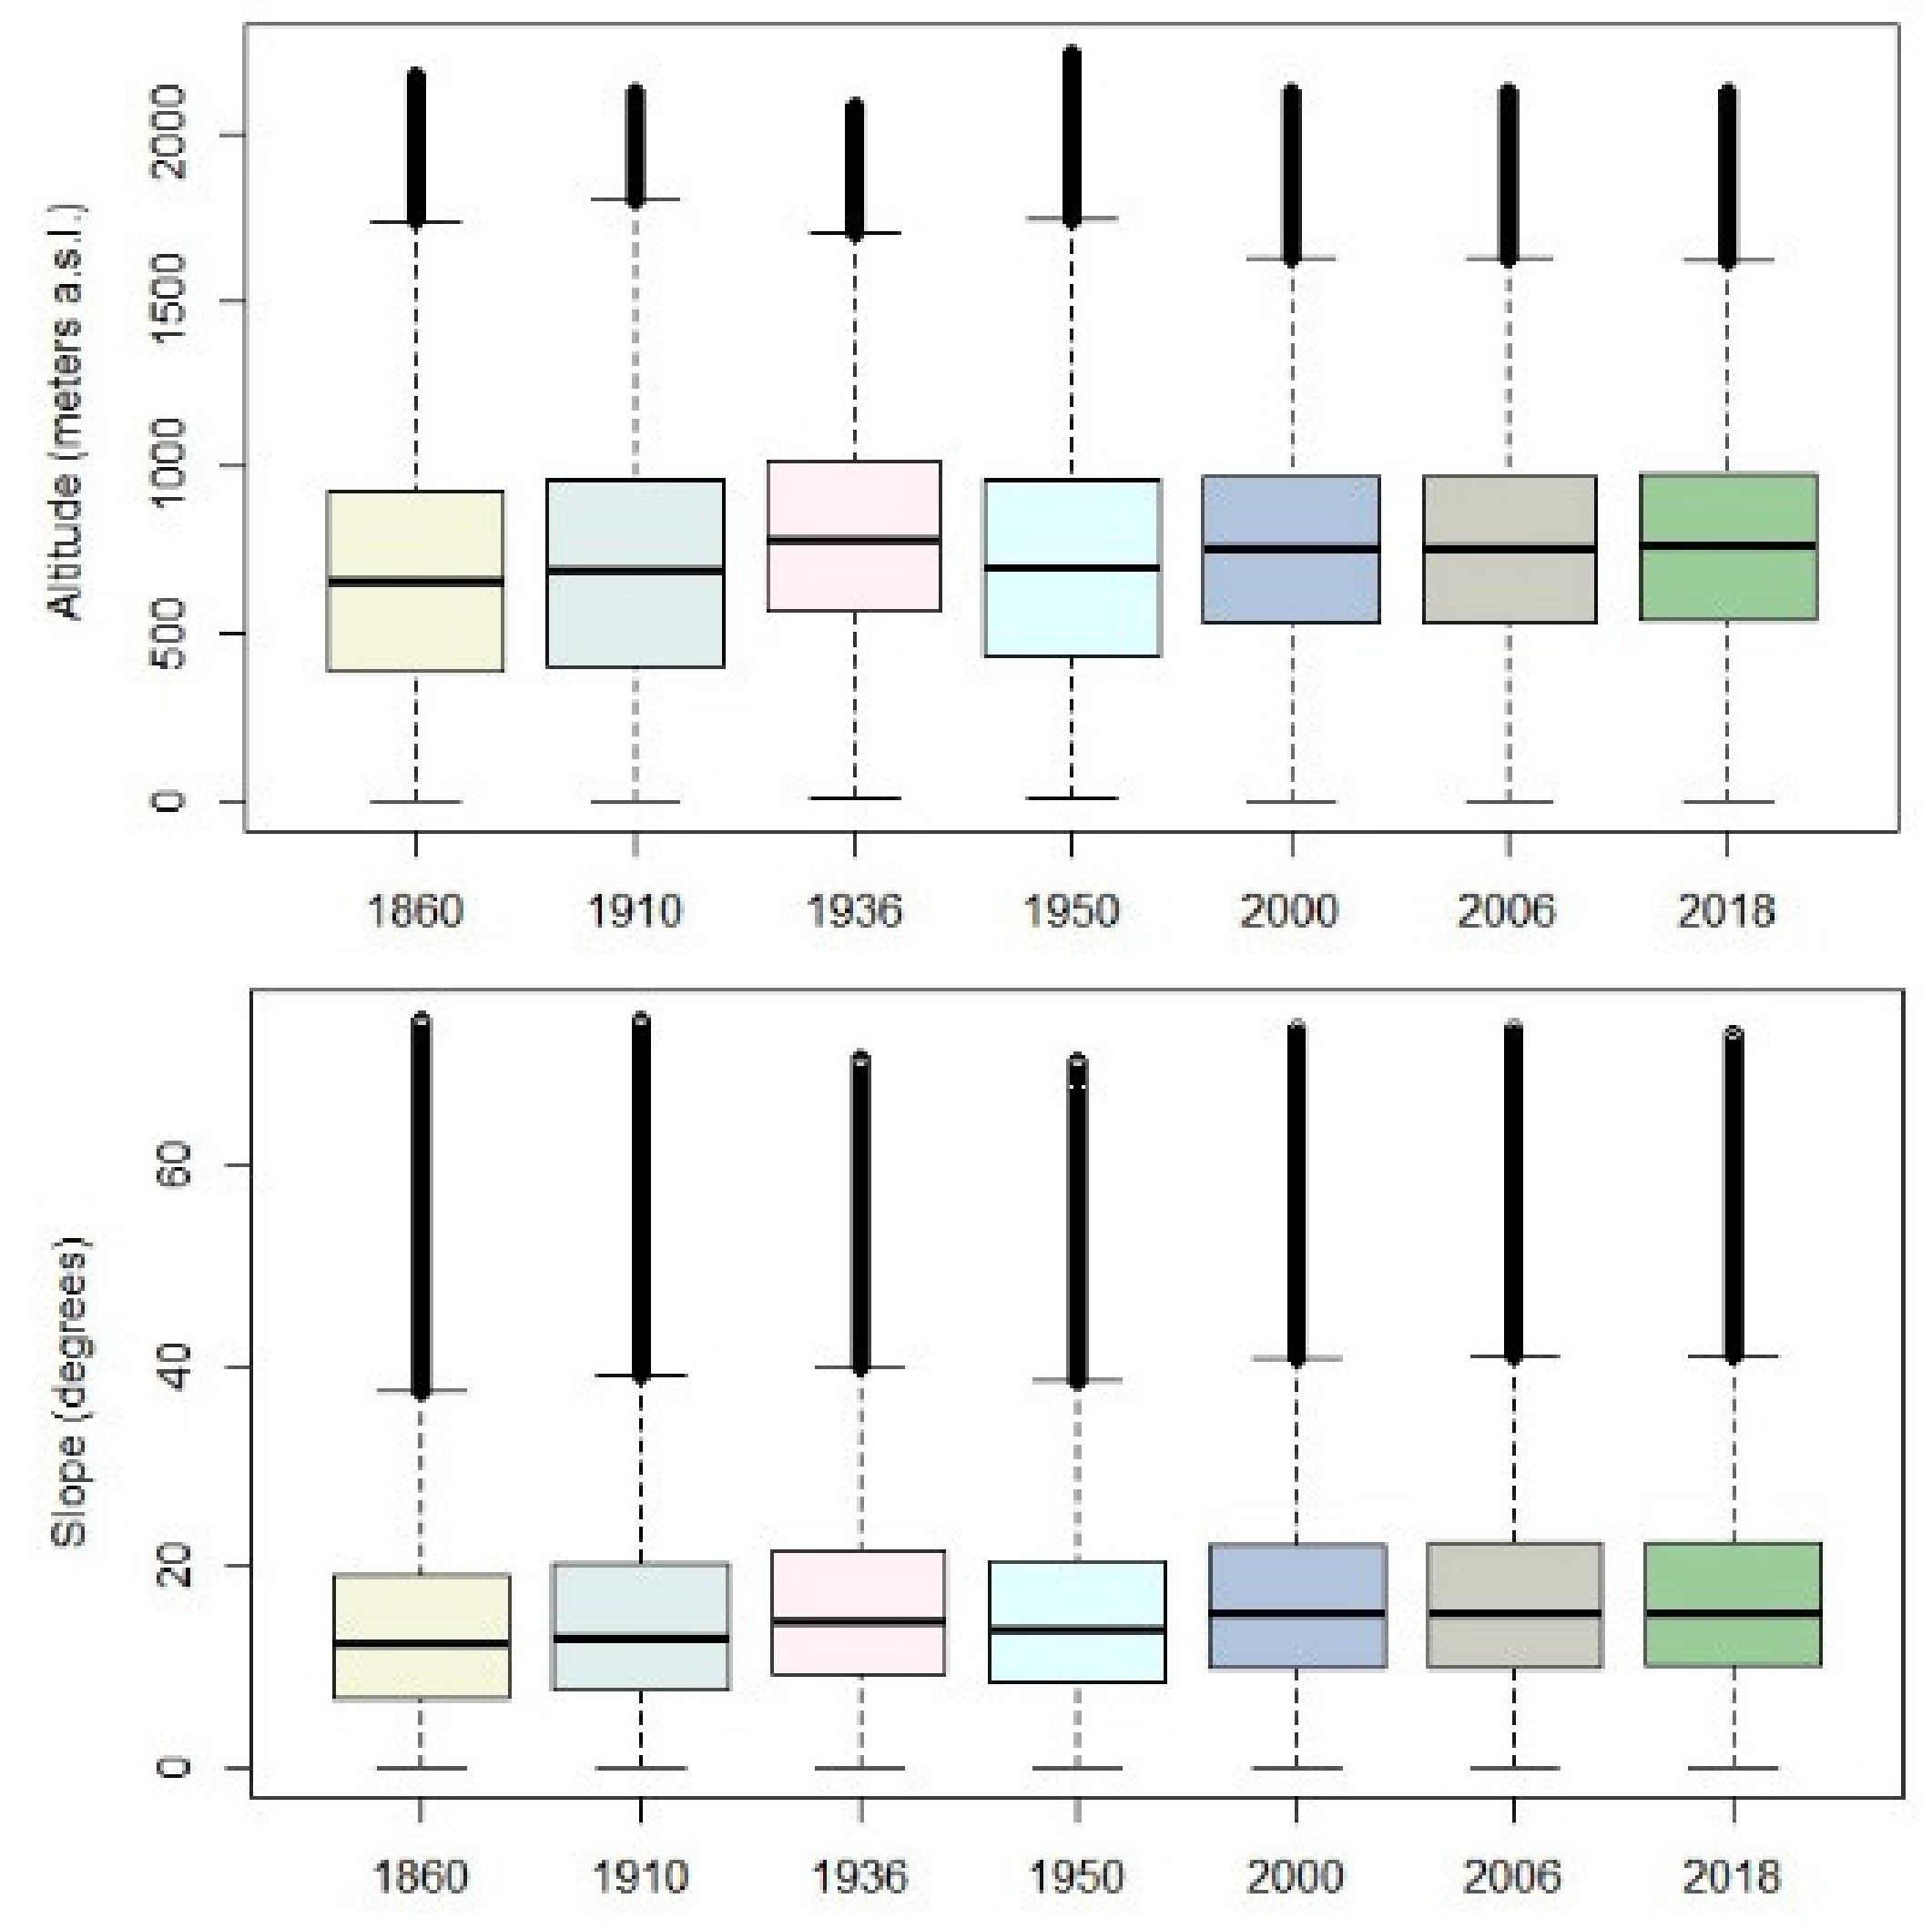
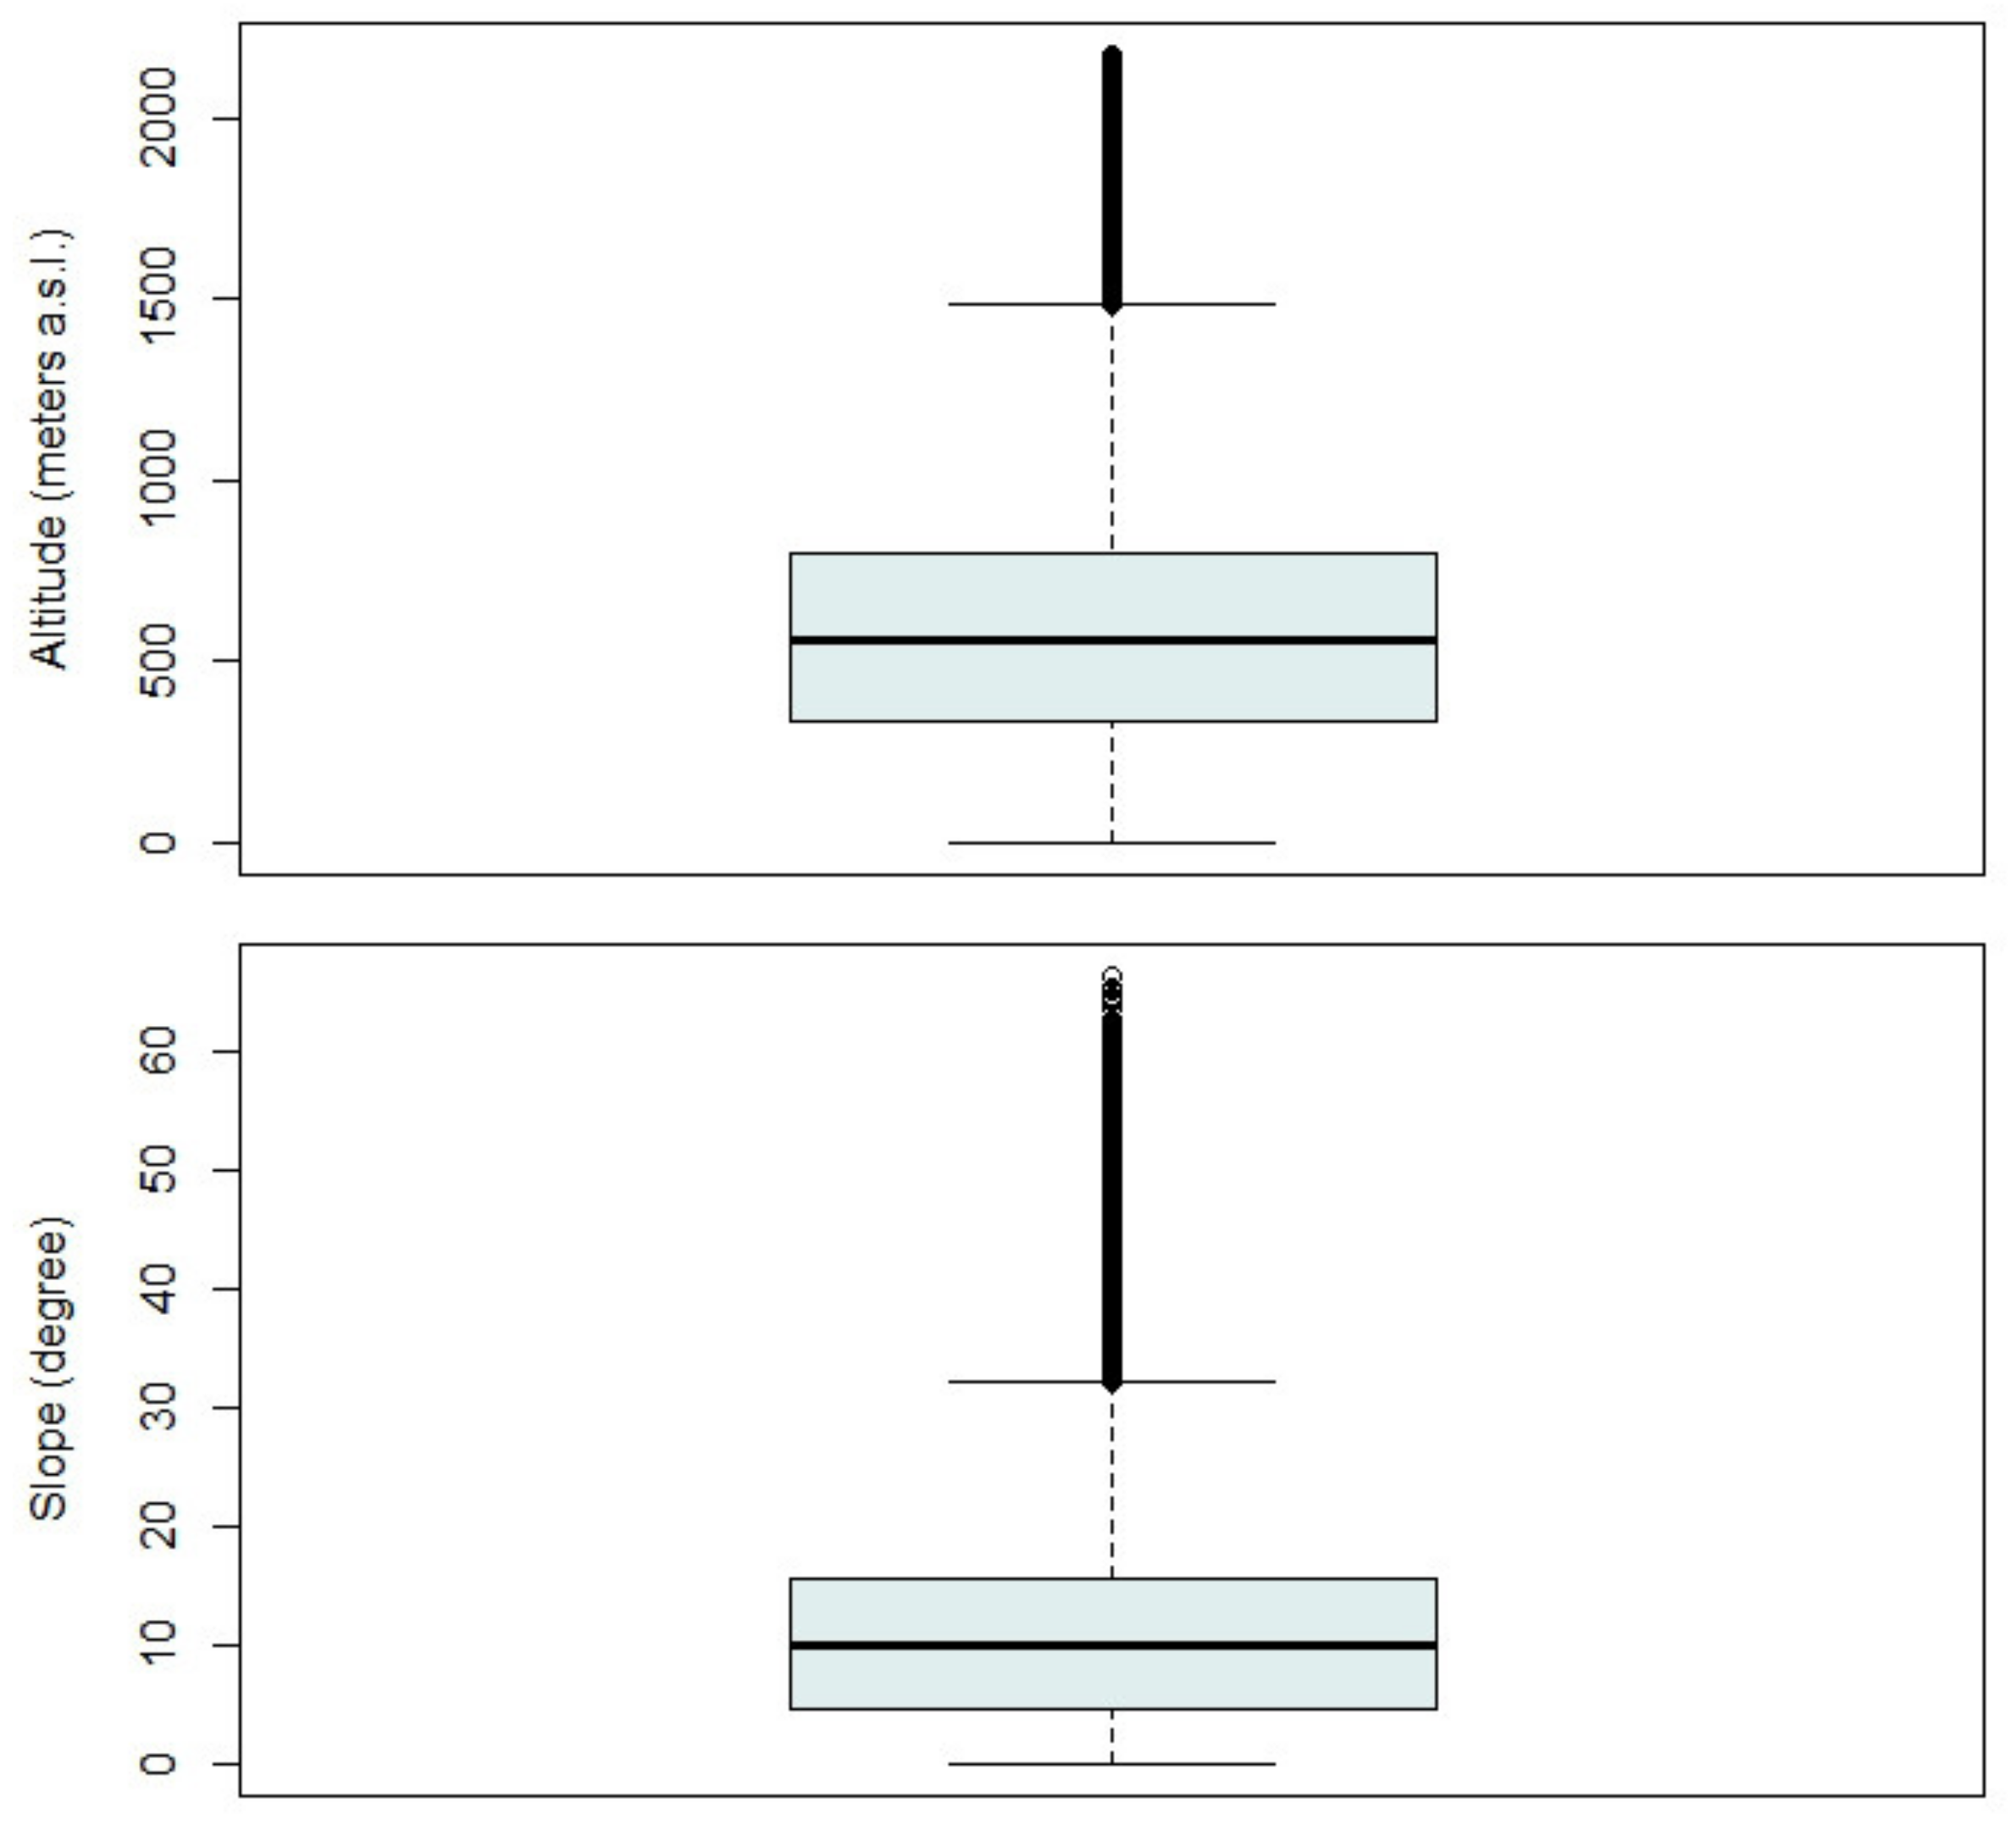
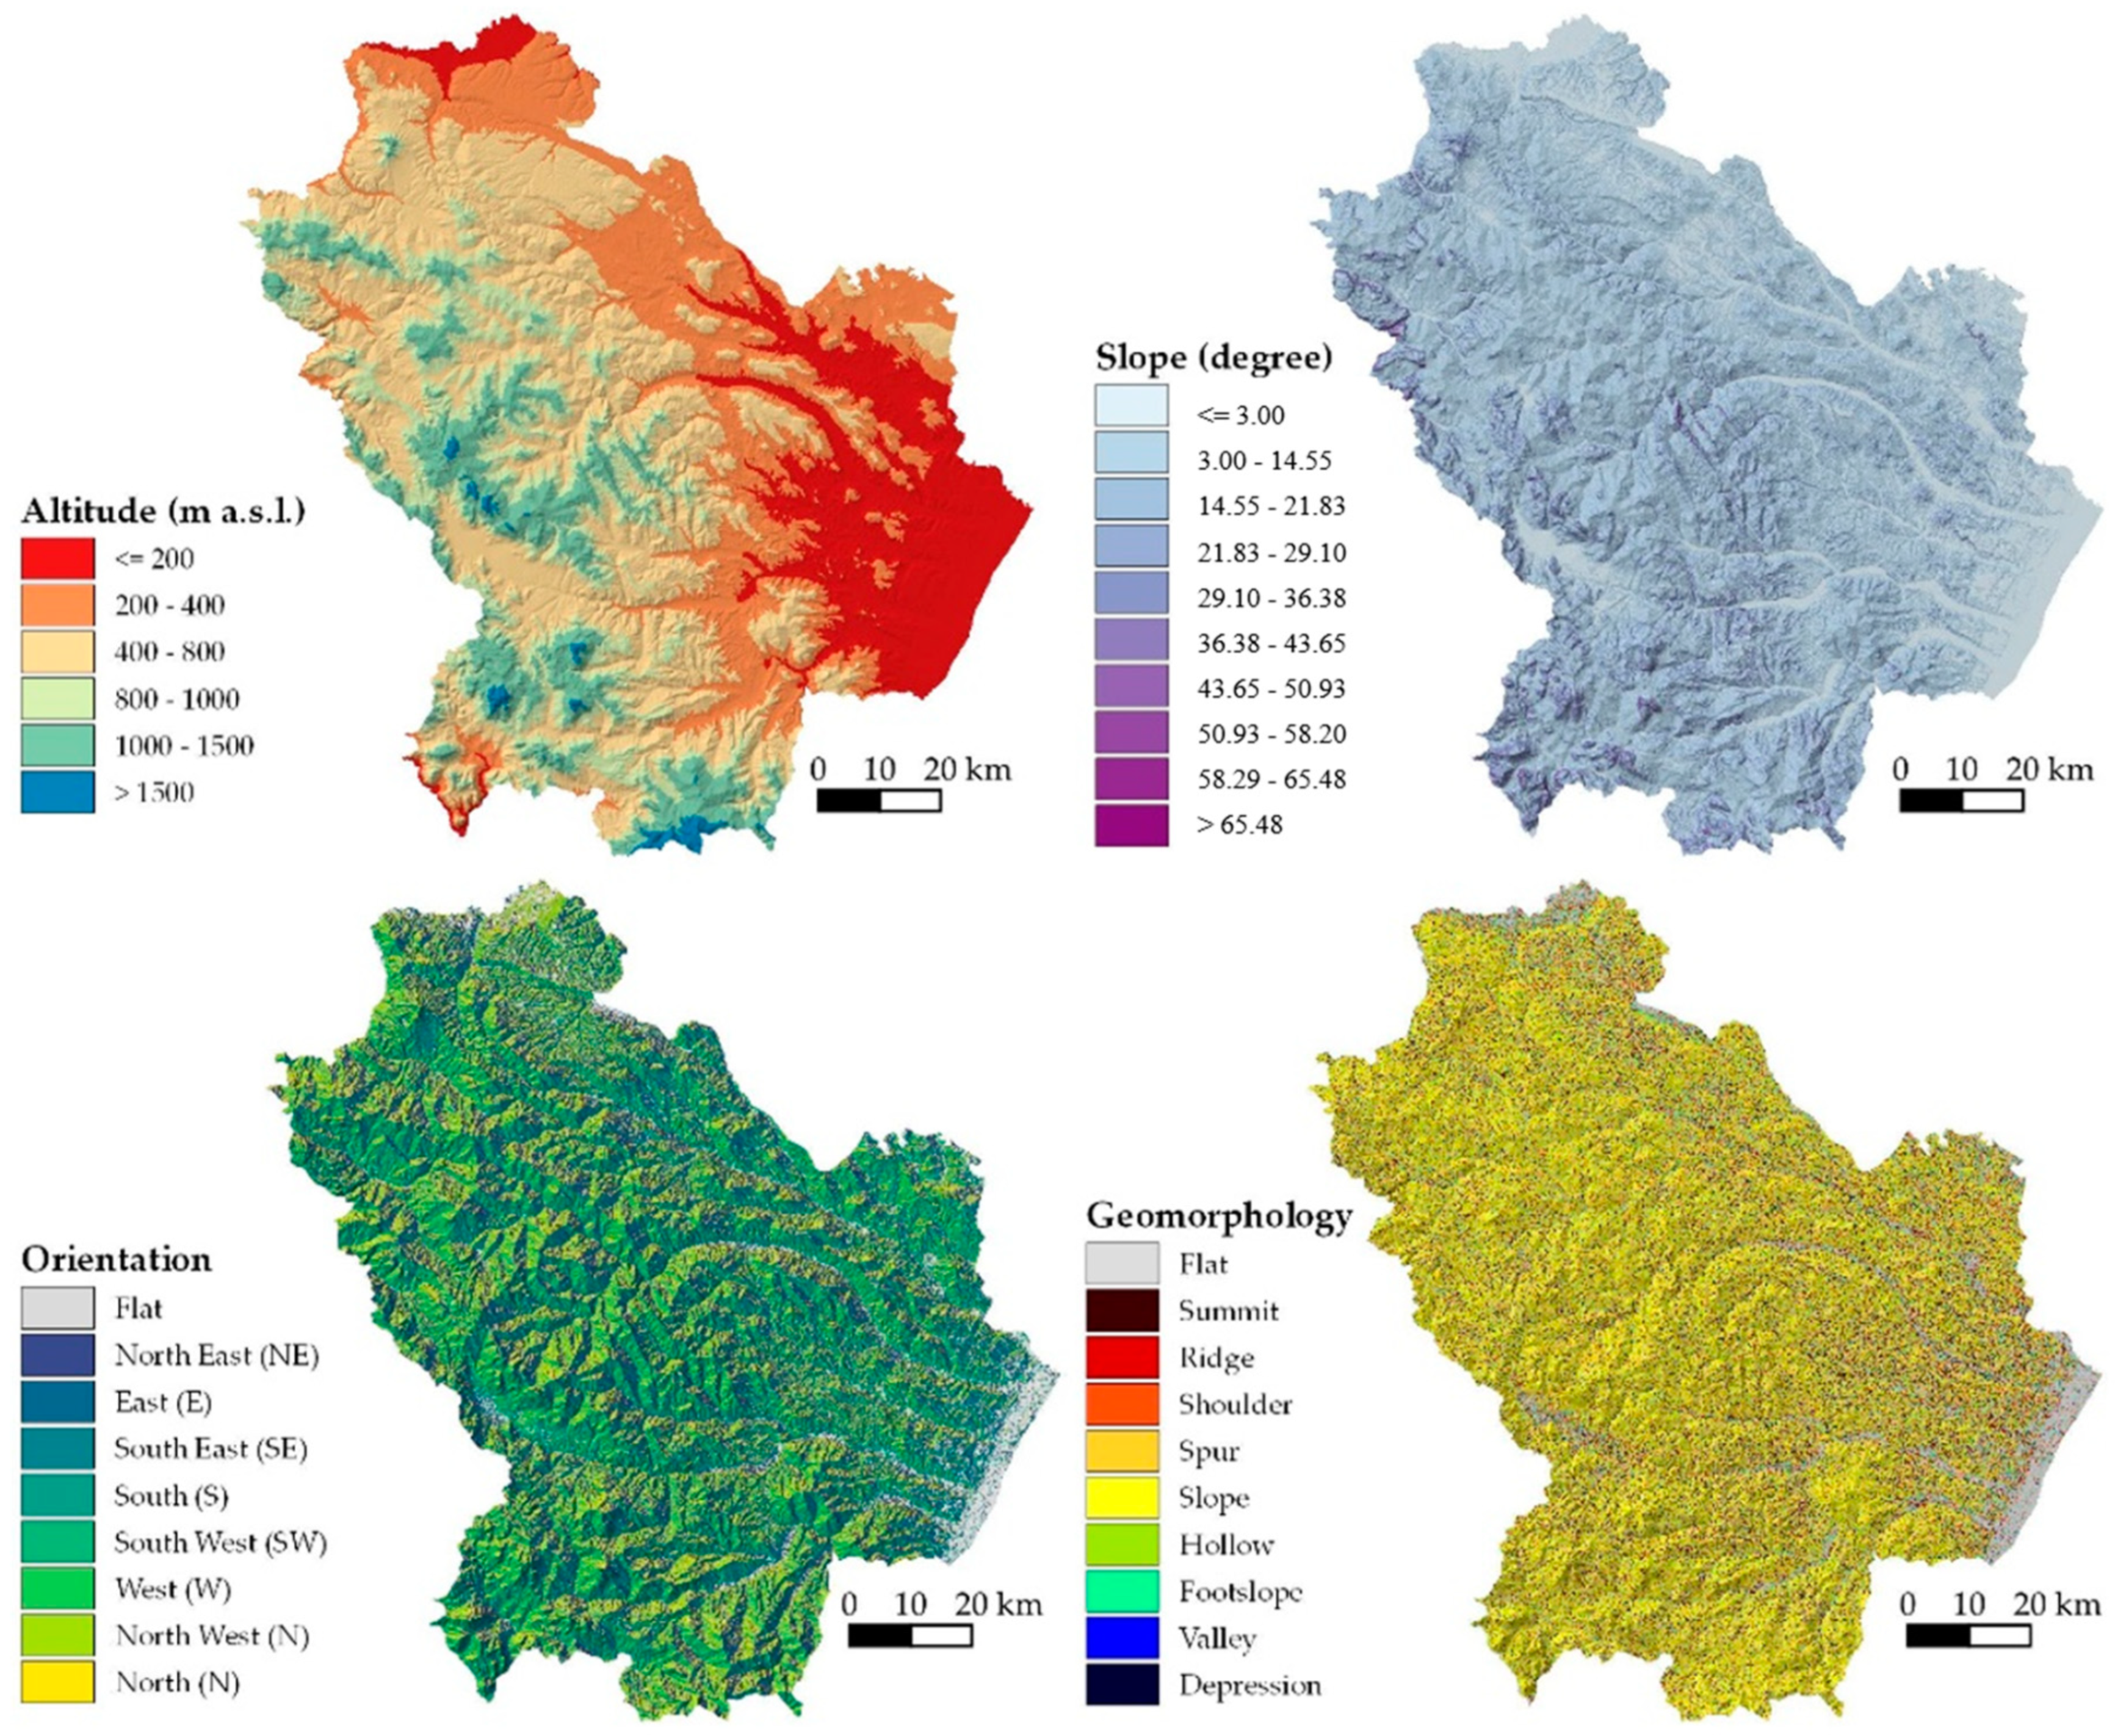
- Altitude (meters a.s.l.) obtained from the digital terrain model (DEM) provided by the National Geoportal [50], with a horizontal pixel resolution of 20 m;
- Slope (degrees) calculated from the DEM through QGIS;
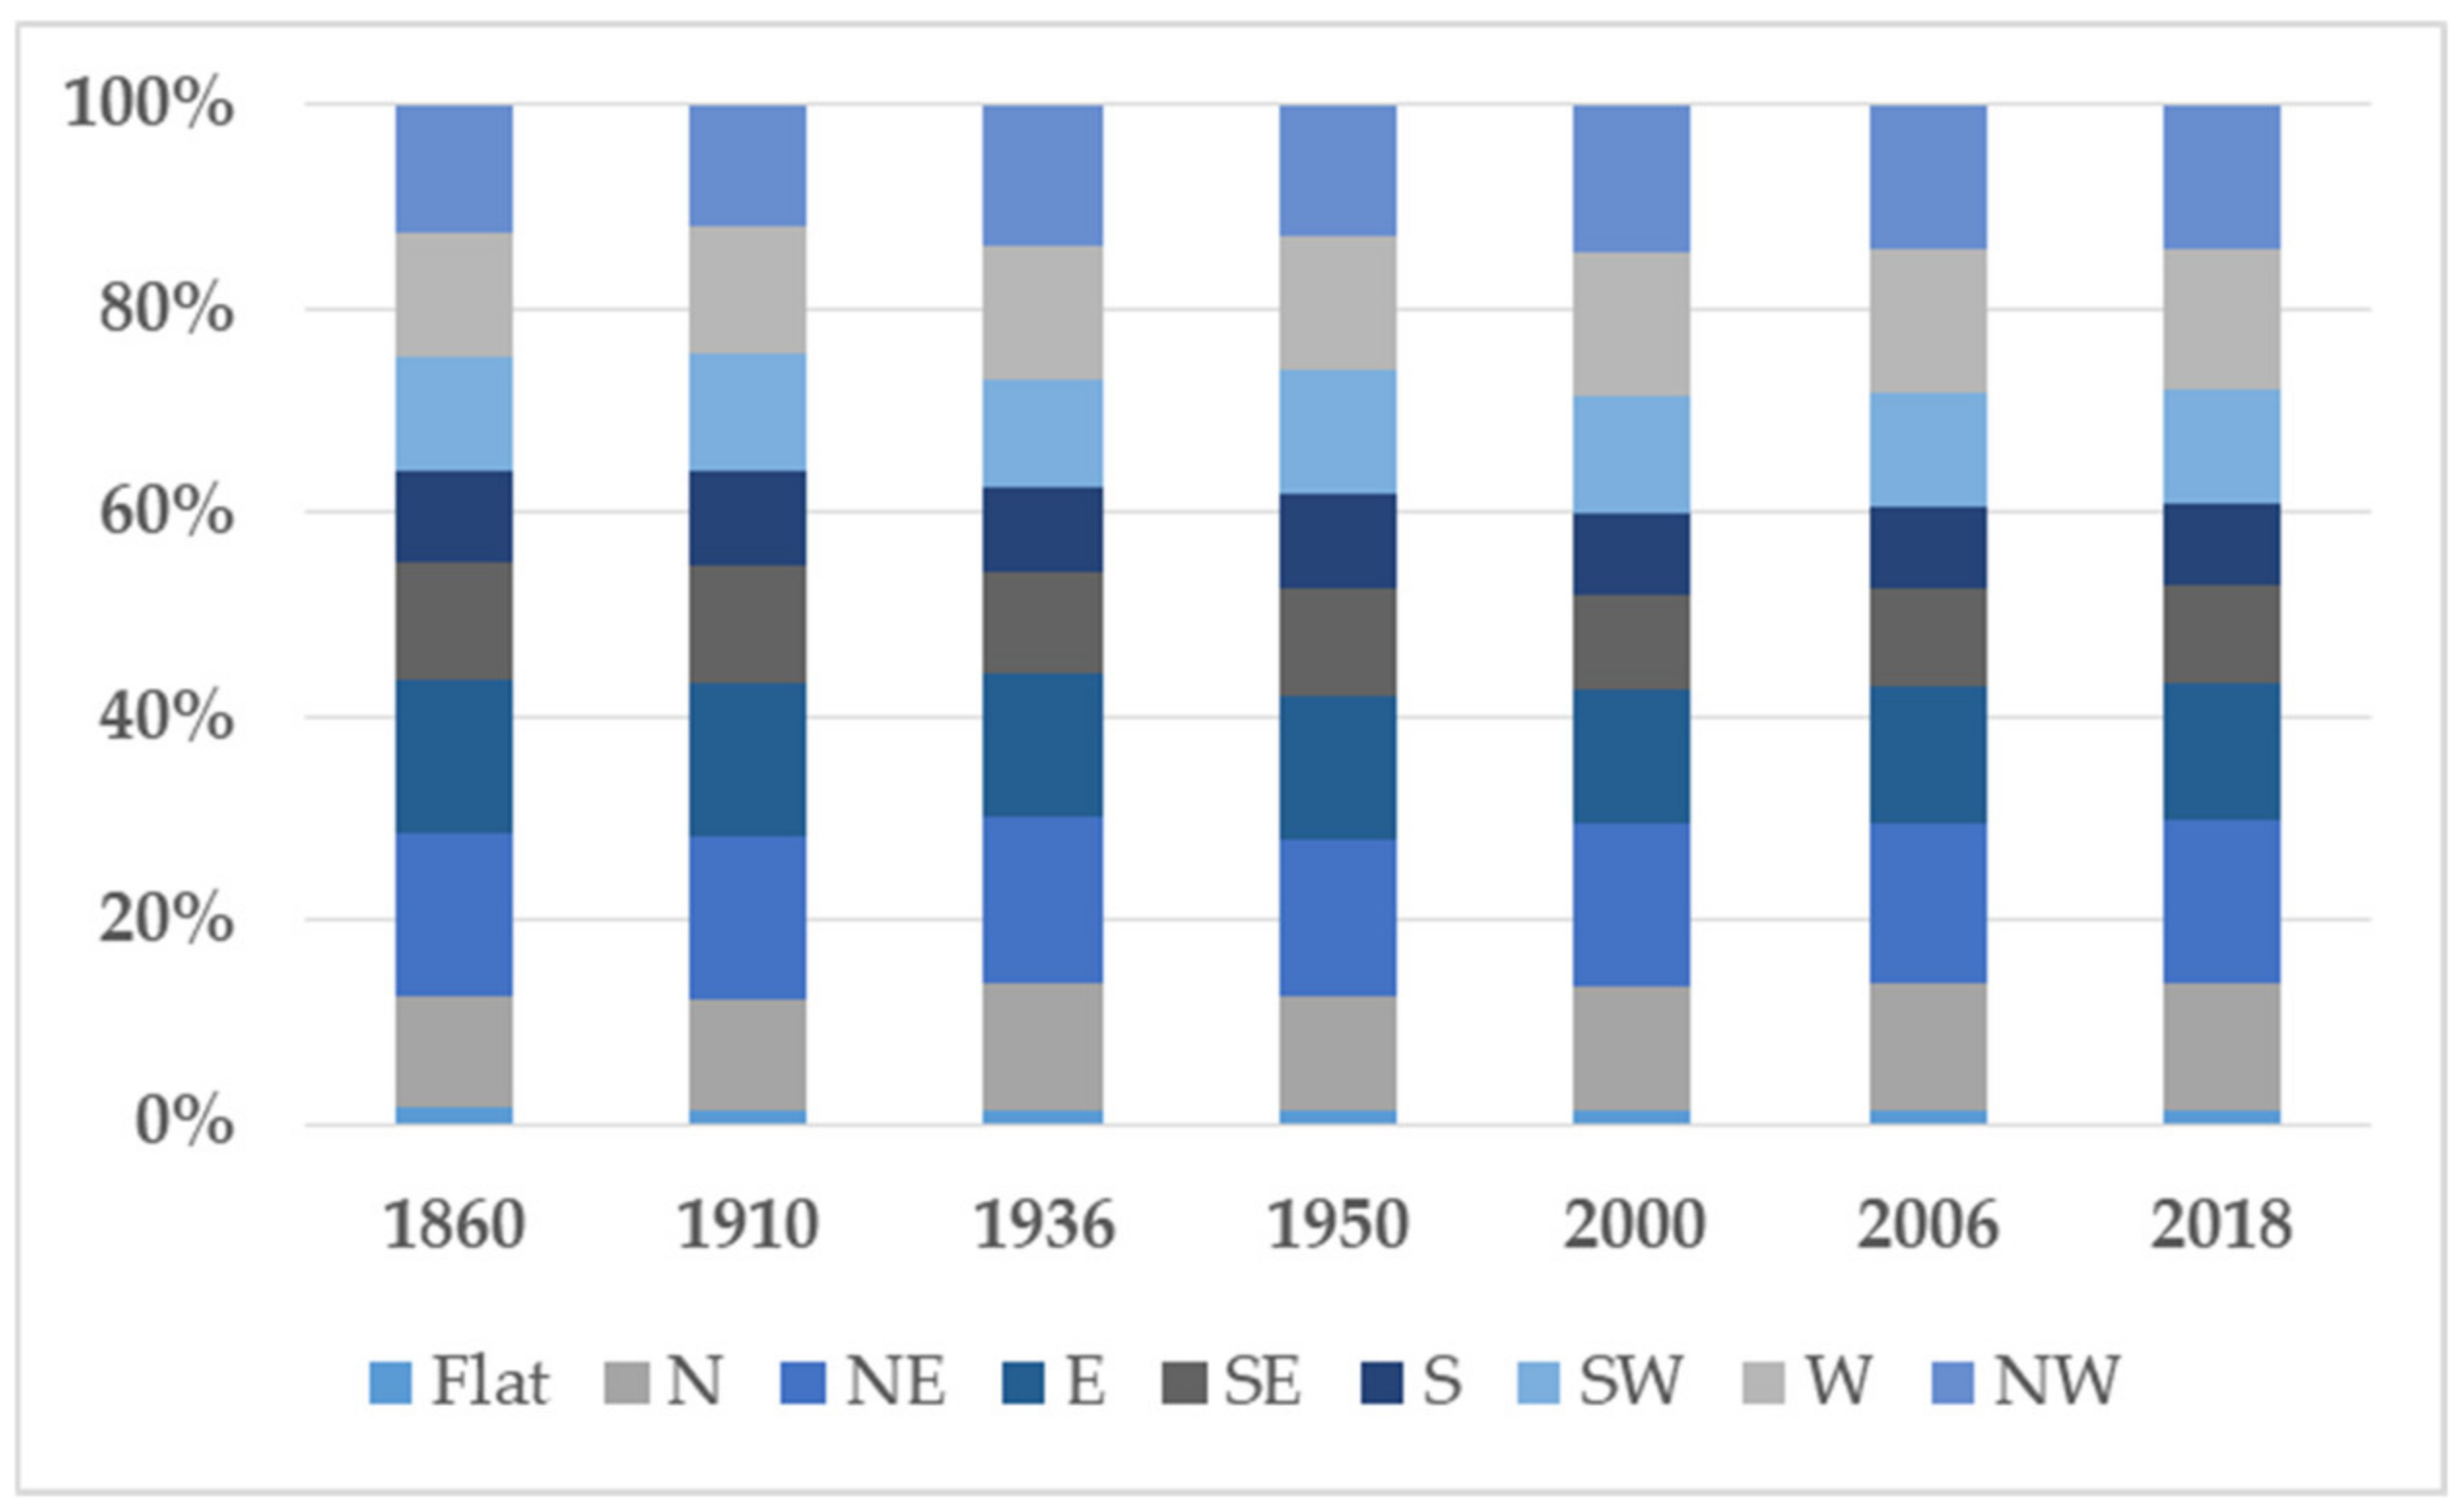
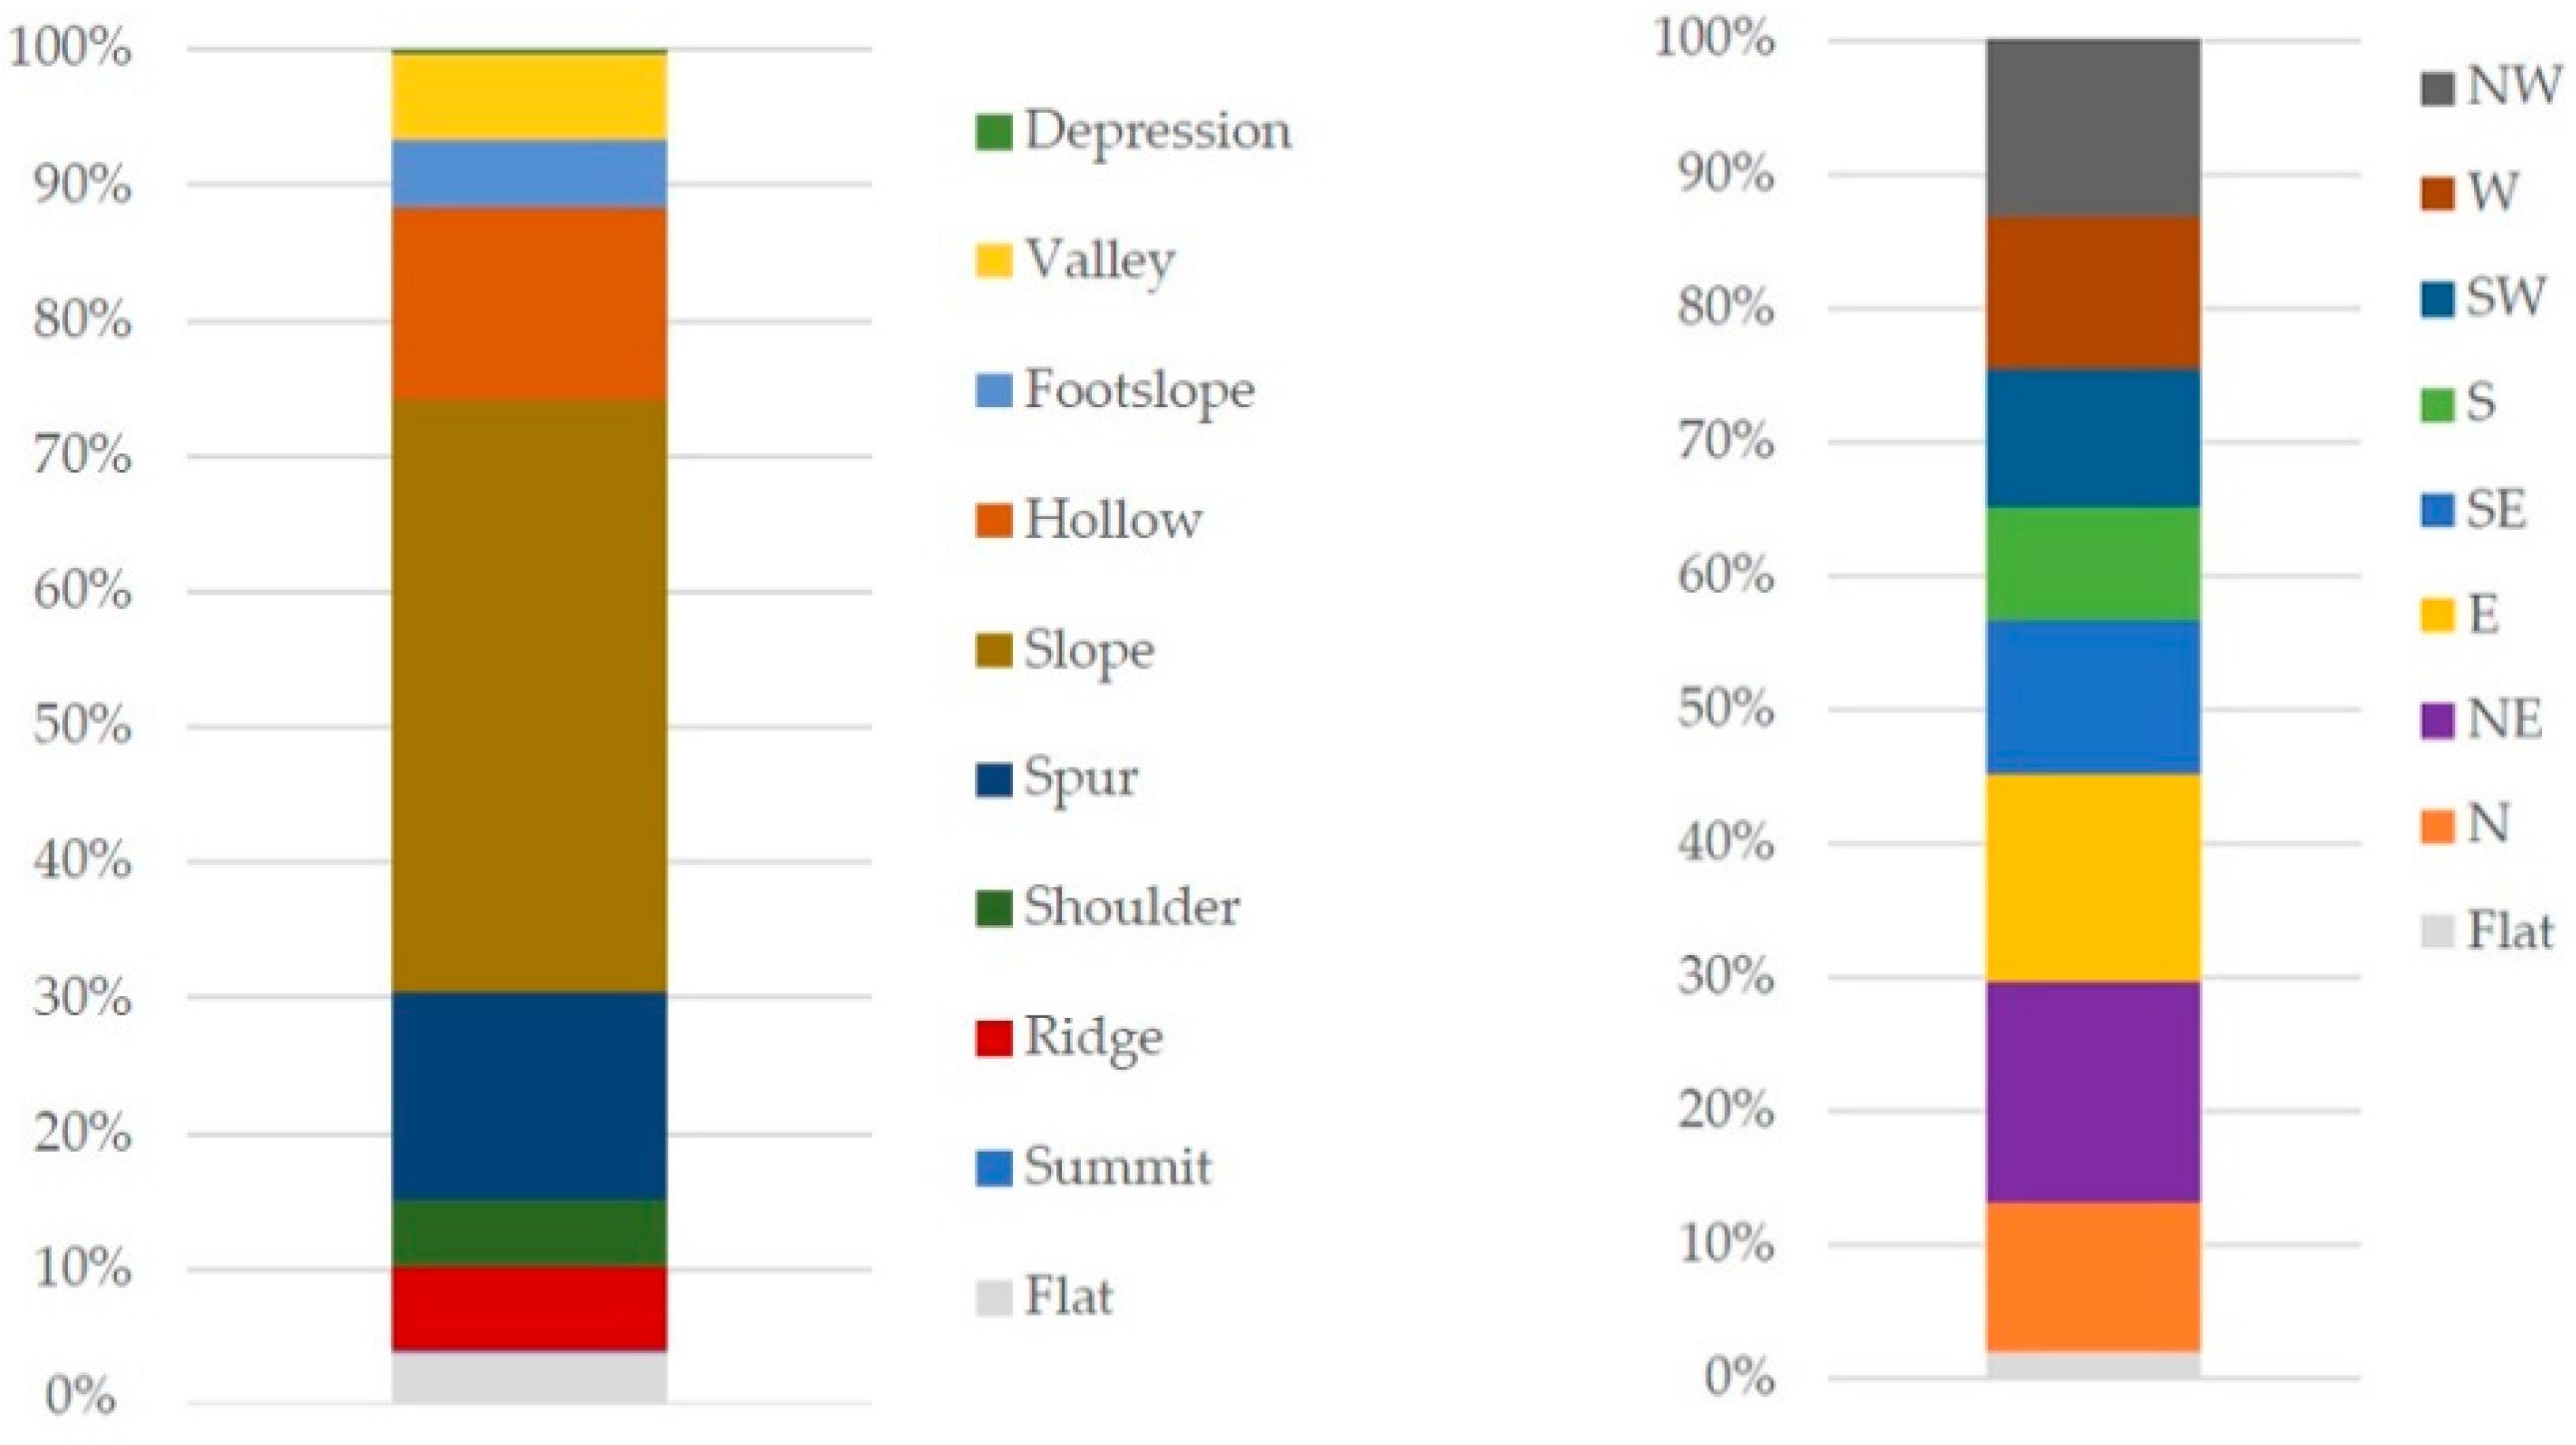
- Orientation, calculated in degrees through QGIS and then reclassified into Flat, N, S, E, W, SE, SW, NE, NW);
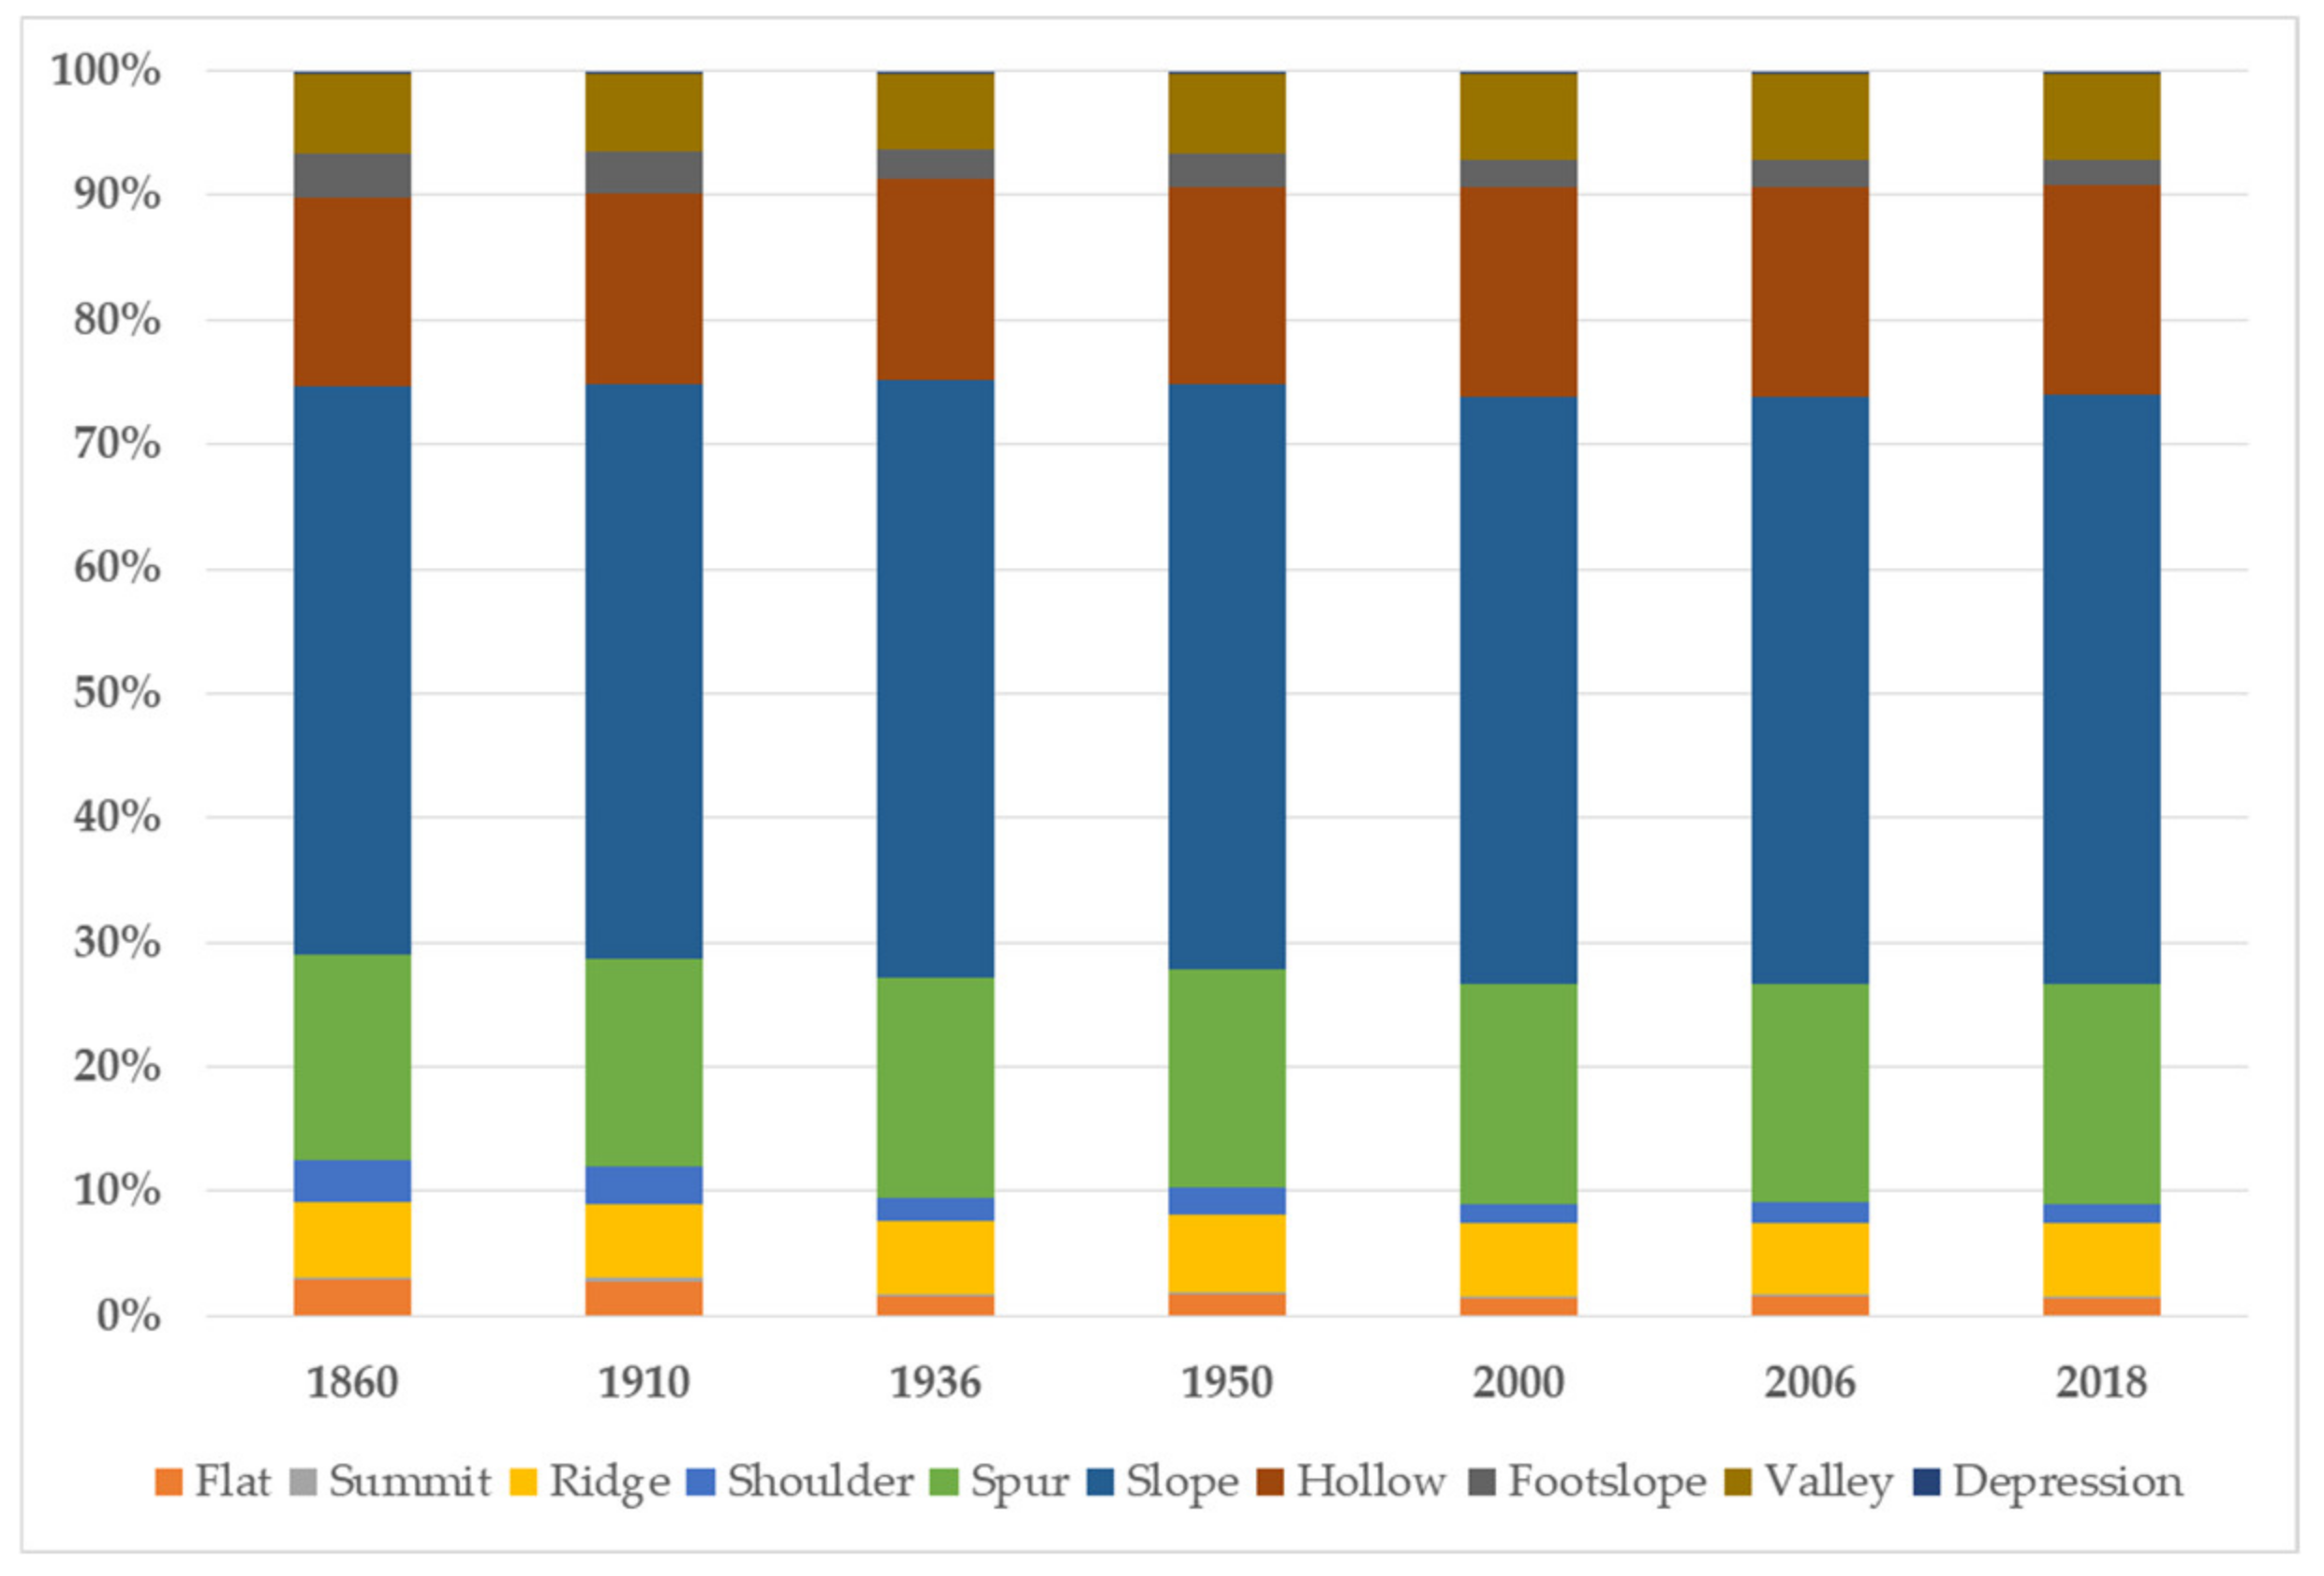
- Geomorphological classes, calculated through the GRASS GIS plugin r.geomorphon, allows using the DEM and setting some specific variables within the plugin to classify the territory into classes defined as flat, summit, ridge, shoulder, spur, slope, hollow, footslope, valley and depression [51,52]. Furthermore, in this case there is a category “Flat”, but it is calculated differently than that of the orientation because it is a different aspect.
3. Results
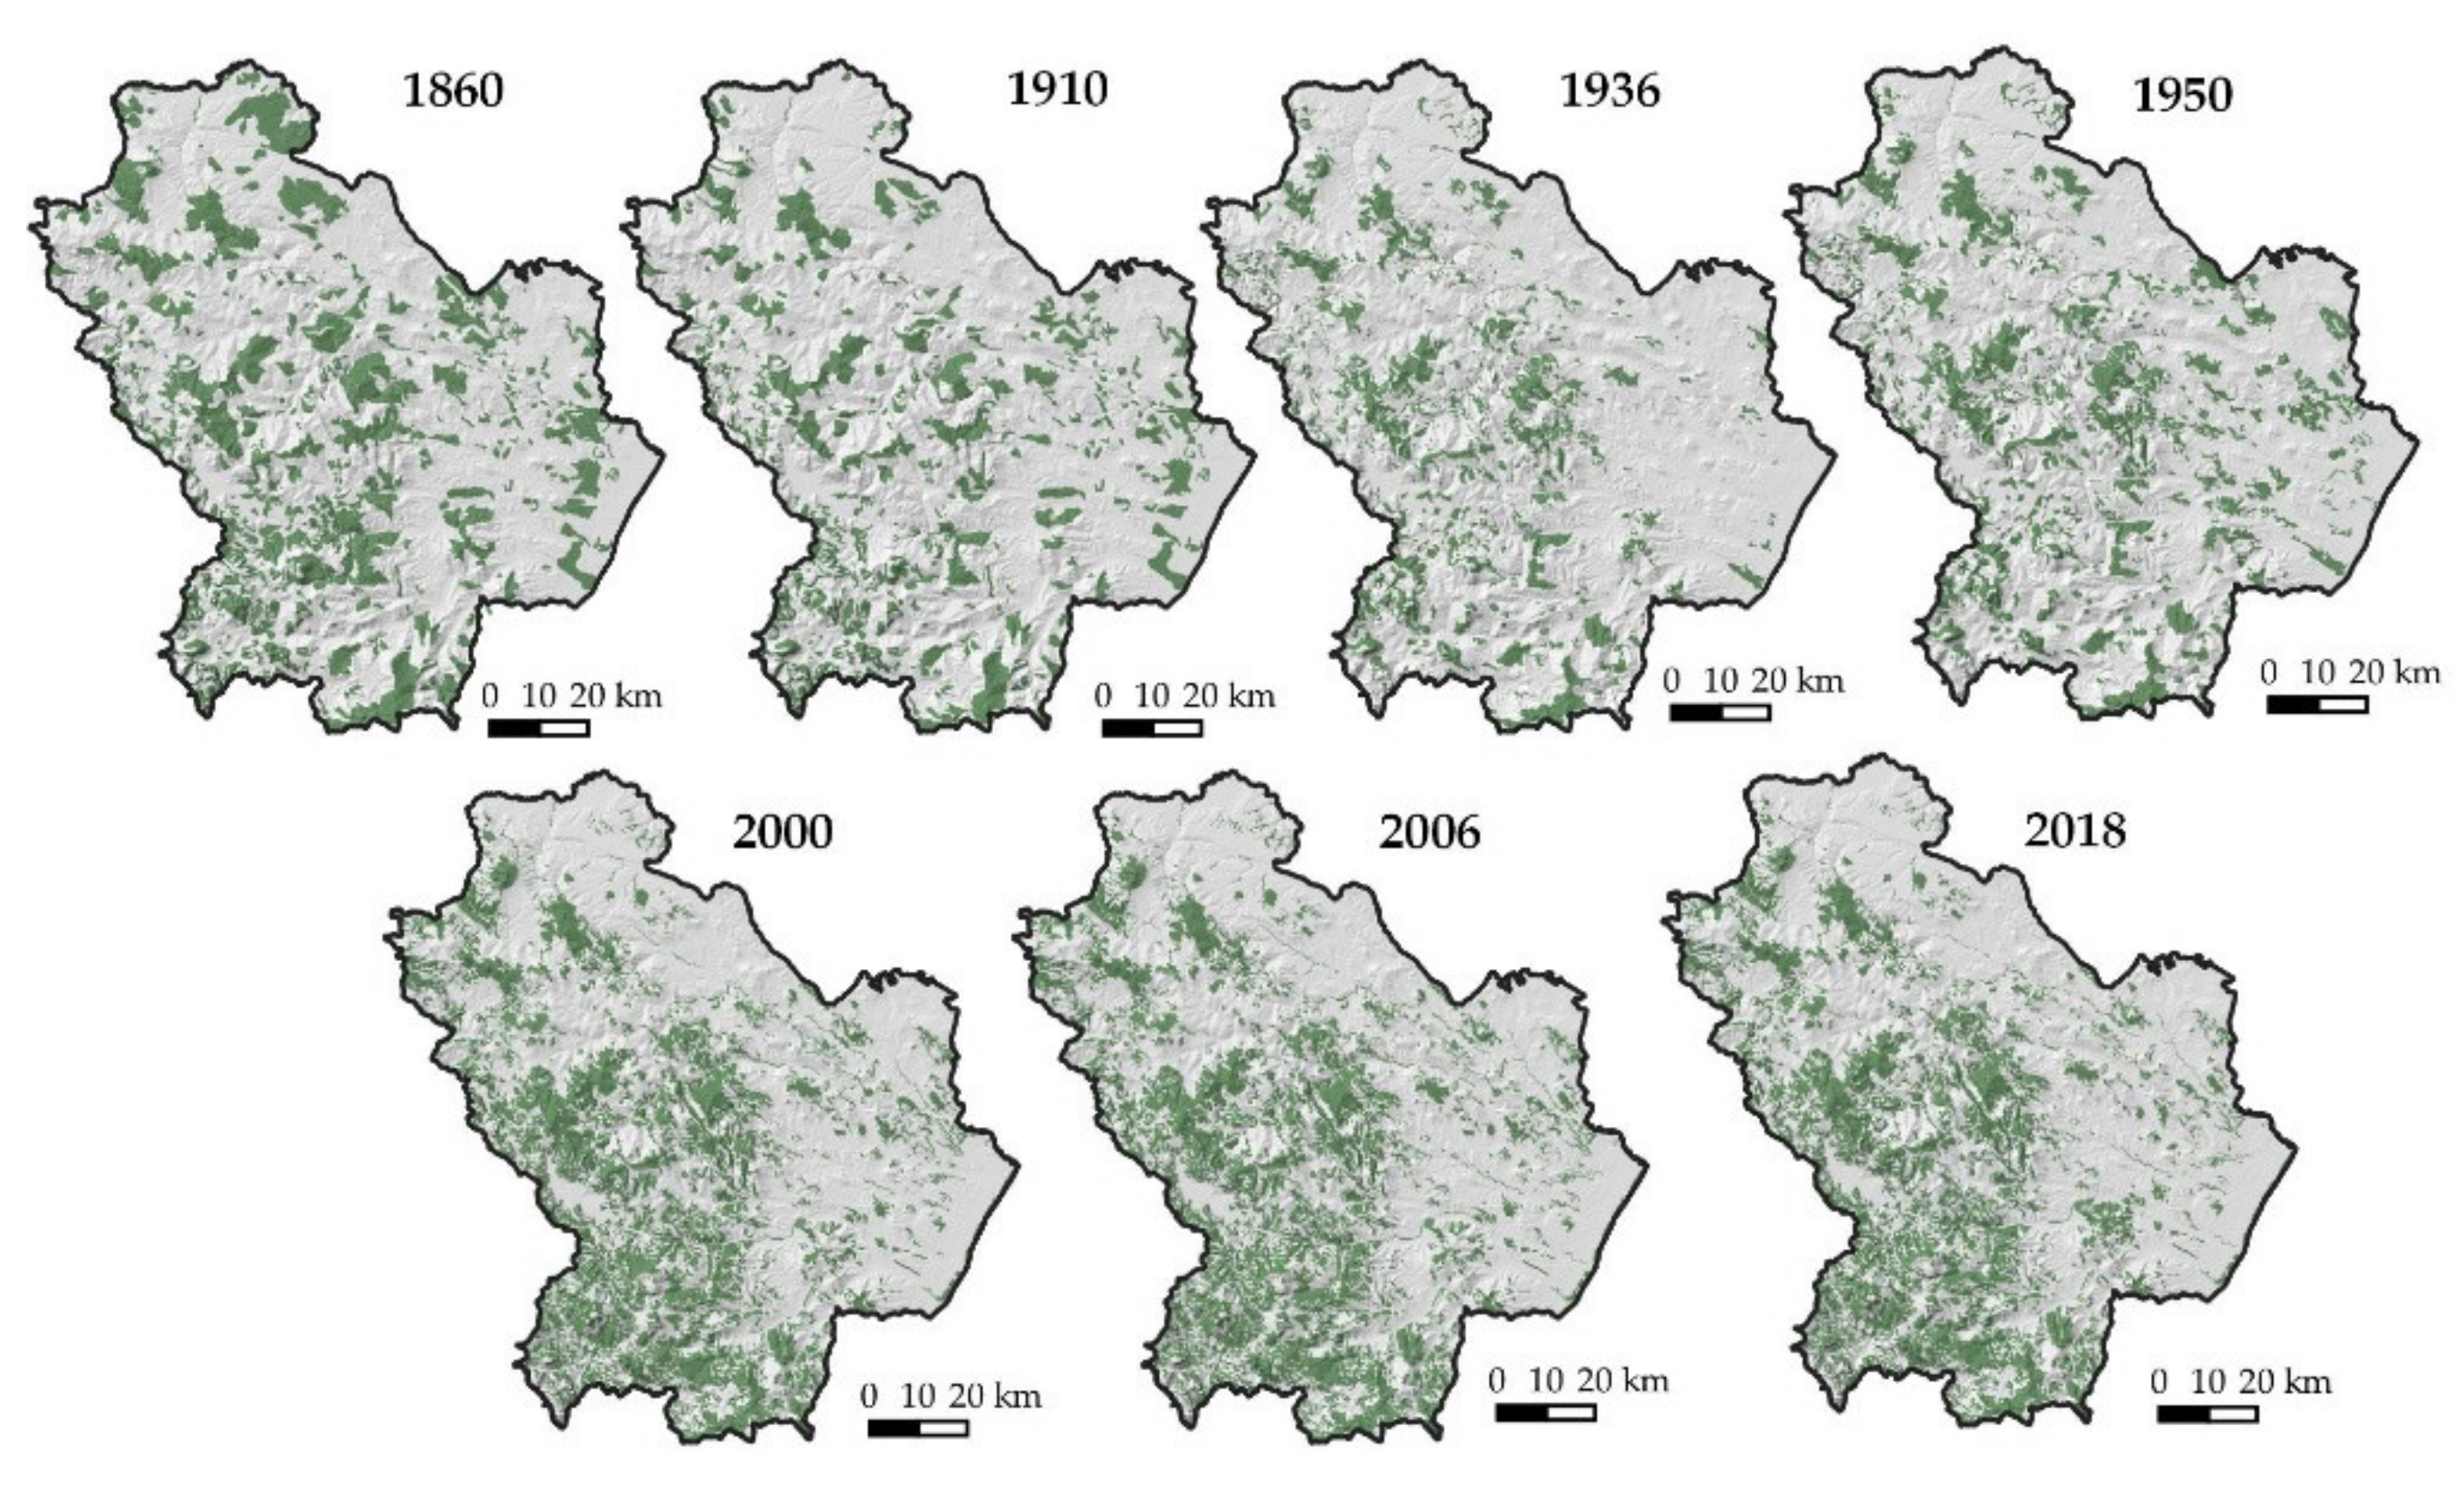
3.1. Forest Cover Dynamics within 158 Years of Analysis
3.2. Analysis of Forests Present before 1950
4. Discussion
4.1. The Transformation Dynamics of Mediterranean Forest Landscapes
4.2. Historical GIS to Understand How Much and Where Forests Have Increased or Decreased in Basilicata Region
5. Conclusions
Author Contributions
Funding
Institutional Review Board Statement
Informed Consent Statement
Data Availability Statement
Conflicts of Interest
References
- Ledda, A.; Pindozzi, S.; Marcheggiani, E.; Cervelli, E.; De Montis, A.; Galli, A. The impact of collaboration on research about rural buildings and landscape: A case study in Italy. Land Use Policy 2020, 97, 104757. [Google Scholar] [CrossRef]
- Serra, P.; Pons, X.; Sauri, D. Land-cover and land-use change in a Mediterranean landscape: A spatial analysis of driving forces integrating biophysical and human factors. Appl. Geogr. 2008, 28, 189–209. [Google Scholar] [CrossRef]
- Mercuri, A.M. Genesis and evolution of the cultural landscape in central Mediterranean: The ‘where, when and how’ through the palynological approach. Landsc. Ecol. 2017, 29, 1799–1810. [Google Scholar] [CrossRef]
- Blondel, J. The ‘design’ of Mediterranean landscapes: A millennial story of humans and ecological systems during the historic period. Hum. Ecol. 2006, 34, 713–729. [Google Scholar] [CrossRef]
- Strollo, A.; Smiraglia, D.; Bruno, R.; Assennato, F.; Congedo, L.; De Fioravante, P.; Giuliani, C.; Marinosci, I.; Riitano, N.; Munafò, M. Land consumption in Italy. J. Maps 2020, 16, 113–123. [Google Scholar] [CrossRef]
- Statuto, D.; Cillis, G.; Picuno, P. Analysis of the effects of agricultural land use change on rural environment and landscape through historical cartography and GIS tools. J. Agric. Eng. 2016, 47, 28–39. [Google Scholar] [CrossRef] [Green Version]
- Malandra, F.; Vitali, A.; Urbinati, C.; Weisberg, P.J.; Garbarino, M. Patterns and drivers of forest landscape change in the Apennines range, Italy. Reg. Environ. Chang. 2019, 19, 1973–1985. [Google Scholar] [CrossRef]
- Turner, B.L.; Meyer, W.B.; Skole, D.L. Global land-use land-cover change—Towards an integrated study. Ambio 1994, 23, 91–95. [Google Scholar] [CrossRef]
- Altieri, M.A.; Nicholls, C.I. The adaptation and mitigation potential of traditional agriculture in a changing climate. Clim. Chang. 2013, 140, 33–45. [Google Scholar] [CrossRef]
- Ledda, A.; Serra, V.; De Montis, A. The effect of rural buildings on landscape fragmentation in Natura 2000 sites: A case study in Sardinia. Sustainability 2019, 11, 4695. [Google Scholar] [CrossRef] [Green Version]
- Santoro, A.; Venturi, M.; Piras, F.; Fiore, B.; Corrieri, F.; Agnoletti, M. Forest area changes in Cinque Terre National Park in the last 80 years. Consequences on landslides and forest fire risks. Land 2021, 10, 293. [Google Scholar] [CrossRef]
- Strijker, D. Marginal lands in Europe—Causes of decline. Basic Appl. Ecol. 2005, 6, 99–106. [Google Scholar] [CrossRef]
- Navarro, L.; Pereira, H.M. Rewilding abandoned landscapes in Europe. Ecosystems 2012, 15, 900–912. [Google Scholar] [CrossRef] [Green Version]
- Van Vliet, J.; de Groot, H.L.; Rietveld, P.; Verburg, P. Manifestations and underlying drivers of agricultural land use change in Europe. Landsc. Urban Plan. 2015, 133, 24–36. [Google Scholar] [CrossRef] [Green Version]
- Garbarino, M.; Morresi, D.; Urbinati, C.; Malandra, F.; Motta, R.; Sibona, E.M.; Vitali, A.; Weisberg, P.J. Contrasting land use legacy effects on forest landscape dynamics in the Italian Alps and the Apennines. Landsc. Ecol. 2020, 35, 2679–2694. [Google Scholar] [CrossRef]
- Cimini, D.; Tomao, A.; Mattioli, W.; Barbati, A.; Corona, P. Assessing impact of forest cover change dynamics on high nature value farmland in Mediterranean mountain landscape. ASR 2013, 37, 29–37. [Google Scholar] [CrossRef]
- Debussche, M.; Lepart, J.; Dervieux, A. Mediterranean landscape changes: Evidence from old postcards. Glob. Ecol. Biogeogr. 1999, 8, 3–15. [Google Scholar] [CrossRef]
- Macdonald, D.; Crabtree, J.R.; Wiesinger, G.; Dax, T.; Stamou, N.; Fleury, P.; Lazpita, J.; Gibon, A. Agricultural abandonment in mountain areas of Europe: Environmental consequences and policy response. J. Environ. Manag. 2000, 59, 47–69. [Google Scholar] [CrossRef]
- Améztegui, A.; Brotons, L.; Coll, L. Land-use changes as major drivers of mountain pine (Pinus uncinata Ram.) expansion in the Pyrenees. Glob. Ecol. Biogeogr. 2010, 19, 632–641. [Google Scholar] [CrossRef] [Green Version]
- Perpiña Castillo, C.; Kavalov, B.; Diogo, V.; Jacobs-Crisioni, C.; Batista e Silva, F.; Lavalle, C. Agricultural Land Abandonment in the EU within 2015–2030; JRC113718; European Commission: Brussels, Belgium, 2018. [Google Scholar]
- Tattoni, C.; Ciolli, M.; Ferretti, F.; Cantiani, M. Monitoring spatial and temporal pattern of Paneveggio forest (northern Italy) from 1859 to 2006. iForest 2010, 3, 72–80. [Google Scholar] [CrossRef]
- Assini, S.; Filipponi, F.; Zucca, F. Land cover changes in an abandoned agricultural land in the Northern Apennine (Italy) between 1954 and 2008: Spatio-temporal dynamics. Plant Biosyst. Int. J. Deal. All Asp. Plant Biol. 2014, 149, 807–817. [Google Scholar] [CrossRef]
- Malandra, F.; Vitali, A.; Urbinati, C.; Garbarino, M. 70 years of land use/land cover changes in the Apennines (Italy): A meta-Analysis. Forests 2018, 9, 551. [Google Scholar] [CrossRef] [Green Version]
- Gillespie, M.A.K.; Baude, M.; Biesmeijer, J.; Boatman, N.; Budge, G.E.; Crowe, A.; Memmott, J.; Morton, R.D.; Pietravalle, S.; Potts, S.G.; et al. A method for the objective selection of landscape-scale study regions and sites at the national level. Methods Ecol. Evol. 2017, 8, 1468–1476. [Google Scholar] [CrossRef] [Green Version]
- Bielecka, E. GIS spatial analysis modeling for land use change. A bibliometric analysis of the intellectual base and trends. Geosciences 2020, 10, 421. [Google Scholar] [CrossRef]
- Cillis, G.; Statuto, D.; Picuno, P. Integrating remote-sensed and historical geodata to assess interactions between rural buildings and agroforestry land. J. Environ. Eng. Landsc. Manag. 2021, 29, 229–243. [Google Scholar] [CrossRef]
- Statuto, D.; Cillis, G.; Picuno, P. GIS-based analysis of temporal evolution of rural landscape: A case study in Southern Italy. Nat. Resour. Res. 2019, 28, 61–75. [Google Scholar] [CrossRef]
- Modica, G.; Praticò, S.; Laudari, L.; Ledda, A.; Di Fazio, S.; De Montis, A. Implementation of multispecies ecological networks at the regional scale: Analysis and multi-temporal assessment. J. Environ. Manag. 2021, 289. [Google Scholar] [CrossRef] [PubMed]
- Dai Prà, E. APSAT 9: Cartografia Storica e Paesaggi in Trentino: Approcci Geostorici; Società Archeologica Padana: Mantova, Italy, 2013. [Google Scholar]
- Dai Prà, E. For a new applied historical geography: Prolegomena to a center for the study, the enhancement and the active fruition of historical cartography. Boll. Assoc. Ital. Cartogr. 2018, 162, 108–122. [Google Scholar]
- Amici, V.; Maccherini, S.; Santi, E.; Torri, D.; Vergari, F.; Del Monte, M. Long-term patterns of change in a vanishing cultural landscape: A GIS-based assessment. Ecol. Inform. 2017, 37, 38–51. [Google Scholar] [CrossRef]
- Brovelli, M.A.; Wu, H.; Minghini, M.; Molinari, M.E.; Kilsedar, C.E.; Zheng, X.; Shu, P.; Chen, J. Open source software and open educational material on land cover maps intercomparison and validation. ISPRS Int. Arch. Photogramm. Remote Sens. Spat. Inf. Sci. 2018, XLII-4, 61–68. [Google Scholar] [CrossRef] [Green Version]
- Gizzi, F.T.; Proto, M.; Potenza, M.R. The Basilicata region (Southern Italy): A natural and ‘human-built’ open-air laboratory for manifold studies. Research trends over the last 24 years (1994–2017). Geomat. Nat. Hazards Risk 2019, 10, 433–464. [Google Scholar] [CrossRef]
- Conte, A.L.; Di Pietro, R.; Iamonico, D.; Di Marzio, P.; Cillis, G.; Lucia, D.; Fortini, P. Oak decline in the Mediterranean basin: A study case from the southern Apennines (Italy). Plant Sociol. 2019, 56, 69–80. [Google Scholar]
- Coluzzi, R.; Fascetti, S.; Imbrenda, V.; Italiano, S.S.P.; Ripullone, F.; Lanfredi, M. Exploring the use of sentinel-2 data to monitor heterogeneous effects of contextual drought and heatwaves on Mediterranean forests. Land 2020, 9, 325. [Google Scholar] [CrossRef]
- Borghetti, M.; Moretti, N. Basilicata, terra di boschi e studi forestali. Forest 2020, 17, 1–16. [Google Scholar] [CrossRef] [Green Version]
- Statuto, D.; Cillis, G.; Picuno, P. Visual quality indicators for assessing landscape characteristics and managing its protection. In Proceedings of the Public Recreation and Landscape Protection—With Sense Hand in Hand? Křtiny, Czech Republic, 13–15 May 2019; pp. 476–480. Available online: https://www.researchgate.net/publication/333192079_VISUAL_QUALITY_INDICATORS_FOR_ASSESSING_LANDSCAPE_CHARACTERISTICS_AND_MANAGING_ITS_PROTECTION (accessed on 24 April 2021).
- Picuno, P.; Cillis, G.; Statuto, D. Investigating the time evolution of a rural landscape: How historical maps may provide environmental information when processed using a GIS. Ecol. Eng. 2019, 139C, 105580. [Google Scholar] [CrossRef]
- Basilicata Region. Sistemi Ambientali e Rete Natura 2000 della Regione Basilicata: Scoprire e Proteggere gli Ambienti Naturali e i Paesaggi Culturali della Lucania. 2015. Available online: http://www.retecologicabasilicata.it/ambiente/site/portal/section.jsp?sec=109915 (accessed on 22 June 2021).
- Cillis, G.; Statuto, D.; Picuno, P. Historical maps processed into a GIS for the assessment of forest landscape dynamics. In Proceedings of the Public Recreation and Landscape Protection—With Sense Hand in Hand? Krtiny, Czech Republic, 13–15 May 2019; pp. 180–184. [Google Scholar]
- Cillis, G.; Statuto, D.; Picuno, P. A GIS-based approach to monitor and asses historical forest landscape evolution. In Proceedings of the Public Recreation and Landscape Protection—With Sense Hand in Hand! Conference, Krtiny, Czech Republic, 10–11 May 2021; pp. 16–20. [Google Scholar]
- QGIS Development Team. QGIS Geographic Information System. Open Source Geospatial Foundation Project. 2021. Available online: http://qgis.osgeo.org (accessed on 21 February 2021).
- Loran, C.; Haegi, S.; Ginzler, C. Comparing historical and contemporary maps—A methodological framework for a cartographic map comparison applied to Swiss maps. Int. J. Geogr. Inf. Sci. 2018, 32, 2123–2139. [Google Scholar] [CrossRef]
- Tichy, F. Die Wälder der Basilicata und die Entwaldung im 19. Jahrhundert. Vorgänge, Ursachen und Folgen; Keysersche Verlagsbuchhandlung: Heidelberg, Germany, 1962. [Google Scholar]
- Statuto, D.; Cillis, G.; Picuno, P. Using historical maps within a GIS to analyze two centuries of rural landscape changes in Southern Italy. Land 2017, 6, 65. [Google Scholar] [CrossRef] [Green Version]
- Ferretti, F.; Sboarina, C.; Tattoni, C.; Vitti, A.; Zatelli, P.; Geri, F.; Pompei, E.; Ciolli, M. The 1936 Italian Kingdom forest map reviewed: A dataset for landscape and ecological research. Ann. Silvic. Res. 2018, 42, 3–19. [Google Scholar]
- European Union, Copernicus Land Monitoring Service 2021; European Environment Agency (EEA). Available online: https://land.copernicus.eu/pan-european/corine-land-cover (accessed on 15 January 2021).
- GIMP Development Team. GIMP. Available online: https://www.gimp.org (accessed on 10 June 2021).
- ISPRA. Carta della Natura. Available online: https://www.isprambiente.gov.it/it/servizi/sistema-carta-della-natura (accessed on 8 January 2021).
- Peña-Angulo, D.; Khorchani, M.; Errea, P.; Lasanta, T.; Martínez-Arnáiz, M.; Nadal-Romero, E. Factors explaining the diversity of land cover in abandoned fields in a Mediterranean mountain area. CATENA 2019, 181. [Google Scholar] [CrossRef]
- MATTM. Geopartale Nazionale. 2021. Available online: http://www.pcn.minambiente.it/mattm/ (accessed on 2 February 2021).
- Stepinski, T.; Jasiewicz, J.; Hengl, T.; Evans, I.S.; Wilson, J.P.; Gould, M. Geomorphons—A new approach to classification of landform. In Proceedings of the Geomorphometry Conference, Redlands, CA, USA, 7–11 September 2011; pp. 109–112. [Google Scholar]
- Jasiewicz, J.; Stepinski, T.F. Geomorphons—A pattern recognition approach to classification and mapping of landforms. Geomorphology 2013, 182, 147–156. [Google Scholar] [CrossRef]
- Cuba, N. Research note: Sankey diagrams for visualizing land cover dynamics. Landsc. Urban Plan. 2015, 139, 163–167. [Google Scholar] [CrossRef]
- Palmero-Iniesta, M.; Pino, J.; Pesquer, L.; Espelta, J.M. Recent forest area increase in Europe: Expanding and regenerating forests differ in their regional patterns, drivers and productivity trends. Eur. J. For. Res. 2021. [Google Scholar] [CrossRef]
- FAO. Global Forest Resources Assessment 2020; Food and Agriculture Organization of the United Nations (FAO): Rome, Italy, 2020. [Google Scholar]
- Endress, B.A.; Chinea, J.D. Landscape patterns of tropical forest recovery in the Republic of Palau. Biotropica 2001, 33, 555–565. [Google Scholar] [CrossRef]
- García-Ruiz, J.; Lasanta, T.; Nadal-Romero, E.; Lana-Renault, N.; Álvarez-Farizo, B. Rewilding and restoring cultural landscapes in Mediterranean mountains: Opportunities and challenges. Land Use Policy 2019, 99. [Google Scholar] [CrossRef]
- Geri, F.; Rocchini, D.; Chiarucci, A. Landscape metrics and topographical determinants of large-scale forest dynamics in a Mediterranean landscape. Landsc. Urban Plan. 2010, 95, 46–53. [Google Scholar] [CrossRef]
- Chazdon, R.L.; Brancalion, P.H.S.; Laestadius, L.; Bennett-Curry, A.; Buckingham, K.; Kumar, C.; Moll-Rocek, J.; Vieira, I.C.G.; Wilson, S.J. When is a forest a forest? Forest concepts and definitions in the era of forest and landscape restoration. Ambio 2016, 45, 538–550. [Google Scholar] [CrossRef] [PubMed]
- Marongiu, S.; Gismondi, R. Le problematiche delle statistiche forestali e le prospettive future. Un inquadramento delle indagini ISTAT nel nuovo PSN 2017–2019. L’Italia For. Mont. 2018, 73, 79–90. [Google Scholar] [CrossRef]
- D’Amico, G.; Vangi, E.; Francini, S.; Giannetti, F.; Nicolaci, A.; Travaglini, D.; Massai, L.; Giambastiani, Y.; Terranova, C.; Chirici, G. Are we ready for a National Forest Information System? State of the art of forest maps and airborne laser scanning data availability in Italy. iForest 2021, 14, 144–154. [Google Scholar] [CrossRef]
- Pindozzi, S.; Cervelli, E.; Capolupo, A.; Okello, C.; Boccia, L. Using historical maps to analyze two hundred years of land cover changes: Case study of Sorrento peninsula (south Italy). Cartogr. Geogr. Inf. Sci. 2016, 43, 250–265. [Google Scholar] [CrossRef]
- Lelli, C.; Nascimbene, J.; Alberti, D.; Agostini, N.; Zoccola, A.; Piovesan, G.; Chiarucci, A. Long-term changes in Italian mountain forests detected by resurvey of historical vegetation data. J. Veg. Sci. 2020, 32, 1. [Google Scholar] [CrossRef]
- Amici, V.; Santi, E.; Filibeck, G.; Diekmann, M.; Geri, F.; Landi, S.; Scoppola, A.; Chiarucci, A. Influence of secondary forest succession on plant diversity patterns in a Mediterranean landscape. J. Biogeogr. 2013, 40, 2335–2347. [Google Scholar] [CrossRef]
- Henne, P.D.; Elkin, C.; Franke, J.; Colombaroli, D.; Calò, C.; La Mantia, T.; Pasta, S.; Conedera, M.; Dermody, O.; Tinner, W. Reviving extinct Mediterranean forest communities may improve ecosystem potential in a warmer future. Front. Ecol. Environ. 2015, 13, 356–362. [Google Scholar] [CrossRef] [Green Version]
- Monaco, A.L.L.; Luziatelli, G.; Latterini, F.; Tavankar, F.; Picchio, R. Structure and dynamics of deadwood in pine and oak stands and their role in CO2 sequestration in lowland forests of Central Italy. Forests 2020, 11, 253. [Google Scholar] [CrossRef] [Green Version]
- Lechner, A.M.; Foody, G.M.; Boyd, D.S. Applications in remote sensing to forest ecology and management. One Earth 2020, 2, 405–412. [Google Scholar] [CrossRef]
- Recanatesi, F.; Giuliani, C.; Ripa, M.N. Monitoring Mediterranean oak decline in a peri-urban protected area using the NDVI and sentinel-2 images: The case study of Castelporziano State Natural Reserve. Sustainability 2018, 10, 3308. [Google Scholar] [CrossRef] [Green Version]
- Cillis, G.; Statuto, D.; Picuno, P. Vernacular farm buildings and rural landscape: A geospatial approach for their integrated management. Sustainability 2019, 12, 4. [Google Scholar] [CrossRef] [Green Version]
- Ostafin, K.; Iwanowski, M.; Kozak, J.; Cacko, A.; Gimmi, U.; Kaim, D.; Psomas, A.; Ginzler, C.; Ostapowicz, K. Forest cover mask from historical topographic maps based on image processing. Geosci. Data J. 2017, 1, 29–39. [Google Scholar] [CrossRef] [Green Version]
- Sobala, M. Do historical maps show the maximal anthropopressure in the Carpathians? J. Mt. Sci. 2021, 18. [Google Scholar] [CrossRef]
- Cervelli, E.; Di Perta, E.S.; Pindozzi, S. Identification of marginal landscapes as support for sustainable development: GIS-based analysis and landscape metrics assessment in Southern Italy areas. Sustainability 2020, 12, 5400. [Google Scholar] [CrossRef]
- Piras, F.; Venturi, M.; Corrieri, F.; Santoro, A.; Agnoletti, M. Forest surface changes and cultural values: The forests of Tuscany (Italy) in the last century. Forests 2021, 12, 531. [Google Scholar] [CrossRef]


| N. | Title | Year | Source | Typology | Hard Copy/Digital | Brief Description |
|---|---|---|---|---|---|---|
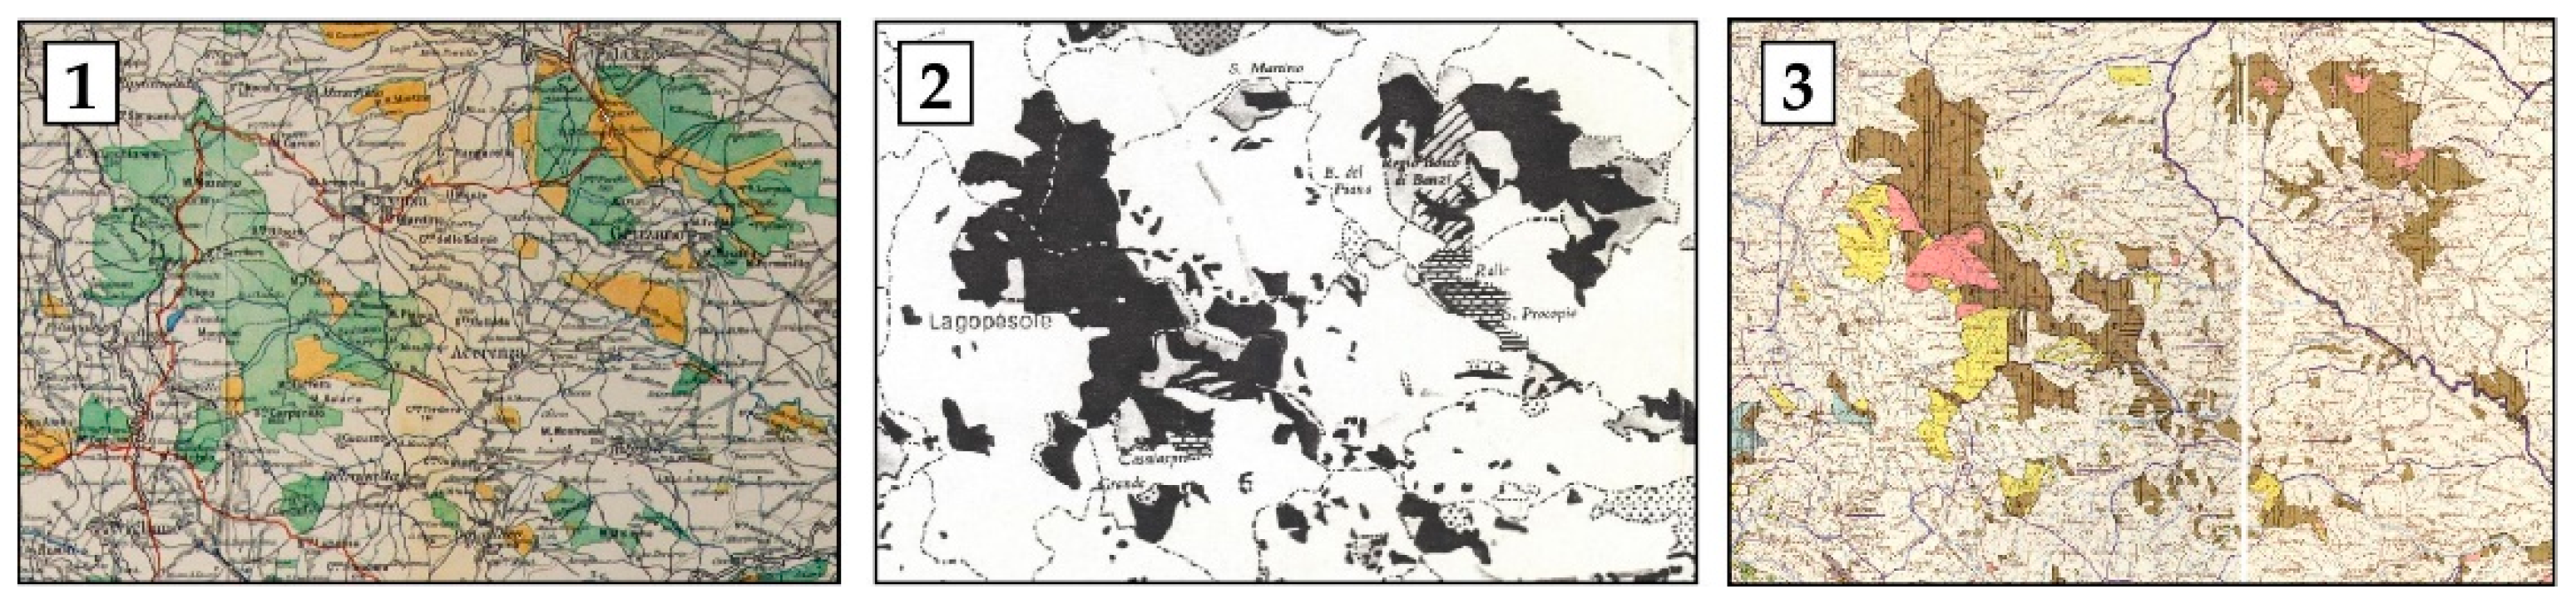
| 1 | Il territorio per immagini: Atlante della Basilicata–Cartografia a stampa moderna–Istituto grafico italiano, 1987 | 1860, 1910 | National Library, Potenza, Italy | Topographic map with themes. Scale 1:250,000 | Hard copy | Representation of areas with existing forests in Basilicata region in 1860 and 1910, and deforested areas |
| 2 | Die Wälder der Basilicata und die Entwaldung im 19. Jahrhundert. Vorgänge, Ursachen und Folgen. Heidelberger Geographische Arbeiten 8, Tichy F. [43] | 1860, 1936, 1950 | University of Basilicata, SAFE—School of Agricultural, Forest, Food and Environmental Science | Thematic map. Scale 1:100,000 | Hard copy | Representation of the forest areas, deforested for different periods for the whole Basilicata region |
| 3 | Carta forestale del Regno d’Italia, 1936—Milizia Forestale | 1936 | http://carta1936.dicam.unitn.it/ (accessed on 1 July 2021) | Topographic map with themes. Scale 1:50,000 | Digital vector file | Forest map with indications on species and form of management for the whole of Italy |
| 4 | CORINE Land Cover (CLC) inventory | 2000, 2006, 2018 | https://land.copernicus.eu/pan-european/corine-land-cover (accessed on 1 July 2021) (European Union, 2018) | Thematic digital map | Digital vector file | Land cover map according to CORINE land cover standards |
| Characteristics | CLC2000 | CLC2006 | CLC2018 |
|---|---|---|---|
| Satellite | Landsat-7 ETM single date | SPOT-4/5 and IRS P6 LISS III | Sentinel-2 and Landsat-8 for corrections |
| Temporal reference | 2000 ± 1 year | 2006 ± 1 year | 2017–2018 |
| Satellite image Spatial accuracy | ≤25 m | ≤25 m | ≤10 m (Sentinel-2) |
| Minimum mapping unit/width | 25 ha/100 m | 25 ha/100 m | 25 ha/100 m |
| CLC Spatial accuracy | less than 100 m | less than 100 m | less than 100 m |
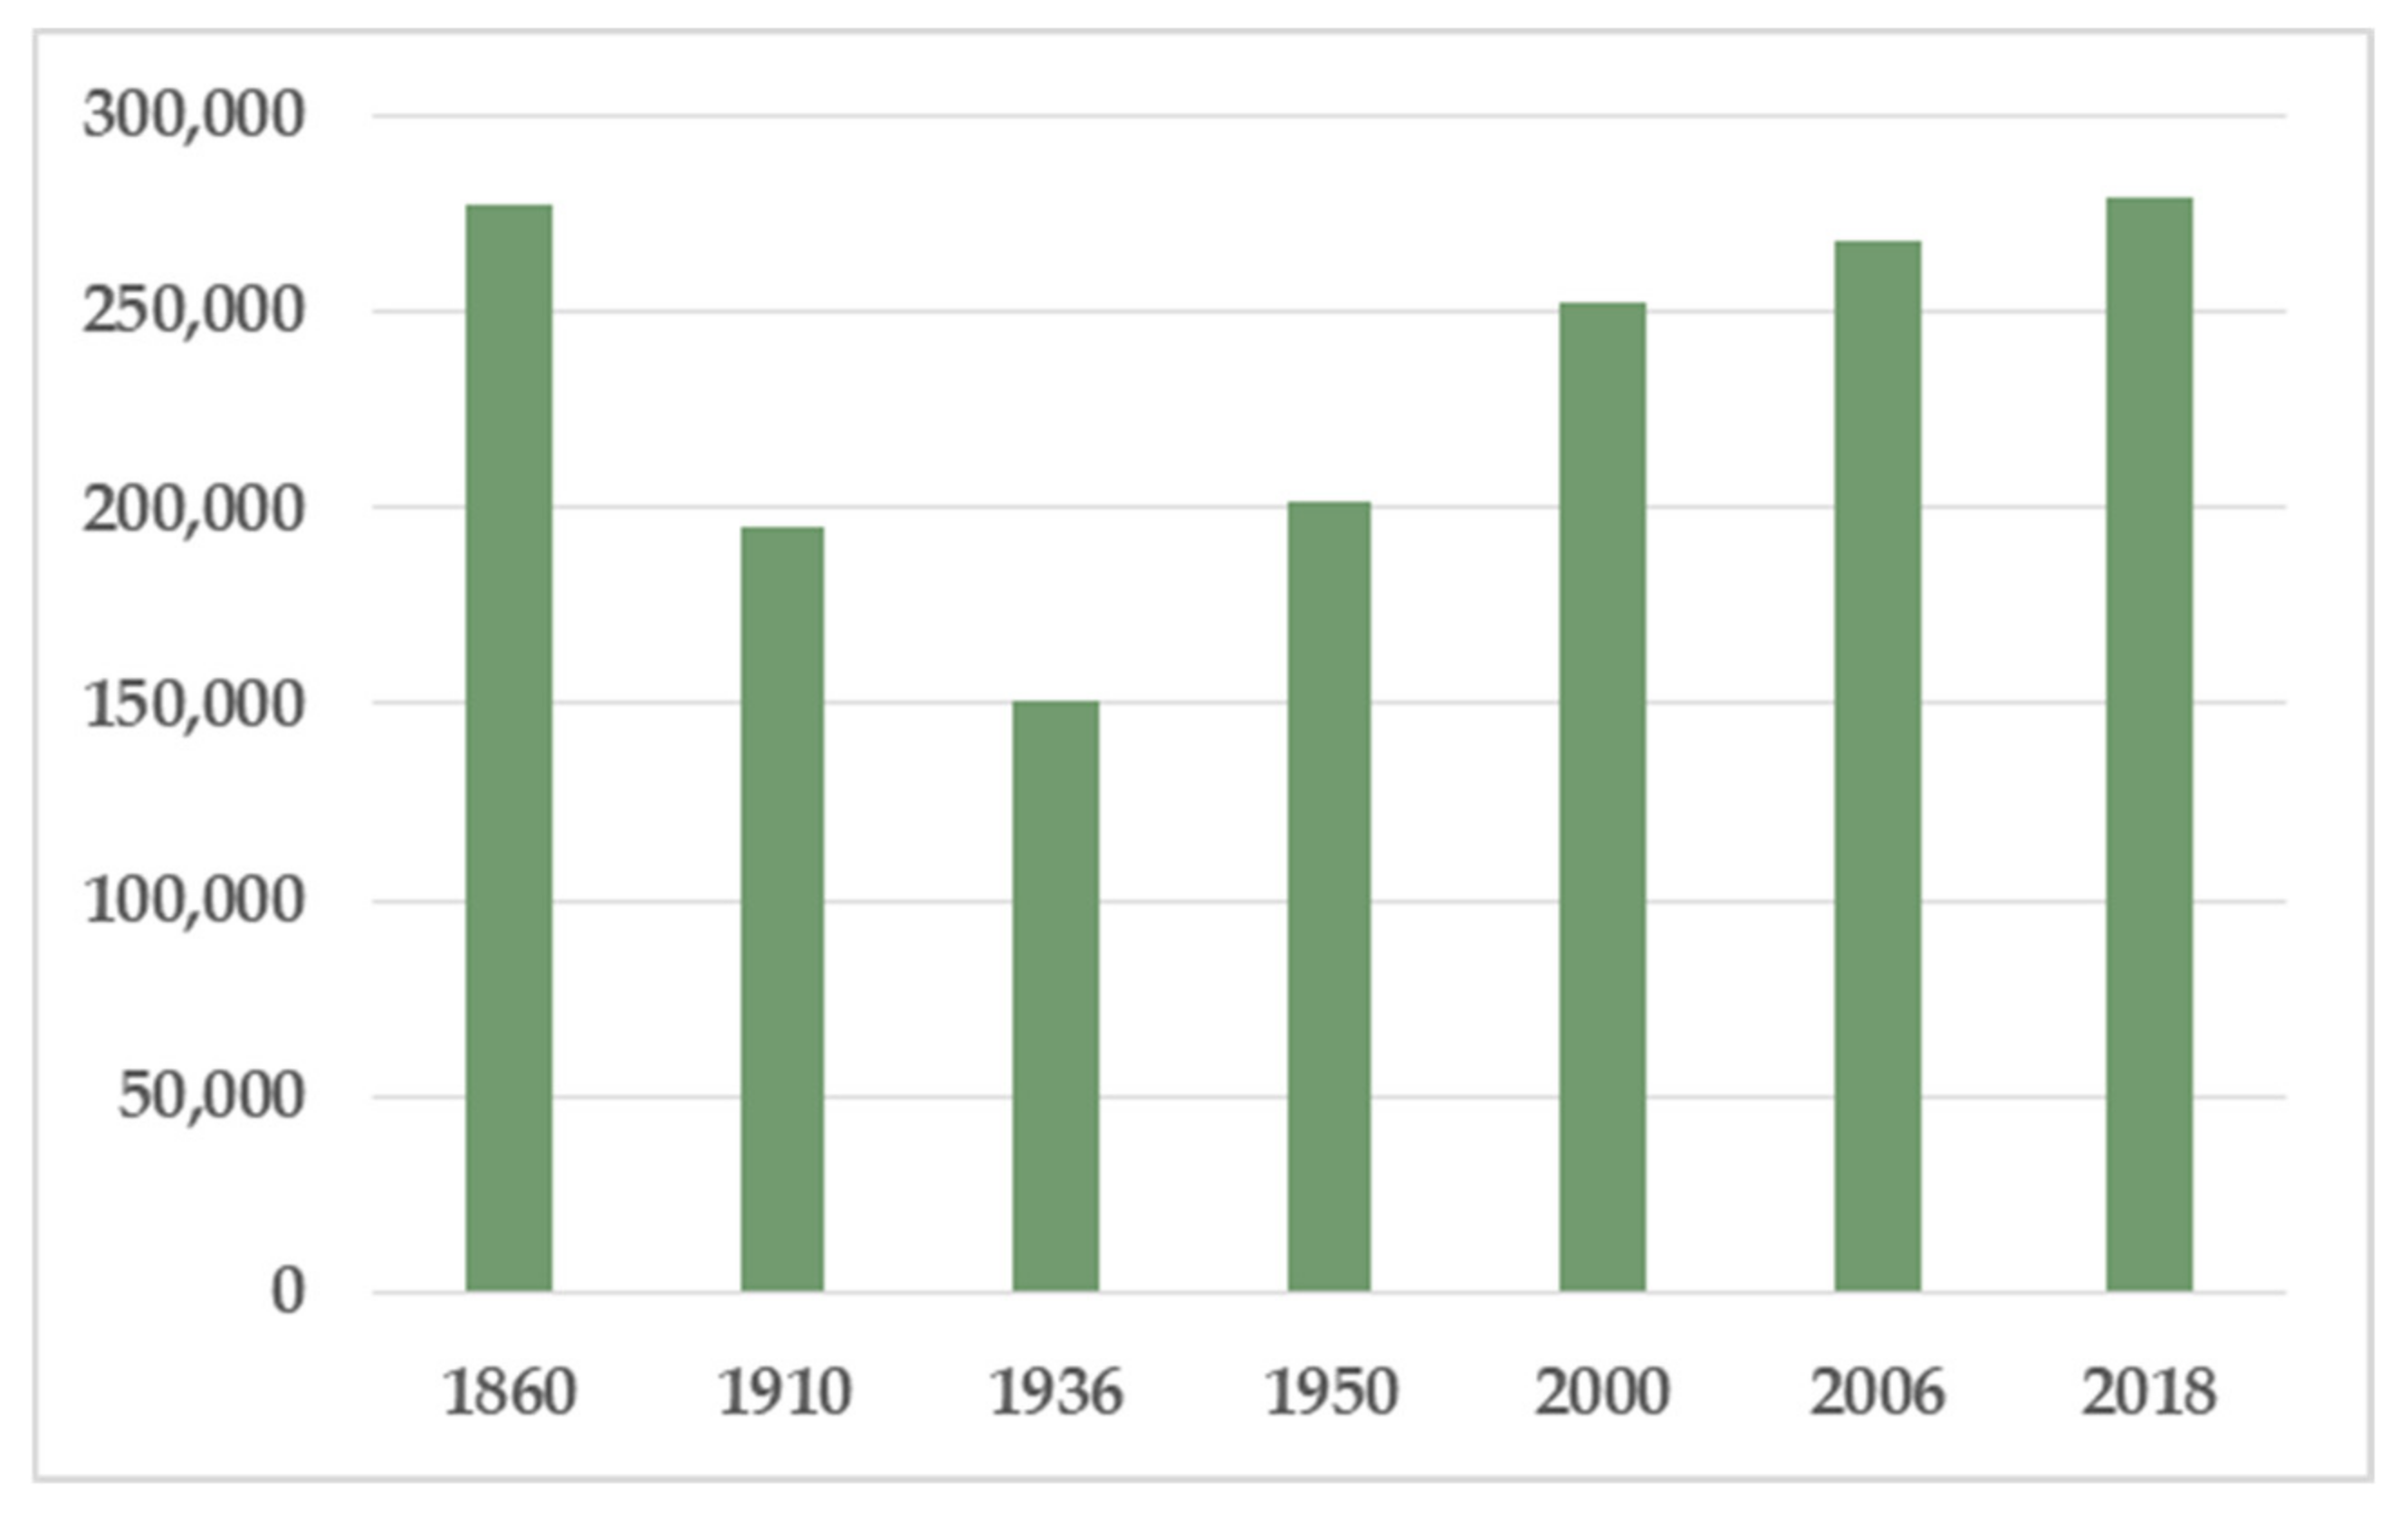
| Year | Hectares (ha) | Forest Cover Index 1 % |
|---|---|---|
| 1860 | 277,071.1 | 27.51 |
| 1910 | 194,888.09 | 19.35 |
| 1936 | 150,958.80 | 14.99 |
| 1950 | 201,996.09 | 20.05 |
| 2000 | 252,910.76 | 25.11 |
| 2006 | 268,125.62 | 26.62 |
| 2018 | 279,586.31 | 27.76 |
| Period | Net Change (ha) | % of Change 1 | Annual Change (%) 2 |
|---|---|---|---|
| 1860–1910 | −82,183.00 | −29.66 | −0.59 |
| 1910–1936 | −43,929.30 | −22.54 | −0.87 |
| 1936–1950 | 51,037.30 | 33.81 | 2.42 |
| 1950–2000 | 50,914.67 | 25.21 | 0.50 |
| 2000–2006 | 15,214.86 | 6.02 | 1.00 |
| 2006–2018 | 11,460.69 | 4.27 | 0.36 |
| Year | Mean Altitude | St. Dev. | Min. | Max. |
|---|---|---|---|---|
| 1860 | 677.27 | 375.83 | 0 | 2175 |
| 1910 | 695.86 | 390.81 | 0 | 2125 |
| 1936 | 810.23 | 343.95 | 0 | 2088 |
| 1950 | 713.30 | 381.11 | 0 | 2238 |
| 2000 | 757.77 | 338.72 | 0 | 2125 |
| 2006 | 756.37 | 339.61 | 0 | 2125 |
| 2018 | 763.54 | 337.39 | 0 | 2125 |
| Year | Mean Slope | St. Dev. | Min. | Max. |
|---|---|---|---|---|
| 1860 | 13.83 | 10.00 | 0.00 | 76.79 |
| 1910 | 14.60 | 10.26 | 0.00 | 76.79 |
| 1936 | 15.95 | 10.00 | 0.00 | 76.00 |
| 1950 | 15.16 | 9.93 | 0.00 | 74.91 |
| 2000 | 16.66 | 10.02 | 0.00 | 76.79 |
| 2006 | 16.64 | 10.06 | 0.00 | 76.79 |
| 2018 | 16.79 | 10.04 | 0.00 | 76.79 |
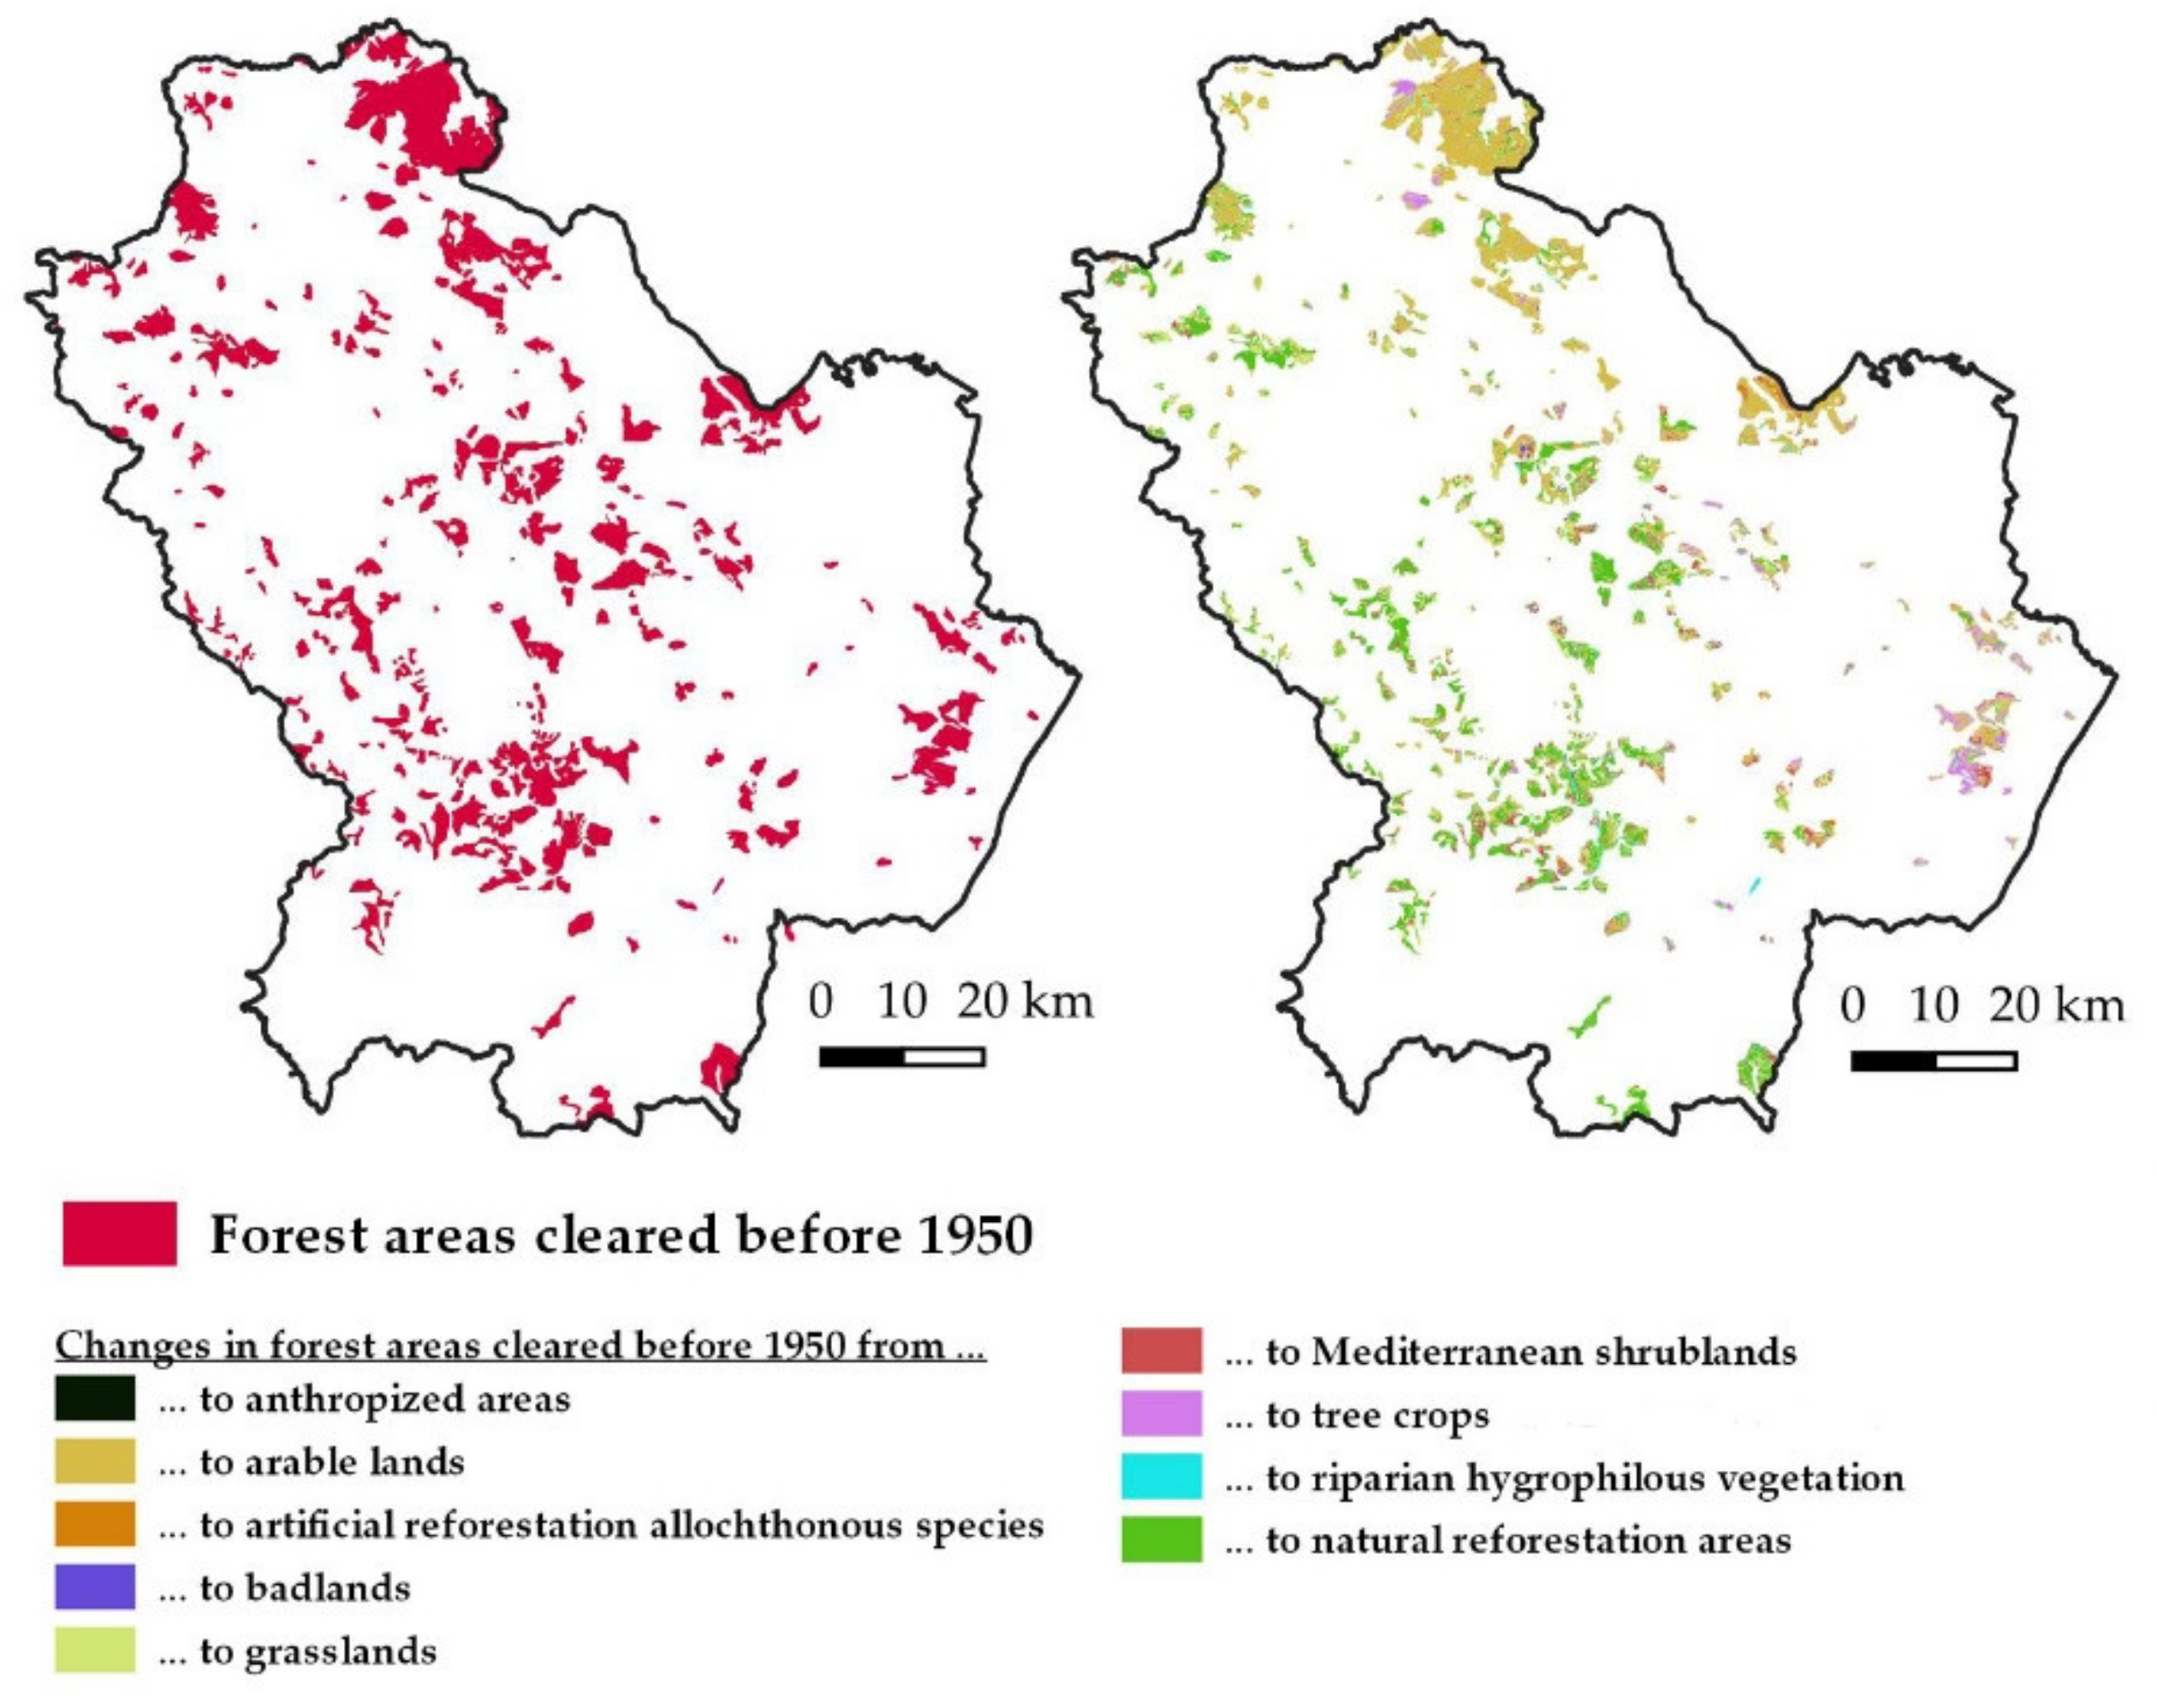
| Category of Change | ha | % |
|---|---|---|
| … to anthropized areas (urban centers, roads, industries, quarries, etc.) | 654.94 | 0.59 |
| … to badlands | 1105.34 | 0.99 |
| … to artificial reforestation allochthonous species | 1739.68 | 1.56 |
| … to riparian hygrophilous vegetation | 1840.44 | 1.65 |
| … to tree crops: olive groves, vineyards, orchards, etc. | 6560.56 | 5.87 |
| … to Mediterranean shrublands | 8711.91 | 7.80 |
| … to grasslands | 11244.68 | 10.06 |
| … to natural reforestation areas | 36848.91 | 32.98 |
| … to arable lands | 43038.52 | 38.51 |
| Total Forest Area Cleared Before 1950 | 111744.98 | 100.00 |
Publisher’s Note: MDPI stays neutral with regard to jurisdictional claims in published maps and institutional affiliations. |
© 2021 by the authors. Licensee MDPI, Basel, Switzerland. This article is an open access article distributed under the terms and conditions of the Creative Commons Attribution (CC BY) license (https://creativecommons.org/licenses/by/4.0/).
Share and Cite
Cillis, G.; Statuto, D.; Picuno, P. Historical GIS as a Tool for Monitoring, Preserving and Planning Forest Landscape: A Case Study in a Mediterranean Region. Land 2021, 10, 851. https://doi.org/10.3390/land10080851
Cillis G, Statuto D, Picuno P. Historical GIS as a Tool for Monitoring, Preserving and Planning Forest Landscape: A Case Study in a Mediterranean Region. Land. 2021; 10(8):851. https://doi.org/10.3390/land10080851
Chicago/Turabian StyleCillis, Giuseppe, Dina Statuto, and Pietro Picuno. 2021. "Historical GIS as a Tool for Monitoring, Preserving and Planning Forest Landscape: A Case Study in a Mediterranean Region" Land 10, no. 8: 851. https://doi.org/10.3390/land10080851
APA StyleCillis, G., Statuto, D., & Picuno, P. (2021). Historical GIS as a Tool for Monitoring, Preserving and Planning Forest Landscape: A Case Study in a Mediterranean Region. Land, 10(8), 851. https://doi.org/10.3390/land10080851