Article

Land Economic Efficiency and Improvement of Environmental Pollution in the Process of Sustainable Urbanization: Case of Eastern China

1
School of Finance and Accounting, Henan University of Animal Husbandry & Economy, Zhengzhou 450046, China
2
School of Finance and Economics, Jimei University, Xiamen 361023, China
*
Author to whom correspondence should be addressed.
Land 2021, 10(8), 845; https://doi.org/10.3390/land10080845
Submission received: 22 June 2021 / Revised: 10 August 2021 / Accepted: 11 August 2021 / Published: 12 August 2021

Abstract

:
Economic development, environmental protection and land resources are important components in sustainable cities. According to the environmental Kuznets curve, developing countries are prone to environmental pollution problems while developing their economies. At the same time, as urbanization progresses, the problem of inadequate land resources and land use efficiency in China is coming to the fore. Although China is a developing country, it began to actively implement environmental protection measures years ago in an effort to transform itself into an innovative country. Therefore, as an economic and policy pioneer region, can eastern China benefit from all three aspects of land–economy–environment at the same time? Or will the increase in land economic efficiency (Land_EcoE) and the improvement of environmental pollution occur simultaneously? With the characteristics of land use efficiency and other concepts, this study combines economic factors and land factors to establish a Land_EcoE evaluation system. On the basis of mapping the spatio-temporal evolution of carbon emissions and Land_EcoE, and discussing the spatio-temporal evolution characteristics and correlation between them initially and visually by means of geographic data visualization, this study uses the data of 84 prefecture-level cities and municipalities directly under the central government in eastern China from 2011 to 2017 to test the research hypotheses from a quantitative perspective. Specifically, this study analyzes the correlation between Land_EcoE and environmental pollution by constructing a panel regression model. The conclusions show that, in general, the increase in Land_EcoE in eastern China is associated with the increase in carbon emissions. For a group of prefecture-level cities with the most developed economies in eastern China, the increase in Land_EcoE is correlated with the decrease in carbon emissions. Based on this research, this study proposes a series of policy implications on how to promote simultaneous economic–land–environmental benefits.

1. Introduction

Although the industrial revolution liberated human productivity, it was destined to intensify the conflict between human development and the natural environment. The development of industry over the centuries has brought people an abundance of material resources, but at the same time has created serious environmental hazards. For example, industrial water pollution induces infant congenital anomalies [1]; plastic particles have entered the human body through the ecological cycle of land, sea and air [2,3]. The dangers of pollution have awakened humankind to the need to protect the environment and to promote sustainable development. In 2007, 50% of the world’s population was urban, and by 2025 it is expected to be 60%. There is no doubt that cities will be the main carrier of human life [4], and the construction of sustainable cities is of great importance to sustainable development [5,6].
Sustainable cities were first formally proposed at the Second United Nations Conference on Humanity in 1996 and have a rich connotation: social connotation [7], resource connotation [8], economic connotation [9] and environmental connotation [10]. Sustainable cities are one of the current research hotspots. Although the research on sustainable cities in China started late, it has been relatively fruitful. The literature on sustainable cities in China from the perspective of economics is distinctive. There are studies from the perspective of scientific landscape of smart cities [11], applied case studies [12], studies based on the perspective of eco-cities and low-carbon cities [13] and studies measuring the level of sustainable cities [14]. In addition, there are many studies focusing on the environmental factors of sustainable cities, such as green infrastructure and urban living environment [15] and territorial spatial planning [16]. The environmental Kuznets curve (EKC) was originally used to explain the existence of an inverted U-shaped relationship between income and the environment [17,18], while scholars later extended the connotation of the EKC to the interrelationship between the economy and the environment [19]. Recently, many scholars have extended its connotation to the interrelationship between the economy and the environment. When a country has a low level of economic development, the growth of the economy brings environmental pollution due to the scale effect [20,21]. Additionally, because industrial development requires a large amount of energy, and one of the main sources of energy in China is carbon-based energy [22,23], this leads to the fact that economic development in China in the past was inevitably polluting the environment. Studies by Christmann and Taylor and Li and Gong have proved this view [24,25].
Land urbanization has a negative impact on urban eco-efficiency [26]. Thus, China’s rapid urbanization [27,28] has left China with some hidden problems and contradictions: between the scarcity of land resources [29] and the growing demand for urban building land, and between the lack of land use efficiency and the growing demand for environmental protection [30,31,32]. Since land resources, economic development and environmental protection are all important for the development of sustainable cities, can they all benefit at the same time? Terrell found that economic growth can influence land use and thus reduce carbon emissions through the EKC [33]. Pontarollo and Muñoz found an inverted U-shaped curve relationship between land consumption and economic growth [34]. Pontarollo and Serpieri discussed EKC from the perspective of urban architecture [35]. In China, Chen examined the presence of EKC using CO2 emissions [36]. However, Wang and Ye argued that the increase in income cannot directly reduce pollution, but it needs to be achieved by improving energy efficiency and implementing carbon taxes [37]. There are scholars have also focused their perspectives on cities and found that smart cities have environmental improvement effects [38]. Liao et al. measured urban land use efficiency in the framework of sustainable cities [39]. Dong et al. clarified the interaction between LUE, industrial transformation and carbon emissions [40]. To some extent, these studies confirm that the triad of economy, land and environment can benefit simultaneously. However, there is a paucity of literature on the study of China, and their conclusions cannot be strongly supported.
In order to study land, economy and environment in the same framework, this study proposes and measures the land economic efficiency (Land_EcoE) index based on the characteristics of the concepts of “economic benefit of land use” and “land use efficiency” (LUE). Economic benefit of land use emphasizes the value of goods and services that may be produced within a limited amount of land [41], focusing on the output dimension. Land use efficiency integrally reflects the degree of material circulation and energy exchange between the elements in the urban system, the overall system and the external environment, and is a direct reflection of the realization of land value in the process of urban economic development [42]. Based on the two concepts, Land_EcoE not only contains the connotation of economic output, but also has the connotation of economic rationality (economic structure dimension) and economic growth potential (economic quality dimension).
In fact, the Communist Party of China and the Chinese government have promptly realized that the past crude factor-driven development model cannot meet the needs of China’s development in the new era and that green, healthy and sustainable development is the choice of the times. The “Ninth Five-Year Plan” period (1996–2000) put limits on energy consumption and pollution emissions. The “11th Five-Year Plan” (2006–2010) made environmental regulation a binding target for local governments. Innovation is the first driving force for development. For many years, China has been actively pursuing an economic transformation strategy towards an innovation-driven, intensive development model. Wang et al. measured the low-carbon development quality of 259 cities in China and found that the quality level was generally higher in the eastern region [43]. According to the above, the synergistic development of economy–land–environment is achievable. Then, is the synergistic development of economic–land–environmental aspects possible in eastern China, which is the first place to go for policies and economically developed regions [44]? Or will the increase in land economic efficiency and the improvement of environmental pollution occur simultaneously?
Through the aforementioned literature, it can be found that: first, sustainable cities are a current research hotspot, but in China, research on sustainable cities is relatively weak, and research from the economic and land dimensions still needs to be improved; second, there are abundant studies on the EKC, but there are few studies on LUE from multiple dimensions from an economic perspective, in order to study the land economic efficiency and environmental pollution improvement. Therefore, combining the abovementioned realistic background and the questions raised, this study includes the following hypotheses:
Hypothesis 1 (H1).
There is a positive correlation between the increase in land economic efficiency and the improvement of environmental pollution in eastern China.
At the same time, Chong et al. emphasize the close correlation between China’s economy and carbon emissions [23], considering that the eastern part of China was chosen as the subject of this study because it is the most prosperous. However, in reality, there are still some prefecture-level cities in eastern China that are relatively less developed. Therefore, on the basis of H1, this study further proposes the hypothesis that:
Hypothesis 2 (H2).
There is a positive relationship between the increase in land economic efficiency and the improvement of environmental pollution in the most economically developed group of cities in eastern China.
The possible contributions of this paper are: first, with the changing situation in China, earlier studies on the interrelationship between the economy and the environment are no longer appropriate for the current China, and this paper complements this study. Second, few studies have examined the relationship between land use efficiency (i.e., land economic efficiency) and environmental improvement from an economic perspective. Third, unlike other indicator evaluation methods, this study empowers the land economic efficiency evaluation system with the help of the entropy method, which enables a multi-layered discussion of what Land_EcoE is all about. Fourth, this study uses a combination of qualitative (data visualization) and quantitative (econometric modeling) methods to make the conclusions of the article more convincing.
The remainder of the paper is as follows: Section 2 provides a brief description of the subject of this paper and describes the methods that emerged from this study. Section 3 shows the variables involved in this study and their sources. The spatio-temporal evolution of carbon emissions and land economic efficiency is plotted and analyzed. Section 4 describes the empirical process and results of this study. Section 5 discusses the findings of the study. Section 6 concludes the paper and presents the policy implications of the study.

2. Materials and Methods
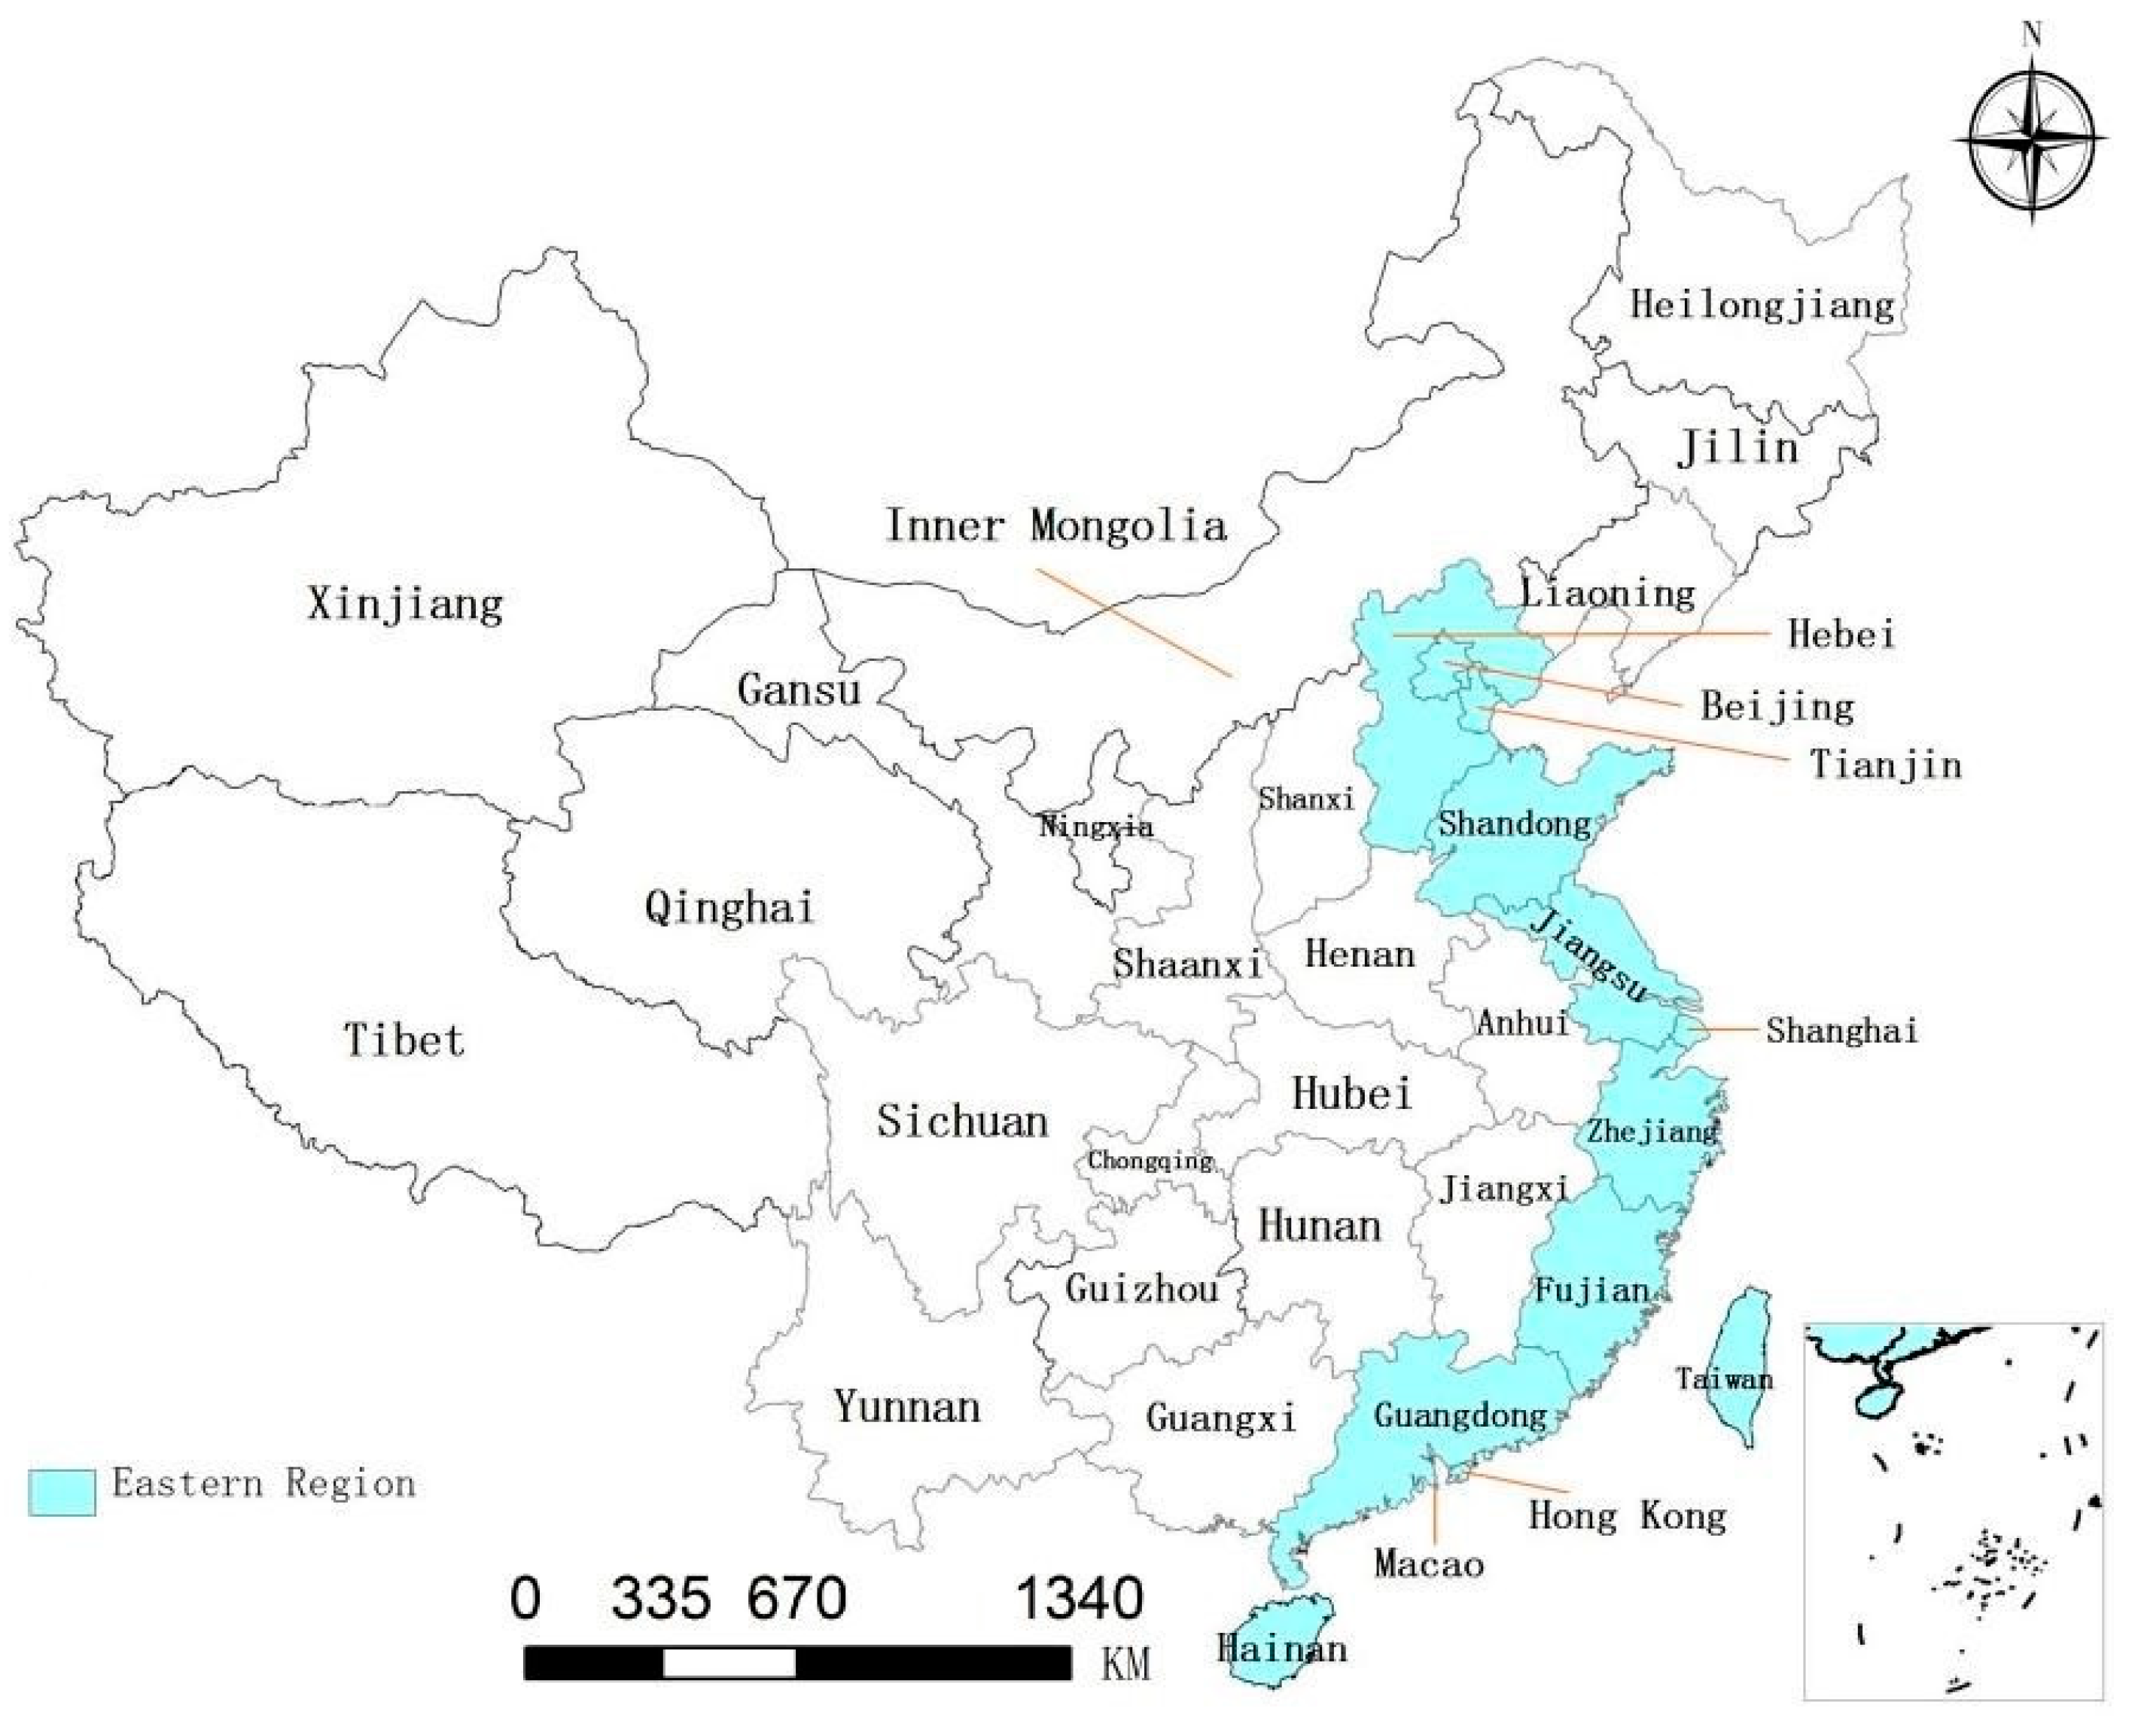
2.1. Study Area

Located on the eastern edge of the East Asian continent and the western coast of the Pacific Ocean, eastern China is the most economically developed region in China due to its unique natural harbor cluster and geographical environment. Eastern China includes Hebei Province, Beijing, Tianjin, Shandong Province, Jiangsu Province, Shanghai, Zhejiang Province, Fujian Province, Guangdong Province, Hainan Province, Taiwan Province, Hong Kong and Macau (See Figure 1). Considering the issue of data integrity and statistical consistency, Taiwan, Hong Kong and Macau will be excluded from this study. Hainan Province is also considered to be significantly less developed than the other regions and does not meet the requirement of this study to be a prosperous region, so it is excluded. The following is a basic description of the regions studied:
Hebei Province is located in northeastern China (113°27′–119°50′ E, 36°05′–42°40′ N), surrounded by Beijing and bordered by Tianjin and the Bohai Sea to the east. Hebei Province has a complex and diverse landscape, mainly mountainous, with a total area of 188,800 km2 as of 2020. As of 2019, Hebei Province has 11 prefecture-level cities: Shijiazhuang, Tangshan, Qinhuangdao, Handan, Xingtai, Baoding, Zhangjiakou, Chengde, Cangzhou, Langfang and Hengshui, with a resident population of 75,919,700. In 2020, Hebei’s GDP was RMB 3,620.69 billion, ranking 13th in China.
Beijing is located in northern China (115.7°–117.4° E, 39.4°–41.6° N), bordering Tianjin to the east and Hebei Province to the west. Beijing is predominantly mountainous and plain, with a total area of 16,410.54 km2 by 2020. As of 2019, Beijing’s resident population is 21.536 million. In 2020, Beijing’s GDP was RMB 361.026 million, ranking 12th in China.
Tianjin is located in northern China (116°43’–118°04’ E, 38°34’–40°15’ N), is bordered by the Bohai Sea to the east and Beijing to the west. Tianjin is dominated by plains and depressions, with a total area of 11,966.45 km2 as of 2020. As of 2019, Tianjin has a resident population of 15,618,300 people. In 2020, Tianjin’s GDP was RMB 140,837,300, ranking 23rd in China.
Shandong Province, located on the eastern coast of China (114°47.5′–122°42.3′ E, 34°22.9′–38°24.01′ N), shares borders with Hebei, Henan and Anhui as well as Jiangsu. Shandong Province is predominantly hilly and mountainous, with a total area of 157,900 km2 as of 2020. As of 2019, Shandong province has 16 prefecture-level cities: Jinan, Qingdao, Zibo, Zaozhuang, Dongying, Yantai, Weifang, Jining, Tai’an, Weihai, Rizhao, Binzhou, Dezhou, Liaocheng, Linyi and Heze, with a resident population of 100,702,100 people. In 2020, the GDP of Shandong province was RMB 73,129,000, ranking 3rd in China.
Jiangsu Province, located on the eastern coast of China (116°21’–121°56’ E, 30°45’–35°08’ E), bordered by the Yellow Sea to the east, shares borders with Shanghai, Zhejiang, Anhui and Shandong Provinces. Jiangsu Province is predominantly a plain, with a total area of 107,200 km2 as of 2020. As of 2019, Jiangsu Province has 13 prefecture-level cities: Nanjing, Wuxi, Xuzhou, Changzhou, Suzhou, Nantong, Lianyungang, Huai’an, Yangzhou, Zhenjiang, Taizhou, Suqian and Yancheng, with a resident population of 80.7 million. In 2020, Jiangsu Province had a GDP of RMB 102,719,000, ranking 2nd in China.
Shanghai, located in eastern China (120°52′–122°12′ E, 30°40′–31°53′ N), is bordered by Jiangsu and Zhejiang Provinces. Shanghai is predominantly a plain, with a total area of 6,340.5 km2 as of 2020. As of 2019, the resident population of Shanghai is 24,281,400. In 2020, Shanghai’s GDP was RMB 387,058,000, ranking 10th in China.
Zhejiang Province, located on the southeast coast of China (118°01’–123°10’ E, 27°02’–31°11’ N), is bordered by the East China Sea to the east, Fujian Province to the south, Anhui and Jiangxi Provinces to the west and Jiangsu Province and Shanghai to the north. Zhejiang Province is mainly hilly, supplemented by plains, with a total area of 105,500 km2 as of 2020. As of 2019, Zhejiang province has 11 prefecture-level cities: Zhoushan, Hangzhou, Jiaxing, Wenzhou, Ningbo, Shaoxing, Huzhou, Lishui, Taizhou, Jinhua and Quzhou, with a resident population of 58.5 million people. In 2020, Zhejiang’s GDP was RMB 646.13 million, ranking 4th in China.
Fujian Province, located on the southeast coast of China (115°50′–120°40′ E, 23°33′–28°20′ N), is adjacent to Zhejiang Province in the northeast, bordered by Jiangxi Province in the northwest and connected to Guangdong Province in the southwest and Taiwan in the southeast. Fujian Province is predominantly mountainous and hilly, with a total area of 121,400 km2 as of 2020. As of 2019, Fujian Province has nine prefecture-level cities: Fuzhou, Putian, Quanzhou, Xiamen, Zhangzhou, Longyan, Sanming, Nanping and Ningde, with a resident population of 39.73 million. In 2020, Fujian Province’s GDP was RMB 434,348,900, ranking 7th in China.
Guangdong Province, located in the southernmost part of China (109°39′–117°19′ E, 20°13′–25°31′ N), shares borders with Hong Kong, Macau, Guangxi, Hunan, Jiangxi and Fujian Provinces. Guangdong Province is dominated by plains and hills, with a total area of 179,725 km2 as of 2018. As of 2019, Guangdong Province has 21 prefecture-level cities: Guangzhou, Shenzhen, Foshan, Dongguan, Zhongshan, Zhuhai, Jiangmen, Zhaoqing, Huizhou, Shantou, Chaozhou, Jieyang, Shanwei, Zhanjiang, Maoming, Yangjiang, Yunfu, Shaoguan, Qingyuan, Meizhou and Heyuan, with a resident population of 115.21 million. In 2020, Guangdong’s GDP was RMB 110,760.94 million, ranking 1st in China.

2.2. Methods

2.2.1. Entropy Method

The entropy method is one of the common composite indicator measures. The entropy method assigns weights based on the degree of variation between variables, and the greater the variation, the greater the weight. The entropy method has the feature of reducing the dimensionality of variables and mitigating the presence of multicollinearity between variables [45]. The entropy method is calculated as follows:
Step 1. Obtain a standardized matrix of indicators ( E i t , k ) where e i t , k is the matrix of unprocessed indicators, i indicates the region i , t indicates the year t, k indicates the k th indicator, with a total of K indicators.
E i t , k = e i t , k m i n K | e i t , k | m a x K | e i t , k | m i n K | e i t , k |  
Step 2. Calculate the information entropy ( I t , k ). Calculate E i t , k by Equation (2), where n is the total number of regions. Additionally, calculate I t , k by Equation (3).
E i t , k = E i t , k i = 1 n E i t , k  
I t , k = l n ( n ) 1 i = 1 n E i t , k l n ( E i t , k )
Step 3. Calculate the weight matrix ( W t , k ) by Equation (4).
W t , k = 1 I t , k K I t , k

2.2.2. Map Visualization of Data

Map visualization of data is a type of exploratory spatial data analysis (ESDA), whose main purpose is to present spatial geographic attributes and data information more clearly to the reader, usually through software such as ArcGIS [46], where spatial data are embedded in a geographic map. However, traditional studies of regional economics, geography economics, etc. usually analyze data through such visualization methods, which are qualitative in nature and have a certain non-objectivity. Moreover, this method cannot verify the causal relationship between the dependent and independent variables. For example, in this study, we are only able to theorize that there is a causal relationship between economic efficiency of land and environmental pollution improvement, and we are unable to obtain quantitative support.

2.2.3. Econometric Model
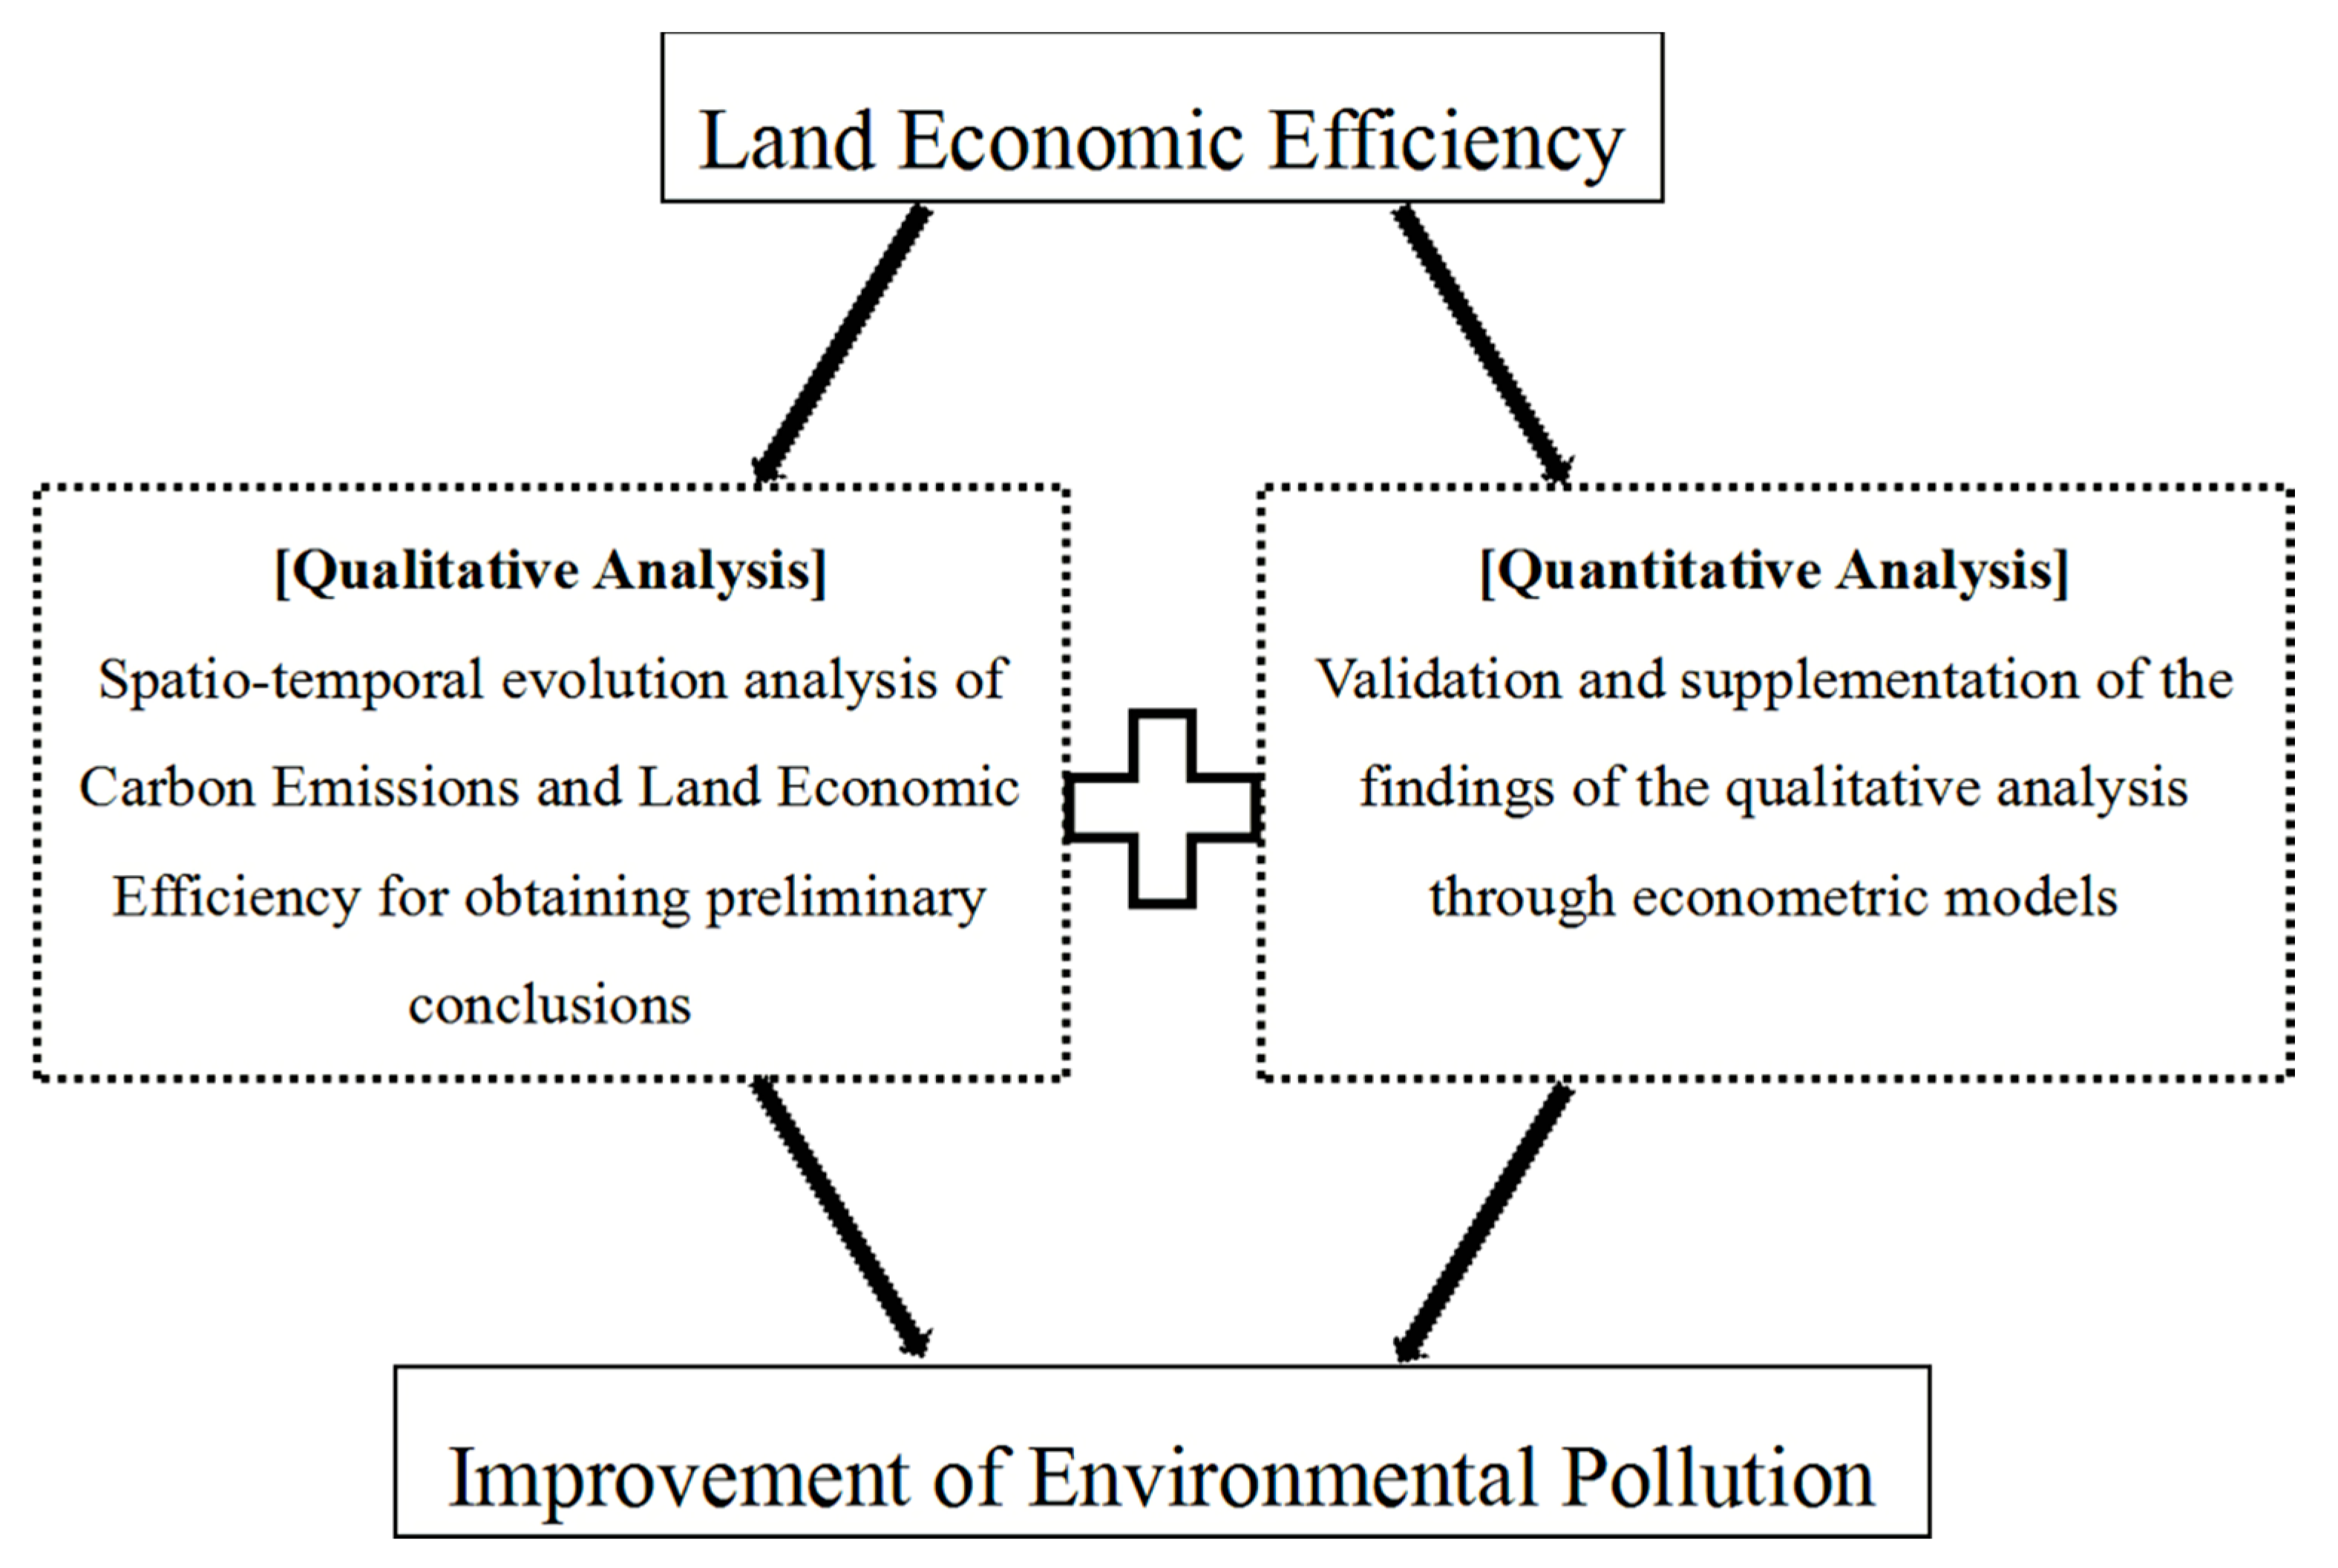
Econometric models are able to analyze the correlation between data, the degree of association, etc., and are the most common methods used in economics research. In this study, econometric models are used to investigate the correlation and significance of pollution data in relation to land economic efficiency. Econometric models can be classified into time series regression models, cross-sectional regression models and panel regression models, depending on the type of data [47]. As panel data are used in this paper, a panel regression model is used. Econometric modeling is able to reflect the correlation between variables in a holistic manner and test the research hypothesis by quantifying them. However, it tends to ignore the unique performance of each region. For example, in this study, we can determine the relationship between land economic efficiency and environmental pollution improvement through econometric models, but this conclusion is presented based on the full sample, while the specific performance of each region is not known. This makes the study conclusions less fleshed out.

2.3. Research Idea

This study uses a combination of qualitative and quantitative methods to obtain richer and more convincing conclusions. On the one hand, this study visualizes the spatio-temporal evolution of carbon emission and land economic efficiency to obtain preliminaries conclusions; on the other hand, this study uses an econometric model to verify the above conclusions from a quantitative perspective and to obtain richer conclusions. Figure 2 is the methodological framework of the research idea of this study.

3. Variable Design and Analysis

3.1. Explained Variable

The explained variable in this study is the environmental pollution variable, as measured by carbon emissions (Carbon) at the city level. On the one hand, with the popularity of “carbon neutrality” and “carbon capping”, carbon emissions are undoubtedly an important element of current social and environmental issues, and are highly representative [48]. On the other hand, China is still dominated by carbon-based energy sources [49], and using carbon emissions can more accurately cover the environmental impact of energy factors.

3.2. Explanatory Variables

3.2.1. Core Explanatory Variable

Land economic efficiency (Land_EcoE) is the core explanatory variable in this study. Most scholars use comprehensive indicators to measure Land_EcoE, for example, traditional data envelopment analysis (DEA), the slacks-based measure (SBM) model [50], land and output intensity [51] and principal component analysis [52]. As a matter of course, different measurement methods and research objectives yield different results [53,54]. Among them, DEA and SBM methods can measure input–output values better, but cannot show the different dimensions of indicators better. Principal component analysis can show multiple dimensions of indicators, but its explanatory power of different dimensions is weaker. The entropy method is based on the degree of variation among variables to different dimensions of indicators. The entropy method is able to explain the importance of each dimension of an indicator and extract the maximum information from the variables. Therefore, this study uses Matlab 2019a software to measure Land_EcoE using the entropy method.
The aim of this study is to investigate whether there is a win-win situation between the “economy” and the “environment” in the development process of sustainable cities in eastern China, i.e., whether an increase in Land_EcoE can improve environmental pollution. Therefore, this study constructs land economic efficiency indicators only at the level of economic development. Economic development generally consists of three dimensions: the economic growth dimension, the economic structure dimension and the economic quality dimension. Based on this, the indicator evaluation system of Land_EcoE is described as follows (Table 1):
(1)
Economic growth. Economic growth is the basis of economic development. This study uses GDP growth rate and industrial production intensity (gross industrial output value above scale/land area) to measure it. GDP growth rate visually reflects the growth rate of the region’s production capacity. The gross industrial output value above scale reflects the level of industrial production in the region, and when divided by its urban area, the industrial production intensity obtained excludes the effect caused by the size of the city.
(2)
Economic structure. Economic structure includes industrial structure, population structure, etc. A reasonable economic structure is conducive to economic development. In this study, we use the share of tertiary output (tertiary industry output value/GDP), tertiary industry production intensity (tertiary industry output value/land area) and employment density (urban employment population/land area) to measure it. Tertiary industrial output reflects the development of the service sector in the region. The development of sustainable cities leads to changes in urban functions [55], most notably a decline in the share of secondary industrial output and an increase in the share of tertiary industrial output over the years [56,57]. Dividing tertiary industrial output by GDP and land area, respectively, controls for the impact of the size of the economy and the size of the city on it. Labor is a necessary element of production, and a city without employed people will struggle to support economic development. In this study, we divide urban employment by land area to exclude the effect of city size.
(3)
Economic quality. Economic quality is not only reflected in the current economic development achievements, but also in the potential for economic development of the region. This study uses GDP per capita, R&D intensity (science and technology expenditure in the general public budget/land area) and road density (urban road area/land area) to measure this. GDP per capita visually reflects the average production capacity and indirectly shows the income level of the residents, and can better measure the current economic development achievements of the region. Innovation is the first driving force of development and a key factor in escaping the middle-income trap. On the one hand, science and technology expenditure reflects the importance the government attaches to innovation development and judges whether the government’s economic development course is reasonable [58]. On the other hand, science and technology expenditure promotes innovative development and has long-term significance in optimizing production methods, increasing production efficiency and improving product competition [59]. Urban road density is a direct reflection of the accessibility of a city. Convenient transport is an important component of economic development and can reduce commuting times and improve the quality of life of residents.

3.2.2. Control Variables

In this study, the explained variable is carbon emissions and the explanatory variable is land economic efficiency (Land_EcoE). To increase the validity of the empirical results and to avoid endogeneity problems arising from omitted variables, the following control variables are added: (I) Chen and Ouyang et al. both found that foreign investment has a significant impact on environmental improvement [60,61]. Therefore, the foreign capital utilization intensity (amount of actual foreign investment utilized/land area) is used, controlling for the impact from abroad. (II) There is no doubt that innovation can have a relationship with the environment [62,63,64]. This study uses innovation intensity (number of non-descript patent applications/employment), controlling for the impact from domestic innovation.

3.3. Data Resource and Processing

This study uses the eastern region of China as the sample for this study. Considering the statistical caliber and completeness of the data, Taiwan Province, Hong Kong and Macau are excluded from this study. Hainan Province is excluded due to its relatively underdeveloped economy and because it does not meet the requirement of being a more economically developed region. The initial time point for this study is set at 2011 as China has developed and implemented a rich and stringent environmental governance policy since the starting point of the 12th Five-Year Plan (2011). As the latest city-level carbon emission data were only updated to 2017, the end point of this study is set at 2017. In summary, this study uses data from 2011–2017 for 84 prefecture-level cities in eastern China. The main data for this study were obtained from the China City Statistical Yearbook, and all of them were from the statistical scope of municipal districts. City-level carbon emissions data were obtained by aggregating county-level data from Carbon Emission Accounts & Datasets (CEADs) [65]. For some of the missing data, the moving average method was used to complete the study. Table 2 reports the descriptive statistics of the main variables in the study. In this case, all values are in logarithmic form, except for land economic efficiency. It can be found that the standard deviations of the variables are small and there are no extreme values that are several orders of magnitude higher than the other variables, indicating that the data are suitable for use in the regression model.

3.4. Analysis of Spatio-Temporal Evolution of Key Variables

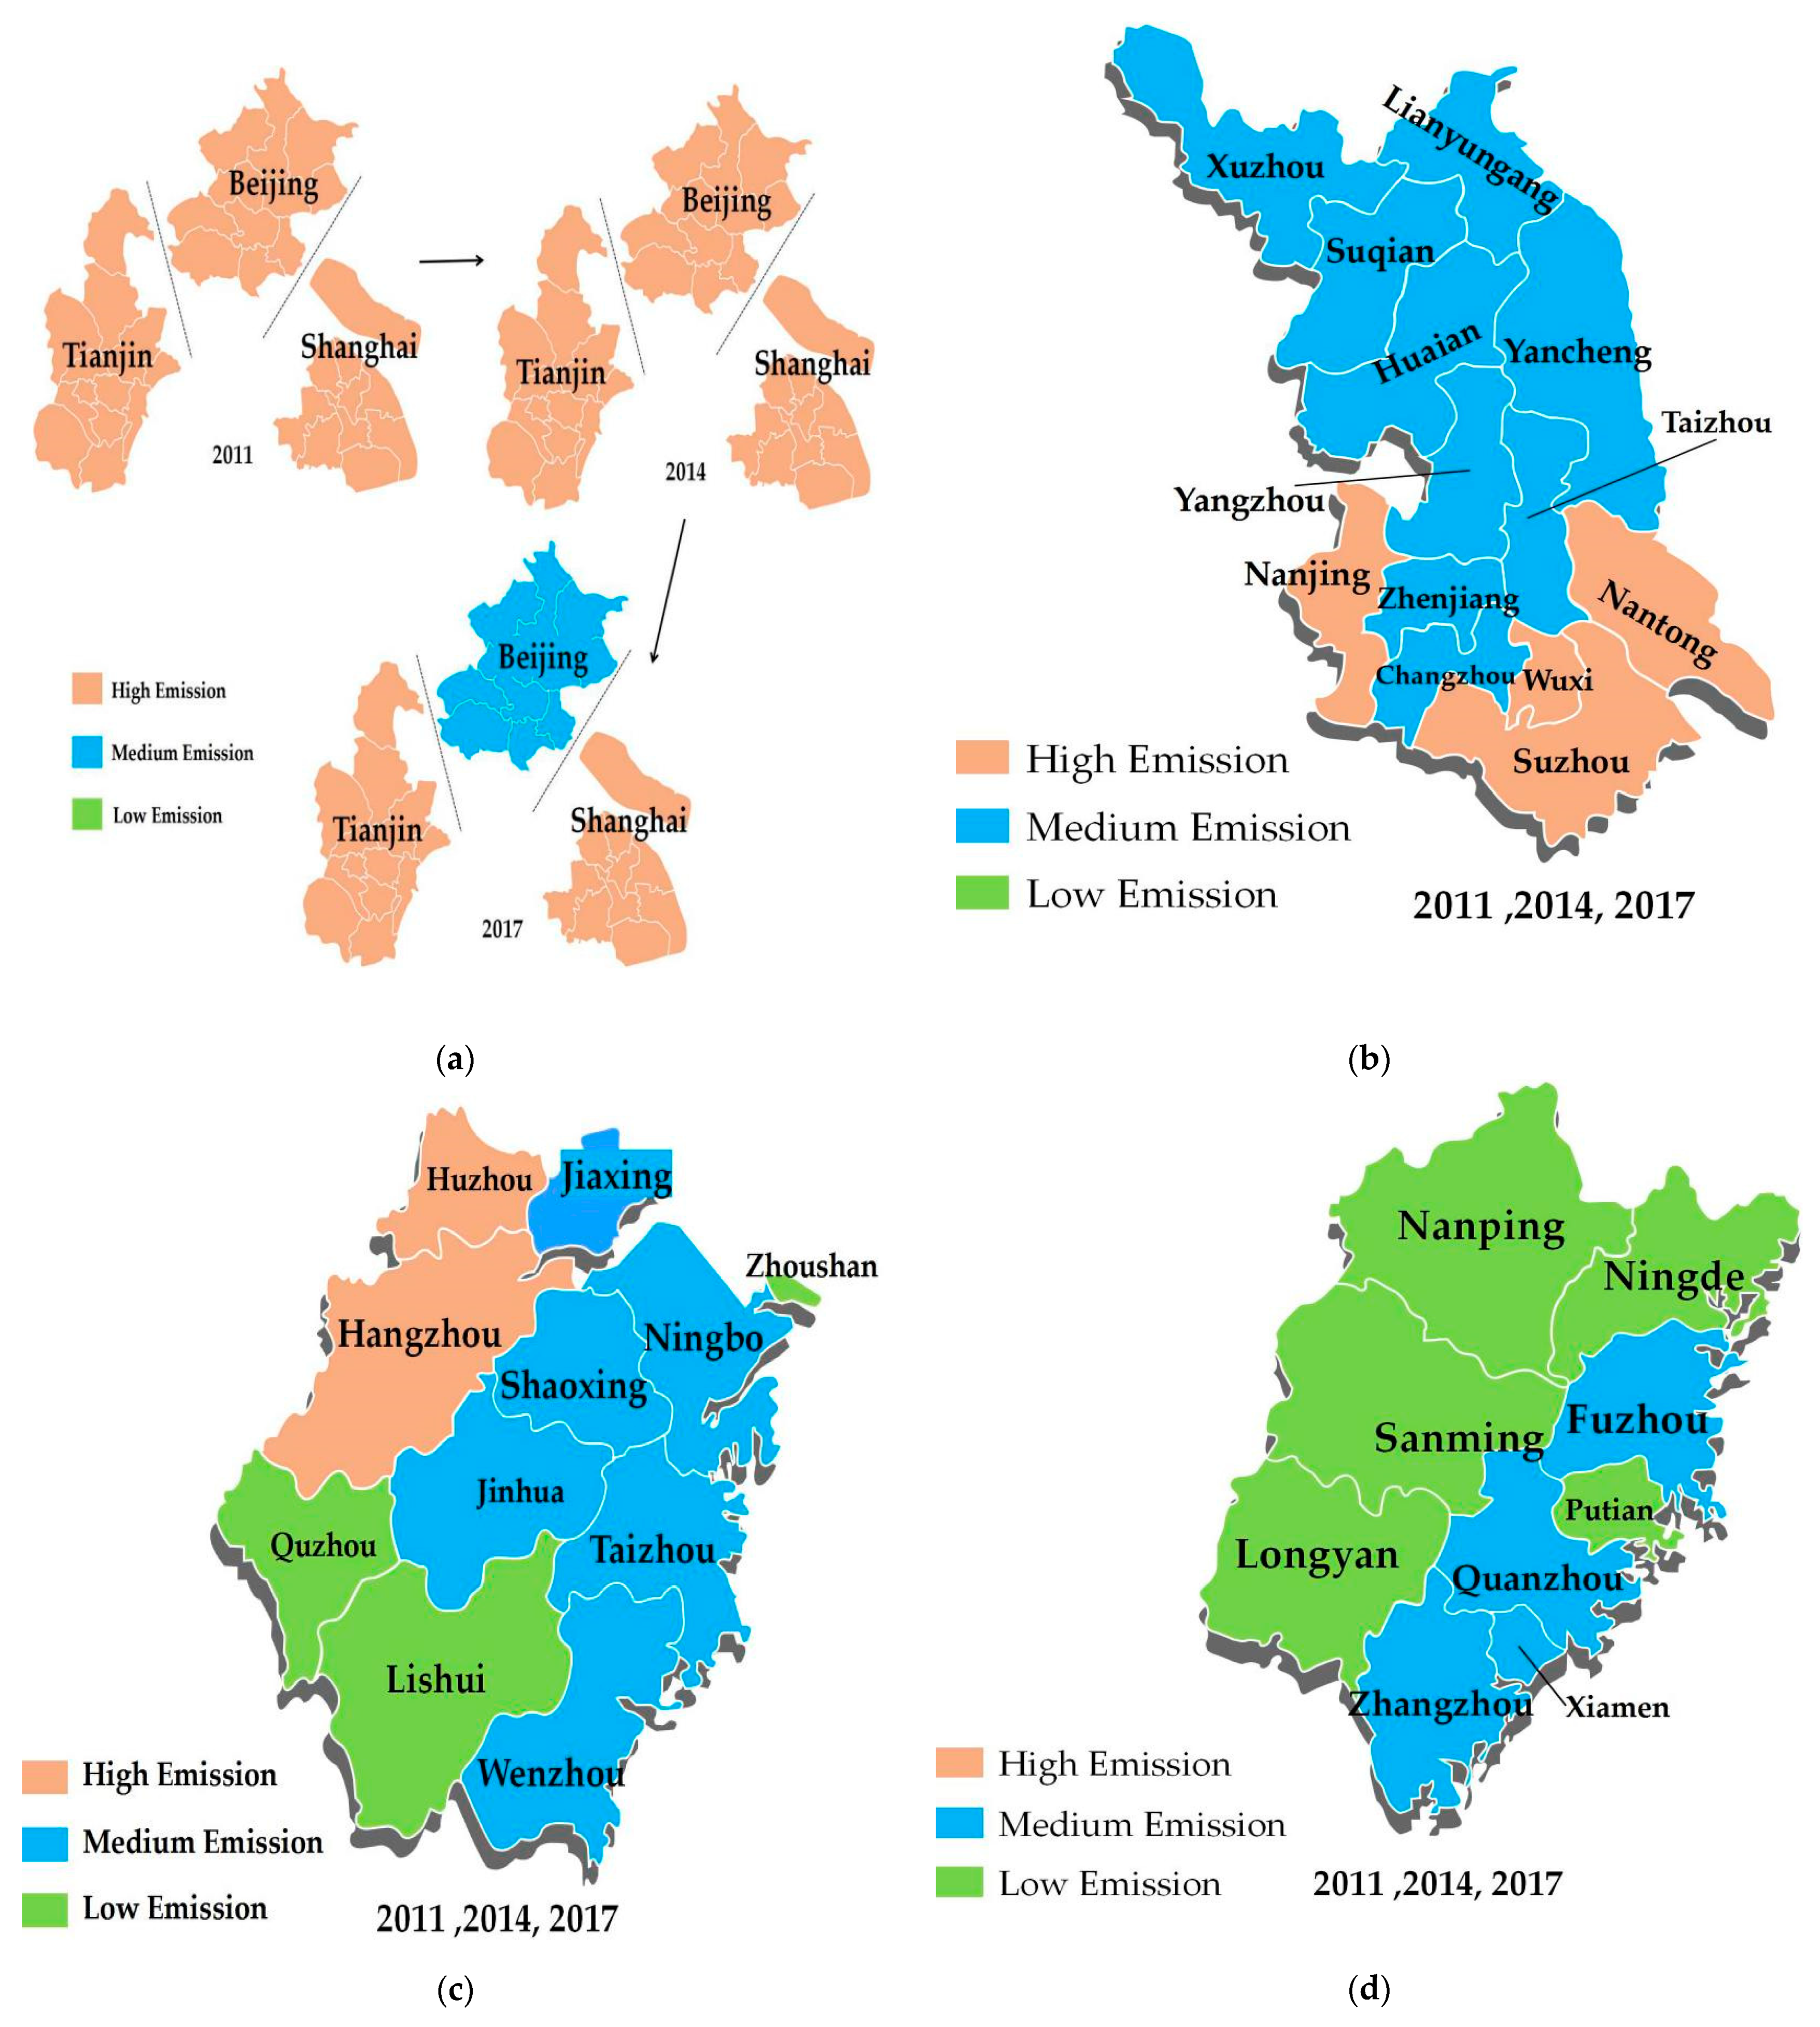
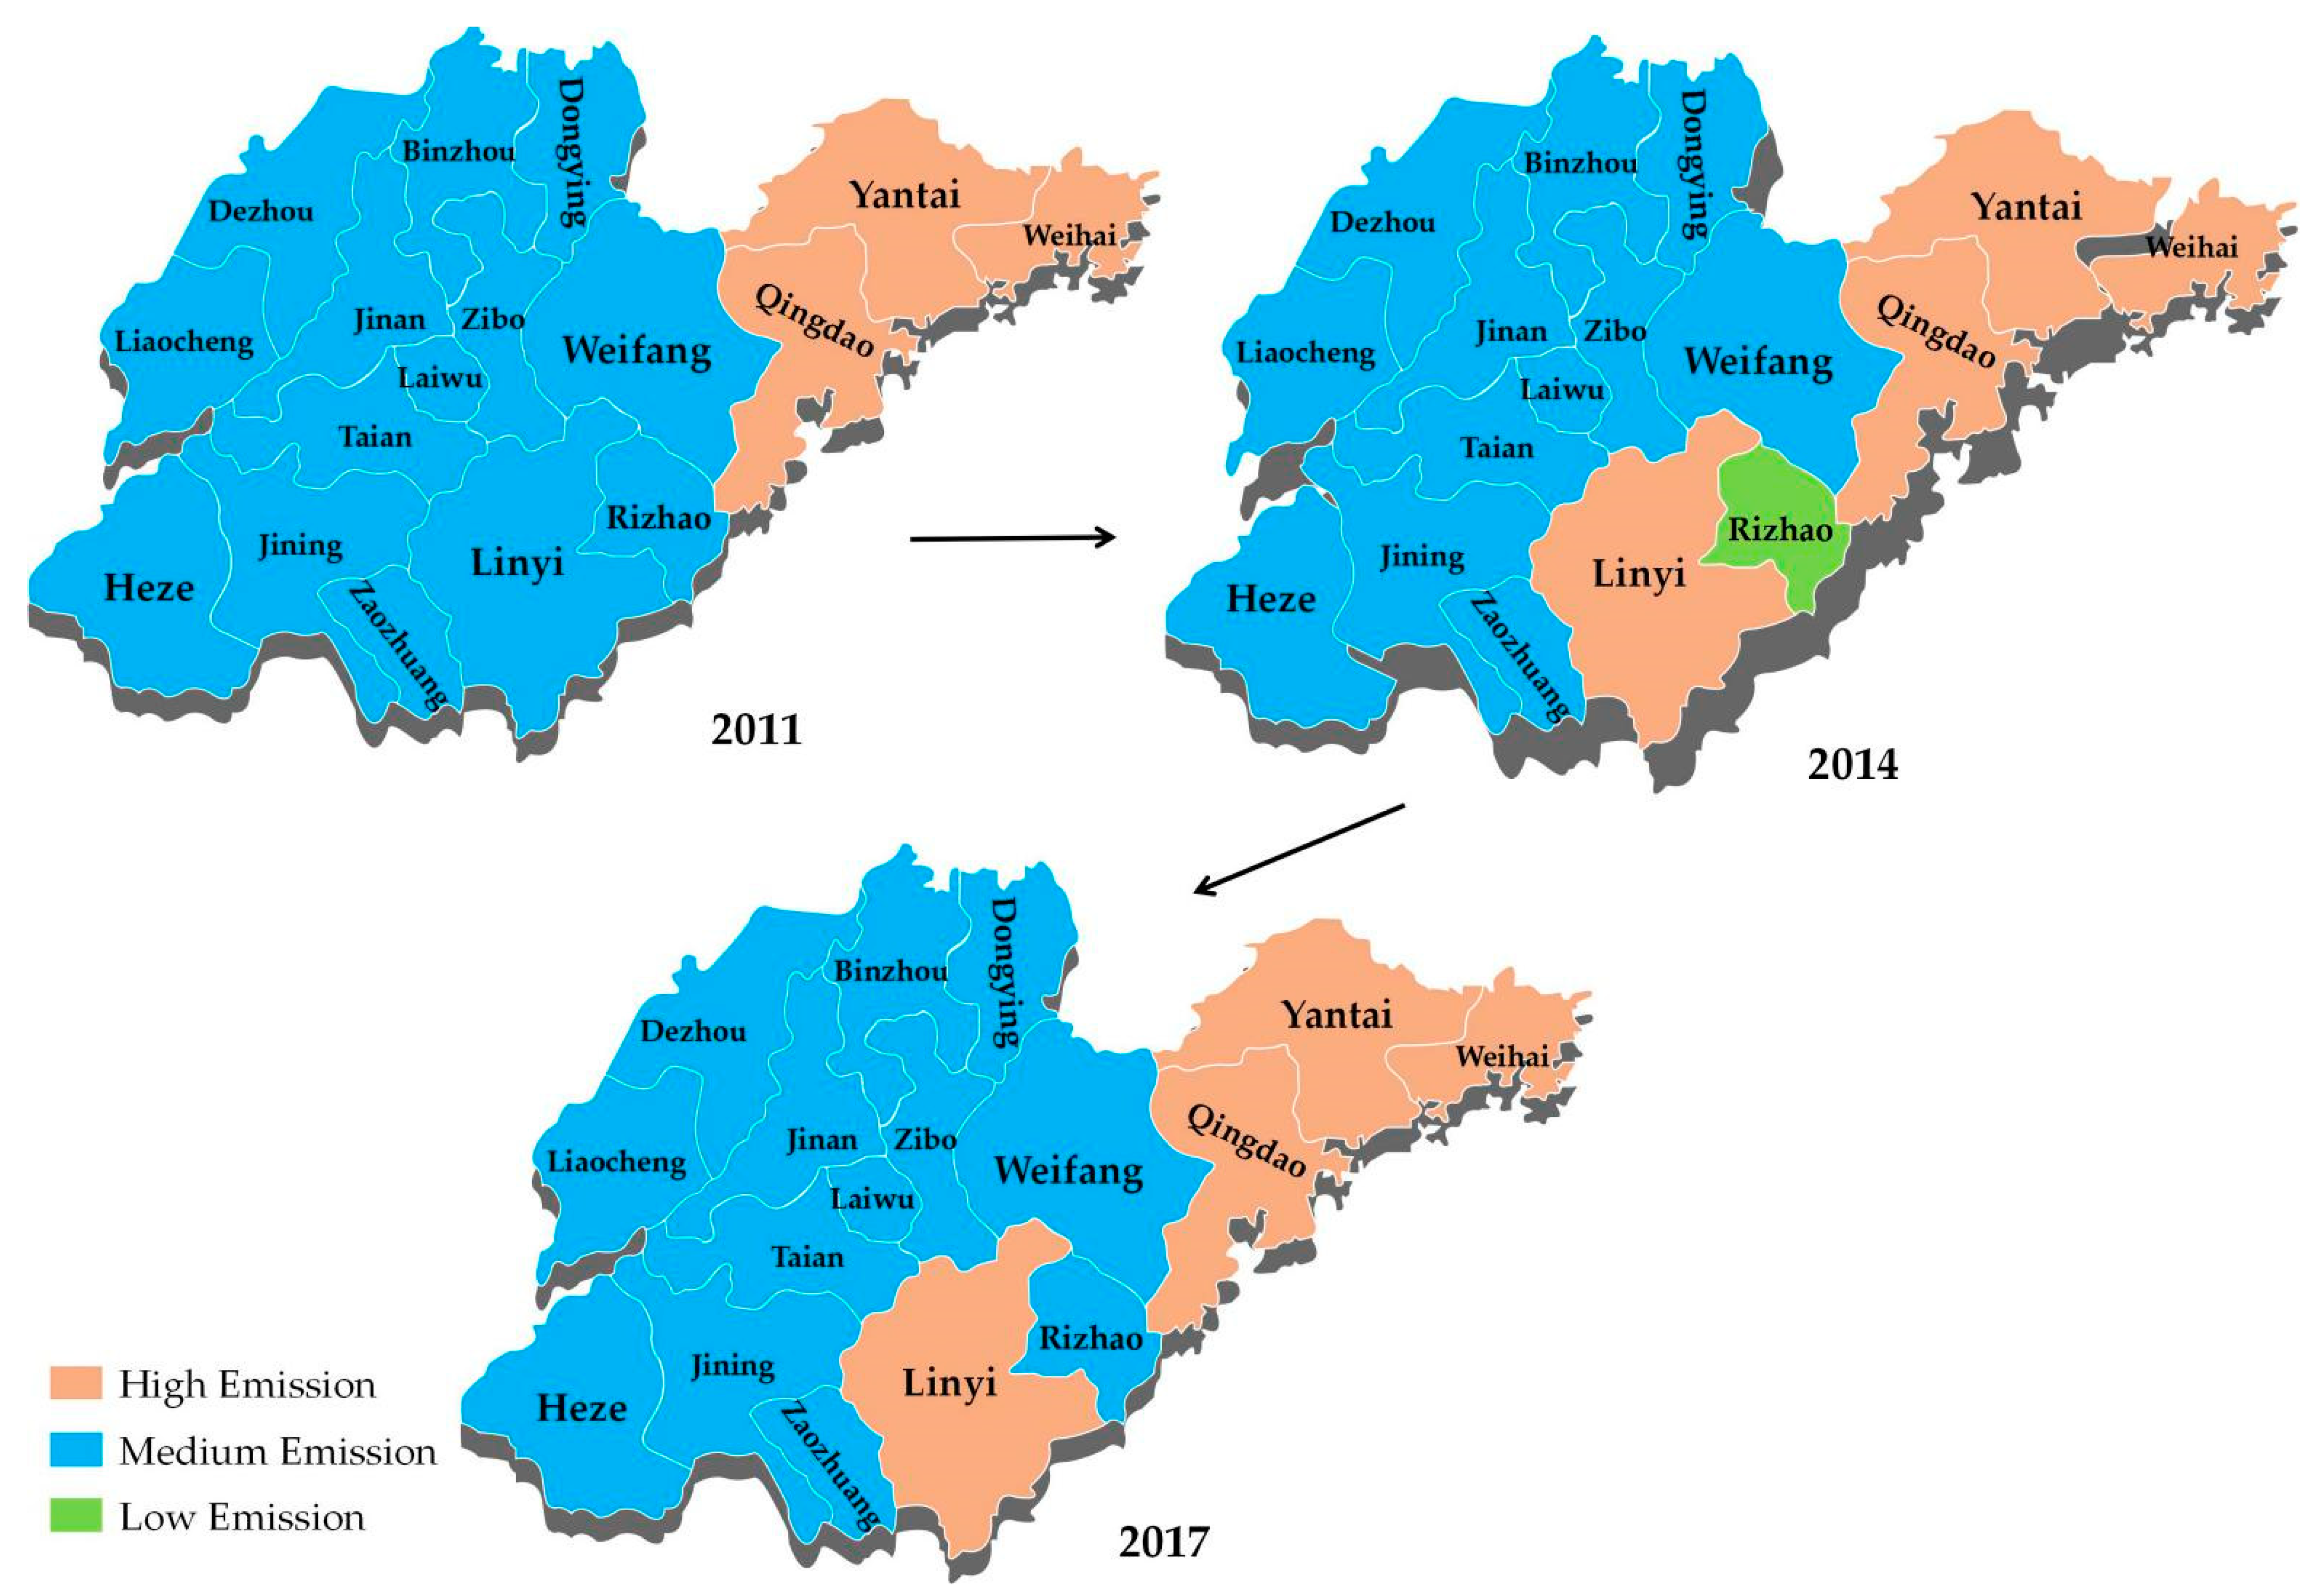
3.4.1. Carbon Emissions

In this section, three periods, 2011, 2014 and 2017, are taken to map the distribution pattern of carbon emissions. These maps will provide a better picture of the spatio-temporal evolution of carbon emissions in eastern China. In addition, carbon emissions are classified into three classes—high, medium and low emissions—based on the “expectation ± 1 times standard deviation” (data processed by Winsor 95%). Figure 3, Figure 4, Figure 5 and Figure 6 depict the spatial and temporal evolution of carbon emissions at the prefecture level in eastern China. It can be found that:
In Figure 3, the relative levels of carbon emissions in Fujian, Zhejiang and Jiangsu Provinces have not changed at any of the three time points (2011, 2014, 2017). From Figure 3a, we can see that the relative levels of carbon emissions in Beijing, Tianjin and Shanghai are all at a high level and have not changed over time, with the exception of Beijing. Figure 3b shows that the overall level of carbon emissions in Jiangsu Province is high, with the northern part at an intermediate level, but the southern part is at a high level. Figure 3c shows that Hangzhou and Huzhou have high carbon emissions, while the southeastern part of Zhejiang Province has moderate emissions. Figure 3d shows that Fujian Province has a low overall level of carbon emissions, with its relatively less economically developed northwestern region having low carbon emissions, while its southeastern coastal region has relatively higher carbon emissions.
In Figure 4, the overall level of carbon emissions in Hebei Province is moderate and the relative emission levels of the other prefecture-level cities have not changed over time, except for Lanfang where the level of carbon emissions has increased.
In Figure 5, the overall level of carbon emissions in Shandong Province is moderate, with the western region having lower levels than the eastern region. At the same time, it can be found that the carbon emission levels in its southeastern region (Rizhao, Linyi) are reduced.
In Figure 6, the overall level of carbon emissions in Guangdong Province is low, where the level of carbon emissions decreases in all directions with Guangzhou as the strongest center. At the same time, it can be noticed that the carbon emission levels of Shantou and Jieyang, which are located in the southeast of Guangdong Province, have increased as time progressed.

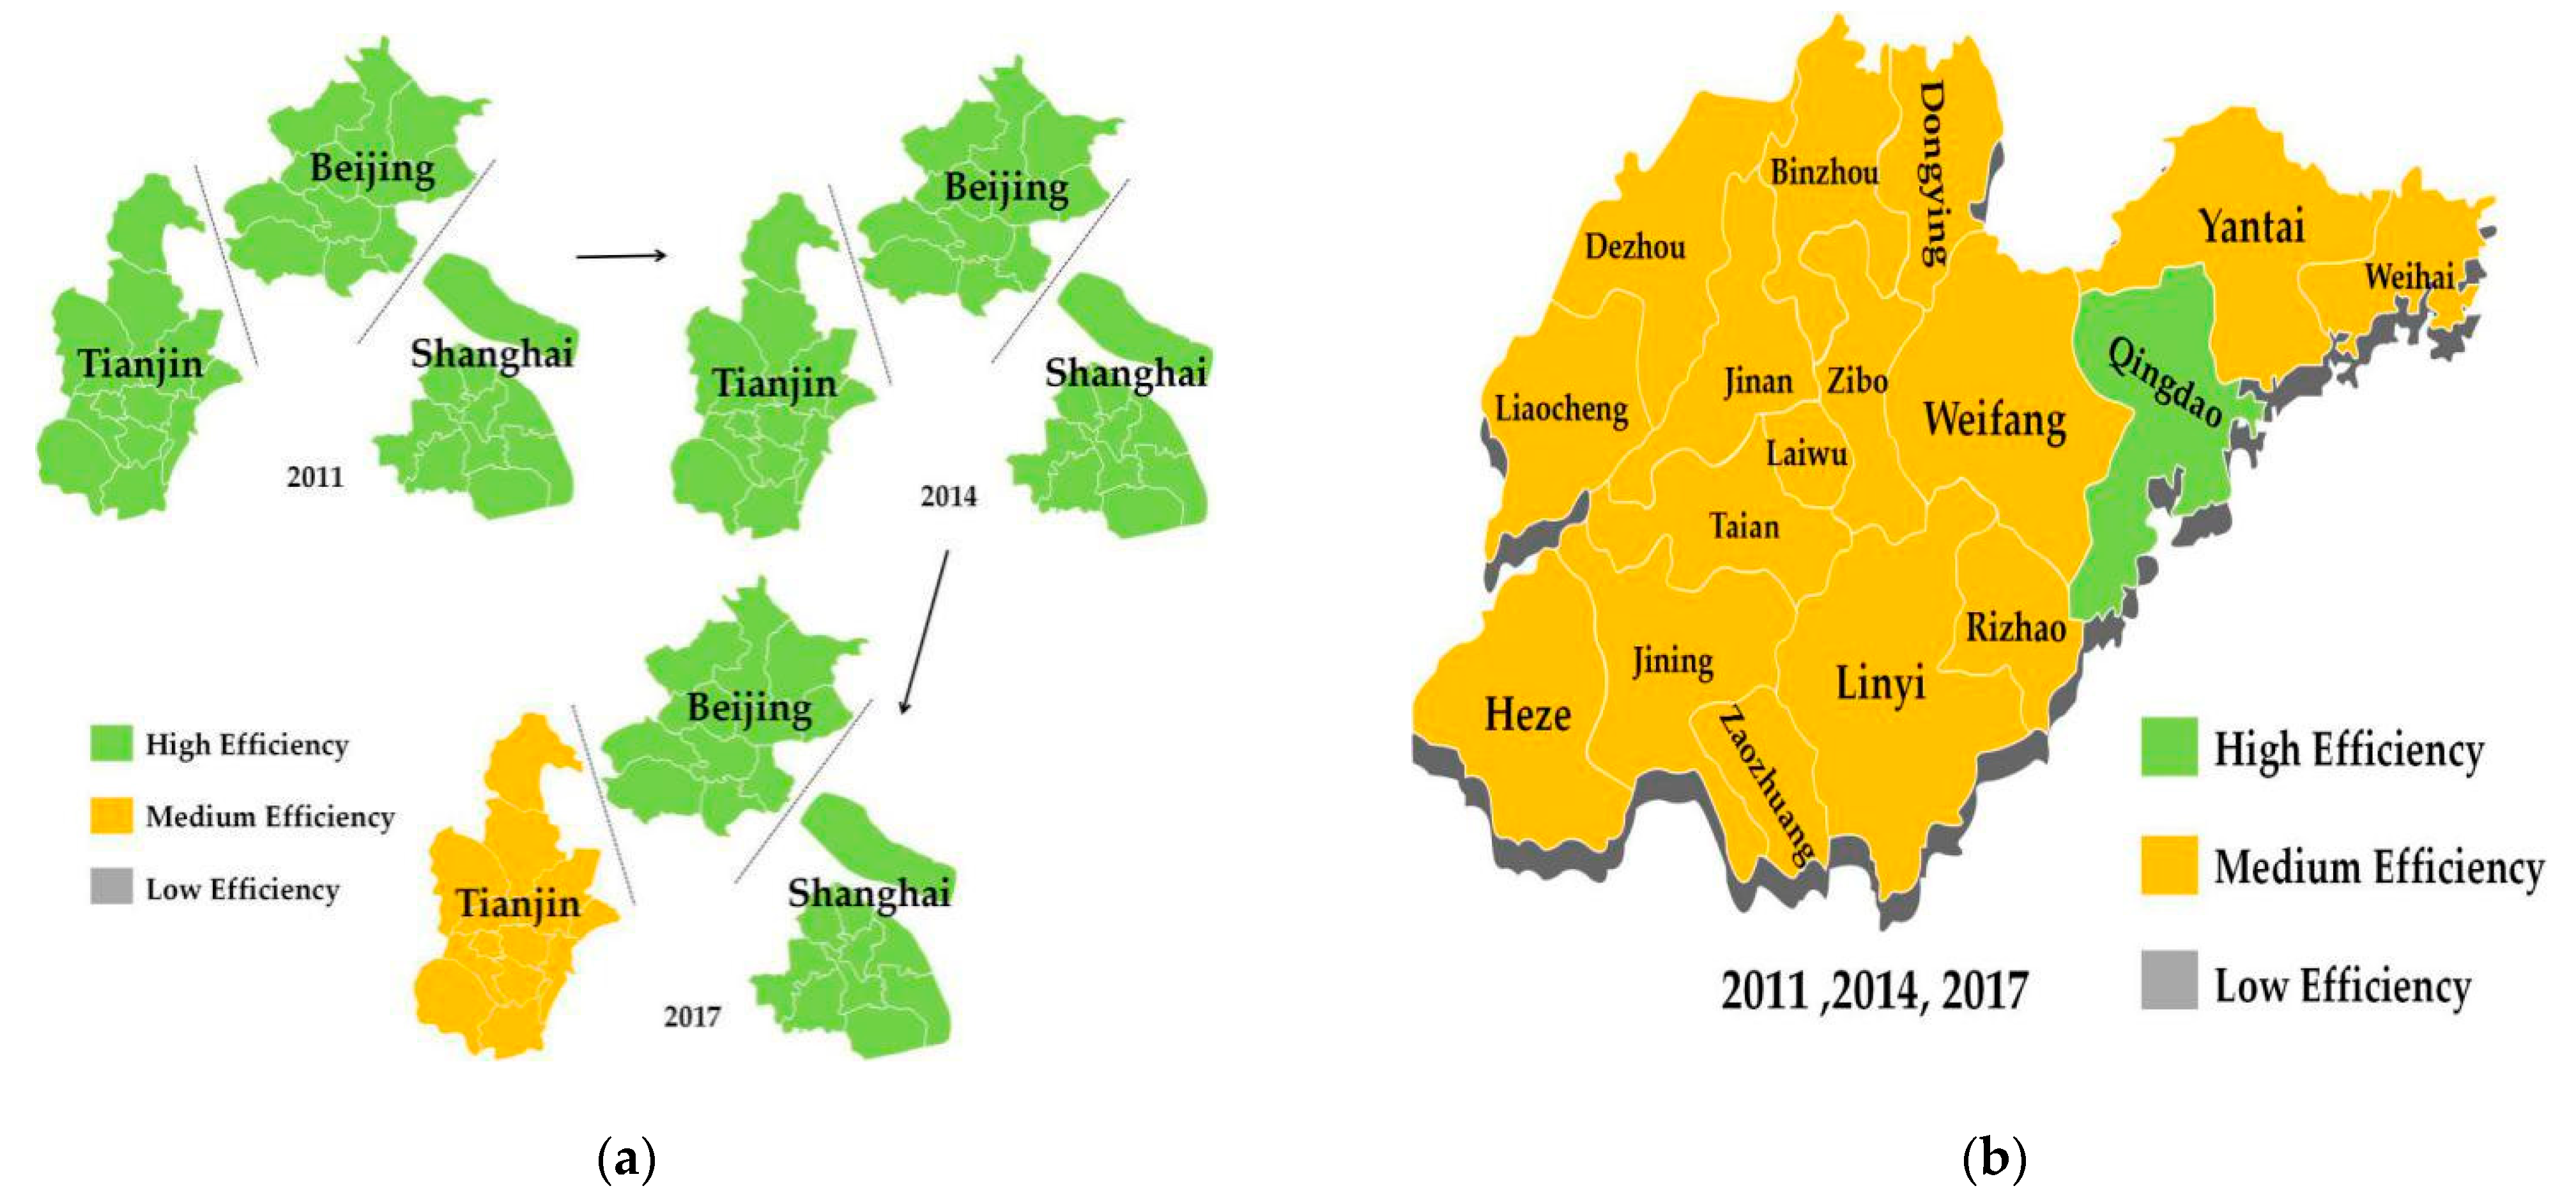
3.4.2. Land Economic Efficiency

Similarly, according to the method in Section 3.4.1, Figure 7, Figure 8, Figure 9 and Figure 10 present maps of the spatio-temporal evolution of land economic efficiency (Land_EcoE) in 2011, 2014 and 2017. It can be found that:
In Figure 7a, the Land_EcoE levels in the three municipalities of Beijing, Tianjin and Shanghai are all high, with the exception of Tianjin, which dropped to a moderate level in 2017, while the other two remained unchanged. In Figure 7b, the Land_EcoE in Shandong Province is at a moderate level overall, with only Qingdao at “high efficiency”. In addition, the relative levels of Land_EcoE in Shandong Province did not change as time progressed, and the trend was stable. In Figure 7c, the overall Land_EcoE in Zhejiang Province is at a moderate level. Among them, Quzhou and Lishui are “low efficiency” and Hangzhou and Shaoxing are “high efficiency”. However, as time progresses, the Land_EcoE levels of all regions in Zhejiang Province are at the “medium efficiency” stage and tend to be homogeneous. In Figure 7d, the overall Land_EcoE in Fujian Province is at a low to moderate level. The relative efficiency of Nanping and Longyan is low, while the relative efficiency of Xiamen is high. Overall, the efficiency of southeastern Fujian Province is higher than that of northwestern Fujian Province, and although there is a tendency to assimilate towards “medium efficiency” over time, the pattern of higher efficiency in eastern Fujian Province is still evident.
In Figure 8, the overall Land_EcoE in Hebei Province is at a moderate to high level, with the southern and northern parts showing lower levels of efficiency than the central regions. In addition, three regions (Baoding, Zhangjiakou and Qinhuangdao) have seen their relative efficiency levels degrade over time, while the rest of the regions remain unchanged.
In Figure 9, the overall Land_EcoE in Jiangsu Province is at a moderate level, with higher levels of efficiency in Changzhou, Wuxi and Suzhou and lower levels in Suqian. It is clear that Land_EcoE in southern Jiangsu is higher. As time progresses, the efficiency levels of each region in Jiangsu tend to homogenize, with Suqian’s efficiency level increasing and Suzhou’s decreasing.
In Figure 10, the relative efficiency of land in Guangdong Province is at a low to medium level. The efficiency of Yunfu, Qingyuan, Shaoguan and Meizhou is low, while the efficiency of Guangzhou, Shenzhen, Zhongshan and Dongguan is high. It can be seen that Land_EcoE in Guangdong Province is centered on Shenzhen and radiates downwards in all directions, reflecting the central position of Shenzhen and the “siphon effect”. As time progresses, Land_EcoE in Guangdong does not change significantly, and three regions—Yunfu, Qingyuan and Meizhou—are still “low efficiency”.

3.4.3. Comprehensive Discussion

The above analysis of the spatio-temporal evolution of carbon emissions and land economic efficiency in each region shows that regions with high land economic efficiency generally do not have low carbon emissions (for example, Figure 3a and Figure 7a). This suggests that even in eastern China, it is difficult to achieve better land–economy–environment synergy. Such a conclusion contradicts hypothesis H1. However, this may not be the case as the map analysis requires a quantitative analysis of the econometric model. Furthermore, the study shows that the level of land economic efficiency in each region does not usually get worse as time progresses, but rarely breaks through to “high efficiency”. This suggests that the level of land economic efficiency in eastern China tends to be at the same level, indirectly reflecting the fact that each region in eastern China is actually improving its own land economic efficiency.

4. Empirical Design and Results

4.1. Model Design

This study involves data from 84 prefecture-level cities and municipalities from 2011–2017, and therefore uses a panel regression model. Referring to the C-D production function [66], the main regression model (Equation (5)) is developed.
l n C a r b o n i t = α + β L a n d _   E c o E i t + γ l n C o n t r o l i t + ε i t  
where i denotes prefecture-level city i and   t denotes year. C a r b o n i t denotes carbon emissions, L a n d _   E c o E i t denotes land economic efficiency and C o n t r o l i t denotes control variables, which in this study refer to foreign capital utilization intensity (Fore_CUI) and innovation intensity (Inno_I). ε i t denotes the random disturbance term.
Each region in the study has its own unique underpinnings, such as policies and culture, and these unique attributes may change over time. Therefore, in this study, θ t and σ i are added to Equation (5). θ t , which can control for changes over time, represents time fixed effects, and σ i , which controls for regional idiosyncrasies, represents spatial fixed effects.
l n C a r b o n i t = α + β L a n d _   E c o E i t + γ l n C o n t r o l i t + θ t + σ i + ε i t  
Equation (6) is used to test hypothesis H1, and this study proposes hypothesis H2 on the basis of hypothesis H1. In order to implement the process, this study constructs dummy variables ( D ), where, if region i belongs to the most economically developed group of regions in eastern China, D = 1 ; otherwise, D = 0 . The specific equation is as follows:
l n C a r b o n i t = α + β 1 L a n d _   E c o E i t + β 2 D L a n d _   E c o E i t + γ l n C o n t r o l i t + θ t + σ i + ε i t  

4.2. Regression Results

In this study, the regression of the model of Equation (6) was performed using Stata15SE software, and the results are shown in Table 3. Table 3(I), (II) and (III) show the regression results of Equation (6) controlling for random effects, fixed effects and two-way fixed effects, respectively. It can be found that all three fail the 10% significance test, indicating that there is no definite relationship between land economic efficiency and carbon emissions in eastern China and hypothesis H1 is not valid. However, there are regional differences in carbon emissions, and the more economically developed regions are more “green” [44]. The essence of this study is to investigate the impact of land economic efficiency on carbon emissions in economically prosperous regions. Although the overall economic level of eastern China is higher than that of central and western China, there are still some provinces and prefecture-level cities with average economic levels.

4.3. Further Analysis

In this study, the regression of the model of Equation (7) was performed using Stata15SE software, and the results are shown in Table 4. This study screens out regions with high economic levels in eastern China by comparing the averages of regional GDP from 2011–2017. Two groups of regions were screened using “expectation + 1 times standard deviation” and “expectation” as the bounds. A-group: Beijing, Tianjin, Shanghai, Nanjing, Hangzhou, Guangzhou, Shenzhen and Foshan, a total of eight prefecture-level cities. B-group: on the basis of A-group, 10 prefecture-level cities, Tangshan City, Wuxi City, Changzhou City, Suzhou City, Ningbo City, Xiamen City, Jinan City, Qingdao City, Zibo City and Dongguan City, are added, to a total of 18 prefecture-level cities. Table 4 reports the regression results for both groups and it can be found that the third column has the best regression effect in both A-group and B-group. In Table 4(III), the coefficient of Land_EcoE is significantly positive, indicating that for most regions in eastern China, the increase in land economic efficiency promotes carbon emissions and pollutes the environment. However, the coefficients of (D_A * Land_EcoE) and (D_B * Land_EcoE) are both negative and extremely significant, suggesting that the cities in eastern China with the most prosperous economies have been able to reduce carbon emissions and thus improve environmental pollution by increasing land economic efficiency. Therefore, hypothesis H2 holds.

5. Discussion

This paper first discusses the spatio-temporal evolution patterns of carbon emissions and land economic efficiency to form a basic understanding of the research content and preliminary conclusions. On this basis, this study further verifies and supplements the preliminary conclusions quantitatively by means of econometric models. By combining qualitative and quantitative methods, this study aims to conduct a more detailed study of the problem and draw more convincing conclusions. In addition, this study enriches the findings with the specificity of the entropy method of weight assignment. In this section, the findings of the study are analyzed and discussed in detail.

5.1. Discussions of Spatio-Temporal Evolution

5.1.1. Carbon Emissions

From spatial distribution patterns, the overall carbon emissions of coastal cities in eastern China are higher. In 2011, among the 84 prefecture cities in eastern China, there were 20 “low-emission” areas, 46 “medium-emission” areas and 18 “high-emission” areas. In 2014, the figures were 21, 43 and 20, respectively, and in 2017 they were 18, 46 and 20, respectively. It can be seen that the three categories of high-, medium- and low-emission regions do not obviously change, with “medium-emission” regions accounting for more than half of the overall distribution and the remaining two categories accounting for about a quarter each. When categorized by province and municipality, we can see that Beijing (12th), Shanghai (10th), Tianjin (23rd) and Hebei Province (13th) have higher carbon emissions, while Zhejiang Province (4th), Shandong Province and Jiangsu Province (2nd) have medium emissions, and Guangdong Province (1st) and Fujian Province (7th) have lower emissions, where the national ranking of the regional GDP is shown in brackets. It can be found that there is no strong positive correlation between carbon emissions and GDP. However, it cannot be denied that, with the exception of the special case of Guangdong Province, the rest of the regions that are economically developed are generally not low in carbon emissions. Among them, Beijing, Tianjin and Shanghai, which are the only municipalities directly under the central government, are ranked highly and therefore do not affect this conclusion.
From temporal trends, 77 regions, accounting for 91.67%, had unchanged carbon emission levels in 2011, 2014 and 2017, while only seven regions had changed their carbon emission levels. Of the seven regions that changed, only Beijing saw a decrease in carbon emissions. The decline in Beijing’s carbon emissions is due to the relocation of a large number of factories from Beijing to Hebei Province in recent years. At the same time, in 2017, Beijing launched a “coal-to-gas” strategy, using natural gas, a clean energy source, to replace coal as the main source of energy for winter heating. The analysis in this paragraph shows that the distribution of carbon emissions in eastern China has not changed obviously over time.

5.1.2. Land Economic Efficiency

From spatial distribution patterns, the land economic efficiency (Land_EcoE) of coastal cities in eastern China is significantly higher than that of other regions, but there is no significant difference between the north and the south. In 2011, among 84 municipal areas in eastern China, there were 18 “high-efficiency” areas, 57 “medium-efficiency” areas and 9 “low-efficiency” areas. Similarly, in 2014, the number was 17, 57 and 10, respectively. In 2017, it was 16, 62 and 6, respectively. It can be observed that the number of “high-efficiency” areas is slowly decreasing, the number of “medium-efficiency” areas is significantly increasing and that of “low-efficiency” areas is decreasing. Overall, the number of medium-Land_EcoE areas is higher, about 70%, and the number of “high-efficiency” areas is also significantly higher than that of “low-efficiency” areas, which is in line with the expectation of this study when selecting the more economically developed region of eastern China as the research target.
From temporal evolution trends, 66 regions, or 78.57% of the total, had a constant Land_EcoE level over the three time points 2011, 2014 and 2017. There were 18 regions where the level of efficiency changed, of which seven regions saw a decrease and 11 regions saw an increase. In addition, in 2017, for example, 12 of these 18 regions became “medium-efficiency” areas, while only two regions were downgraded. This indicates that the distribution of Land_EcoE in eastern China has gradually converged over time (becoming a “medium-efficiency” region) as Land_EcoE indicators in this study are relative indicators. This is in line with China’s development strategy of “common prosperity”, whereby some regions get rich first and then help others to get richer, thus achieving common prosperity.

5.2. Discussion of the Empirical Results

The aim of this study is to investigate whether the current economically developed regions of China can achieve synergistic environmental and economic development. Considering the current low land use efficiency in China [67], the purpose of the study is analyzing the correlation between land economic efficiency and environmental pollution (carbon emissions). Therefore, this study establishes the first hypothesis: there is a positive correlation between the increase in land economic efficiency and the improvement of environmental pollution in eastern China. However, the results of Table 3 show that there is no significant correlation between Land_EcoE and carbon emissions in eastern China. This may be due to the fact that even in economically developed eastern China, there are still some economically underdeveloped municipal areas. Accordingly, this study sets up a second hypothesis: there is a positive relationship between the increase in land economic efficiency and the improvement of environmental pollution in the most economically developed group of cities in eastern China. The results in Table 3 clearly show that the eastern regions of China, as a whole, still do not show co-development of land economic efficiency and environmental pollution improvement. However, in the most economically developed cities of eastern China, there is an extremely significant negative correlation between Land_EcoE and carbon emissions (Table 4). This indicates that these economically developed regions have achieved synergistic development in economy–land–environment, indirectly indicating the effectiveness of China’s existing economic development plans.
In addition, the evaluation system of land economic efficiency (Table 1) shows that R&D intensity (24.41%) and industrial production intensity (22.62%) contribute the most to the composite indicator of land economic efficiency, while with tertiary industrial production intensity (13.40%) and employment density (12.71%), the total contribution reaches 74.14%. This figure does not reflect their “importance” for land economic efficiency, but rather implies the degree of variation between regions in the other four secondary indicators (GDP growth rate, share of tertiary output, GDP per capita and road density) is relatively low. Therefore, this study argues that there is a need for regions with low land economic efficiency to pay more attention to the economic content of the first four indicators.

6. Conclusions

In the context of the world’s call for “peak carbon” and “carbon neutral” efforts, China is faced with the choice between economic development and environmental protection. In addition, China’s rapid urbanization as a developing country has led to problems such as inefficient land use. Under these conditions, the Chinese government is adjusting its approach to development and transforming itself into an innovative powerhouse. Therefore, after years of transformation and development, are China’s prosperous regions able to alleviate the conflict between economy and environment? Exploring the spatio-temporal evolution patterns of land economic efficiency and environmental pollution, and the interrelationship between the two, is an important guide to promote the synergistic development of land use efficiency, economic development and environmental governance. Using data from 84 prefecture-level cities and municipalities directly under the central government in eastern China from 2011–2017, this study measures the relative levels of land economic efficiency through the entropy method and plots the spatio-temporal evolution of carbon emissions and land economic efficiency to analyze the spatio-temporal characteristics of the two. Based on this, the study further identifies the relationship between land economic efficiency and carbon emissions through a general panel model, and obtains some insights on how to reconcile economic, land and environmental development.
The conclusions are as follows:
(1)
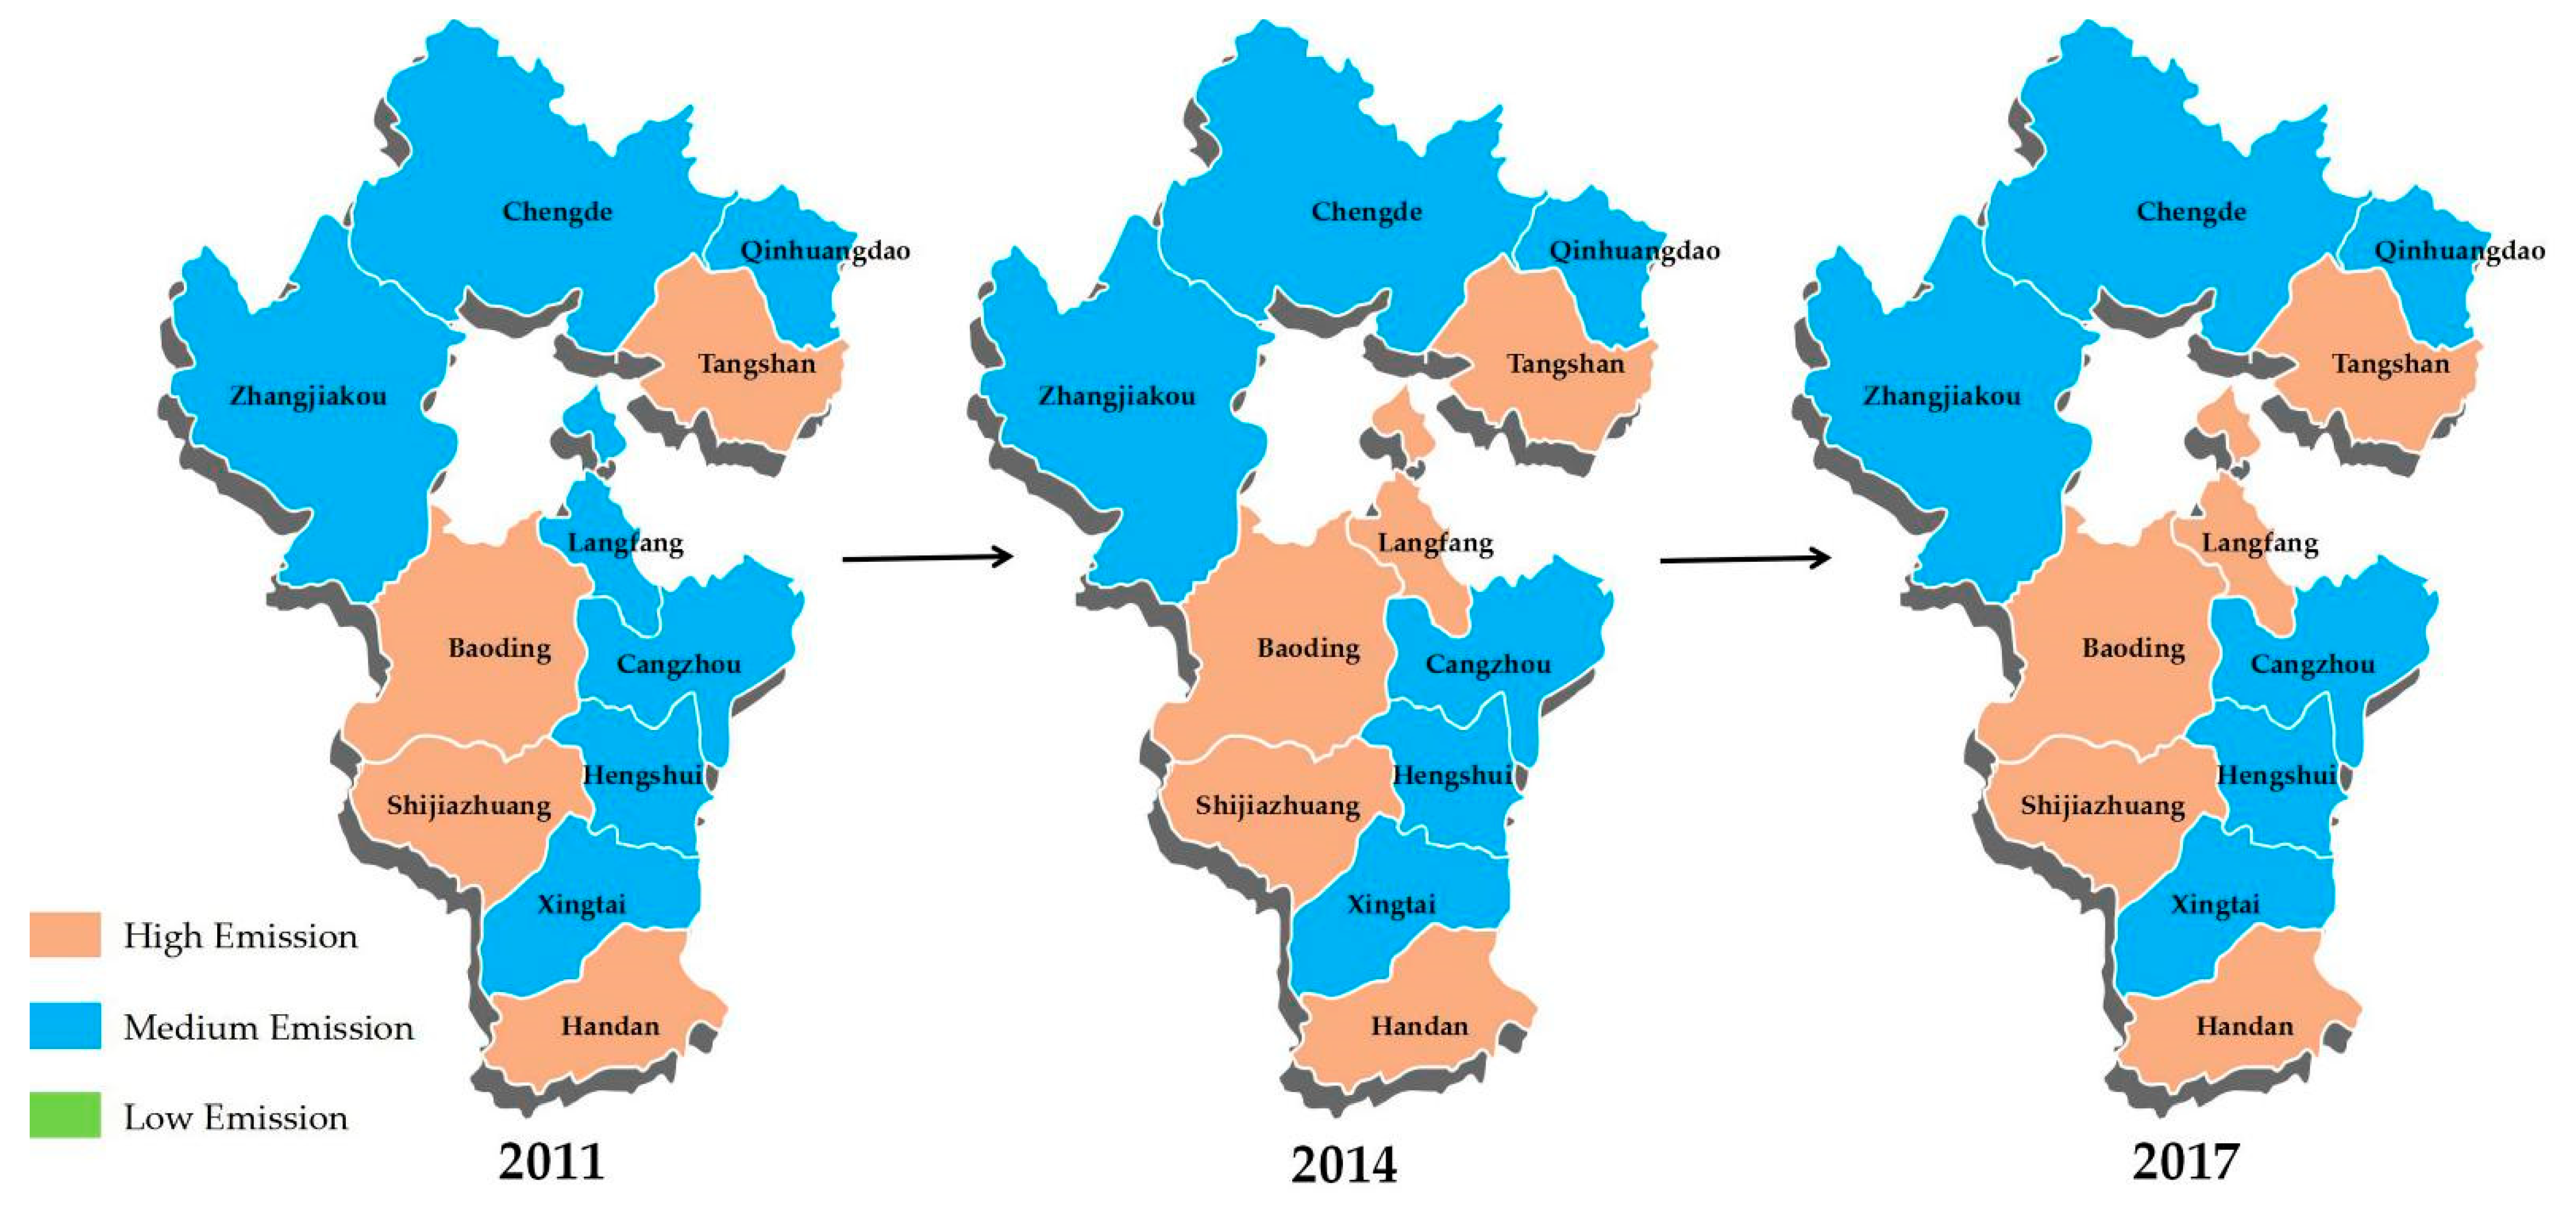
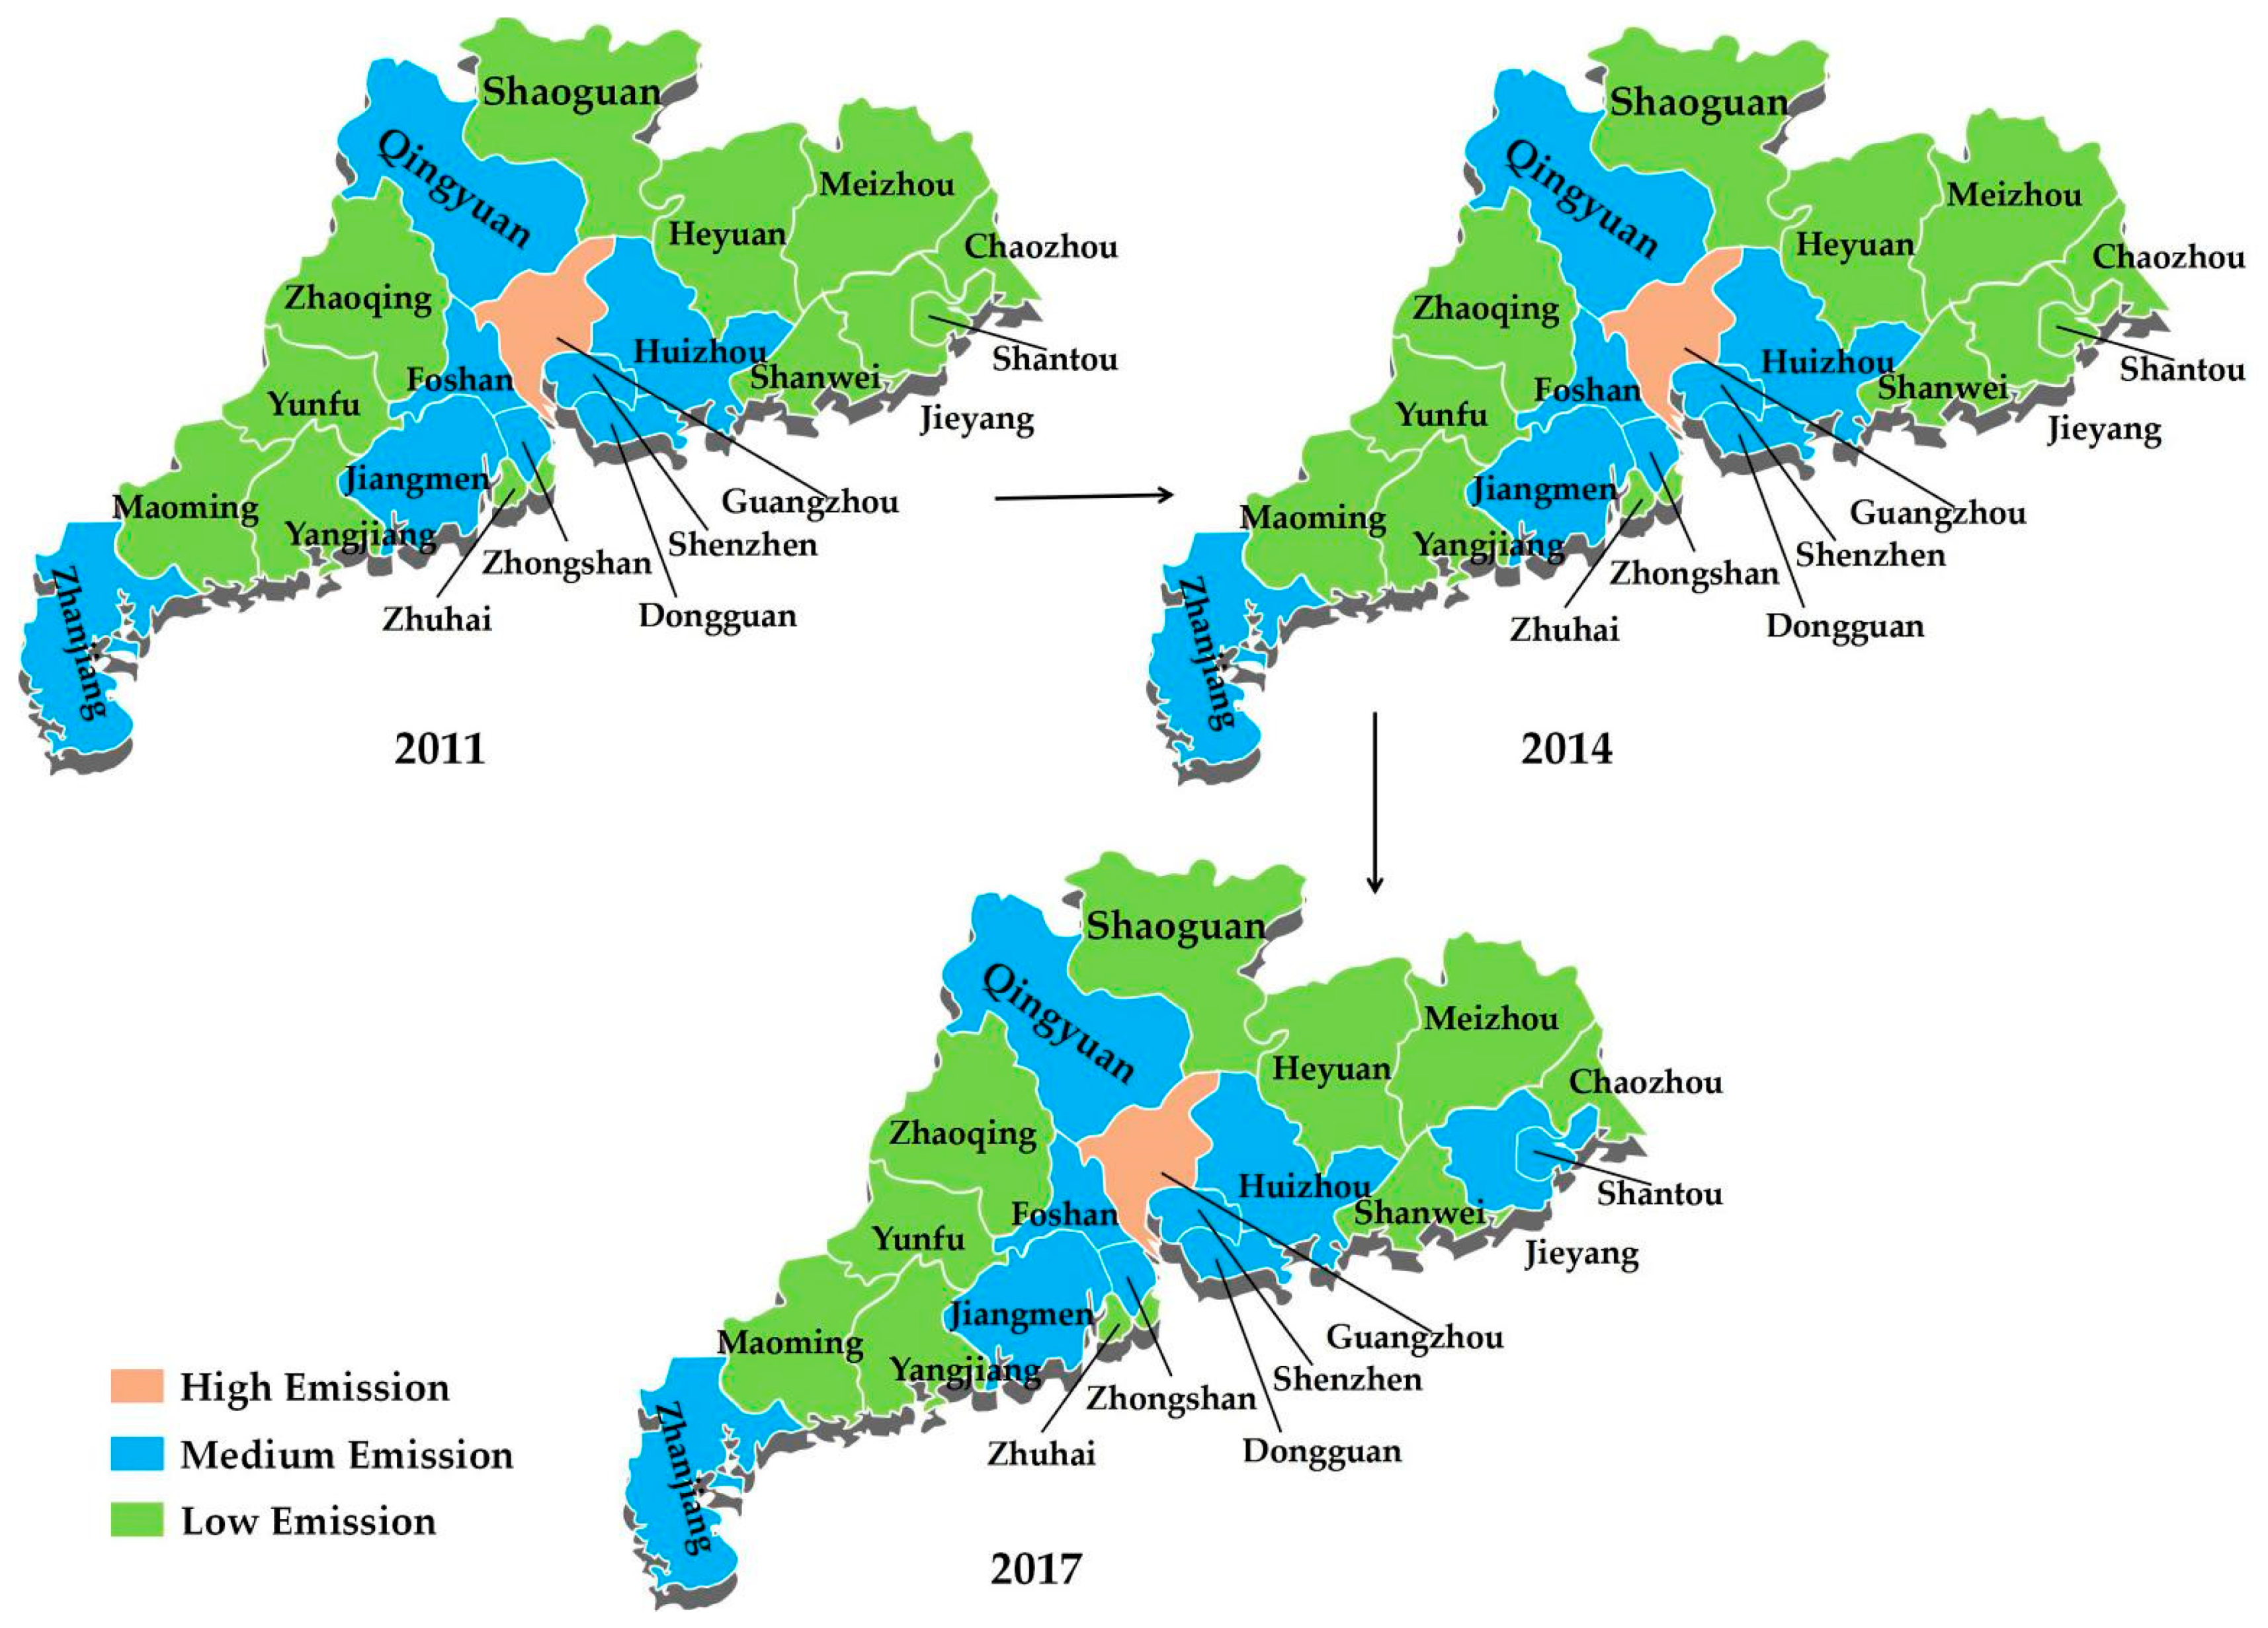
From 2011–2017, carbon emissions in eastern China were generally more spatially distributed along the coast than inland, and more to the north than to the south, and this pattern did not change over time. Only Beijing achieved a significant downgrade in carbon emissions in 2017 due to its special strategy (“factory relocation” and “coal-to-gas”) [68,69].
(2)
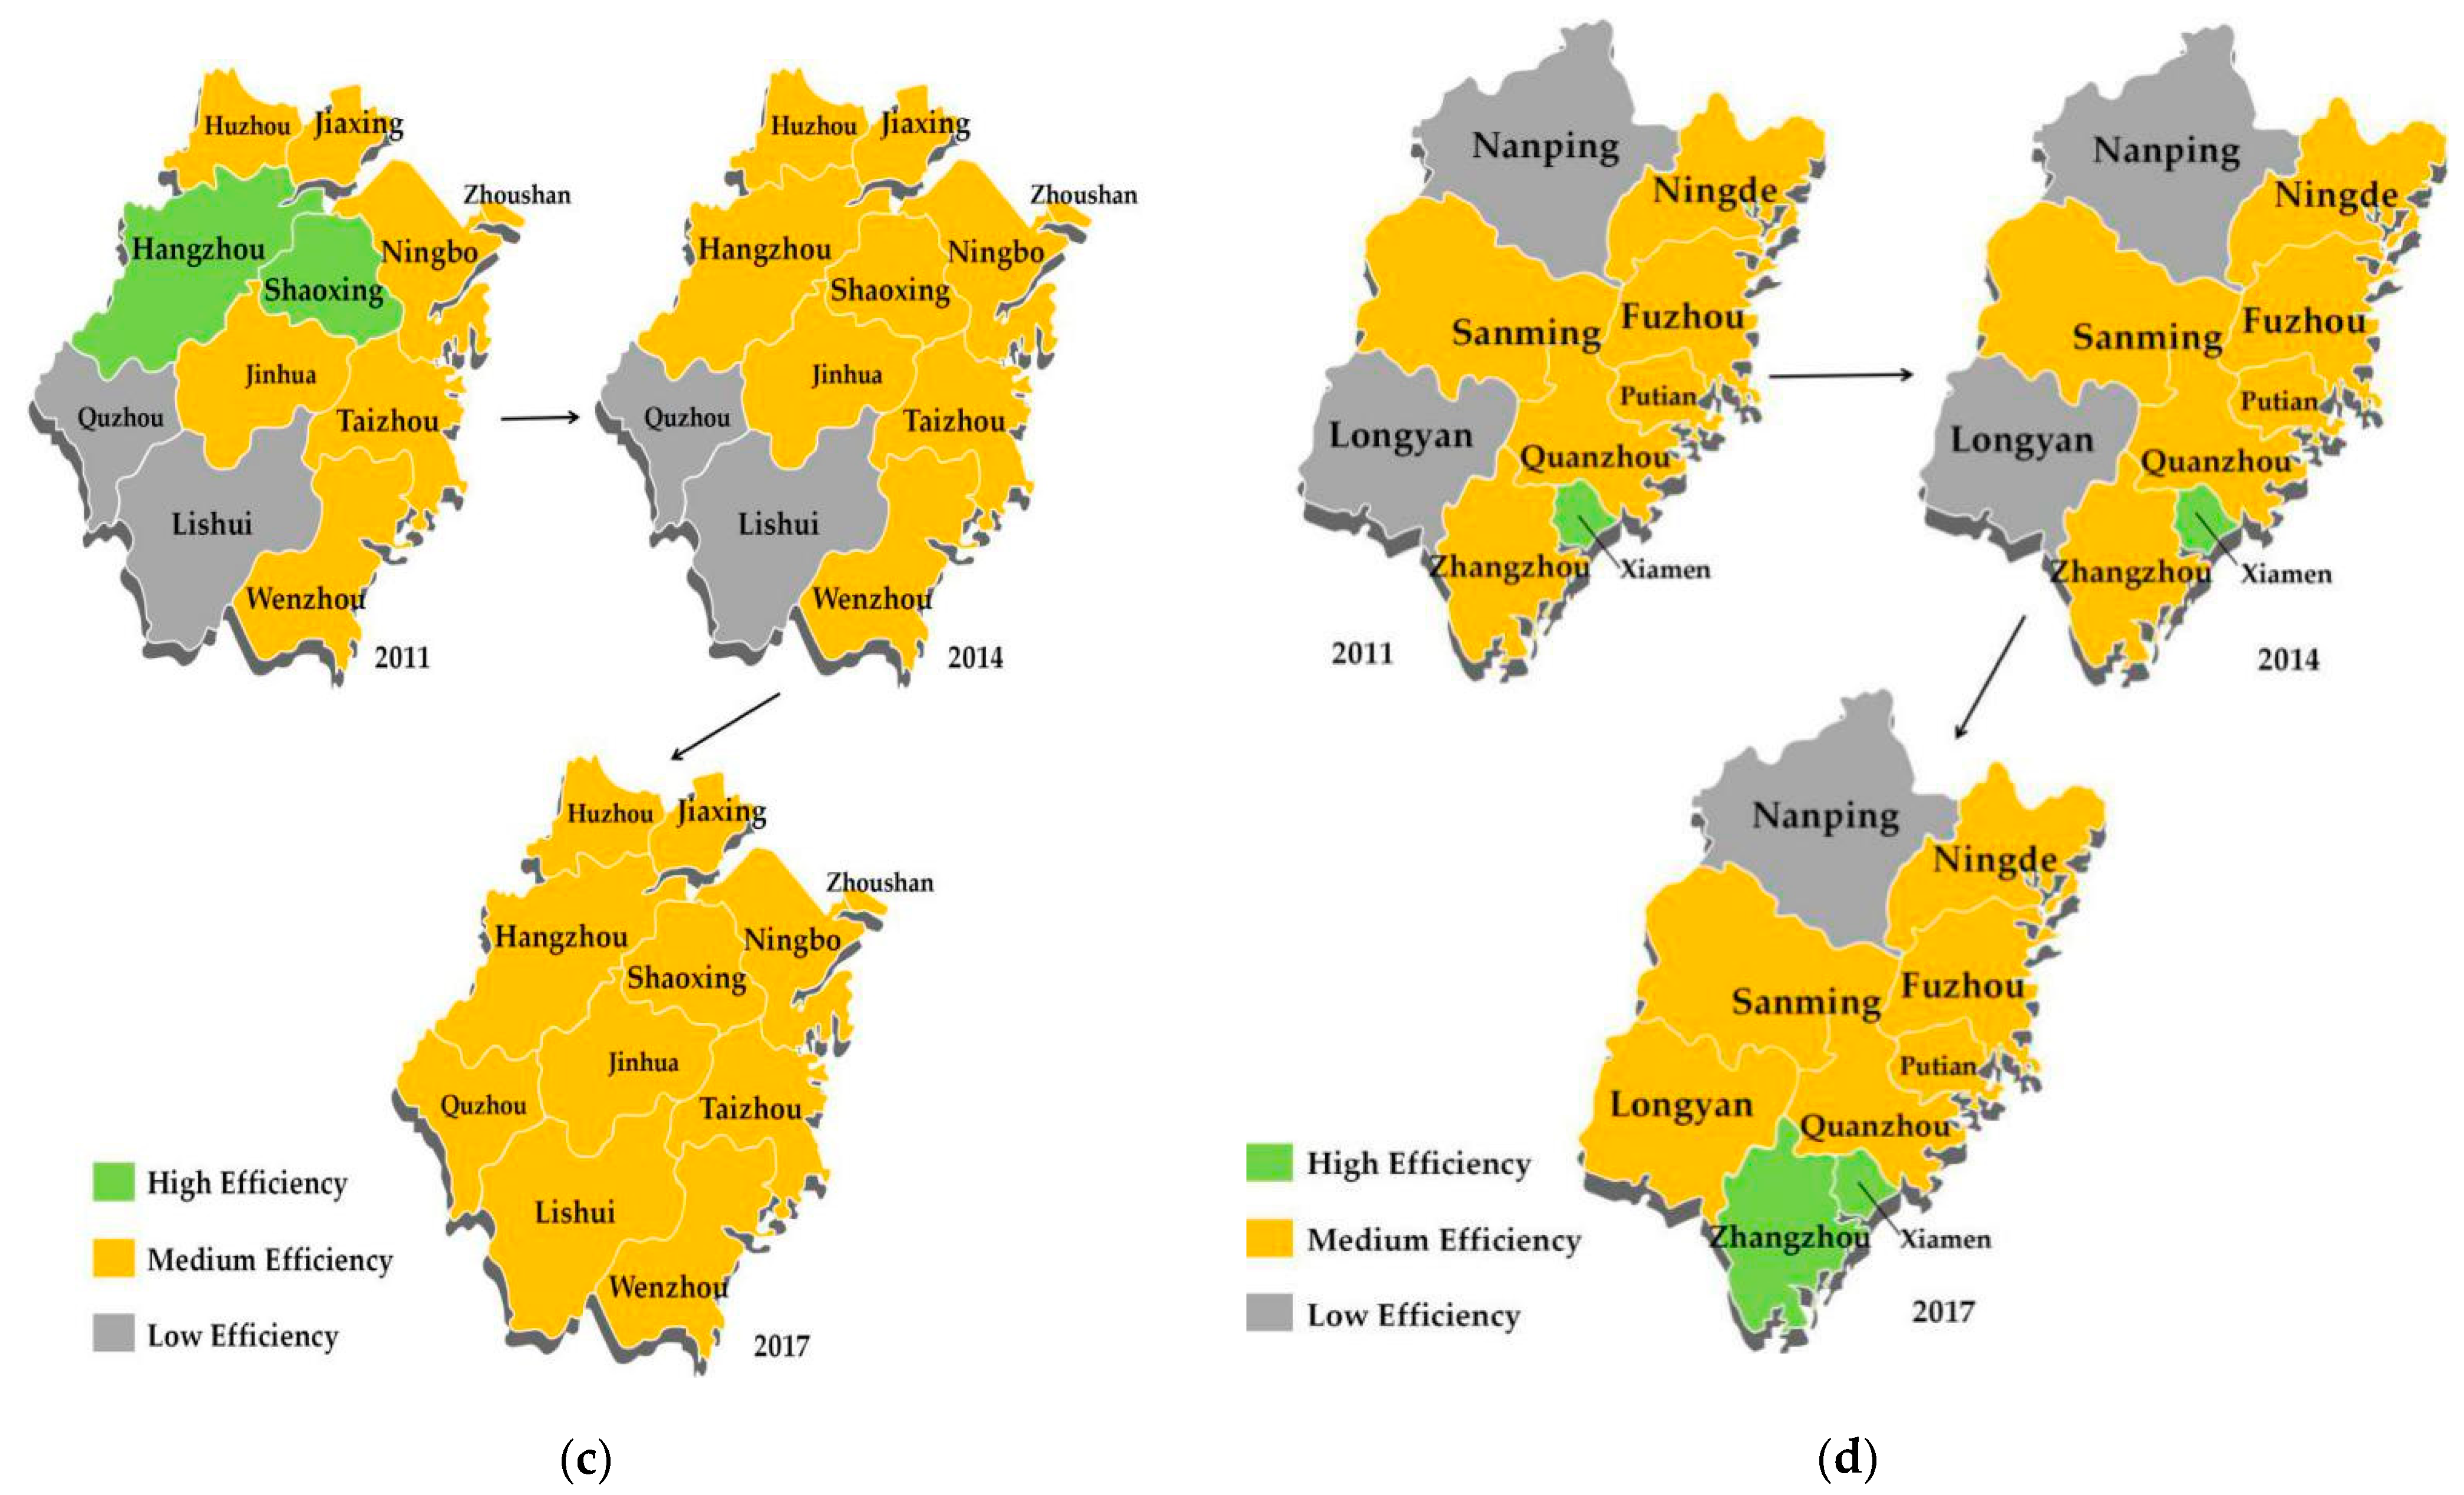
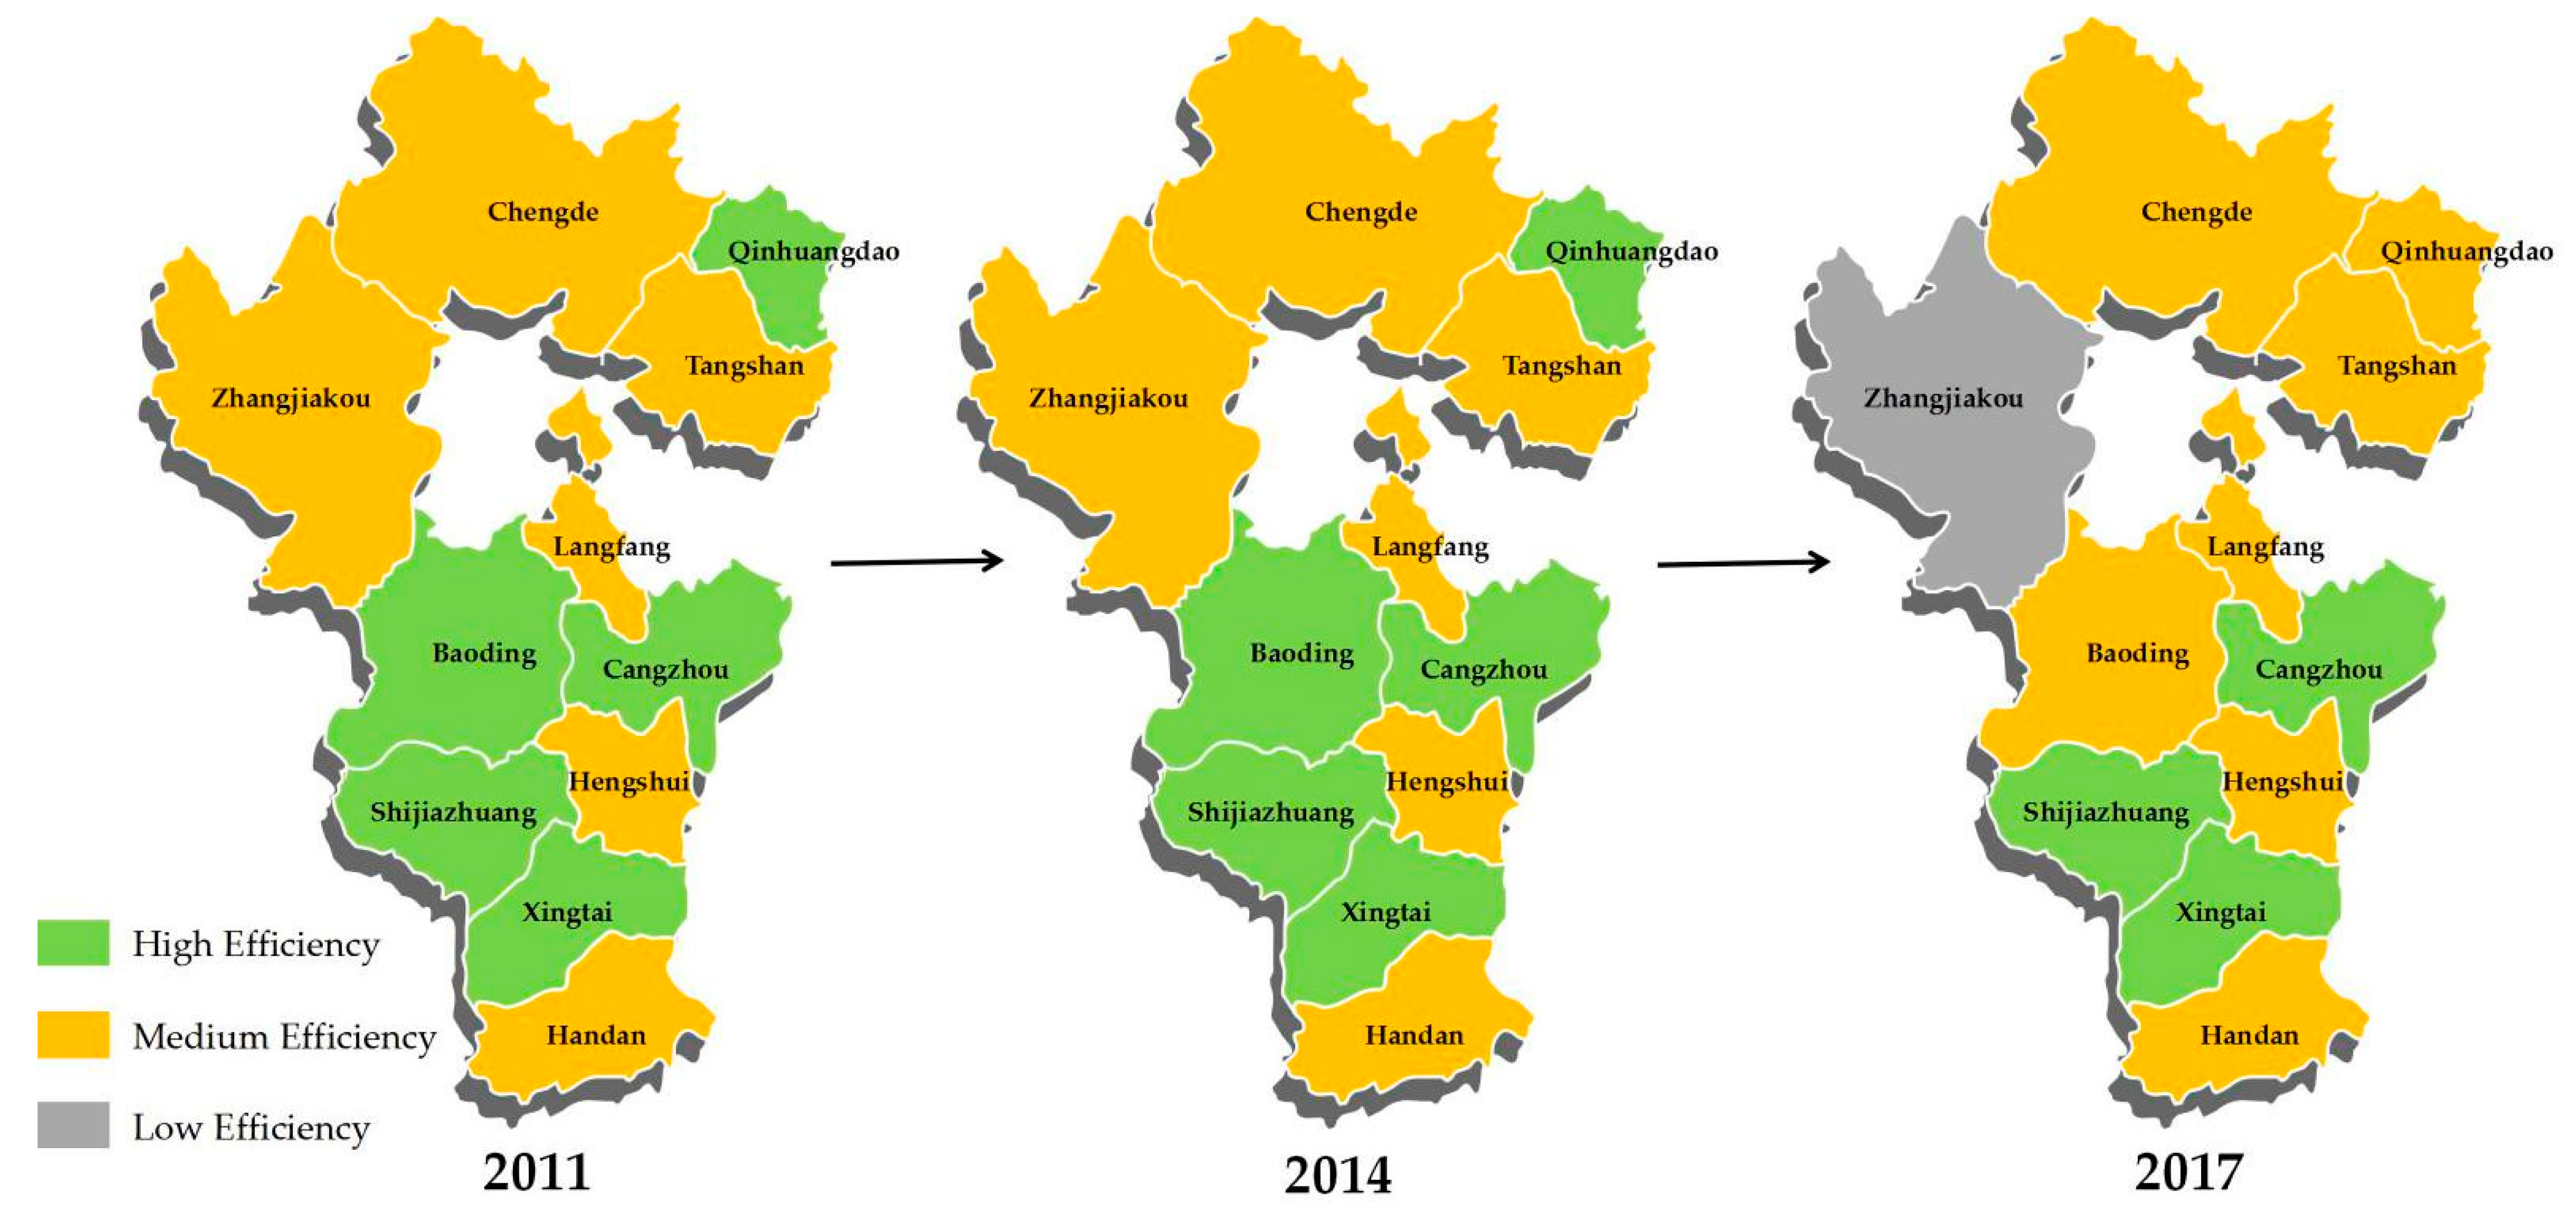
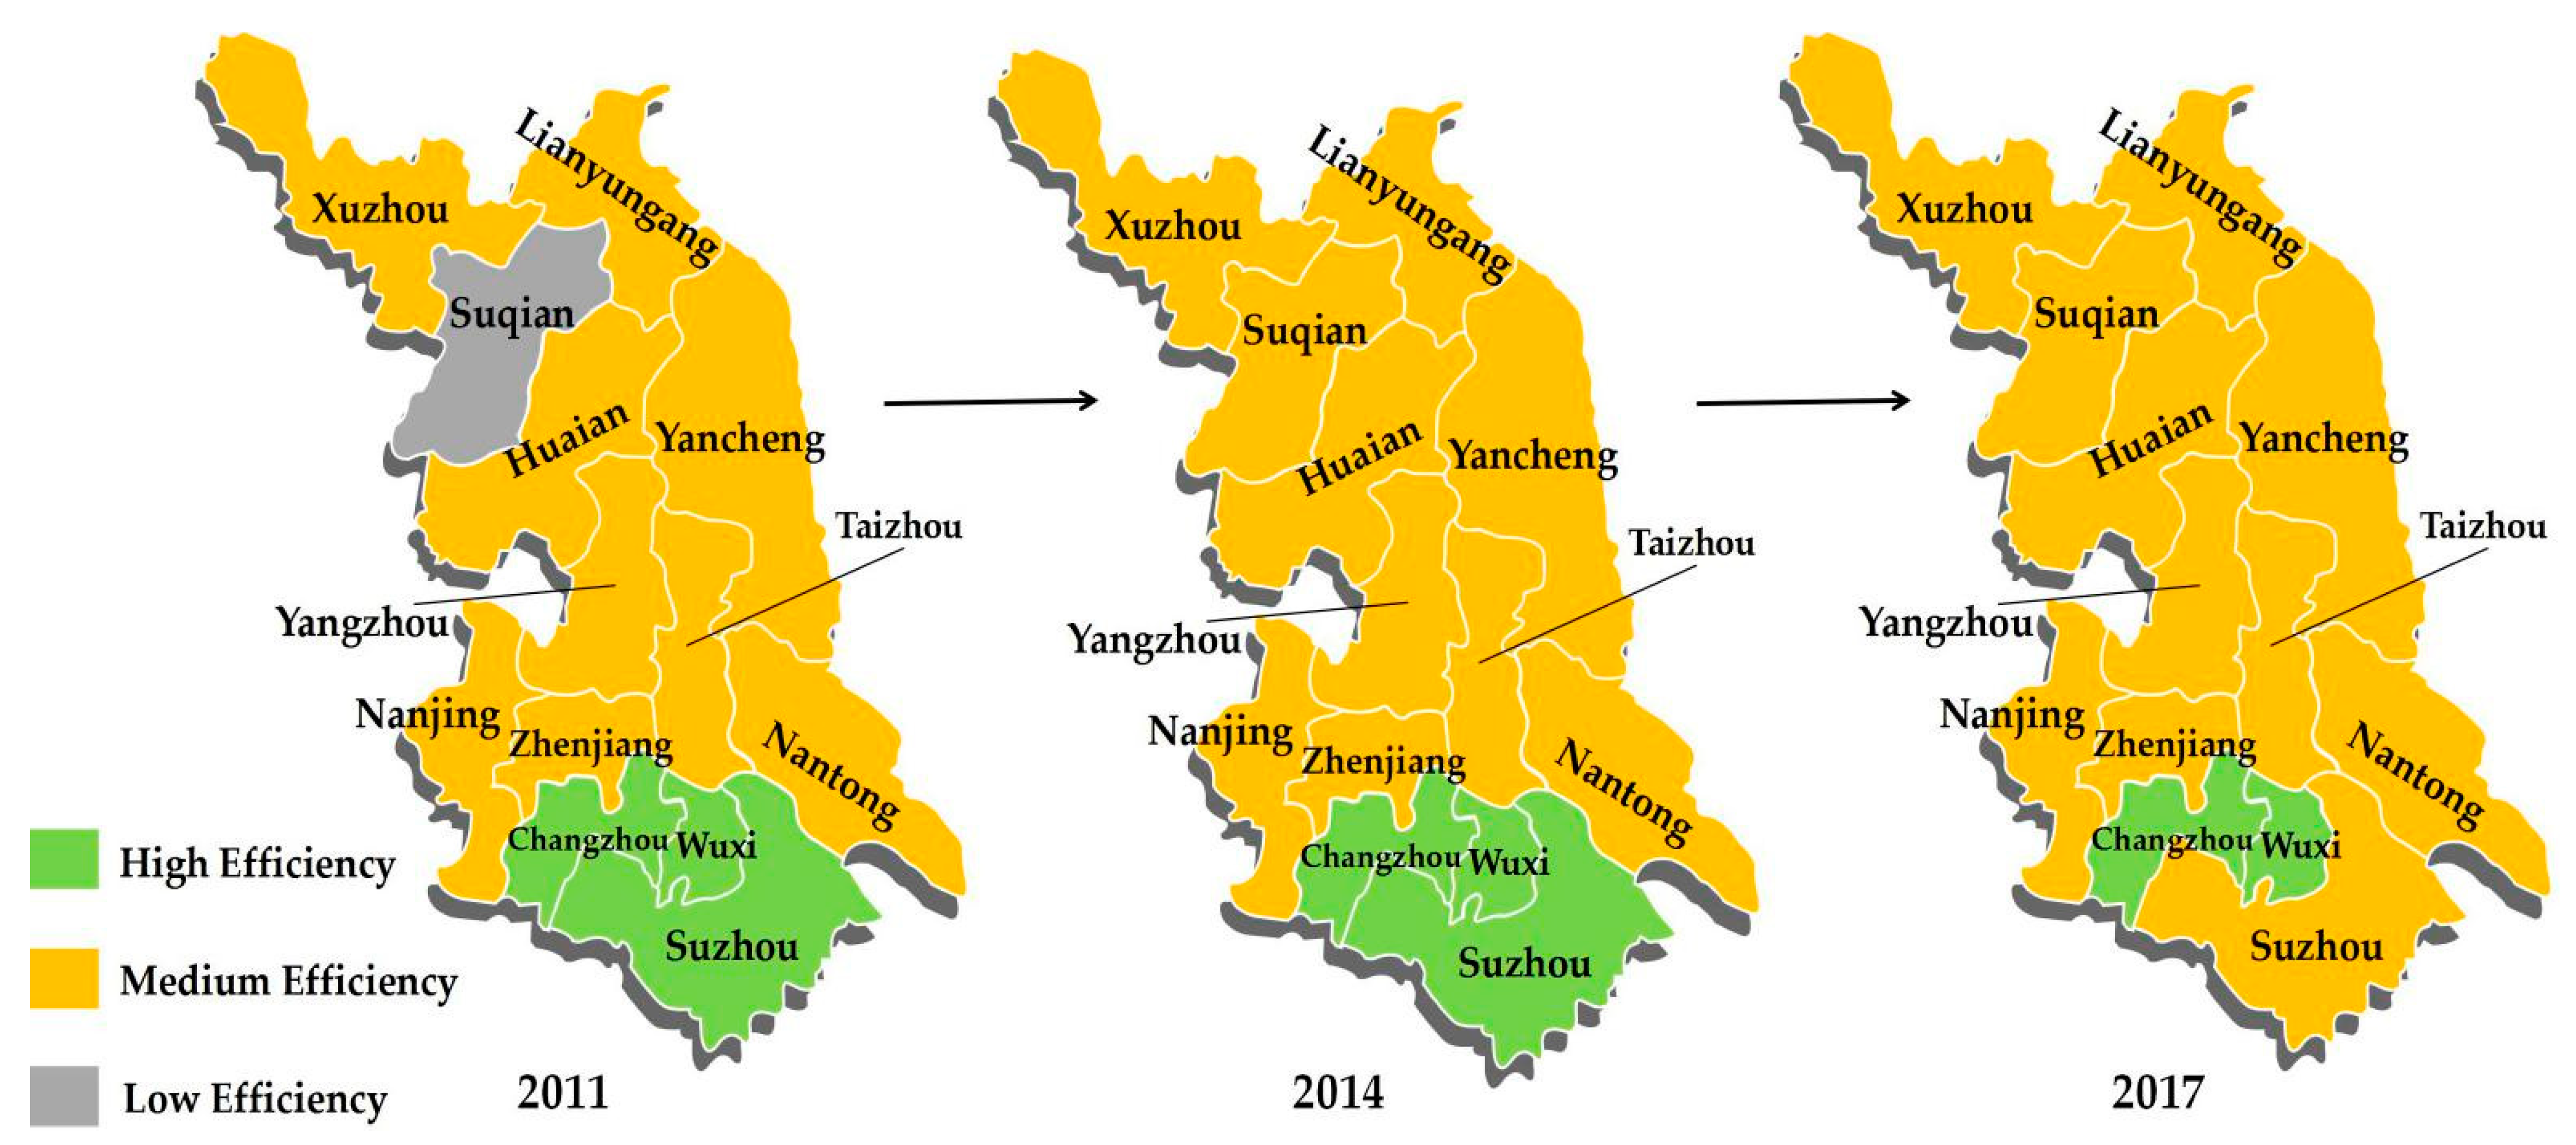
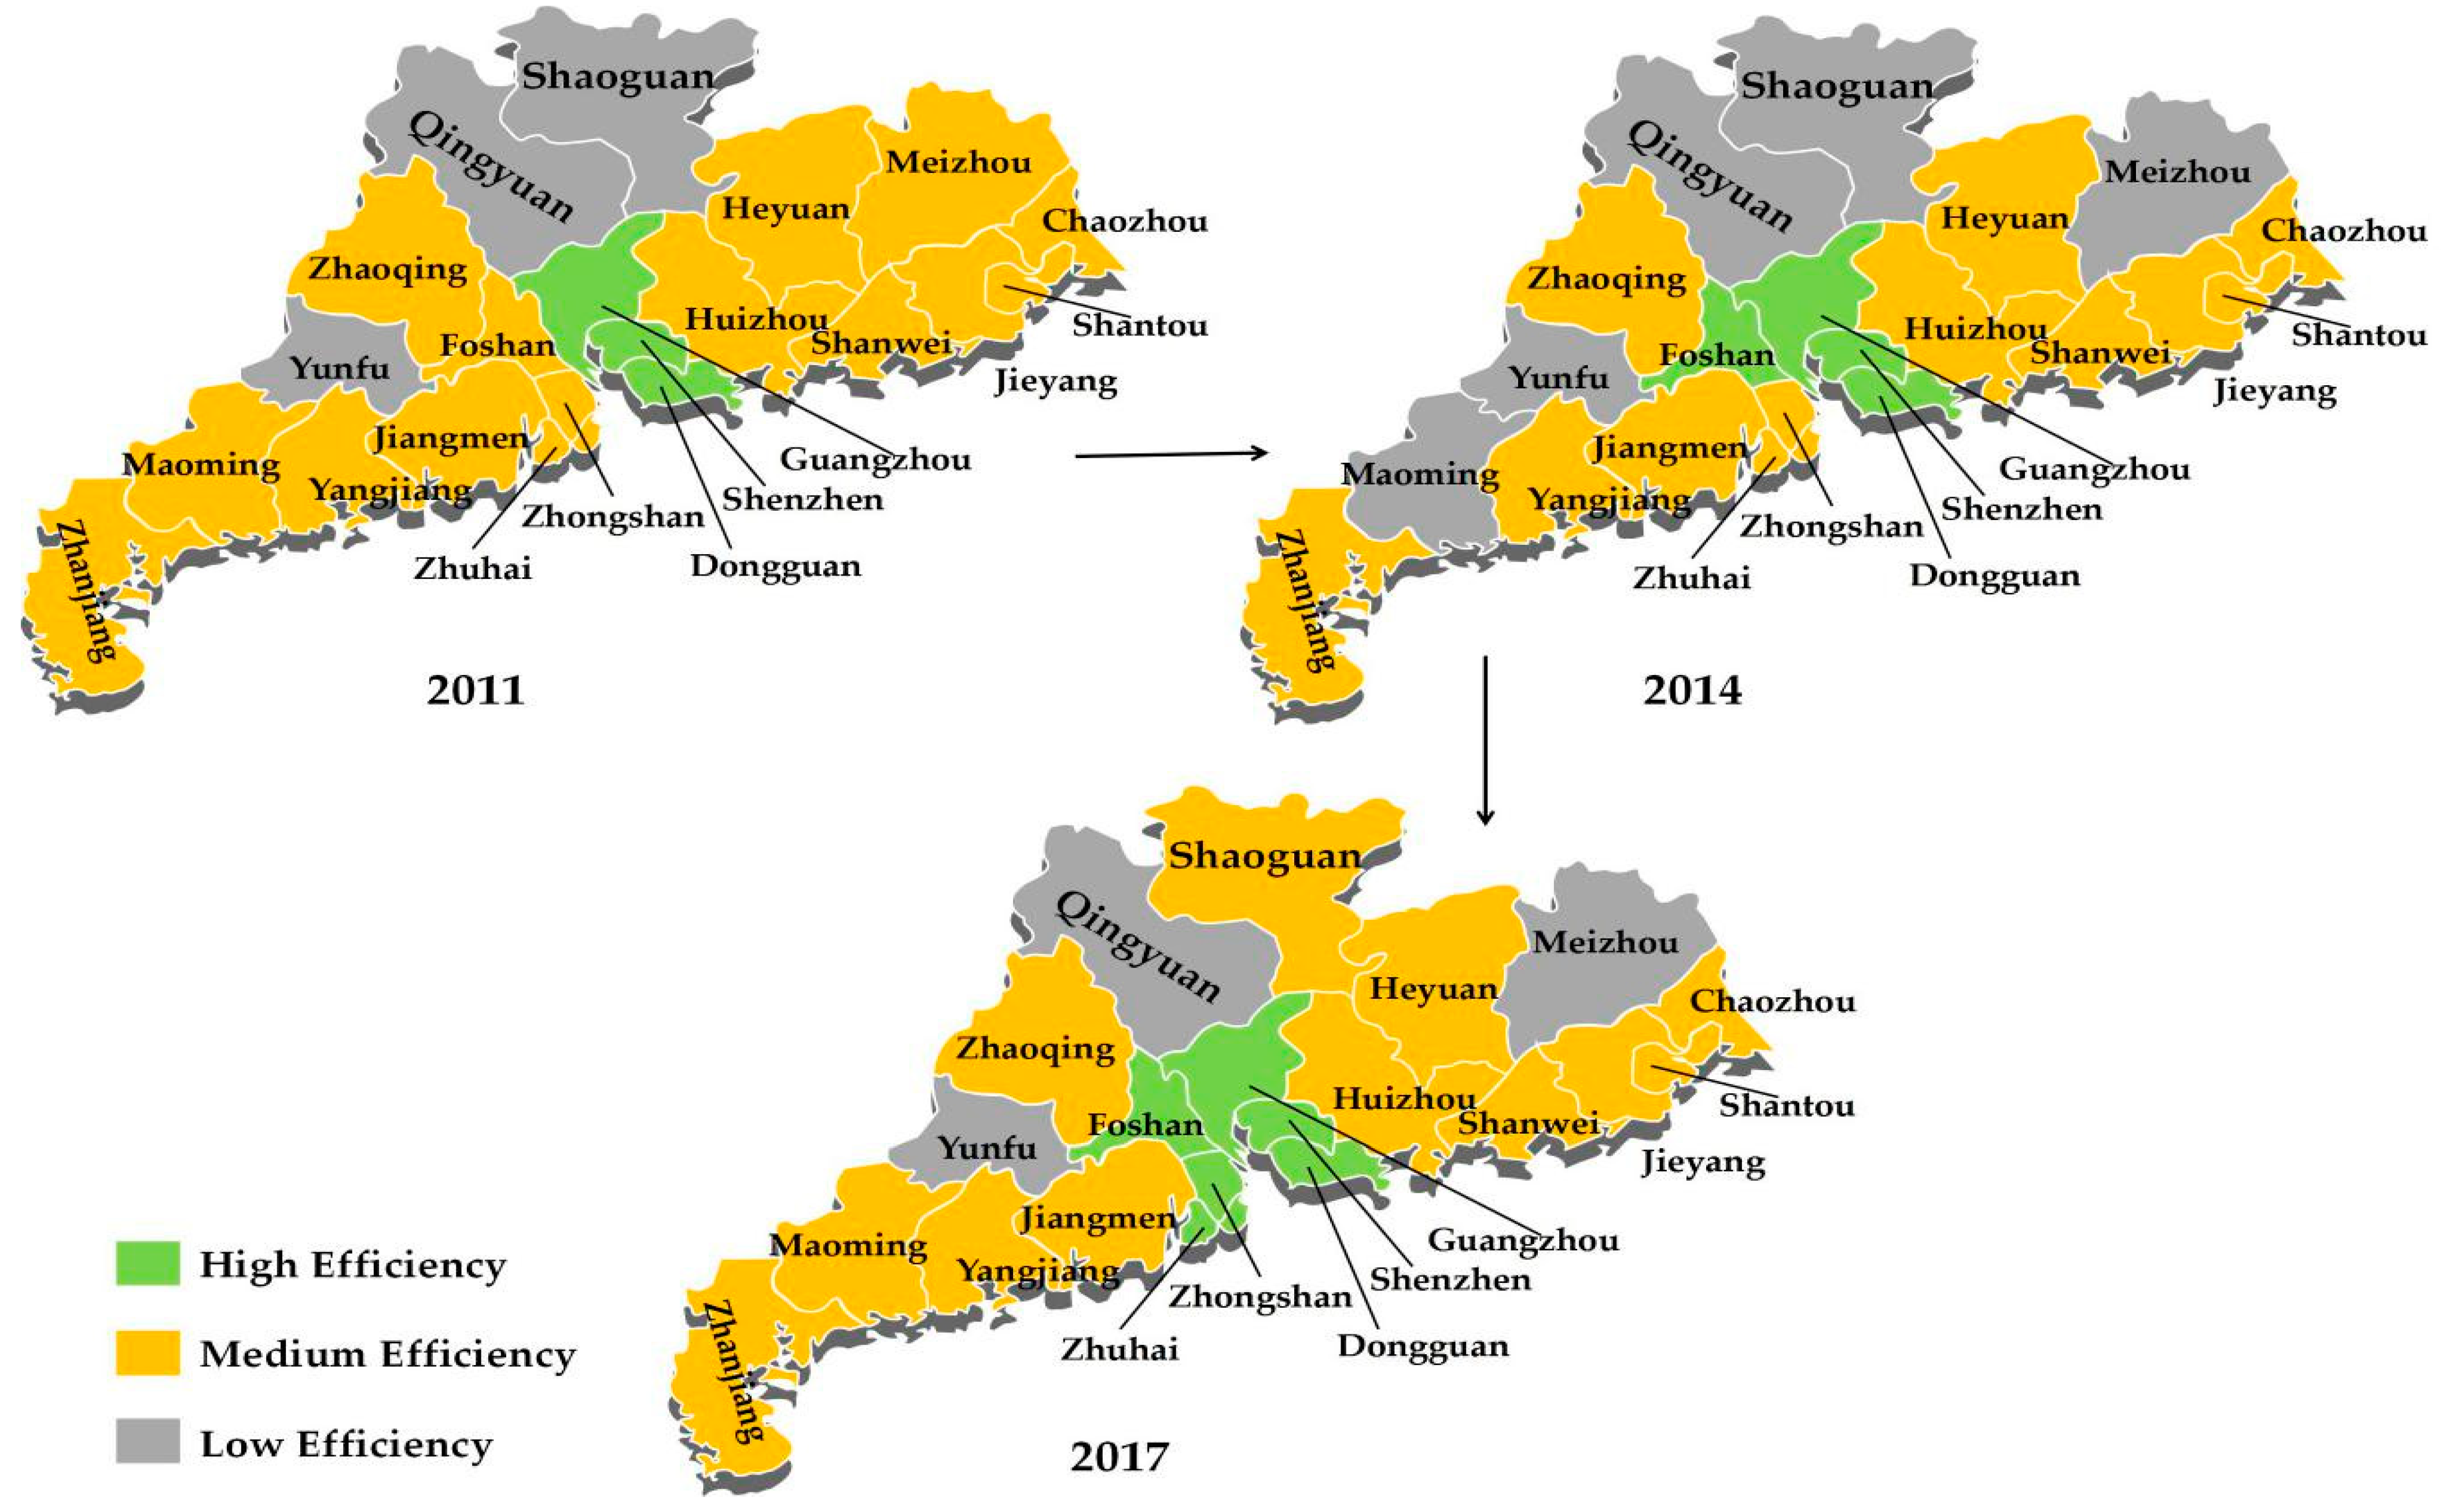
From 2011–2017, the land economic efficiency in eastern China was generally characterized by higher coastal than inland efficiency, but there is no significant difference between the north and the south. At the same time, according to the number of high-, medium- and low-efficiency areas in the three time points (2011, 2014 and 2017), the land economic efficiency in eastern China has been changing towards “medium efficiency” over time. This suggests that the differences between regions are narrowing and that most regions were upgraded from “low efficiency” to “medium efficiency”.
(3)
From Table 3, eastern China as a whole is still unable to achieve synergistic development of land economic efficiency and the environment. However, the further findings of Table 4 demonstrate that the 18 most economically developed cities in eastern China (Section 4.3 for a list of these cities) have been able to achieve synergistic development of land economic efficiency and the environment. Furthermore, according to this study, there are four important factors that contribute to the low land economic efficiency (R&D intensity, industrial production intensity, tertiary sector production intensity and employment density).
Based on the above, this study can provide some inspiration for policy making:
(1)
China has been implementing a sustainable development and innovation strategy for many years, and is now seeing results. Eastern China’s prosperous region is already moving closer to the goal of synergistic economic–environmental–land development, and has stepped off the path of socialist economic development with Chinese characteristics. The findings of this study provide support for the validity of China’s economic policies and environmental regulation policies.
(2)
Maintain the strengths of regions with high science and technology expenditure, and increase support for weaker regions to balance the progress of science and technology research and development across regions. Additionally, encourage enterprises, and fund their R&D to promote their innovative transformation and development, so as to strengthen the overall competitiveness of the region.
(3)
Promote the optimization of industrial structure and encourage and improve the industrial transfer strategy. Optimize the industrial structure by promoting the development of tertiary industries, and at the same time transfer some important factories to less economically developed areas in order to promote the economic development of the area and allow the pollution emissions to be shared by more areas.
(4)
Adhere to the policy of compulsory education without wavering, further improve the training mechanism for all types of talents, and raise the bar for scientific research and treatment of innovative talents. In particular, strengthen the introduction of talents and the treatment of ordinary workers in the less economically developed inland regions in order to attract the inflow of labor, promote innovation and development and enhance economic potential. At the same time, promote cross-regional cooperation so that wealthy regions can drive the development of less developed regions.
Prospects and shortcomings of this study include, first, that environmental pollution problems often have spatial effects, but they have not been studied here. Second, due to the type of data, there is still much room for improvement in the evaluation system of land economic efficiency. Thirdly, due to the limitation of space and the research purpose, this study only includes the prefecture-level cities in eastern China as a whole, and lacks a more detailed study of a particular province.

Author Contributions

Conceptualization, B.C. and L.C.; formal analysis, B.C. and L.C.; methodology, B.C.; writing—review and editing, B.C. and L.C. All authors have read and agreed to the published version of the manuscript.

Funding

This research received no external funding.

Data Availability Statement

Publicly available datasets were analyzed in this study. These data can be found here: https://pan.baidu.com/s/1eUHhvDqcxy9E30e7rjMqqw/Extraction (accessed on 1 June 2021) code: land.

Conflicts of Interest

The authors declare that they have no conflict of interest.

References

  1. Grönqvist, H.; Nilsson, J.P.; Robling, P.O. Understanding How Low Levels of Early Lead Exposure Affect Children’s Life Trajectories. J. Political Econ. 2020, 128, 3376–3433. [Google Scholar] [CrossRef]
  2. Desforges, J.P.W.; Galbraith, M.; Dangerfield, N.; Ross, P.S. Widespread distribution of microplastics in subsurface seawater in the NE Pacific Ocean. Mar. Pollut. Bull. 2014, 79, 94–99. [Google Scholar] [CrossRef]
  3. Evangeliou, N.; Grythe, H.; Klimont, Z.; Heyes, C.; Eckhardt, S.; Lopez-Aparicio, S.; Stohl, A. Atmospheric transport is a major pathway of microplastics to remote regions. Nat. Commun. 2020, 11, 3381. [Google Scholar] [CrossRef]
  4. Shen, L.; Cheng, S.; Gunson, A.J.; Wan, H. Urbanization, sustainability and the utilization of energy and mineral resources in China. Cities 2005, 22, 287–302. [Google Scholar] [CrossRef]
  5. Brelsford, C.; Lobo, J.; Hand, J.; Bettencourt, L.M. Heterogeneity and scale of sustainable development in cities. Proc. Natl. Acad. Sci. USA 2017, 114, 8963–8968. [Google Scholar] [CrossRef] [PubMed] [Green Version]
  6. Seto, K.C.; Golden, J.S.; Alberti, M.; Turner, B.L. Sustainability in an urbanizing planet. Proc. Natl. Acad. Sci. USA 2017, 114, 8935–8938. [Google Scholar] [CrossRef] [Green Version]
  7. Yiftachel, O.; Hedgcock, D. Urban social sustainability: The planning of an Australian city. Cities 1993, 10, 139–157. [Google Scholar] [CrossRef]
  8. Walter, B.; Arkin, L.; Crenshaw, R.W. (Eds.) Sustainable Cities: Concepts and strategies for Eco-City Development; Eco-Home Media: Los Angeles, CA, USA, 1992. [Google Scholar]
  9. Tjallingii, S.P. Ecopolis: Strategies for Ecologically Sound Urban Development; Backhuys Publishers: Amsterdem, The Netherlands, 1995. [Google Scholar]
  10. Nijkamp, P.; Perrels, A. Sustainable Cities in Europe; Routledge: London, UK, 2018. [Google Scholar]
  11. Janik, A.; Ryszko, A.; Szafraniec, M. Scientific landscape of smart and sustainable cities literature: A bibliometric analysis. Sustainability 2020, 12, 779. [Google Scholar] [CrossRef] [Green Version]
  12. Zhan, C.; De Jong, M.; De Bruijn, H. Funding sustainable cities: A comparative study of sino-singapore tianjin eco-city and shenzhen international low-carbon city. Sustainability 2018, 10, 4256. [Google Scholar] [CrossRef] [Green Version]
  13. Fu, Y.; Zhang, X. Planning for sustainable cities? A comparative content analysis of the master plans of eco, low-carbon and conventional new towns in China. Habitat Int. 2017, 63, 55–66. [Google Scholar] [CrossRef]
  14. Zhao, J. An Assessment Indicator System and a Comprehensive Index for Sustainable City. In Towards Sustainable Cities in China; Springer: New York, NY, USA, 2011; pp. 37–47. [Google Scholar]
  15. Fan, X.M.; Liu, Y.F. Exploring Ways to Create Sustainable Urban Habitat. City House 2020, 7, 160–161. Available online: https://t.cnki.net/kcms/detail?v=-j_lVuKOk7otYpFUsZjewrqwWvKs7UgAoLOH5QrsgMpTynrhpNmCjz6cAhGmsE1jepw6R-K31H3vNpK8MpdWXlfAnhQhYWXZXv0-38iHYOT0FZDgXC11a_qyTFLZ-R8_&uniplatform=NZKPT (accessed on 1 June 2021).
  16. Qi, F.; Xie, H.X.; Wang, G.Z. The Delineation and Management of the Three Control Lines in Territorial Spatial Planning. China Land 2019, 2, 26–29. [Google Scholar] [CrossRef]
  17. Panayotou, T. Empirical Tests and Policy Analysis of Environmental Degradation at Different Stages of Economic Development (No. 992927783402676); International Labour Organization: Geneva, Switzerland, 1993. [Google Scholar]
  18. Panayotou, T. Demystifying the environmental Kuznets curve: Turning a black box into a policy tool. Environ. Dev. Econ. 1997, 2, 465–484. [Google Scholar] [CrossRef] [Green Version]
  19. Kaika, D.; Zervas, E. The Environmental Kuznets Curve (EKC) theory—Part A: Concept, causes and the CO2 emissions case. Energy Policy 2013, 62, 1392–1402. [Google Scholar] [CrossRef]
  20. Fujii, H.; Iwata, K.; Chapman, A.; Kagawa, S.; Managi, S. An analysis of urban environmental Kuznets curve of CO2 emissions: Empirical analysis of 276 global metropolitan areas. Appl. Energy 2018, 228, 1561–1568. [Google Scholar] [CrossRef] [Green Version]
  21. Ghosh, S. Examining carbon emissions economic growth nexus for India: A multivariate cointegration approach. Energy Policy 2010, 38, 3008–3014. [Google Scholar] [CrossRef]
  22. Tu, Z.G.; Luo, Z. Strategic Measures to Reduce China’s Carbon Emissions: Based on an Index Decomposition Analysis of Carbon Emissions in Eight Industries. Soc. Sci. China 2014, 3, 158–173. [Google Scholar] [CrossRef]
  23. Chong, W.H.B.; Guan, D.; Guthrie, P. Comparative analysis of carbonization drivers in China’s megacities. J. Ind. Ecol. 2012, 16, 564–575. [Google Scholar] [CrossRef]
  24. Christmann, P.; Taylor, G. Globalization and the environment: Determinants of firm self-regulation in China. J. Int. Bus. Stud. 2001, 32, 439–458. [Google Scholar] [CrossRef]
  25. Li, J.W.; Gong, F.H. Energy, Environment and China’s Economic Growth. J. Quant. Tech. Econ. 1994, 1, 3–14. [Google Scholar]
  26. Tang, M.; Li, Z.; Hu, F.; Wu, B. How does land urbanization promote urban eco-efficiency? The mediating effect of industrial structure advancement. J. Clean. Prod. 2020, 272, 122798. [Google Scholar] [CrossRef]
  27. Wang, H.; He, Q.; Liu, X.; Zhuang, Y.; Hong, S. Global urbanization research from 1991 to 2009: A systematic research review. Landsc. Urban Plan. 2012, 104, 299–309. [Google Scholar] [CrossRef]
  28. Michael, F.L.; Noor, Z.Z.; Figueroa, M.J. Review of urban sustainability indicators assessment—Case study between Asian countries. Habitat Int. 2014, 44, 491–500. [Google Scholar] [CrossRef]
  29. Yu, J.; Zhou, K.; Yang, S. Land use efficiency and influencing factors of urban agglomerations in China. Land Use Policy 2019, 88, 104143. [Google Scholar] [CrossRef]
  30. Yuan, J.; Bian, Z.; Yan, Q.; Pan, Y. Spatio-temporal distributions of the land use efficiency coupling coordination degree in mining cities of western China. Sustainability 2019, 11, 5288. [Google Scholar] [CrossRef] [Green Version]
  31. Taylor, M.S.; Copeland, B.R. Trade, Growth and the Environment; National Bureau of Economic Research: Cambridge, MA, USA, 2003. [Google Scholar]
  32. Ji, X.M.; Wang, K.; Ji, T.; Zhang, Y.H.; Wang, K. Coupling analysis of urban land use benefits: A case study of Xiamen city. Land 2020, 9, 155. [Google Scholar] [CrossRef]
  33. Terrell, T.D. Carbon flux and N-and M-shaped environmental Kuznets curves: Evidence from international land use change. J. Environ. Econ. Policy 2021, 10, 155–174. [Google Scholar] [CrossRef]
  34. Pontarollo, N.; Muñoz, R.M. Land consumption and income in Ecuador: A case of an inverted environmental Kuznets curve. Ecol. Indic. 2020, 108, 105699. [Google Scholar] [CrossRef] [PubMed]
  35. Pontarollo, N.; Serpieri, C. Testing the Environmental Kuznets Curve hypothesis on land use: The case of Romania. Land Use Policy 2020, 97, 104695. [Google Scholar] [CrossRef]
  36. Chen, H.; Zhang, X.; Wu, R.; Cai, T. Revisiting the environmental Kuznets curve for city-level CO2 emissions: Based on corrected NPP-VIIRS nighttime light data in China. J. Clean. Prod. 2020, 268, 121575. [Google Scholar] [CrossRef]
  37. Wang, Z.; Ye, X. Re-examining environmental Kuznets curve for China’s city-level carbon dioxide (CO2) emissions. Spat. Stat. 2017, 21, 377–389. [Google Scholar] [CrossRef]
  38. Yao, T.; Huang, Z.; Zhao, W. Are smart cities more ecologically efficient? Evidence from China. Sustain. Cities Soc. 2020, 60, 102008. [Google Scholar] [CrossRef]
  39. Liao, C.X.; Gao, A.G.; Huang, E.H. Enlightenment of Rainwater Management in Foreign Countries to Sponge City construction in China. Water Resour. Prot. 2016, 32, 42–45. Available online: https://t.cnki.net/kcms/detail?v=b7NF9JV5R2v2AW2i2JpSB2FKNCJr3uPWWjAM7A7SrQ4nF7omxwa9sef-bRYpCuh4x6r_hsjlQo-EN8TTwpeLQq4uhHQ8FnPp0KZ9L30AKWsk-kVw3hpw8lgodBPDx8-I&uniplatform=NZKPT (accessed on 1 June 2021).
  40. Dong, Y.; Jin, G.; Deng, X. Dynamic interactive effects of urban land-use efficiency, industrial transformation, and carbon emissions. J. Clean. Prod. 2020, 270, 122547. [Google Scholar] [CrossRef]
  41. Yang, Z.R.; Wu, C.F.; Jin, X.M.; Yao, Q.P. Comparative study on urban land use economic benefit based on DEA. Resour. Environ. Yangtze Basin 2009, 18, 14–18. [Google Scholar]
  42. Xu, X.; Huo, H.; Liu, J.; Shan, Y.; Li, Y.; Zheng, H.; Guan, D.; Ouyang, Z. Patterns of CO2 emissions in 18 central Chinese cities from 2000 to 2014. J. Clean. Prod. 2018, 172, 529–540. [Google Scholar] [CrossRef]
  43. Wang, Y.; Fang, X.; Yin, S.; Chen, W. Low-carbon development quality of cities in China: Evaluation and obstacle analysis. Sustain. Cities Soc. 2021, 64, 102553. [Google Scholar] [CrossRef]
  44. Feng, K.; Siu, Y.L.; Guan, D.; Hubacek, K. Analyzing drivers of regional carbon dioxide emissions for China: A structural decomposition analysis. J. Ind. Ecol. 2012, 16, 600–611. [Google Scholar] [CrossRef]
  45. Tang, Y.; Chen, Y.; Wang, K.; Xu, H.; Yi, X. An Analysis on the Spatial Effect of Absorptive Capacity on Regional Innovation Ability Based on Empirical Research in China. Sustainability 2020, 12, 3021. [Google Scholar] [CrossRef] [Green Version]
  46. Shen, W.; Zhang, J.; Zhou, X.; Li, S.; Geng, X. How to Perceive the Trade-Off of Economic and Ecological Intensity of Land Use in a City? A Functional Zones-Based Case Study of Tangshan, China. Land 2021, 10, 551. [Google Scholar] [CrossRef]
  47. Chen, Q. Advanced Economic Economics with Stata Applications, 2nd ed.; Higher Education Press: Beijing, China, 2014. [Google Scholar]
  48. Shan, Y.; Huang, Q.; Guan, D.; Hubacek, K. China CO2 emission accounts 2016–2017. Sci. Data 2020, 7, 54. [Google Scholar] [CrossRef] [Green Version]
  49. Ji, Z.H.; Zhang, P. Spatial Difference and Driving Mechanism of Urban Land Use Efficiency Under the Environmental Constraints: Based on 285 Cities in China. China Land Sci. 2020, 34, 72–79. [Google Scholar] [CrossRef]
  50. Meng, Y.; Wang, K.; Lin, Y. The Role of Land Use Transition on Industrial Pollution Reduction in the Context of Innovation-Driven: The Case of 30 Provinces in China. Land 2021, 10, 353. [Google Scholar] [CrossRef]
  51. Van Zanten, H.H.; Mollenhorst, H.; Klootwijk, C.W.; van Middelaar, C.E.; de Boer, I.J. Global food supply: Land use efficiency of livestock systems. Int. J. Life Cycle Assess. 2016, 21, 747–758. [Google Scholar] [CrossRef] [Green Version]
  52. Zitti, M.; Ferrara, C.; Perini, L.; Carlucci, M.; Salvati, L. Long-term urban growth and land use efficiency in Southern Europe: Implications for sustainable land management. Sustainability 2015, 7, 3359–3385. [Google Scholar] [CrossRef] [Green Version]
  53. Xianzhi, F. On the index system of evaluating land utility efficiency. Syst. Eng. 2004, 12, 22–26. [Google Scholar]
  54. Bao, X.Z.; Liu, C.; Zhang, J.B. Comprehensive appraise to the efficiency of urban land use. Urban Probl. 2009, 165, 46–50. [Google Scholar] [CrossRef]
  55. Huo, T.; Li, X.; Cai, W.; Zuo, J.; Jia, F.; Wei, H. Exploring the impact of urbanization on urban building carbon emissions in China: Evidence from a provincial panel data model. Sustain. Cities Soc. 2020, 56, 102068. [Google Scholar] [CrossRef]
  56. Kuznets, S. Quantitative aspects of the economic growth of nations: II. industrial distribution of national product and labor force. Econ. Dev. Cult. Chang. 1957, 5, 1–111. [Google Scholar] [CrossRef]
  57. Kuznets, S. Modern economic growth: Findings and reflections. Am. Econ. Rev. 1973, 63, 247–258. [Google Scholar]
  58. Wallsten, S.J. The effects of government-industry R&D programs on private R&D: The case of the Small Business Innovation Research program. RAND J. Econ. 2000, 31, 82–100. [Google Scholar]
  59. Jaffe, A.B. Technological Opportunity and Spillovers of R&D: Evidence from Firms’ Patents, Profits and Market Value; National Bureau of Economic Research: Cambridge, MA, USA, 1986. [Google Scholar]
  60. Chen, D.K. Trade Barrier Reduction and Environmental Pollution Improvement: New Evidence from Firm-level Pollution Data in China. Econ. Res. J. 2020, 12, 98–114. Available online: https://kns.cnki.net/kcms/detail/detail.aspx?dbcode=CJFD&dbname=CJFDLAST2021&filename=JJYJ202012006&v=x7X5dmdiedO9fs8fieE9hww1c0L%25mmd2BGksRK%25mmd2FUyiZbhJJtdr9Xl3Qpi1MNI5cLfCiFB (accessed on 1 June 2021).
  61. Ouyang, Y.Y.; Huang, X.F.; Zhong, L.M. The Impact of Outward Foreign Direct Investment on Environmental Pollution in Home Country: Local and Spatial Spillover Effects. China Ind. Econ. 2020, 2, 98–121. [Google Scholar] [CrossRef]
  62. Ahn, S.J.; Yoon, H.Y. ‘Green chasm’ in clean-tech for air pollution: Patent evidence of a long innovation cycle and a technological level gap. J. Clean. Prod. 2020, 272, 122726. [Google Scholar] [CrossRef]
  63. Omri, A.; Hadj, T.B. Foreign investment and air pollution: Do good governance and technological innovation matter? Environ. Res. 2020, 185, 109469. [Google Scholar] [CrossRef]
  64. Brunnermeier, S.B.; Cohen, M.A. Determinants of environmental innovation in US manufacturing industries. J. Environ. Econ. Manag. 2003, 45, 278–293. [Google Scholar] [CrossRef]
  65. Chen, J.; Gao, M.; Cheng, S.; Hou, W.; Song, M.; Liu, X.; Liu, Y.; Shan, Y. County-level CO2 emissions and sequestration in China during 1997–2017. Sci. Data 2020, 7, 391. [Google Scholar] [CrossRef] [PubMed]
  66. Cobb, C.W.; Douglas, P.H. A theory of production. Am. Econ. Rev. 1928, 18, 139–165. [Google Scholar]
  67. Wang, K.; Tang, Y.; Chen, Y.; Shang, L.; Wang, P. The Coupling and Coordinated Development from Urban Land Using Benefits and Urbanization Level: Case Study from Fujian Province (China). Int. J. Environ. Res. Public Health 2020, 17, 5647. [Google Scholar] [CrossRef] [PubMed]
  68. Wang, Q.; Zhou, B.; Zhang, C.; Zhou, D. Do energy subsidies reduce fiscal and household non-energy expenditures? A regional heterogeneity assessment on coal-to-gas program in China. Energy Policy 2021, 155, 112341. [Google Scholar] [CrossRef]
  69. Liang, J.; He, P.; Qiu, Y.L. Energy transition, public expressions, and local officials’ incentives: Social media evidence from the coal-to-gas transition in China. J. Clean. Prod. 2021, 298, 126771. [Google Scholar] [CrossRef]
Figure 1. Eastern China.
Land 10 00845 g001
Figure 2. Methodological framework.
Land 10 00845 g002
Figure 3. Spatio-temporal evolution map of carbon emissions. (a) Beijing, Tianjin and Shanghai. (b) Jiangsu Province. (c) Zhejiang Province. (d) Fujian Province.
Land 10 00845 g003
Figure 4. Spatio-temporal evolution map of carbon emissions in Hebei Province.
Land 10 00845 g004
Figure 5. Spatio-temporal evolution map of carbon emissions in Shandong Province.
Land 10 00845 g005
Figure 6. Spatio-temporal evolution map of carbon emissions in Guangdong Province.
Land 10 00845 g006
Figure 7. Spatio-temporal evolution map of land economic efficiency. (a) Beijing, Tianjin and Shanghai. (b) Shandong Province. (c) Zhejiang Province. (d) Fujian Province.
Land 10 00845 g007aLand 10 00845 g007b
Figure 8. Spatio-temporal evolution map of land economic efficiency in Hebei Province.
Land 10 00845 g008
Figure 9. Spatio-temporal evolution map of land economic efficiency in Jiangsu Province.
Land 10 00845 g009
Figure 10. Spatio-temporal evolution map of land economic efficiency in Guangdong Province.
Land 10 00845 g010
Table 1. Indicator evaluation system of land economic efficiency.
Core Explanatory VariableDimensionIndicatorUnitAverage Weight (2011–2017)Impact Ranking
Land economic efficiency (Land_EcoE)Economic growthGDP growth rate%4.38%7
Industrial production intensityRMB 10,000/km222.62%2
Economic structureShare of tertiary output%3.87%8
Tertiary industrial production intensityRMB 10,000/km214.40%3
Employment densityPeople/km212.71%4
Economic qualityGDP per capitaRMB/people7.29%6
R&D intensityRMB 10,000/km224.41%1
Road density%10.32%5
Table 2. Variable description.
TypeVariableUnitObsMeanStd.MinMaxLabel
Explained variableCarbon emissionMillion tons5883.5417 0.6873 1.7576 5.4235 Carbon
Explanatory variableLand economic efficiency -5881.1905 1.4061 0.1079 13.8653 Land_EcoE
Control variablesForeign capital utilization intensityUSD million/km25882.8392 1.6474 −4.8793 5.9149 Fore_CUI
Innovation intensityItems/10,000 people5884.8430 0.8303 2.4417 6.8811 Inno_I
Table 3. Regression results for the spatio-temporal fixed effects of land economic efficiency *.
Explanatory VariablesIIIIII
Land_EcoE0.0006−0.0008−0.0003
Control YESYESYES
Time fixed effectsYES-YES
Spatial fixed effects-YESYES
R-sq0.37090.04110.2120
Obs588588588
* indicate statistical significance at the 10% levels.
Table 4. Further regression for the spatio-temporal fixed effects of land economic efficiency.
A-groupIIIIII
Explanatory Variables
Land_EcoE0.0130 **0.0121 **0.0127 ***
D_A * Land_EcoE−0.0239 ***−0.0249 ***−0.0252 ***
Control YESYESYES
Time fixed effectsYES-YES
Spatial fixed effects-YESYES
R-sq0.23190.06220.2333
Obs (A-group)565656
Obs588588588
B-groupIIIIII
Explanatory Variables
Land_EcoE0.0133 **0.0132 **0.0138 ***
D_B * Land_EcoE−0.0229 ***−0.0251 ***−0.0252 ***
Control YESYESYES
Time fixed effectsYES-YES
Spatial fixed effects-YESYES
R-sq0.27090.06270.2332
Obs (B-group)126126126
Obs588588588
***, ** and *, respectively, indicate statistical significance at the 1%, 5% and 10% levels. Obs (A-group) and Obs (B-group) refer to observations where the dummy variable is 1.
Publisher’s Note: MDPI stays neutral with regard to jurisdictional claims in published maps and institutional affiliations.

