1. Introduction
Humans have altered ecosystems on Earth to the point that scientists have dubbed our current era the Anthropocene [
1]. Despite the staggering global scale of our recent influence on ecosystem patterns and processes, some of the most profound changes to particular regions and landscapes happened during historical periods [
2,
3]. Agricultural influences were widespread and transformational, often geographically specific, and technical peaks of exploitation were followed by collapse and reorganization as new socio-ecological pathways emerged [
4,
5]. Today, features created by humans for agricultural uses and the environments that accompanied them are frequently not counted in current models of ecosystem function and constitute missing sources of variation [
2]. Studies attempting to explain current distributions of species are improved by knowing the extent of anthropogenic landscape features, as historically modified ecosystems may influence what is currently observed [
6,
7]. Wetlands are important ecosystems globally for ecosystem function and are incompletely mapped; little is known about how and where they were modified historically, and such information, when available, can inform present-day ecological analyses and management [
8,
9].
Globally, millions of acres of wetlands have been modified through time to grow rice for human consumption. Rice is a nutritious food that can be grown by managing the timing and duration of water in naturally occurring wetlands and other low-lying areas. In North America, rice was the original cash crop for which imported enslaved persons were used, beginning in the 1670s. First instituted in South Carolina, rice culture expanded throughout the lower Atlantic coastal plain in subsequent decades and reached an apex just before the American Civil War between 1850 and 1860 [
10]. During this peak period, 5,000,000 bushels of rice were produced in the United States, and 70% (3,500,000 bushels) were produced in South Carolina [
10,
11]. Rice cultivation collapsed after the Civil War due to three interacting factors: (1) without free labor (i.e., enslaved persons’ labor) the enterprise was no longer profitable, (2) a series of large storms damaged water control devices (e.g., dikes, levees, and trunks) and the planters did not have the capital nor the labor to recover from this series of devastating events, and (3) while rice farming in the Mississippi Delta was able to mechanize, planters along the Atlantic Coast (Georgia, Florida, North Carolina, and South Carolina) were unable to transition from human labor to machinery due in large part to the soft, alluvial soils [
12,
13].
Along the south Atlantic Coast, two economically successful methods for rice cultivation were used; both were derived from West African methods, and it is likely that enslaved persons were specifically sought who had this knowledge. Inland fields were the first to be developed. They were established in linear, gravity-fed, freshwater systems, which were likely ancient cypress–tupelo systems and surrounded by uplands. The inland rice cultivation system took advantage of the occurrence of distinct microenvironments that were a product of minor elevational changes along the landscape gradient from lowlands to uplands, allowing for rice to be cultivated in a variety of hydrologic conditions [
14,
15]. This system largely depended on precipitation to provide water, and to store water during periods of water scarcity and manage water flow through rice fields, dikes upstream and downstream of rice fields were constructed. These dikes today may be recognized on the ground and through remote sensing as identifiable indicators of historic and abandoned fields. The second method, tidal cultivation, came after the American Revolution and took advantage of the narrow coastal band where predictable tides and the associated freshwater wedge existed [
16]. The flow of freshwater into and out of tidal rice fields was controlled by water management devices called trunks. Tidal rice fields can be recognized today by many geomorphological indicators.
While it is known that Antebellum planters first used inland, freshwater systems and eventually moved to tidal cultivation, little is known about the extensiveness of their operations or the particular wetland types and settings they may have selected. Travelers noted wetlands that occurred in the region, but such areas were considered unsafe and sources of disease and were avoided [
17,
18]. Ecological studies in relatively undisturbed contemporary wetlands in the region allow inference about what species and environments were likely encountered by builders of rice fields in the 17th–19th centuries; there are approximately 18 wetland types that are extant and were likely represented in the pre-settlement era [
19].
Wetlands are valued for their high biological diversity and productivity, their ability to filter and transform nutrients and pollutants, and their capacity to buffer the impact of human activities on downstream aquatic systems [
20]. Wetlands provide critical habitat for a variety of wildlife, including waterfowl, wading birds, reptiles and amphibians, and invertebrates [
21]. Moreover, they contribute to enhanced water quality due to filtering and create recreational opportunities (e.g., hunting and fishing). While many historic rice fields have been lost with the passage of time, many remain and provide some level of wetland function [
22]. Some that remain are maintained in their “rice field” state with traditional and modified technologies, and others have partially “naturalized” following their release over a century ago from being human controlled systems.
The current ecological state of Antebellum rice fields has been the focus of restoration, management, and conservation questions. Rice fields along the coast act as core habitat and maintain connectivity for a variety of avian species (e.g., waterfowl, shorebirds, and warblers) [
22]. Many of the desired outcomes from management have been directed towards waterfowl [
12]. Emphasis on waterfowl management is understandable, where in South Carolina alone, trip and equipment expenditures from waterfowl hunting in 2001 provided nearly
$10 million and the total economic impact was more than
$14 million [
23]. In recent years management of historic rice fields has become more diverse in the set of objectives that now includes ecosystem services beyond supporting services such as waterfowl hunting and management to include such services as provisioning services for wildlife habitat (e.g., black rail, wood storks, roseate spoonbill, American alligator), regulating services for water quality and storm protection, and cultural services for tourism and recreation.
A conservation conundrum is how to prioritize places for action, when so many have been fundamentally altered by our own species [
24]. The first step in any conservation planning project is to acquire spatial data representing the extent and conditions of conservation-relevant habitats. Historic rice fields in the Americas represent an illustration of the complexity of conservation planning. Should they be conserved for their current, wetland-related ecological values? Should they be conserved for their historical, cultural meaning? Should they be restored to a pre-agriculture, “wild” state? The first step in answering these questions is to know “where, how much, and what”, in other words, to know the extent of these features, where they are, and something of their characteristics.
Until now, the extent of Antebellum rice culture on the landscape in South Carolina has been estimated only from archival historical sources, and there has been no published empirical approach. The areal coverage of historic rice fields in South Carolina has been estimated from historical records to range from 29,950 to 60,703 ha (100,000 to 150,000 acres) [
12,
25], yet casual inspection of the landscape would suggest this coverage may be far greater. Further, there are no analyses of their current wetland classifications and land cover, which can serve as indications of potential function. Without a more complete understanding of their extent and location, and potential types, it is impossible to grasp their cultural, ecological, and historical value or to effectively manage them.
LiDAR provides a remotely sensed data source that can penetrate tree canopy cover and provide elevation data to model terrain structure, which is an advantage over other remotely sensed data sources that are unable to penetrate the forest canopy and provide ground-level data [
26,
27,
28]. LiDAR was used to evaluate the legacy effects of ancient Mayan land use on canopy structure, where it was found that canopy height was more homogeneous on the terraced landscape formed by Mayans than the surrounding unterraced landscape [
29]. In the landscape where the current work was performed, LiDAR was used to identify shell ring deposits by Native Americans prior to the arrival of Europeans, allowing for a more complete understanding of the distribution of these settlements [
30].
Unlike work by Doar [
25] and Gresham and Hook [
12], our use of LiDAR allowed us to identify previously unknown historic rice fields (i.e., inland rice fields). Using a variety of remotely sensed data, which included aerial photography, historic aerial photography, near-infrared images, and LiDAR, we sought to map the extent of Antebellum rice fields in the region where rice culture was most dominant to serve as an initial understanding of the extent and types of wetlands modified in past centuries and their current functions. Due to the lack of inclusion of inland rice fields, now largely forested, in previous estimates of the areal extent of historic rice fields, we hypothesized that, in addition to the traditional methods used to identify these landscape features, our use of LiDAR imagery would result in an increase of 50% in the total area of historic rice fields. We provide these maps freely to researchers in the fields of history, geography, anthropology, historical ecology, and other disciplines concerned with piecing together the ecological and social consequences of the enslavement of humans for rice culture. Further, we estimate and discuss the current land cover contexts and wetland characteristics of historic rice fields to aid in management, research, and conservation planning.
2. Materials and Methods
We sought to remotely sense, digitize, and categorize historic rice fields in eight coastal counties of South Carolina, USA. South Carolina was chosen because it was the epicenter of rice culture in the southeastern United States during the Antebellum period and there has been work to identify historic rice fields there previously that can serve as a benchmark for comparison (see Doar et al., 1936 [
10], Gresham and Hook 1982 [
12]); LiDAR was readily available for the study area; and there has been and continues to be high interest in historic rice fields for social, cultural, and conservation reasons in South Carolina. We restricted our analysis to coastal counties because historical work showed this is where the vast majority of rice fields were located; however, there are documented rice fields outside of this area within South Carolina. Remotely sensed data sources included satellite imagery [
31], aerial photographs [
32], National Wetlands Inventory (NWI) [
33], USGS topographic maps [
34], and LiDAR [
32] generated hillshaded bare earth digital elevation models (DEMs) and intensity models. LiDAR data were collected by the South Carolina Department of Natural Resources between 2007 and 2010, where there was a mean of two ground points per square meter with an average spacing of 0.7 m. Once obtained from the South Carolina Department of Natural Resources, the Clemson Center for Geospatial Technologies (CCGT) used high-throughput computing on Clemson University’s GIS cluster, which comprises 30 Windows computers with 740 cores for the distribution of GIS jobs for parallel processing. CCGT created hillshaded bare earth DEMs and intensity models from individual LiDAR files for eight coastal South Carolina counties. LiDAR files were processed at the county level using RapidLasso LASTools [
35] in a three-step process. LiDAR point cloud data were split with neighboring files for buffered input, data were then distributed to CCGT’s GalaxyGIS cluster for parallel processing to calculate bare earth DEMs, and then DEMs were mosaiced back together and sent to the original workstation as a single file [
36].
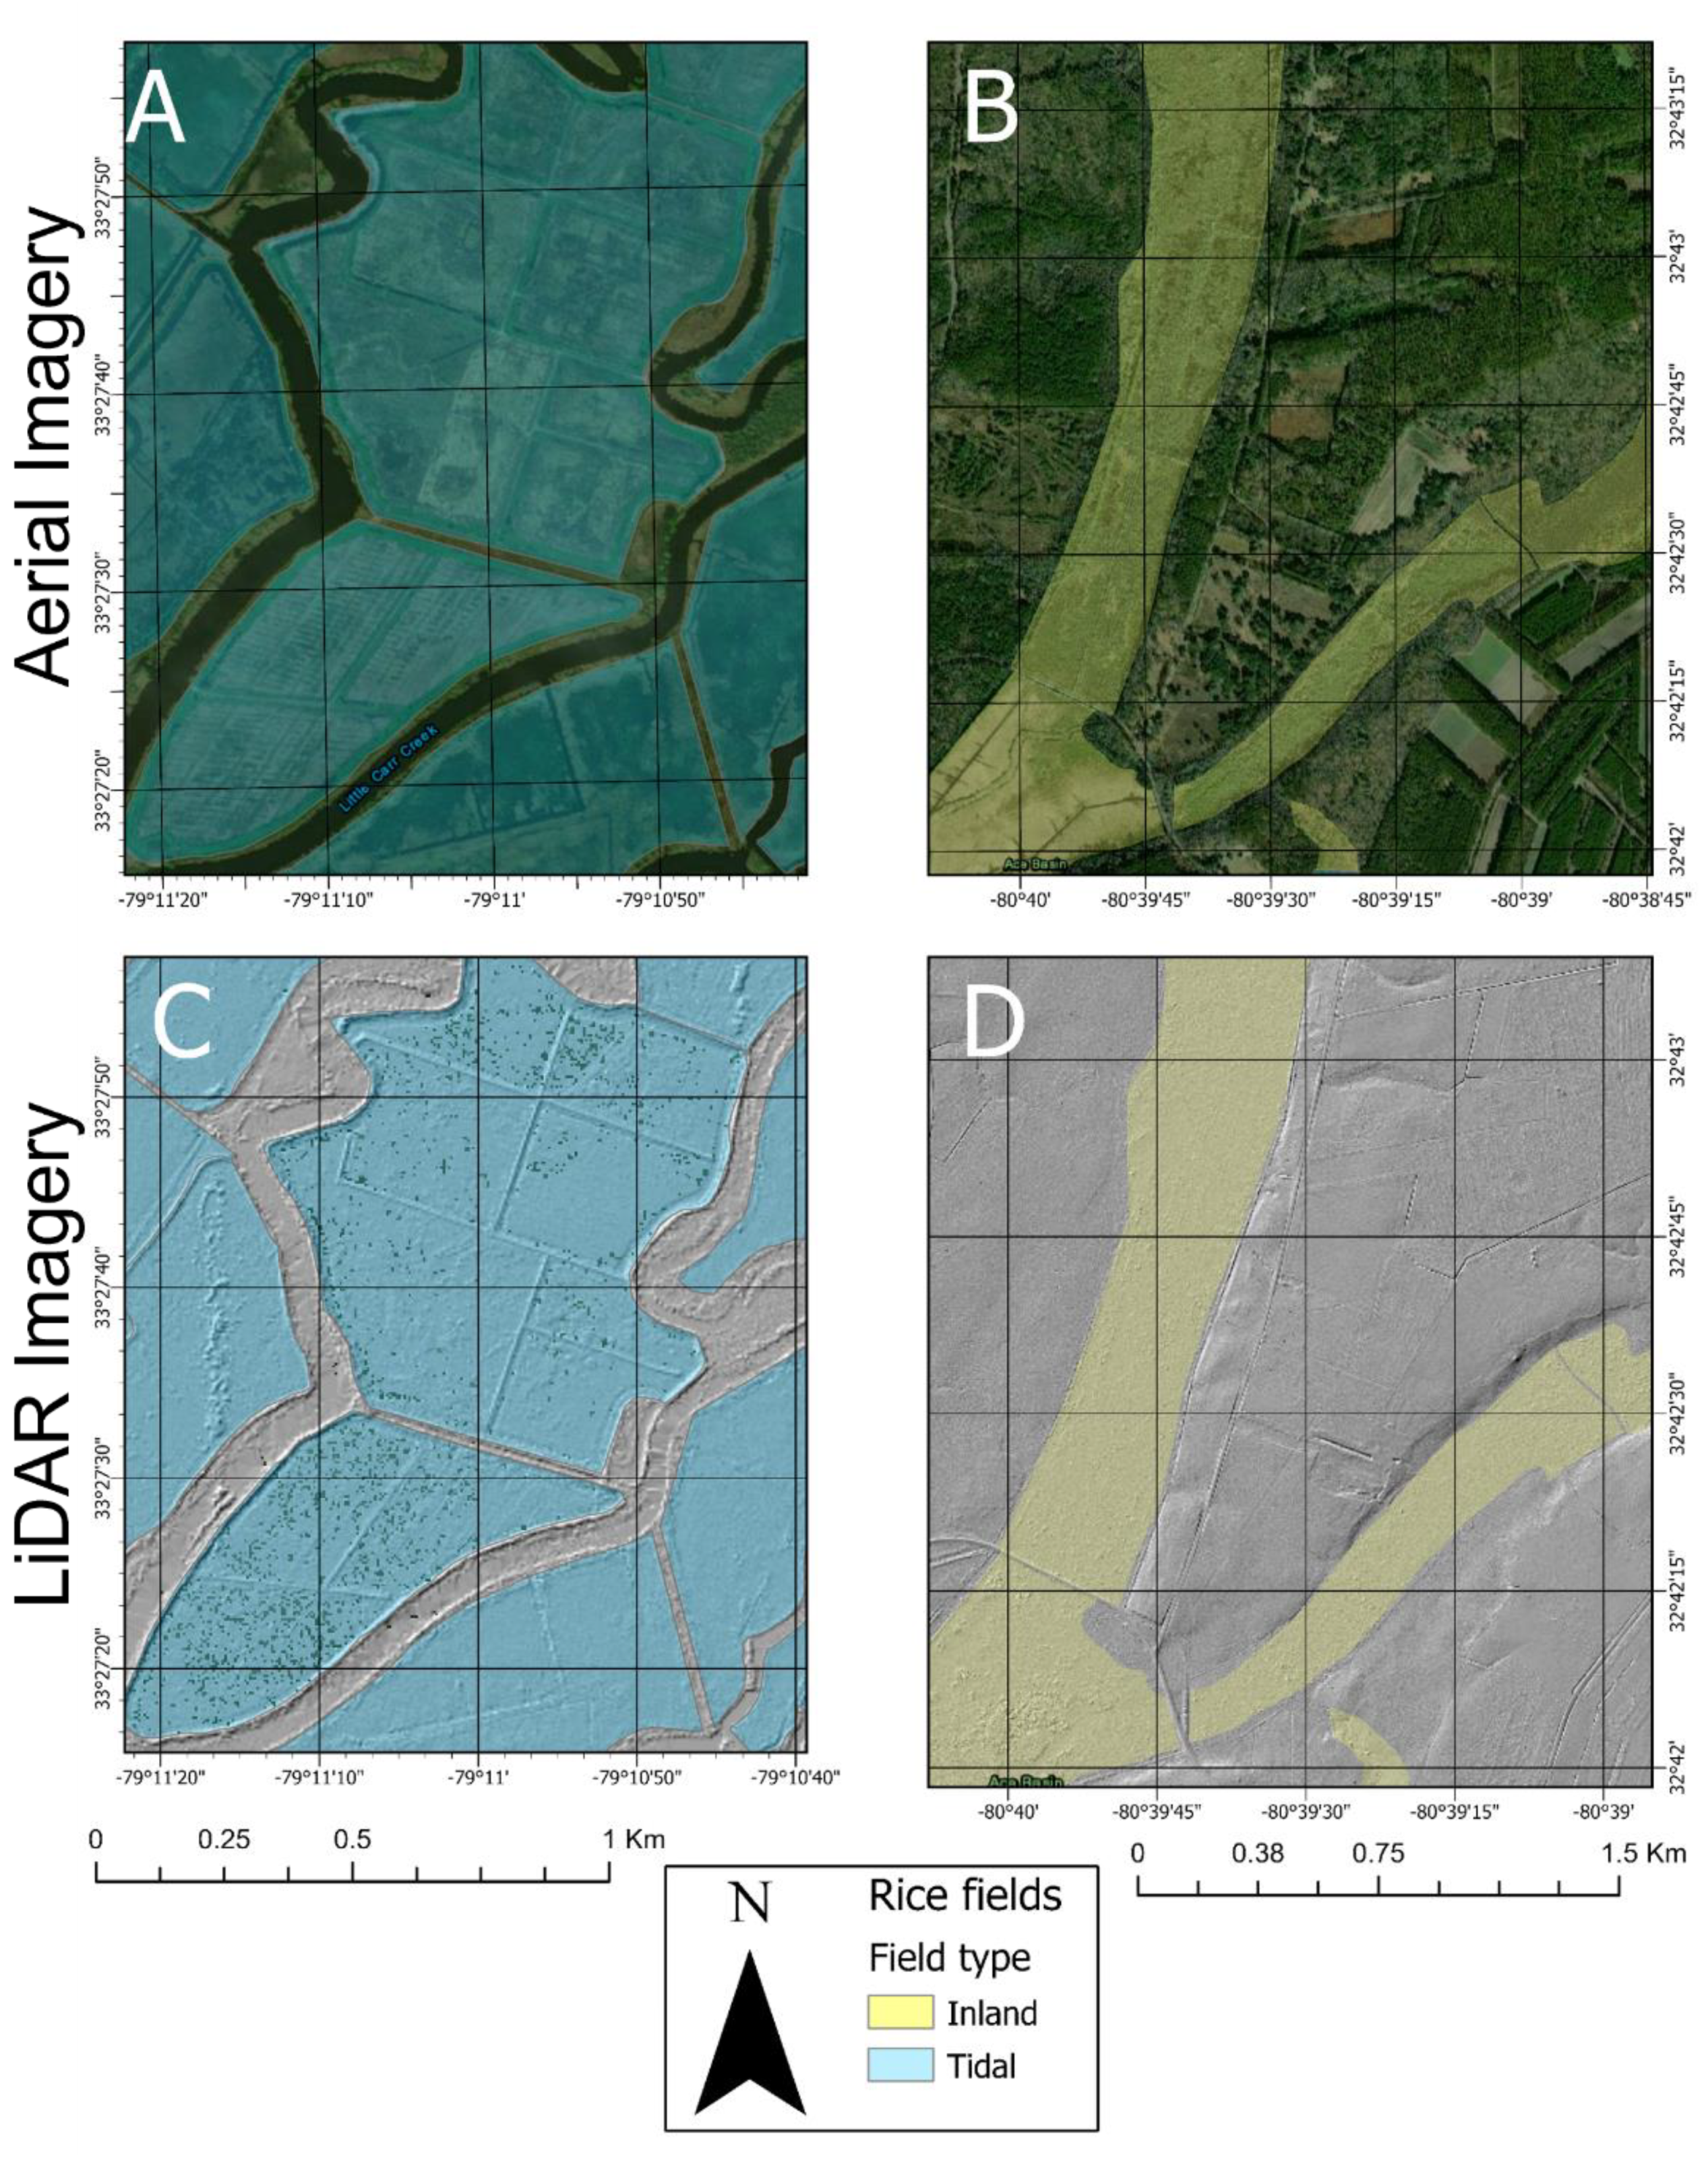
Using ArcGIS Online (AGOL), we developed an application where all remotely sensed data (i.e., aerial photographs, LiDAR DEMs and intensity models, NWI, satellite imagery, and USGS topographic maps), were accessible to use as a workspace for heads-up digitizing of rice fields. The application allowed us to identify potential rice fields using a combination of remotely sensed data sources. Rice fields were identified by the visual presence in remotely sensed data of canals, dikes, and quarter drains, which are the main features associated with historic rice fields. The authors (R. Coen and D. Hanks) performed all identification and digitization of the rice fields. The main features of the rice fields were particularly evident with hillshaded LiDAR (
Figure 1C,D). The linear nature of these features associated with rice fields is in sharp contrast to the more typical dendritic branching associated with natural drainage patterns and was the primary factor used to identify landscape features as rice fields (
Figure 1). In conjunction with hillshaded bare earth DEMs, LiDAR intensity models were also useful in identifying wetland areas below the forest canopy (i.e., rice fields) [
37]. Because water shows high absorption for near-infrared wavelengths, LiDAR intensity is well suited to identify inundated or saturated ground surfaces [
38].
Once a rice field was identified, using available remotely sensed data sources, we manually digitized the field using the AGOL application. Other landscape features with similar linearity are present on the landscape (e.g., mines, pine plantations); therefore, during heads-up digitizing, using the AGOL application, a mapper’s confidence in whether an area identified as a rice field was or was not a rice field was indicated by scoring the field as a 1 (low confidence), 2 (moderate confidence), or 3 (high confidence). The identification, digitization, and confidence quantification processes were performed at least twice by two different mappers (i.e., R. Coen and D. Hanks) across all eight coastal counties of South Carolina. Fields were also classified as either tidal (those influenced by coastal tides) or inland (those too far inland to be influenced by coastal tides). Tidal rice fields were further classified as functional or broken. The ability to manage water levels is maintained in functional tidal fields by intact dikes and water control features (i.e., trunks), whereas the dikes in broken tidal fields have been breached or broken, thereby eliminating the ability of managers to control water levels and movement of water into and out of the rice fields, resulting in these tidal fields resembling natural tidal marshes. Inland rice fields were not delineated as broken or functional primarily because it is difficult to distinguish if their dikes are broken or intact, even with LiDAR data.
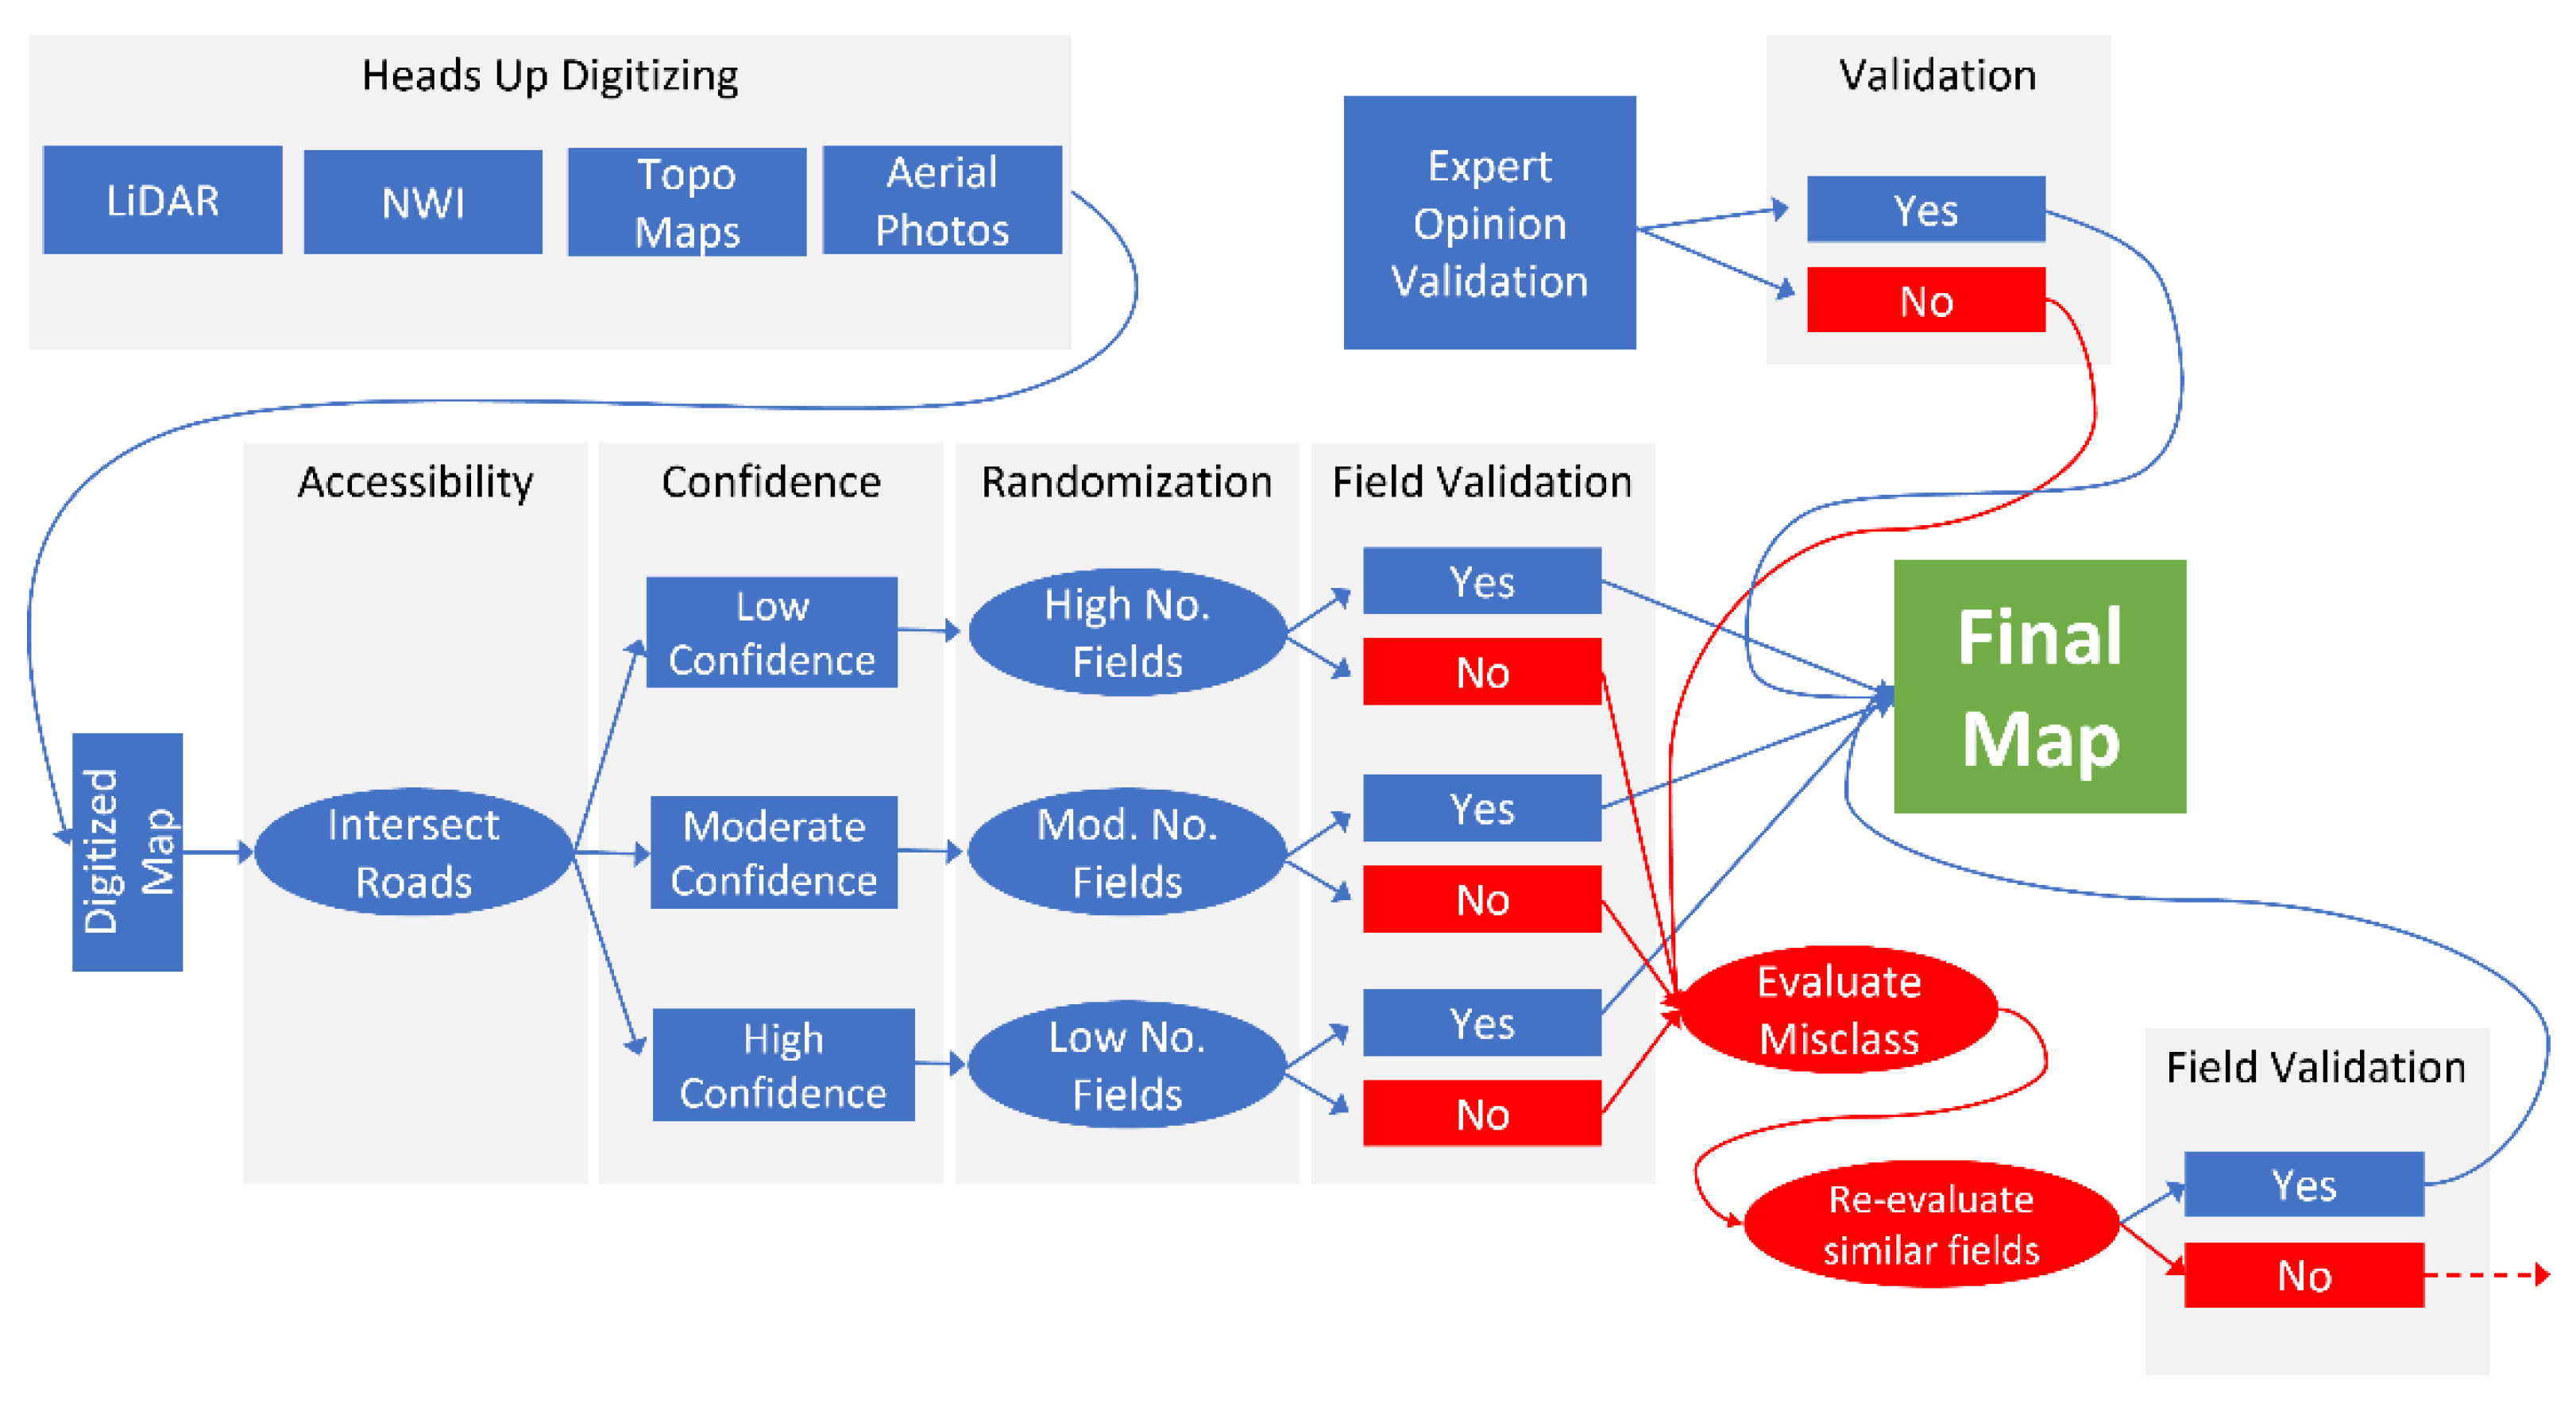
Once the digitization process was complete, we developed a procedure for in-person visits to field validate areas identified as rice fields. To ensure a robust method of selecting a representative subset of rice fields to field validate, we developed a concept model (
Figure 2) and protocol that is systematic and reproducible. This methodology allowed for a randomly selected subset of rice fields for in-person visits and field validation. Accessibility was a major concern for field validation due to private ownership of rice fields or fields being located great distances from roads or navigable waters. Therefore, to be included in our subset of rice fields for validation, we first filtered rice fields based on accessibility. Rice fields were considered accessible if they were within 200 m of a public road or navigable waters. This step ensured ease of access and reduced the amount of time required to validate a rice field, thereby allowing for more fields to be assessed, resulting in improved spatial distribution and increased coverage. Many of the accessible rice fields were either adjacent to or within the same rice field complex as those that were not easily accessed; therefore, we believe the available rice fields that were accessible were representative of the entire system. Next, we randomly selected a percentage of the rice fields that met the accessibility requirement within each confidence category (i.e., high, medium, low). Due to the variability in our confidence of identifying areas from our remotely sensed data as rice fields, we elected to field validate more of the areas identified as rice fields but with low confidence and fewer of the areas identified with high confidence as rice fields during the digitization and classification process. There were 3014 rice fields identified, of which 65.2% (1964) were accessible (i.e., within 200 m of a road or navigable waters). From the subset of accessible rice fields, we randomly selected 325 (10.8% of all identified fields) to field validate. Of the 325 randomly selected fields, 20.3% were classified as low confidence, 12.6% were classified as medium confidence, and 9.9% were classified as high confidence. To further ensure we accurately identified historic rice fields using remote sensing, we engaged local experts. The local experts we engaged with had both a geographic knowledge of the region and an understanding of the nature of historic rice fields. In fact, many of these individuals own and manage historic rice fields in the region. Local experts were asked to identify areas that were either errors of commission or errors of omission in our remotely sensed identification of historic rice fields [
39]. Often the areas they focused on were their property, areas adjacent to their property, or areas which they had intimate knowledge of.
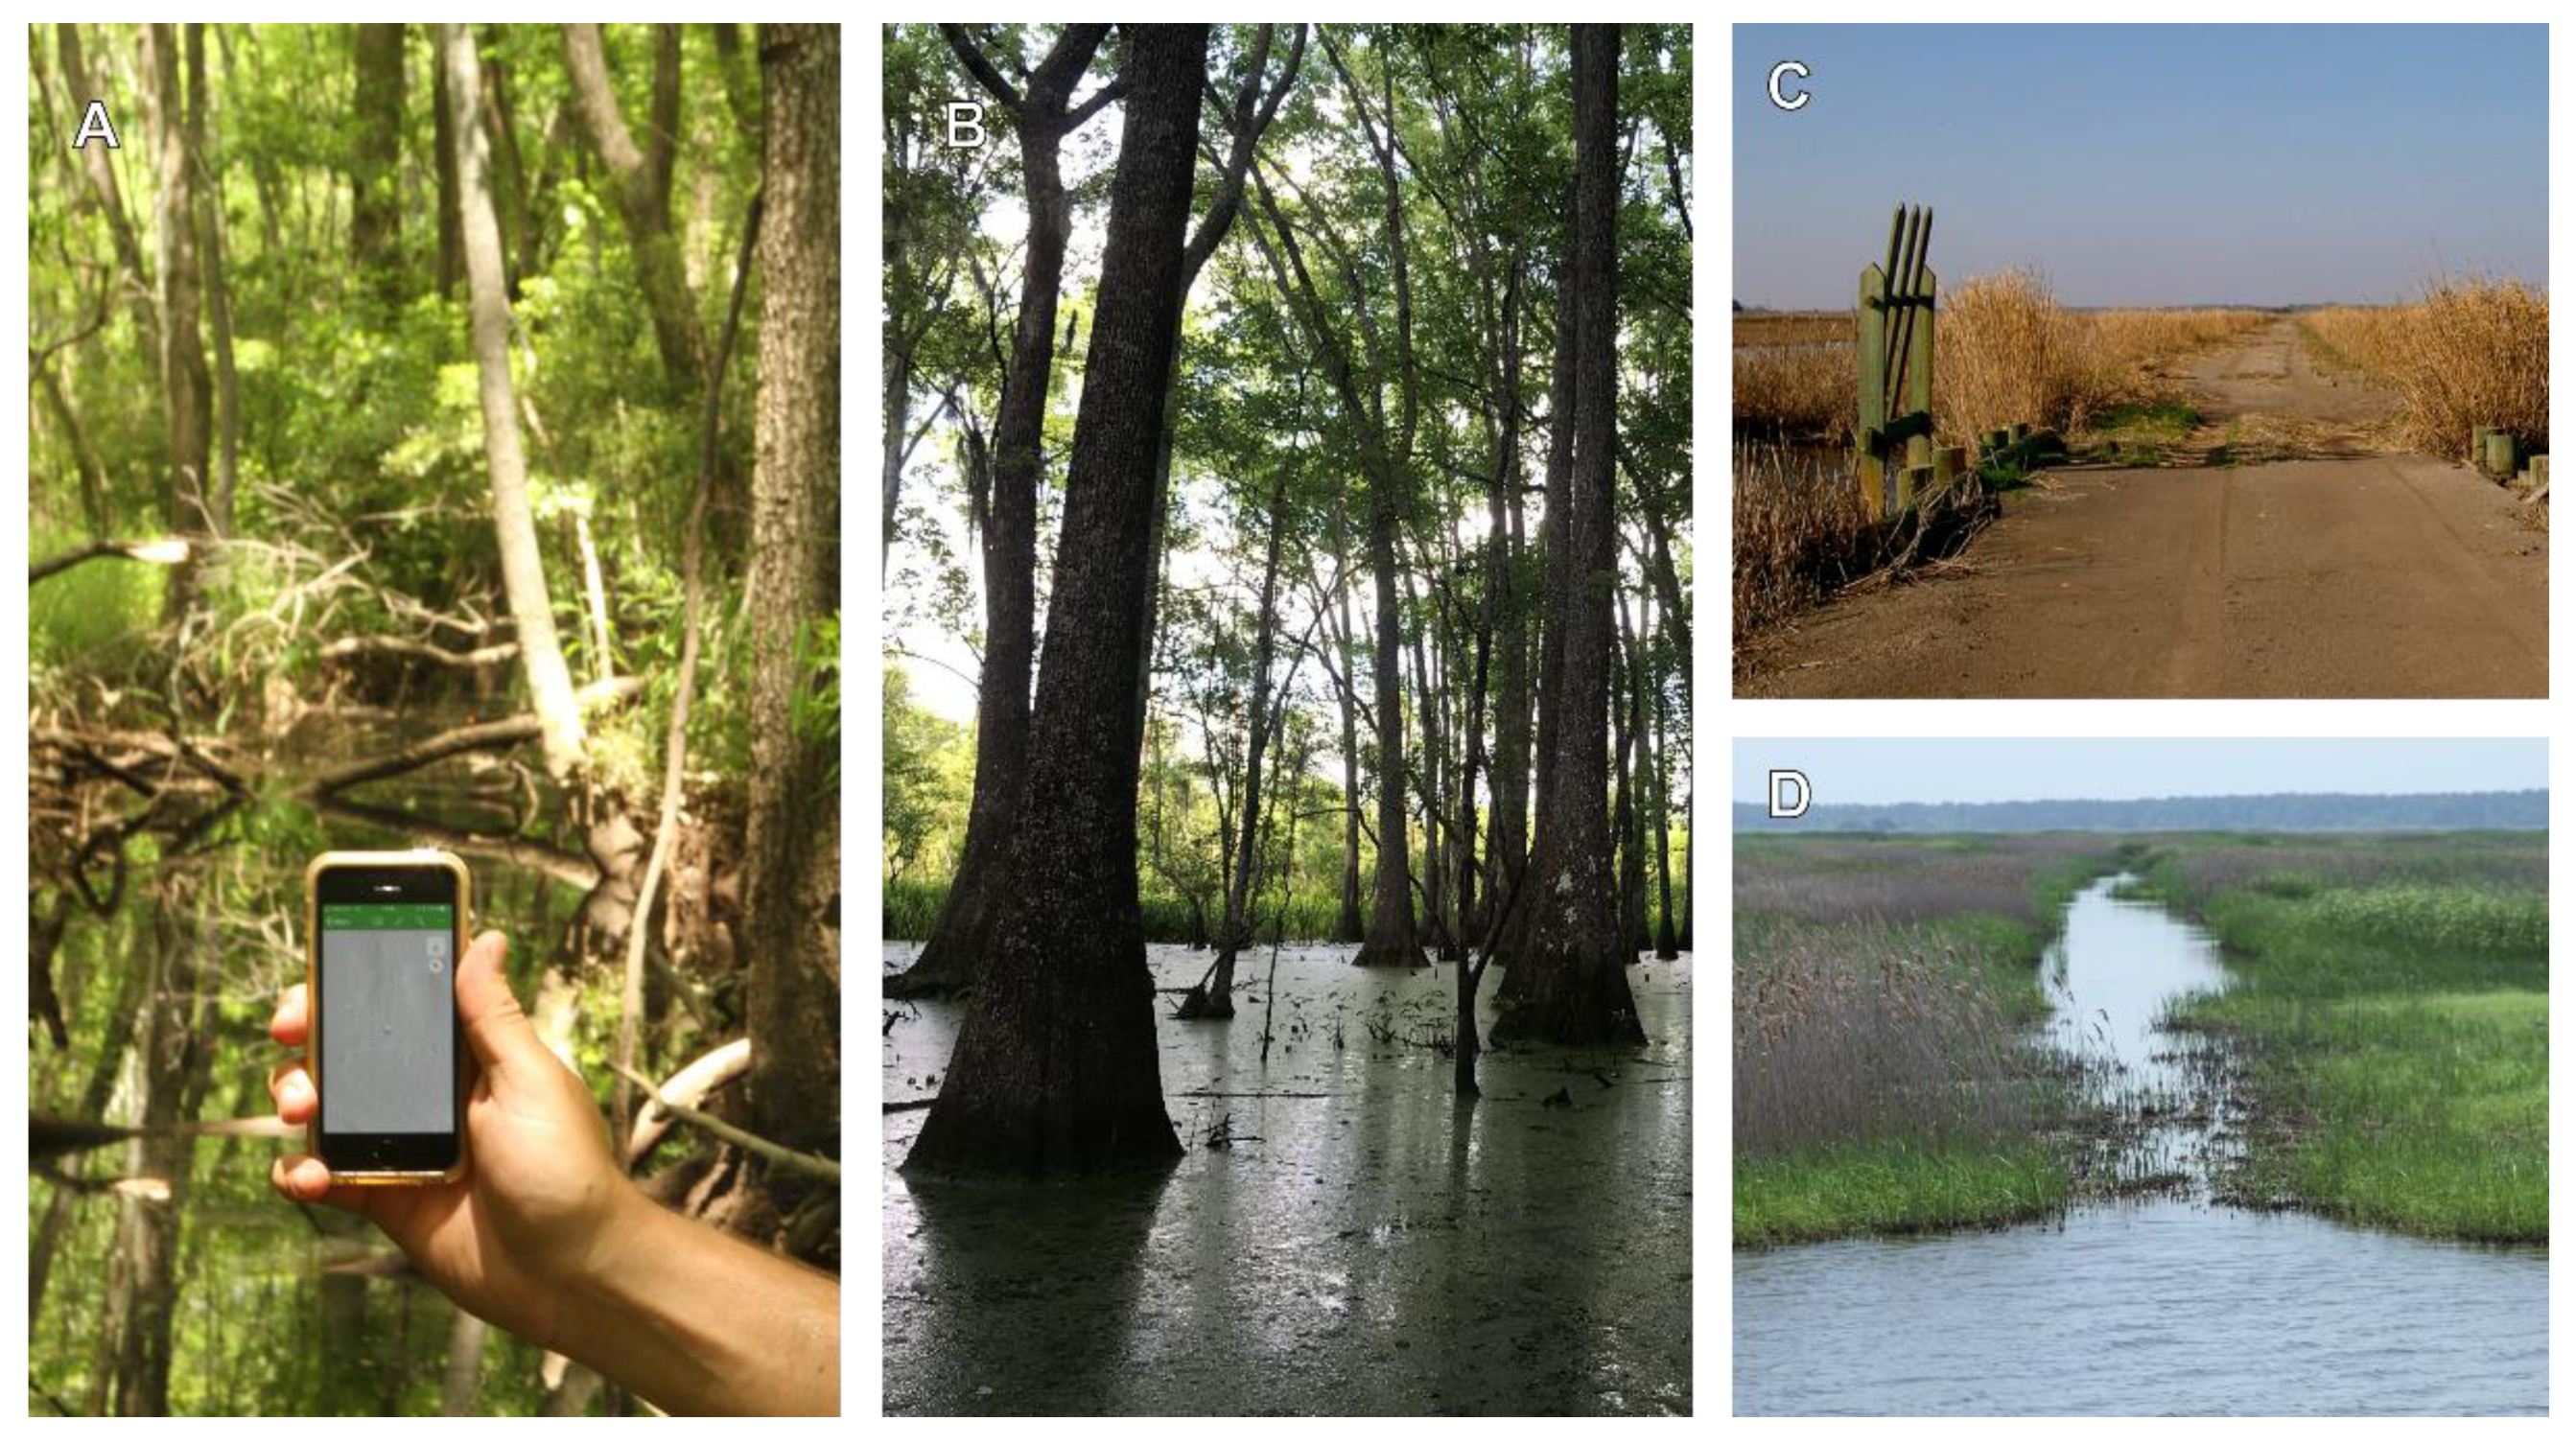
Field validation was accomplished by in-person visits to the randomly selected sites where identification and confirmation of dikes, canals, and other key identifying features were conducted. Fields were identified as either being rice fields or not (i.e., yes or no). Fields that were identified as rice fields (i.e., yes) were included in our final map and summary statistics of the rice fields, and those that were identified as not being rice fields were removed from the data set. Additionally, photographs were taken of at least one of the identifying features at each site. These images were added to the AGOL application for further confirmation (if in question) (
Figure 3).
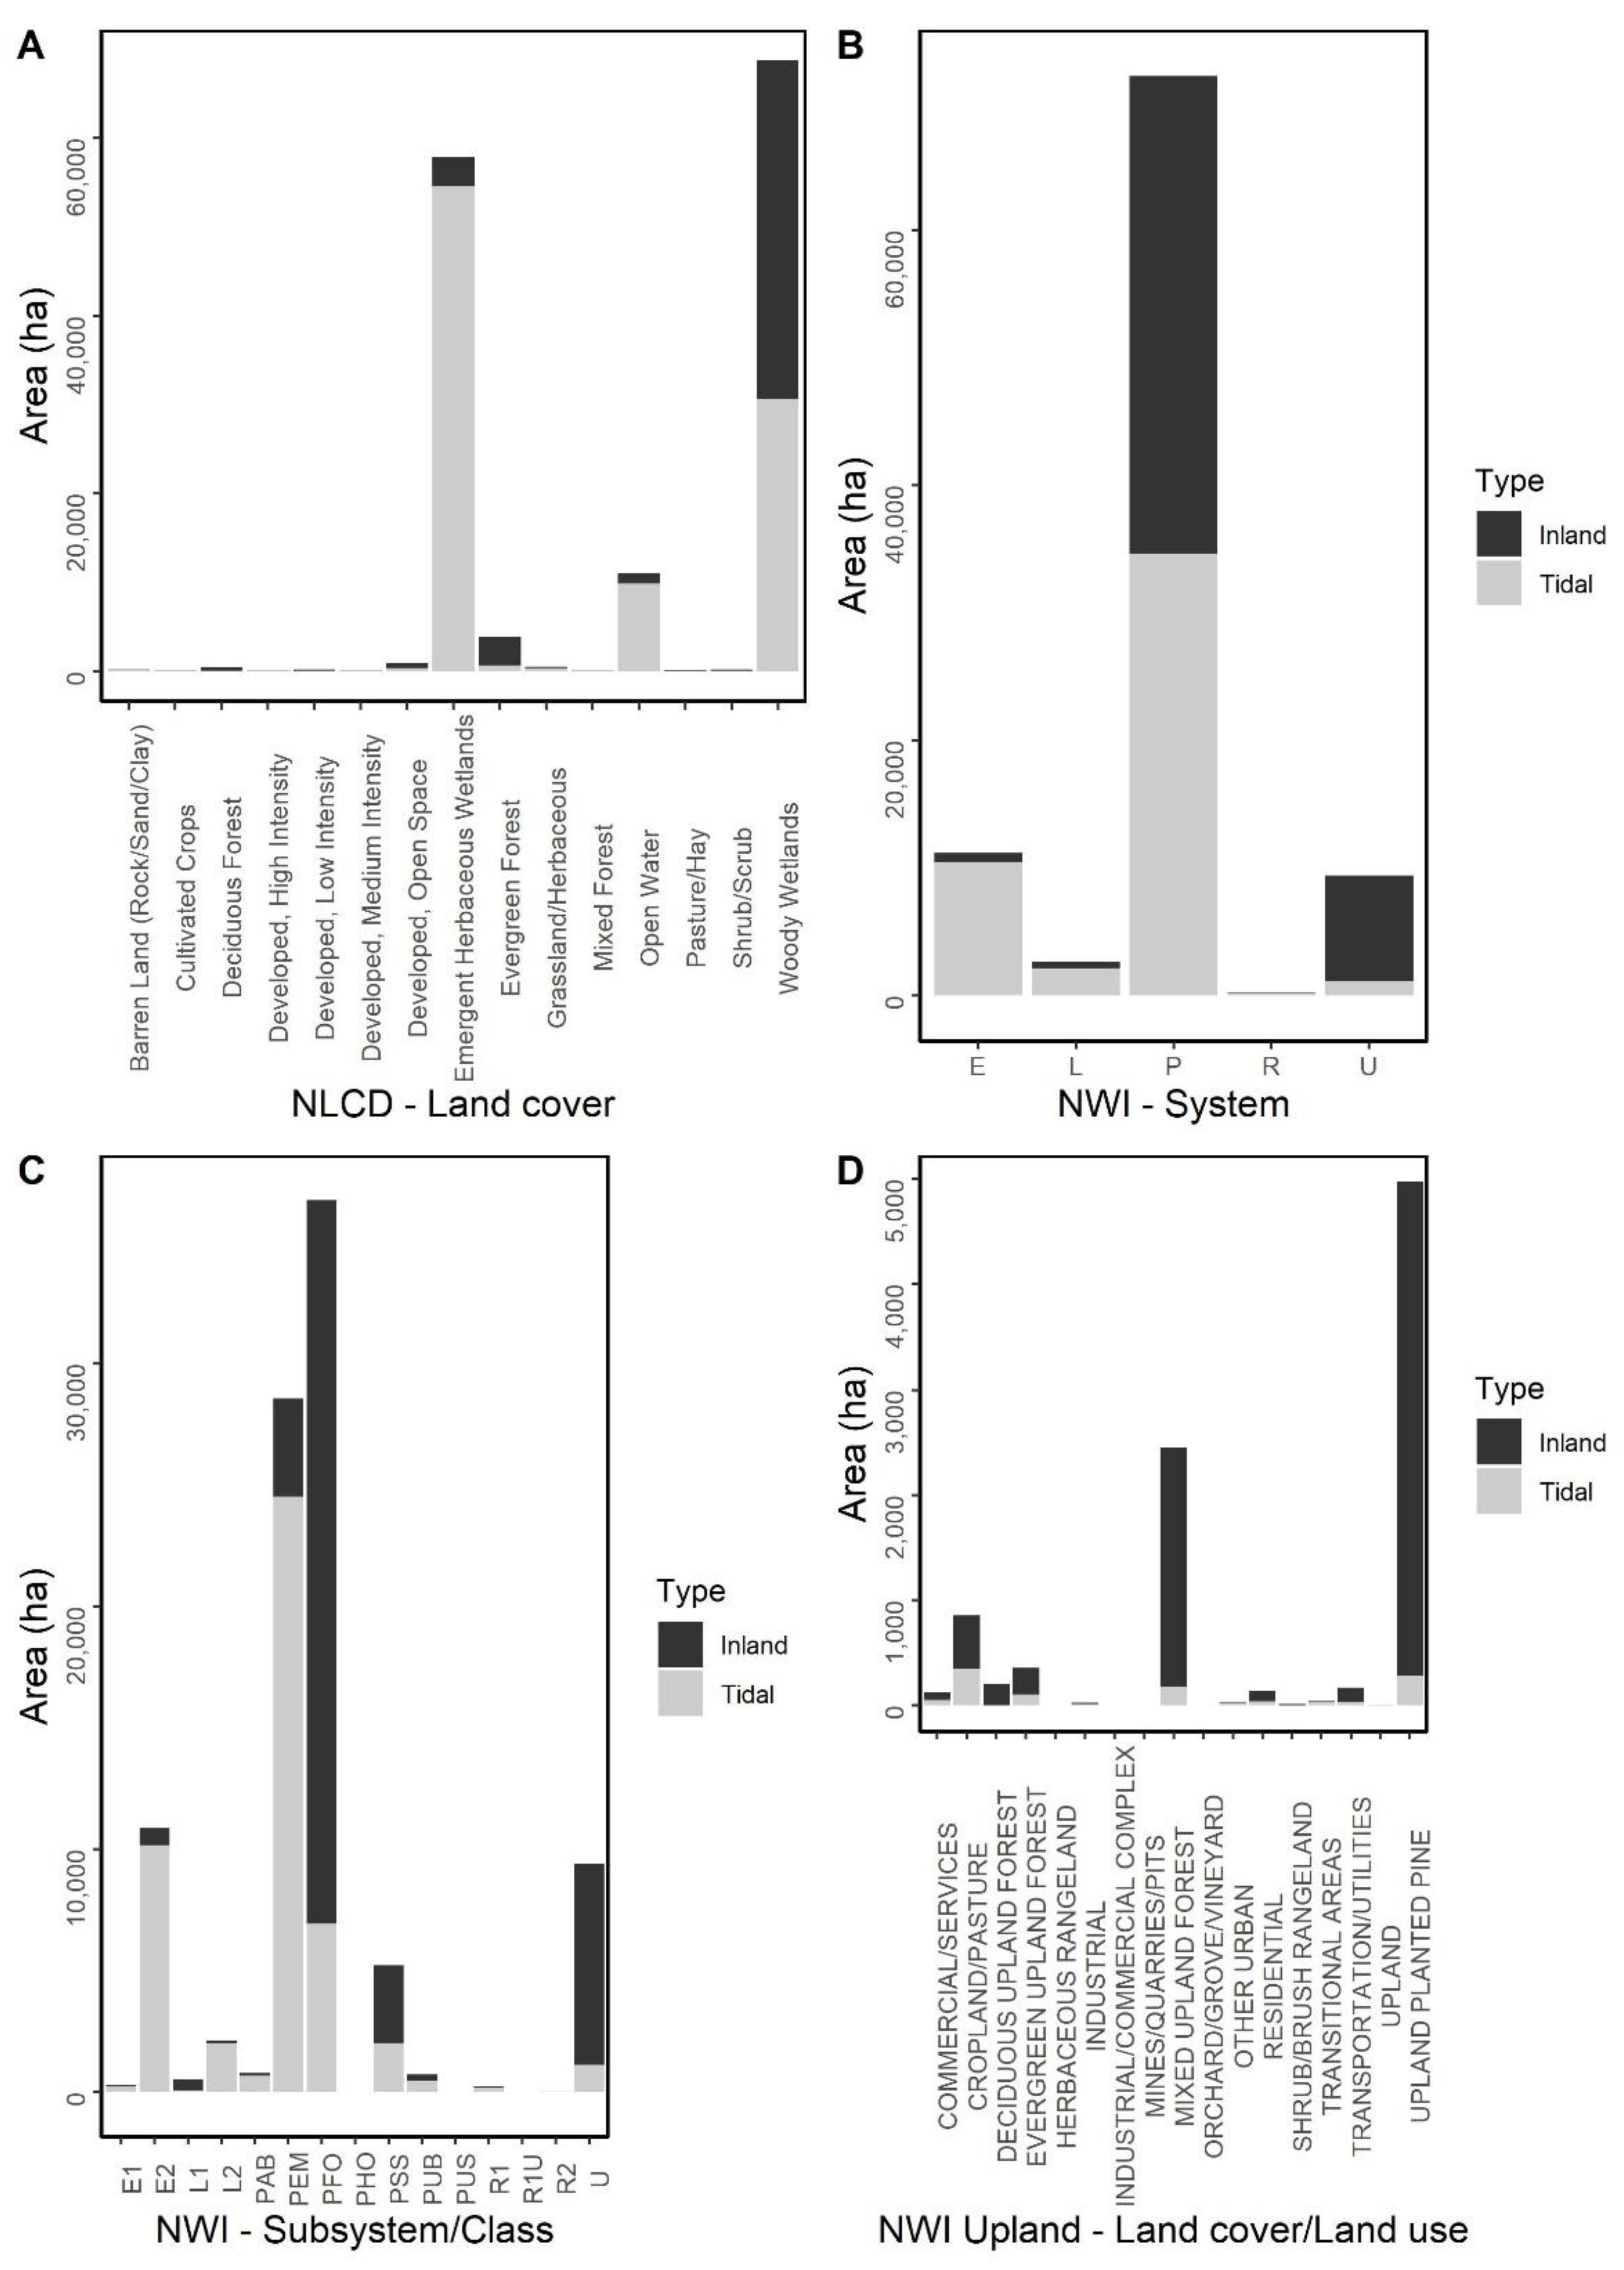
Using the National Land Cover Data 2016 (NLCD), the National Wetlands Inventory (NWI), and zonal statistics (ESRI ArcGIS Pro) we identified land cover types and wetland classes that were geographically coincident with rice fields. To gain further understanding of contemporary land cover and wetland classes geographically coincident with rice fields, fields were separated into tidal and inland rice fields, and zonal statistics were calculated again.
4. Discussion
The human condition, past, present, and future, cannot be fully understood until it is embedded in its ecological condition [
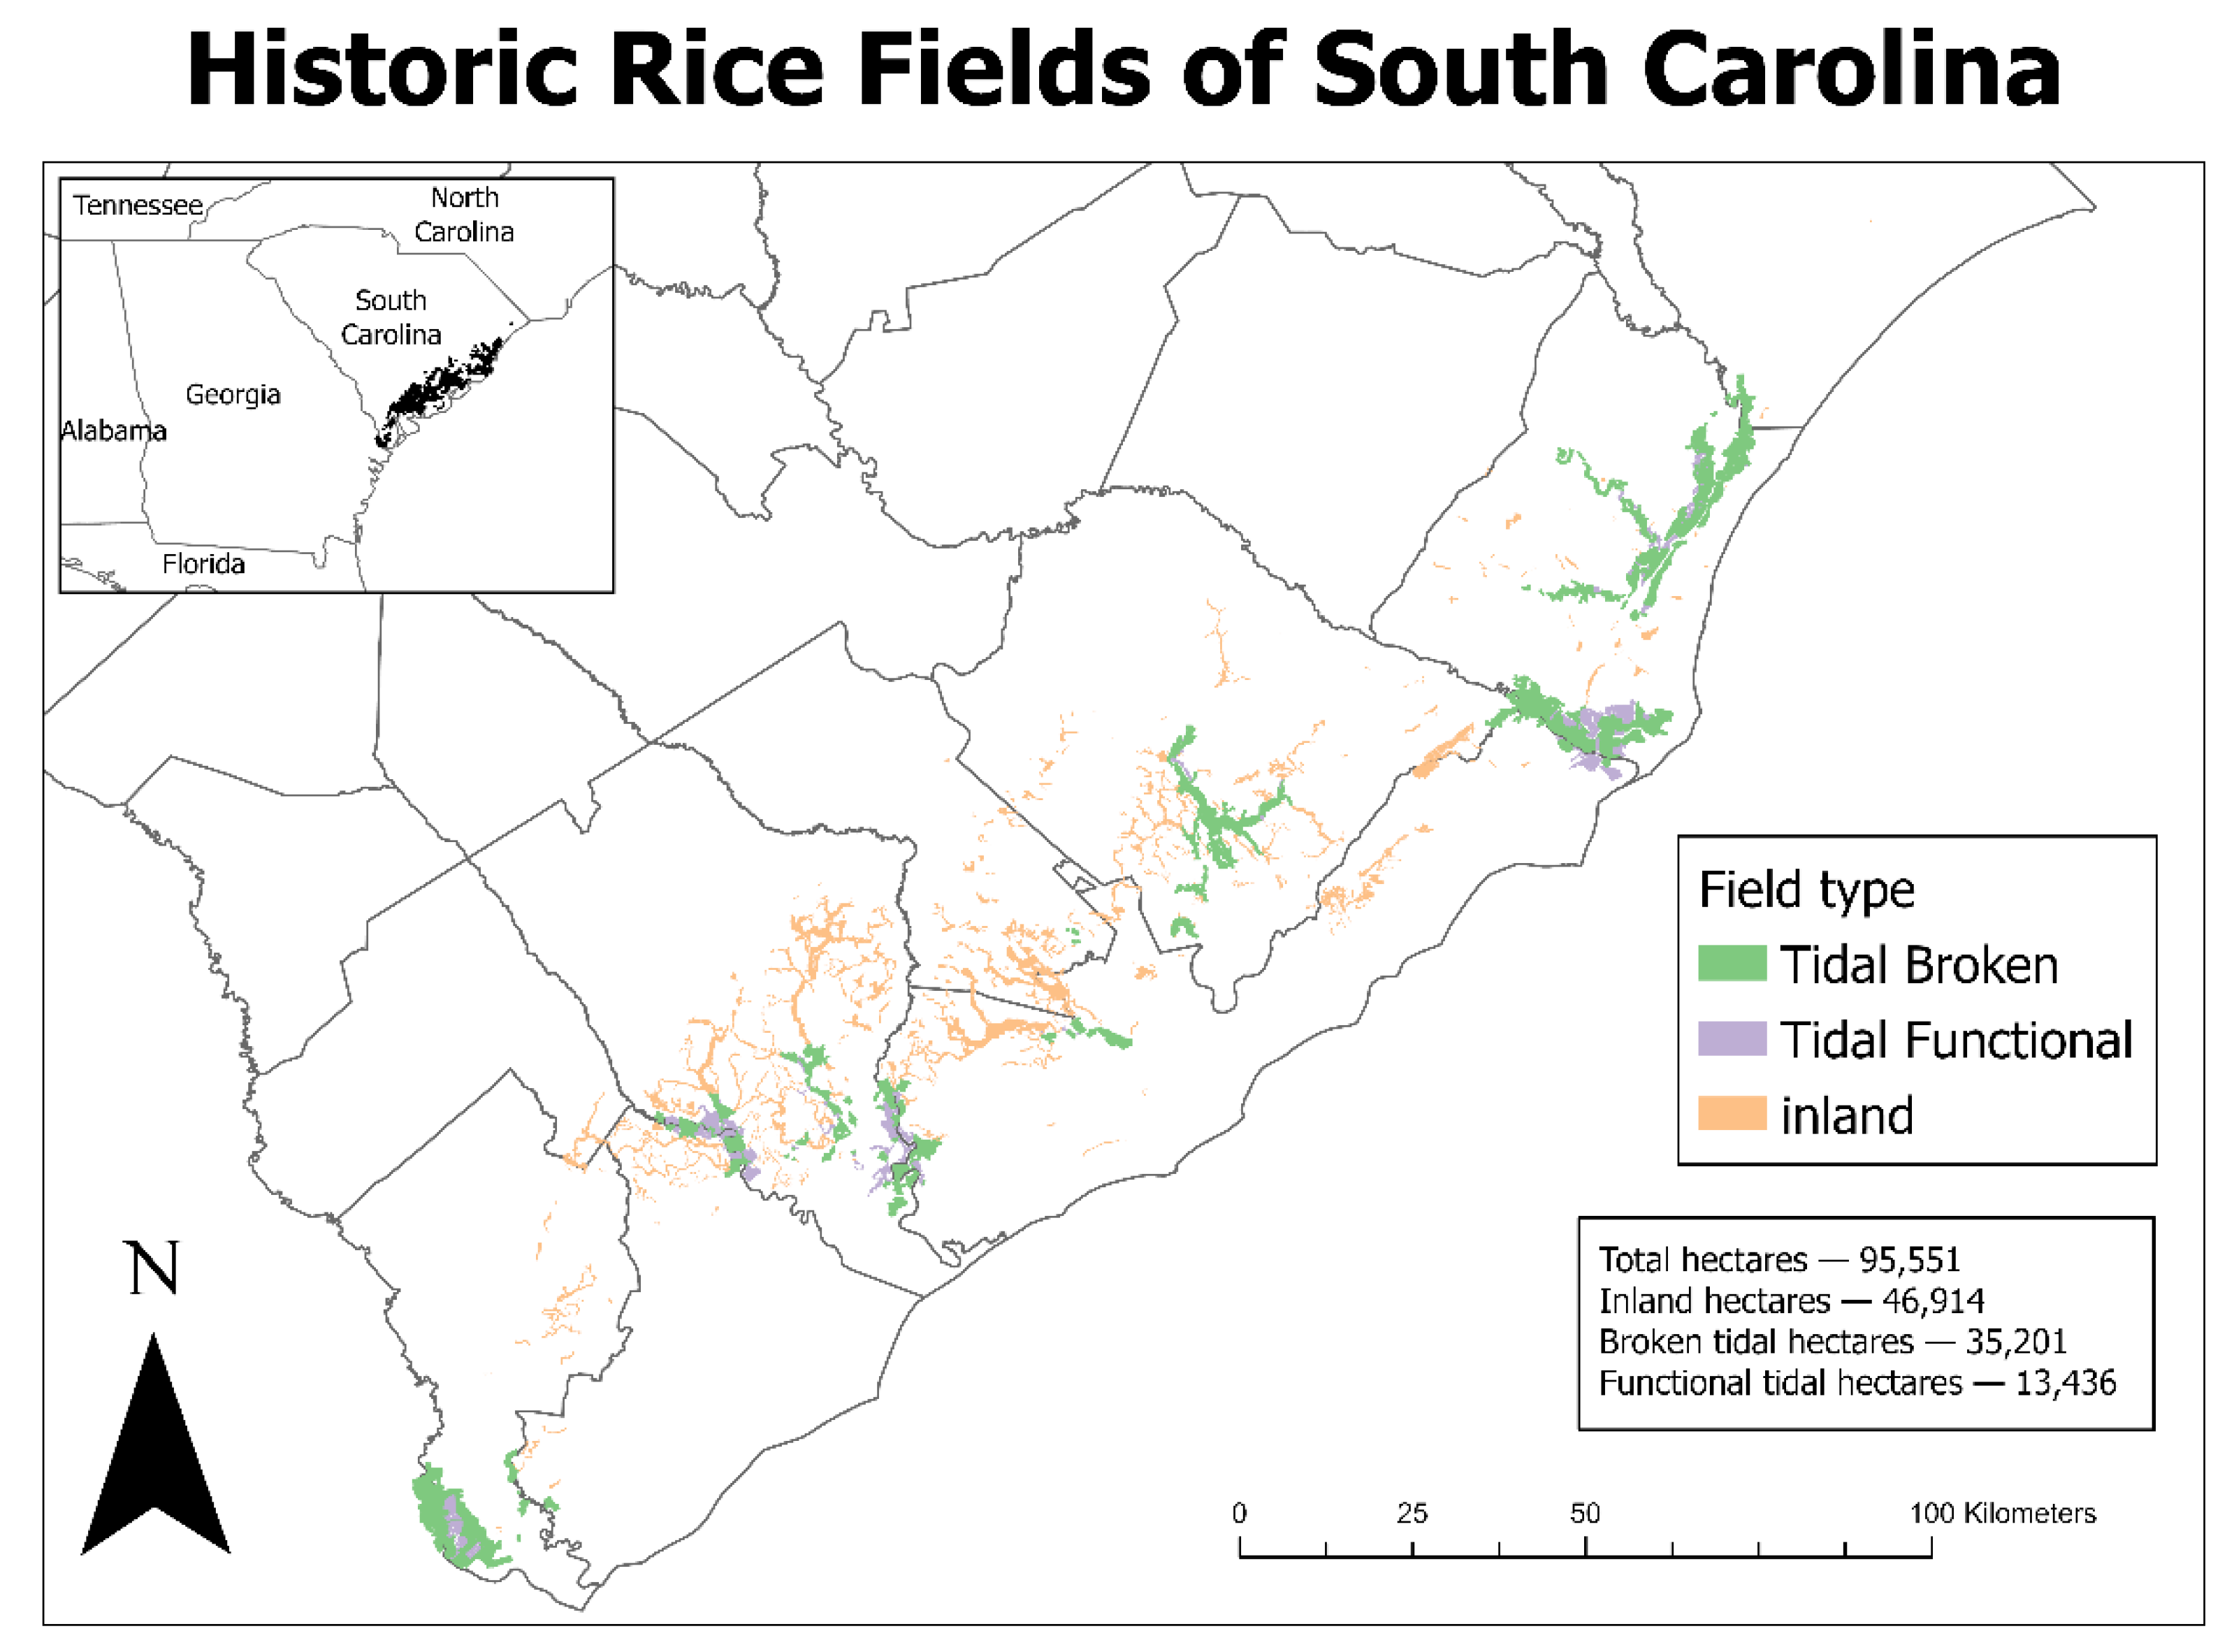
40]. Here, by delineating the full extent of historic rice fields in South Carolina, we provide the physical boundaries of these landscape legacies, which is the basis for beginning the process of embedding the human condition of the past and present within the ecological condition of the rice fields. We propose that this understanding may help inform the ecological and human conditions of the future. Historic rice fields from the Antebellum era are a landscape legacy of past land cover transformation that extends across the South Atlantic Coastal Plains from northern Florida to southern Virginia. Based on our estimates from South Carolina, where the practice was most extensive, we can assume that more than 95,000 hectares of wetlands and associated landscapes were transformed and impacted by slavery-driven rice culture, an increase in the area of known historic rice fields in South Carolina by as much as 68% over previous estimates [
12,
25]. Not only did the work of the enslaved and their planter owners influence the landscape, but the construction and maintenance of the fields also impacted the humans who were forced to do it. The hand labor involved with moving so much earth, as well as working in disease-ridden wetlands, in extreme temperatures, is thought to have caused the deaths of many enslaved children, men, and women. Whereas death rates for enslaved persons on cotton and tobacco plantations dropped to approximately 33% by the 1780s, double the number, approximately two-thirds, of enslaved persons still died on Lowcountry rice plantations up until the Civil War from chronic malaria, pneumonia, gastrointestinal and bowel diseases, overwork, and attacks by wild animals. Along the Savannah River, 90% of children enslaved on rice plantations died before 15 years of age, particularly from consecutive epidemics of Asiatic cholera [
41]. After the wetlands were released from human control primarily due to the end of slavery in the United States, they took various ecological trajectories. Our mapping project cataloged current wetland characteristics of these anthropogenic features, showing that many, while retaining the signatures of their former uses, have reverted to some form of natural land cover.
Surprisingly, developed lands, while representing a very small percentage (0.05%) of the total areal coverage, were geographically coincident with historic rice fields. Despite the grading and earth moving associated with development, historic rice field signatures were present to some degree. Even after these land modifications, the ability of LiDAR to detect subtle elevational changes was visible to the individuals manually digitizing the rice fields. The ability of LiDAR to detect subtle changes is a valuable feature for similar projects where historic land uses may have transitioned to a contemporary use. Of the inland rice fields identified, nearly 6.8% were evergreen forests, which are primarily plantation pine stands, thus representing another land use transition to a contemporary use. Unsurprisingly, woody wetlands comprised more than 80% of the tidal rice fields; however, and somewhat surprisingly, woody wetlands represented 31.6% of the tidal rice fields in our study. Encroachment of woody vegetation into the tidal rice fields through successional creep along the margins was evident in this circumstance. Considering we do not know the ecological status of these areas as a pre-rice landscape, it is plausible that they were forested wetlands that are reverting to their former condition [
42].
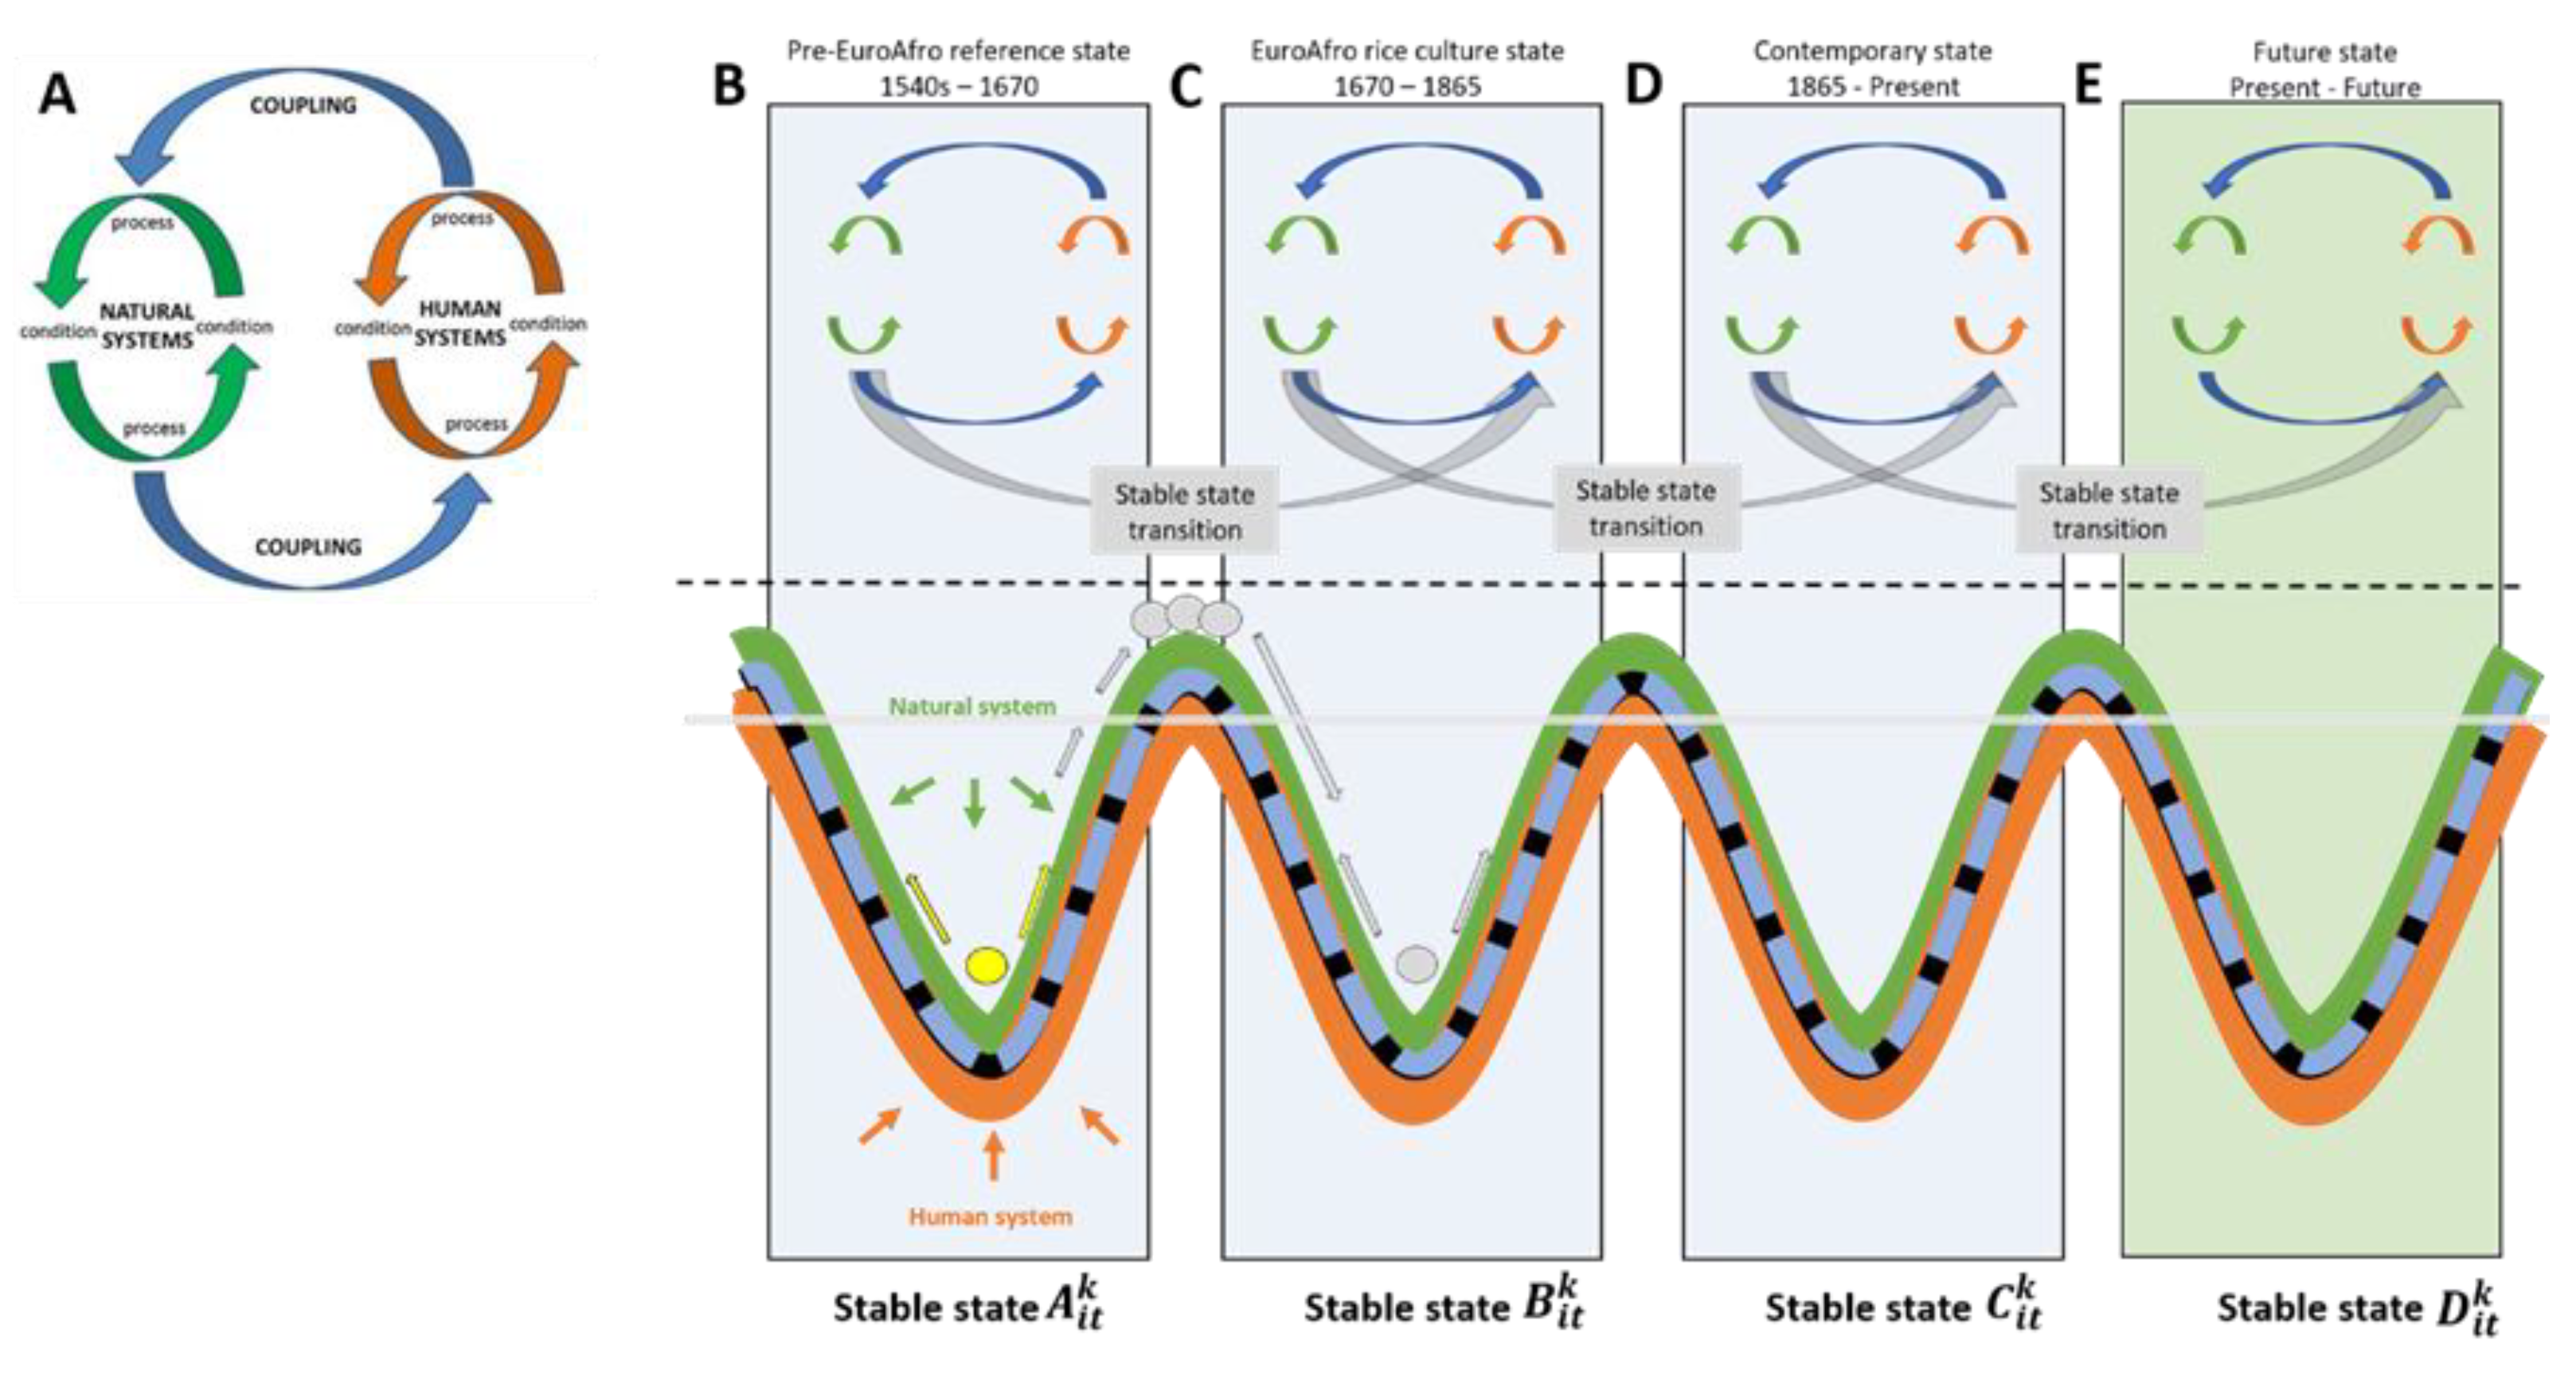
Rice cultivation in the pre-Antebellum south was a product of the slave economy that existed during this period and allowed for a landscape transformation from, most likely, forested wetlands to an agrarian landscape, providing evidence not only that the physical environment is often a product of the socio-political environment [
43] but also that the physical environment is instrumental in structuring the socio-political environment. In the case presented here, the socio-political–environmental complex that existed between the 1670s and the 1860s resulted in a series of alternate stable states, which are still today going through various trajectories of ecological, political, and sociological change.
The coupling of human and natural systems (
Figure 6A) has become extensive and has led to an understanding of the Earth within a new geological epoch termed the Anthropocene. During the pre-EuroAfro period (1540s to 1670) the landscape of the southeastern plains, while going through anthropogenic disturbance due to the development of cities such as Charleston, South Carolina, and Savannah, Georgia, was still in a somewhat “natural” condition. However, once the pre-EuroAfro natural landscape (
Figure 6B) was anthropogenically modified to the EuroAfro rice culture state (
Figure 6C), the interdependence of the system as a coupled human–natural system became even more evident and increasingly tightly coupled. Thereafter (
Figure 6D,E, the contemporary and future states, respectively), the evolution of the historic rice fields has been due to both natural and human-management phenomena.
Societal and cultural norms of a given period resulted in the landscape being in various local and regional alternate stable states (
Figure 6B–E). After emancipation, and without enslaved persons’ labor, the alternate stable state that was the rice enterprise was no longer profitable due to a state shift in the socio-ecological system that persisted for more than 150 years (
Figure 6D,E). During these transitional periods, rice fields took varying trajectories that were largely dependent on the new socio-ecological system that developed, which could vary spatially depending on a variety of factors. Some fields were allowed to transition towards an unmanaged “natural” state, while others were managed in large part for waterfowl. Even today, some fields continue to be managed primarily for waterfowl and recreation but also for non-game species such as wood storks and songbirds, while yet others continue along the path towards some unmanaged “natural” ecological state. While it is theoretically possible the ecosystem could return to a state similar to that of the pre-EuroAfro condition at various periods after the anthropogenic EuroAfro rice culture state shift (e.g., transitions from
Figure 6C,D to
Figure 6B), it is unlikely, if not impossible, and potentially even undesirable for the system to return to the exact pre-EuroAfro ecosystem due to additional changes across the socio-political–ecological landscape.
All but 9.9% of the identified rice fields (inland and tidal) were geographically coincident with a wetland type as described by the NWI. Historic rice fields represent more than 6% of the remaining wetlands in South Carolina. As wetland ecosystems, historic rice fields are valuable resources for their many and varied conservation and ecological functions; however, wetlands have been viewed as a hindrance to productive land use. Due to this view of wetlands, many have been modified to provide non-natural land uses (e.g., many wetlands have been ditched and drained for agricultural production). In fact, between the 1780s and the 1980s, wetland loss in the lower 48 states of the United States exceeded 50%. South Carolina, the extent of this study, lost an estimated 305,537 ha (755,000 acres) or 27% of its wetlands during this 200-year period [
19]. Wetlands continue to be converted to other uses; for example, during a nine-year span (1980–1989), 8274 ha (20,440 acres) of wetlands was lost in South Carolina [
44]. Once converted to other land uses, the historical and cultural values of historic rice fields, as well as the ecological value, will be lost without a clear path back to their former wetland condition.
Historic rice fields along the Atlantic coastal plain are land use legacies that no longer function as working rice fields but instead provide a variety of other functions in this regional landscape. Threats to their continued function are many and will likely interact in a synergistic manner that is difficult to predict. Threats include land use change [
45,
46], climate change (e.g., increased tropical storms and hurricanes [
47]), and sea level rise [
48]. Of these threats, some may be chronic (e.g., land use change, climate change, sea level rise), while others may be episodic (e.g., tropical storms and hurricanes). Leonard et al. [
48] found that in coastal areas of the southeastern U.S., there is likely to be decreased habitat connectivity for wildlife due to the combination of sea level rise and urban sprawl. Moreover, recent tropical storms and hurricanes (e.g., hurricanes Matthew (2016) and Florence (2018)) have damaged the structural integrity of rice field dikes to the point that they must be rebuilt if the landscape is to continue to be managed as a historic rice field. Reconstitution of these breached structures results in thousands of dollars of costs to private landowners, who are the primary owners of historic rice fields. As the breaches continue in the future, potentially more regularly, there may be a point where landowners can no longer afford the costs of reconstruction of the historic structures, thereby resulting in loss of these important features. As episodic and chronic stressors continue to increase in intensity and/or frequency, the structure and function of historic rice fields will be threatened and increasingly lost.
With increasing pressure from land use change across much of the Earth, further understanding of how conservation features may be embedded in the matrix of land use is needed. Historical rice fields then represent an intensive example of what conservation biologists routinely confront worldwide, which is how to restore, protect, and maintain biodiversity in a changing world, given vast and increasing human influence. Some landscapes, as a result of land use legacies, have valuable biotic assemblages, while also having value as cultural and historical sites. These values are in constant flux as the dynamics of ecology, politics, and culture evolve. Historic rice fields represent a prime case in point. This may present a conundrum to traditional conservation motives, where it is seen as desirable and attempts are made to return a system to its pre-anthropogenic state. Furthermore, to maintain the stable state that exists due in large part to the land use legacy will require the continuation or reintroduction of management activities that originally helped create that legacy [
2]. To further complicate attempts to return the landscape to a pre-rice-cultivation ecosystem assumes an understanding of the structure and function of the system prior to the early 1670s as a sort of reference system, a knowledge which does not currently exist. Given there was an understanding of the pre-rice ecosystem structure which could be restored, there is no guarantee that the historic ecosystem function would also be restored [
49].
This study expanded the known extent of Antebellum rice fields created by enslaved persons by 1.57–3.19 times (36.4–68.2% increase). This research focused on South Carolina, which was the epicenter of historic rice culture prior to the Civil War, and provides an index upon which to consider the extensiveness of this type of wetland transformation, knowledge that it happened at the landscape scale, and the types of wetland that may have been favored and their current characteristics. Yet still, there is much to be learned about the values these land use legacies provide, and the current study provides the underpinning to consider future work such as defining the stable states that existed before rice culture, understanding better the historical conditions under which enslaved persons worked during their cultivated states, and understanding what functions and values the legacy wetlands may have today. In addition to waterfowl hunting, which has been and continues to be the driving force behind the continued management of the rice fields, there are many unstudied values and services that these land use legacies provide (e.g., tourism-related activities such as bird and wildlife watching). The maps and data we have produced can form the foundation for a series of hypotheses on which many future investigations can be developed, and they can be input into conservation planning and design projects that wish to incorporate both cultural and natural values.


 ,
, 
