Communication

Estimating Air Pollution Removal and Monetary Value for Urban Green Infrastructure Strategies Using Web-Based Applications

1
School of Arts, Francis Close Hall Campus, University of Gloucestershire, Swindon Road, Cheltenham GL50 4AZ, UK
2
Faculty of Economics, University of Gdansk, 81-824 Sopot, Poland
*
Author to whom correspondence should be addressed.
Land 2021, 10(8), 788; https://doi.org/10.3390/land10080788
Submission received: 22 June 2021 / Revised: 20 July 2021 / Accepted: 25 July 2021 / Published: 27 July 2021
(This article belongs to the Special Issue Urban Ecosystem Services II: Toward a Sustainable Future)

Abstract

:
More communities around the world are recognizing the benefits of green infrastructure (GI) and are planting millions of trees to improve air quality and overall well-being in cities. However, there is a need for accurate tools that can measure and value these benefits whilst also informing the community and city managers. In recent years, several online tools have been developed to assess ecosystem services. However, the reliability of such tools depends on the incorporation of local or regional data and site-specific inputs. In this communication, we have reviewed two of the freely available tools (i.e., i-Tree Canopy and the United Kingdom Office for National Statistics) using Bristol City Centre as an example. We have also discussed strengths and weaknesses for their use and, as tree planting strategy tools, explored further developments of such tools in a European context. Results show that both tools can easily calculate ecosystem services such as air pollutant removal and monetary values and at the same time be used to support GI strategies in compact cities. These tools, however, can only be partially utilized for tree planting design as they do not consider soil and root space, nor do they include drawing and painting futures. Our evaluation also highlights major gaps in the current tools, suggesting areas where more research is needed.

1. Introduction

Air pollution caused by the growth of urbanization and industrialization continues to plague societies in the twenty-first century [1]. Urbanization plays a major role in worsening ventilation conditions and increases the emissions of pollutants [2]. The transformation of land use, caused by urbanization, reduces ventilation quality via building morphology and, indirectly, the urban wind velocity [3]. Air pollution derived from human activities comes from both indoor and outdoor environments [4]. It causes harm to health, decreases economic growth, and augments social problems (i.e., by way of knock-on societal effects) [5]. In 2015, the World Health Organization [6] estimated 4.3 million deaths occurred due to indoor air pollution and 3.7 million due to outdoor air pollution (i.e., 8 million for the year). Data published by the United Kingdom (UK) Royal College of Physicians demonstrates that there are around 40,000 fatalities each year due to air pollution [7].
Several studies show that green infrastructure (GI) can improve air quality in cities [8,9,10,11]. In particular, urban vegetation provides several ecosystem services and plays a vital role in air pollutant removal, heavy metal removal, rainwater interception, and microclimatic improvements [12,13,14].
Planting millions, billions, or even trillions of trees as a simple solution to air pollution and other major environmental problems is being proposed by an increasing number of global, regional, and national projects [15]. Large tree planting can also improve life satisfaction [16,17]. According to Jones’ [17] research, life satisfaction among NYC residents improved by 0.018 points on a 4-point scale during the first three years of the Million Trees NYC initiative, when over 400,000 trees were planted. This is a USD 505 increase in per capita monthly family income, or a 6.5% gain. According to the existing literature on the benefits of urban trees, the observed increases in life satisfaction following Million Trees NYC could be due to improved air quality, lower ambient temperatures during the spring and summer, lower crime rates, improved recreation and exercise opportunities, or greater social and community cohesion [17]. Tree planting, however, is a lot more difficult than it appears [15]. It takes between 15 and 40 years for a tree to grow a sufficiently large canopy to offer several ecosystem services (e.g., aesthetics, reducing air pollution, controlling rainwater, and carbon storage) [18]. However, street tree growth is influenced by critical landscape design issues that affect access of the tree roots to water, air, and nutrients [19]. Landscape architects and urban foresters should consider the concept of “optimal planting,” which includes several factors such as the extent of rooting space and the quality of urban soils for supporting trees [19,20]. Therefore, there is a need for tools that can aid in the process of tree planting as well as the implementation of landscape design in order to guarantee healthy trees can provide sufficient ecosystem services in the built environment [21].
In addition to tree planting campaigns, several nations and towns throughout the world have made deliberate pledges to provide high-quality GI [22,23]. In particular, GI strategy (which outlines which GI and ecosystem service assets already exist and how they can be improved [24]) serves as the foundation for policies and decisions on development proposals in cities to avoid loss or harm before considering mitigation or compensatory measures [25]. However, an issue raised in the scientific literature and by stakeholders is a lack of reliable friendly user models with local data for assessing ecosystem services that support GI strategies [26], as well as strong evidence on the most cost-effective and sustainable models and procedures for long-term management and maintenance of high-quality GI [22]. Therefore, rapid ecosystem services evaluation tools and models have sparked widespread interest across all sectors; nonetheless, it is widely acknowledged that systematic use of ecosystem services in decision- and policy-making necessitates a level of accuracy that is seldom achieved in practice [27,28]. Experts from the disciplines of forestry, agriculture, urban planning, and environmental engineering must collaborate to develop accurate tools that can simulate plant-built environment interactions [29]. Fortunately, numerous models that simulate and quantify energy, water flows, and ecosystem services in various ecosystems already exist [29]. For example, the last few years have seen an increase in the use of the United States Department of Agriculture, Forest Service i-Tree tools in the American and international market (e.g., Australia, Canada, Mexico, South Korea, much of the European Union, and the UK). Even though the science and development of the i-Tree tools date back to the mid-1990s, the software suite was released as a framework for science delivery in 2006 [30]. Today, i-Tree tools include several desktop applications (e.g., i-Tree Eco and i-Tree Hydro) and web-based applications (e.g., i-Tree Canopy, i-Tree Country, i-Tree Design, and i-Tree Species) that provide baseline data for tree benefits and planning over time [26,31].
In the UK, for instance, several ecosystem services provided by GI that specifically target air pollutant removal have been calculated using i-Tree tools. For example, dating back to 2011, the i-Tree Eco project started in Torbay, England that has now been introduced in more than 20 cities and towns [32,33]. In 2013, Natural England [34] evaluated three of the tools (i.e., i-Tree Design, i-Tree Eco, and i-Tree Streets) for applications nationwide. i-Tree Eco uses data collected using standardized time-consuming field methods that require professional foresters and arboriculturists [26,33] in which data on the number and health of trees assess their quantity and monetary value (i.e., in terms of air purification, carbon storage, and carbon sequestration [32]). Similarly, ready-made GI valuation tools available online can be used by those with little to no ecological background or training, offering low-budget alternatives for applications and assessments [34]. In particular, i-Tree Canopy (i.e., estimating tree canopy levels using aerial photography) as well as the UK’s Office for National Statistics tool (i.e., framed by using postcodes)—both based on different spatial parameters and methods—have been mostly used to assess GI benefits and the UK natural account. Specifically, the Office for National Statistics tool was created in response to the government’s commitment to incorporate natural capital accounting in the UK Environmental Accounts by 2020 [35]. In addition, the UK Government has pledged to boost tree planting rates across the country to 30,000 ha per year. Between 2020 and 2025, they have allocated over GBP 500 million of the GBP 640 million Nature for Climate Fund on trees and forests in England to assist this goal [36]. To meet these ambitious goals in the coming years, evaluation tools and new guidance through the National Model Design Code on how trees can be included in the built environment (including design parameters for street tree placement) are required [36].
Moreover, such publicly-funded planting efforts rarely receive formal or even informal benefit-cost analyses, implying that large amounts of resources (i.e., financial, labor, etc.) are being deployed without a clear understanding of their returns, preventing comparisons of the net benefits per penny spent on afforestation to other potential urban improvement projects, such as early childhood education [17]. Thus, understanding the net benefits of urban trees is essential for justifying public-funding planting efforts or just allocating money to maintain existing urban trees on public land [37]. In this effort, this communication examines tree cover and relating ecosystem service utility using the Bristol City Center as an example by: (1) illustrating the main features of free user-friendly web applications (i.e., i-Tree Canopy and the Office for National Statistics tool), and (2) comparing i-Tree Canopy Version 6.1 (i.e., using American quantified datasets), Version 7.1 (i.e., local UK quantified datasets), and the Office for National Statistics website in the context of their use and as tree planting strategy tools in Europe. The tools are centered on aiding policymakers to best understand the benefits of maintaining trees and GI in terms of a balanced urban ecosystem services output.

2. Materials and Methods
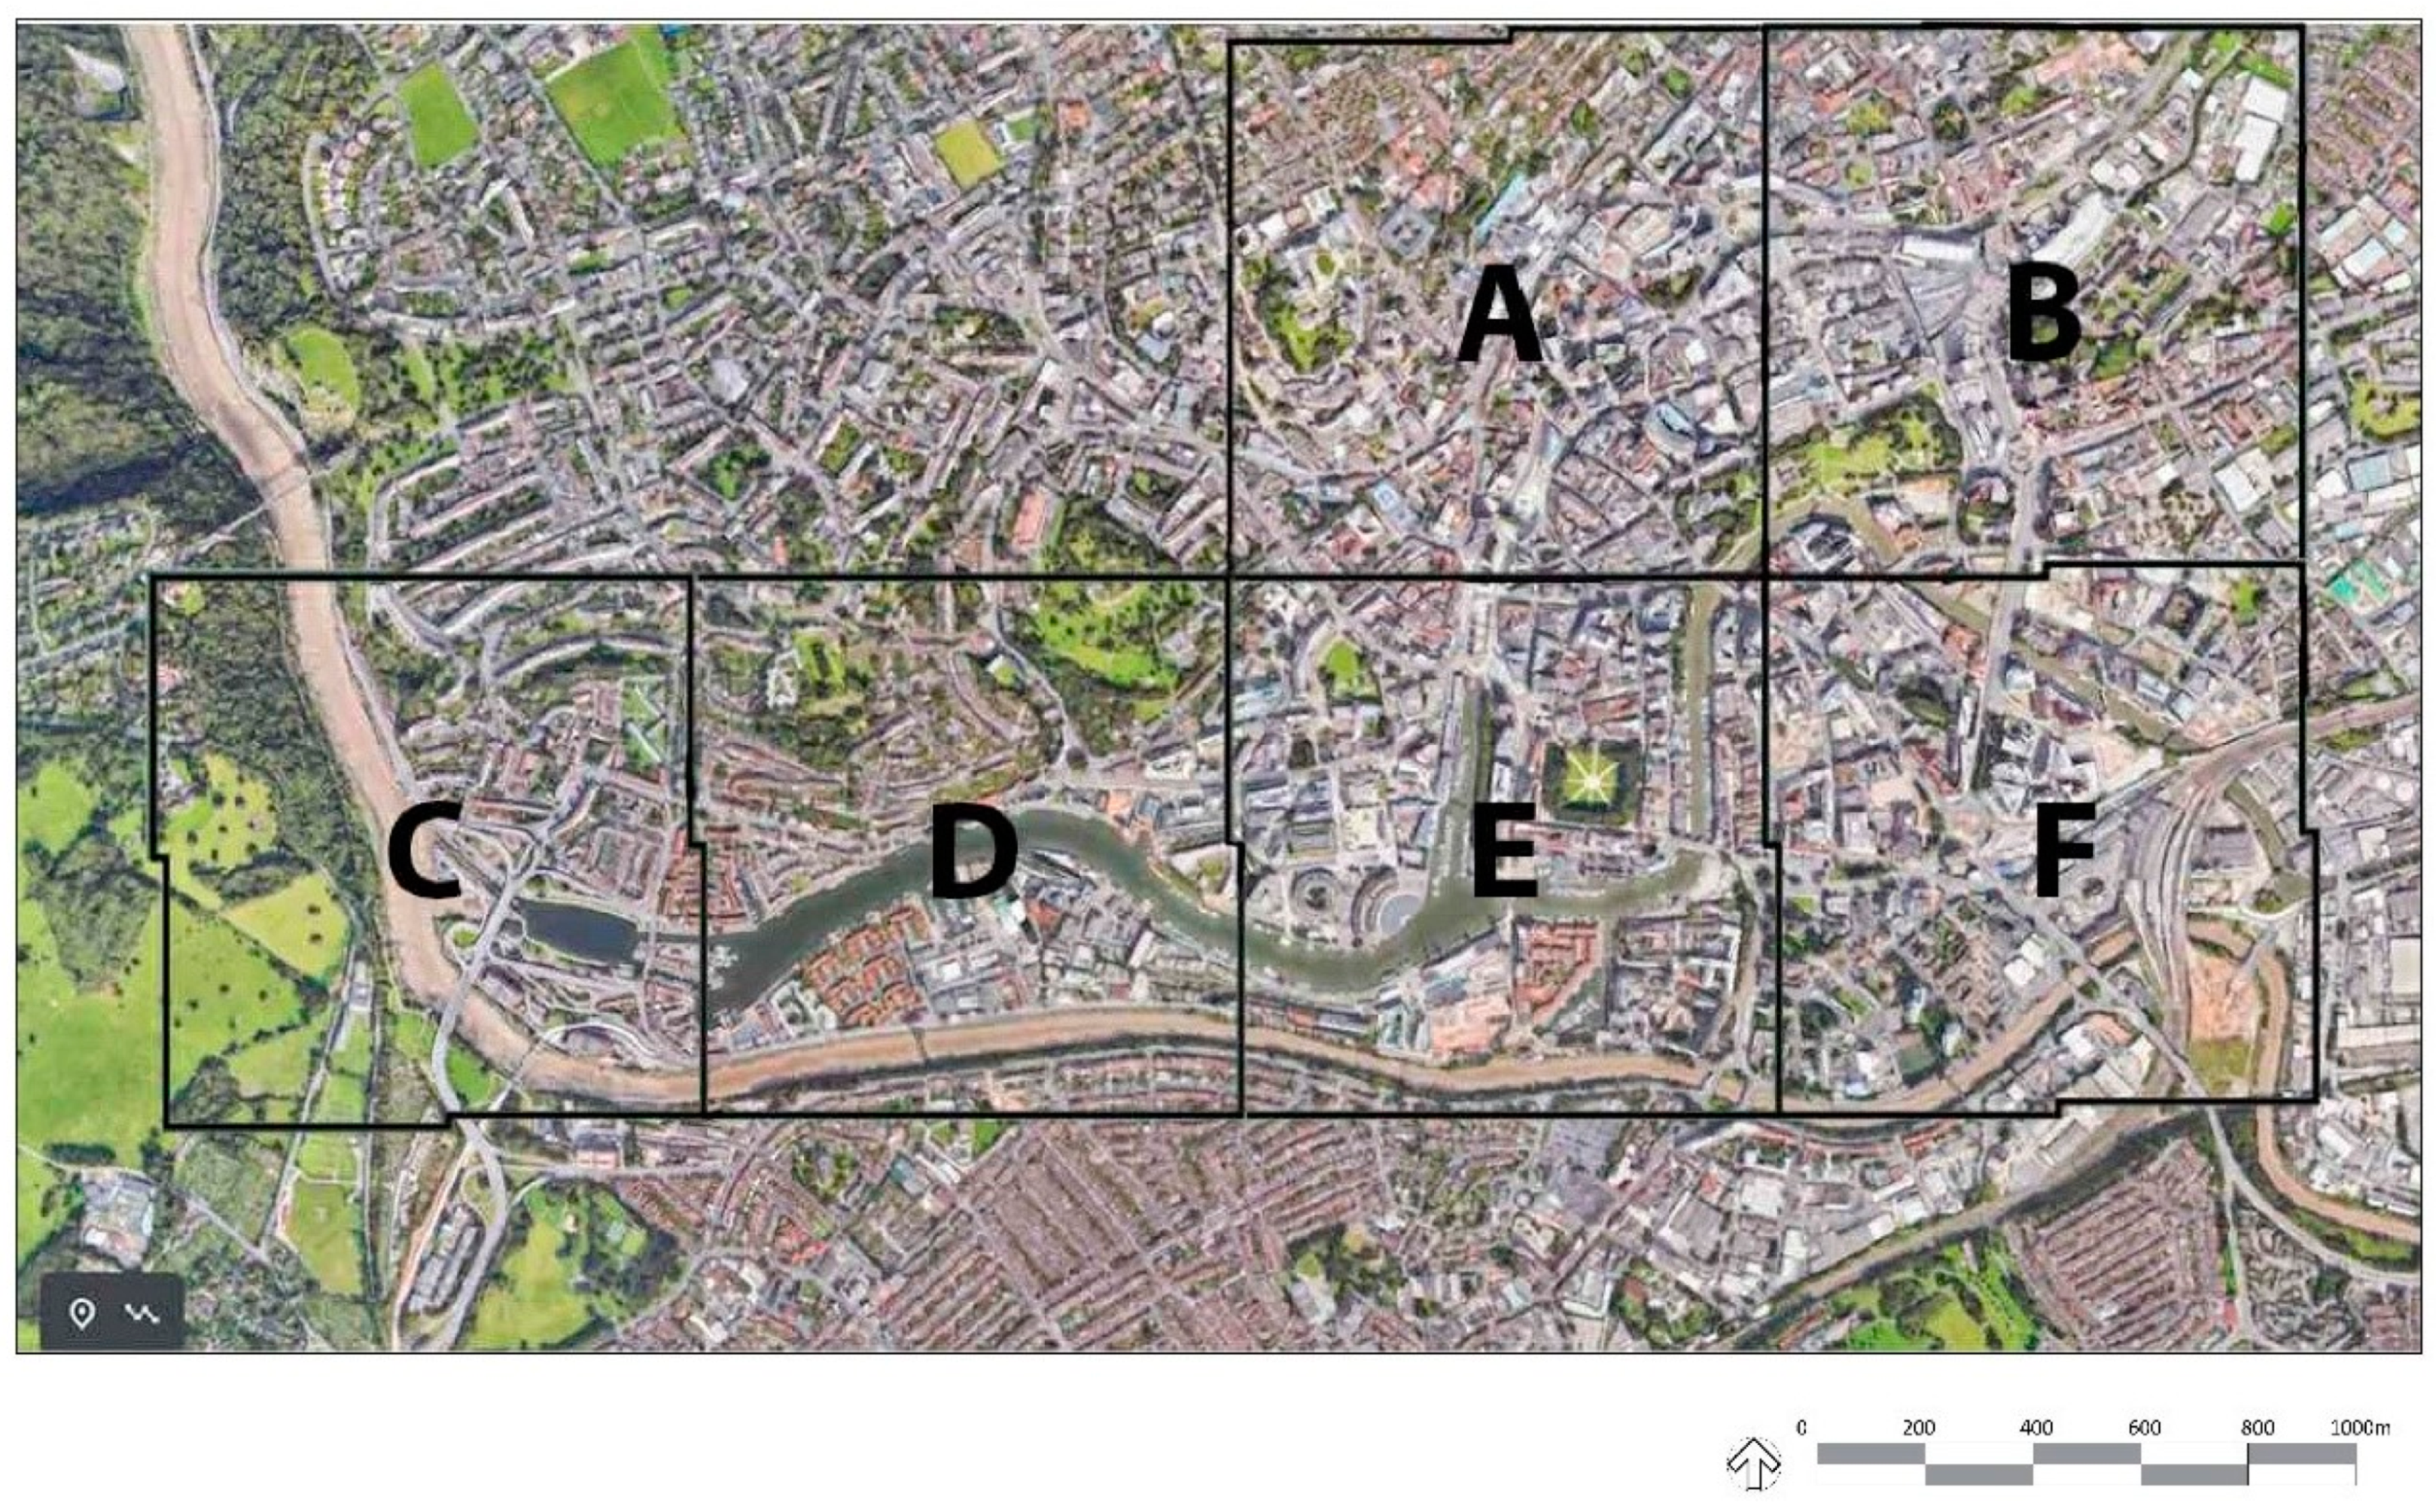
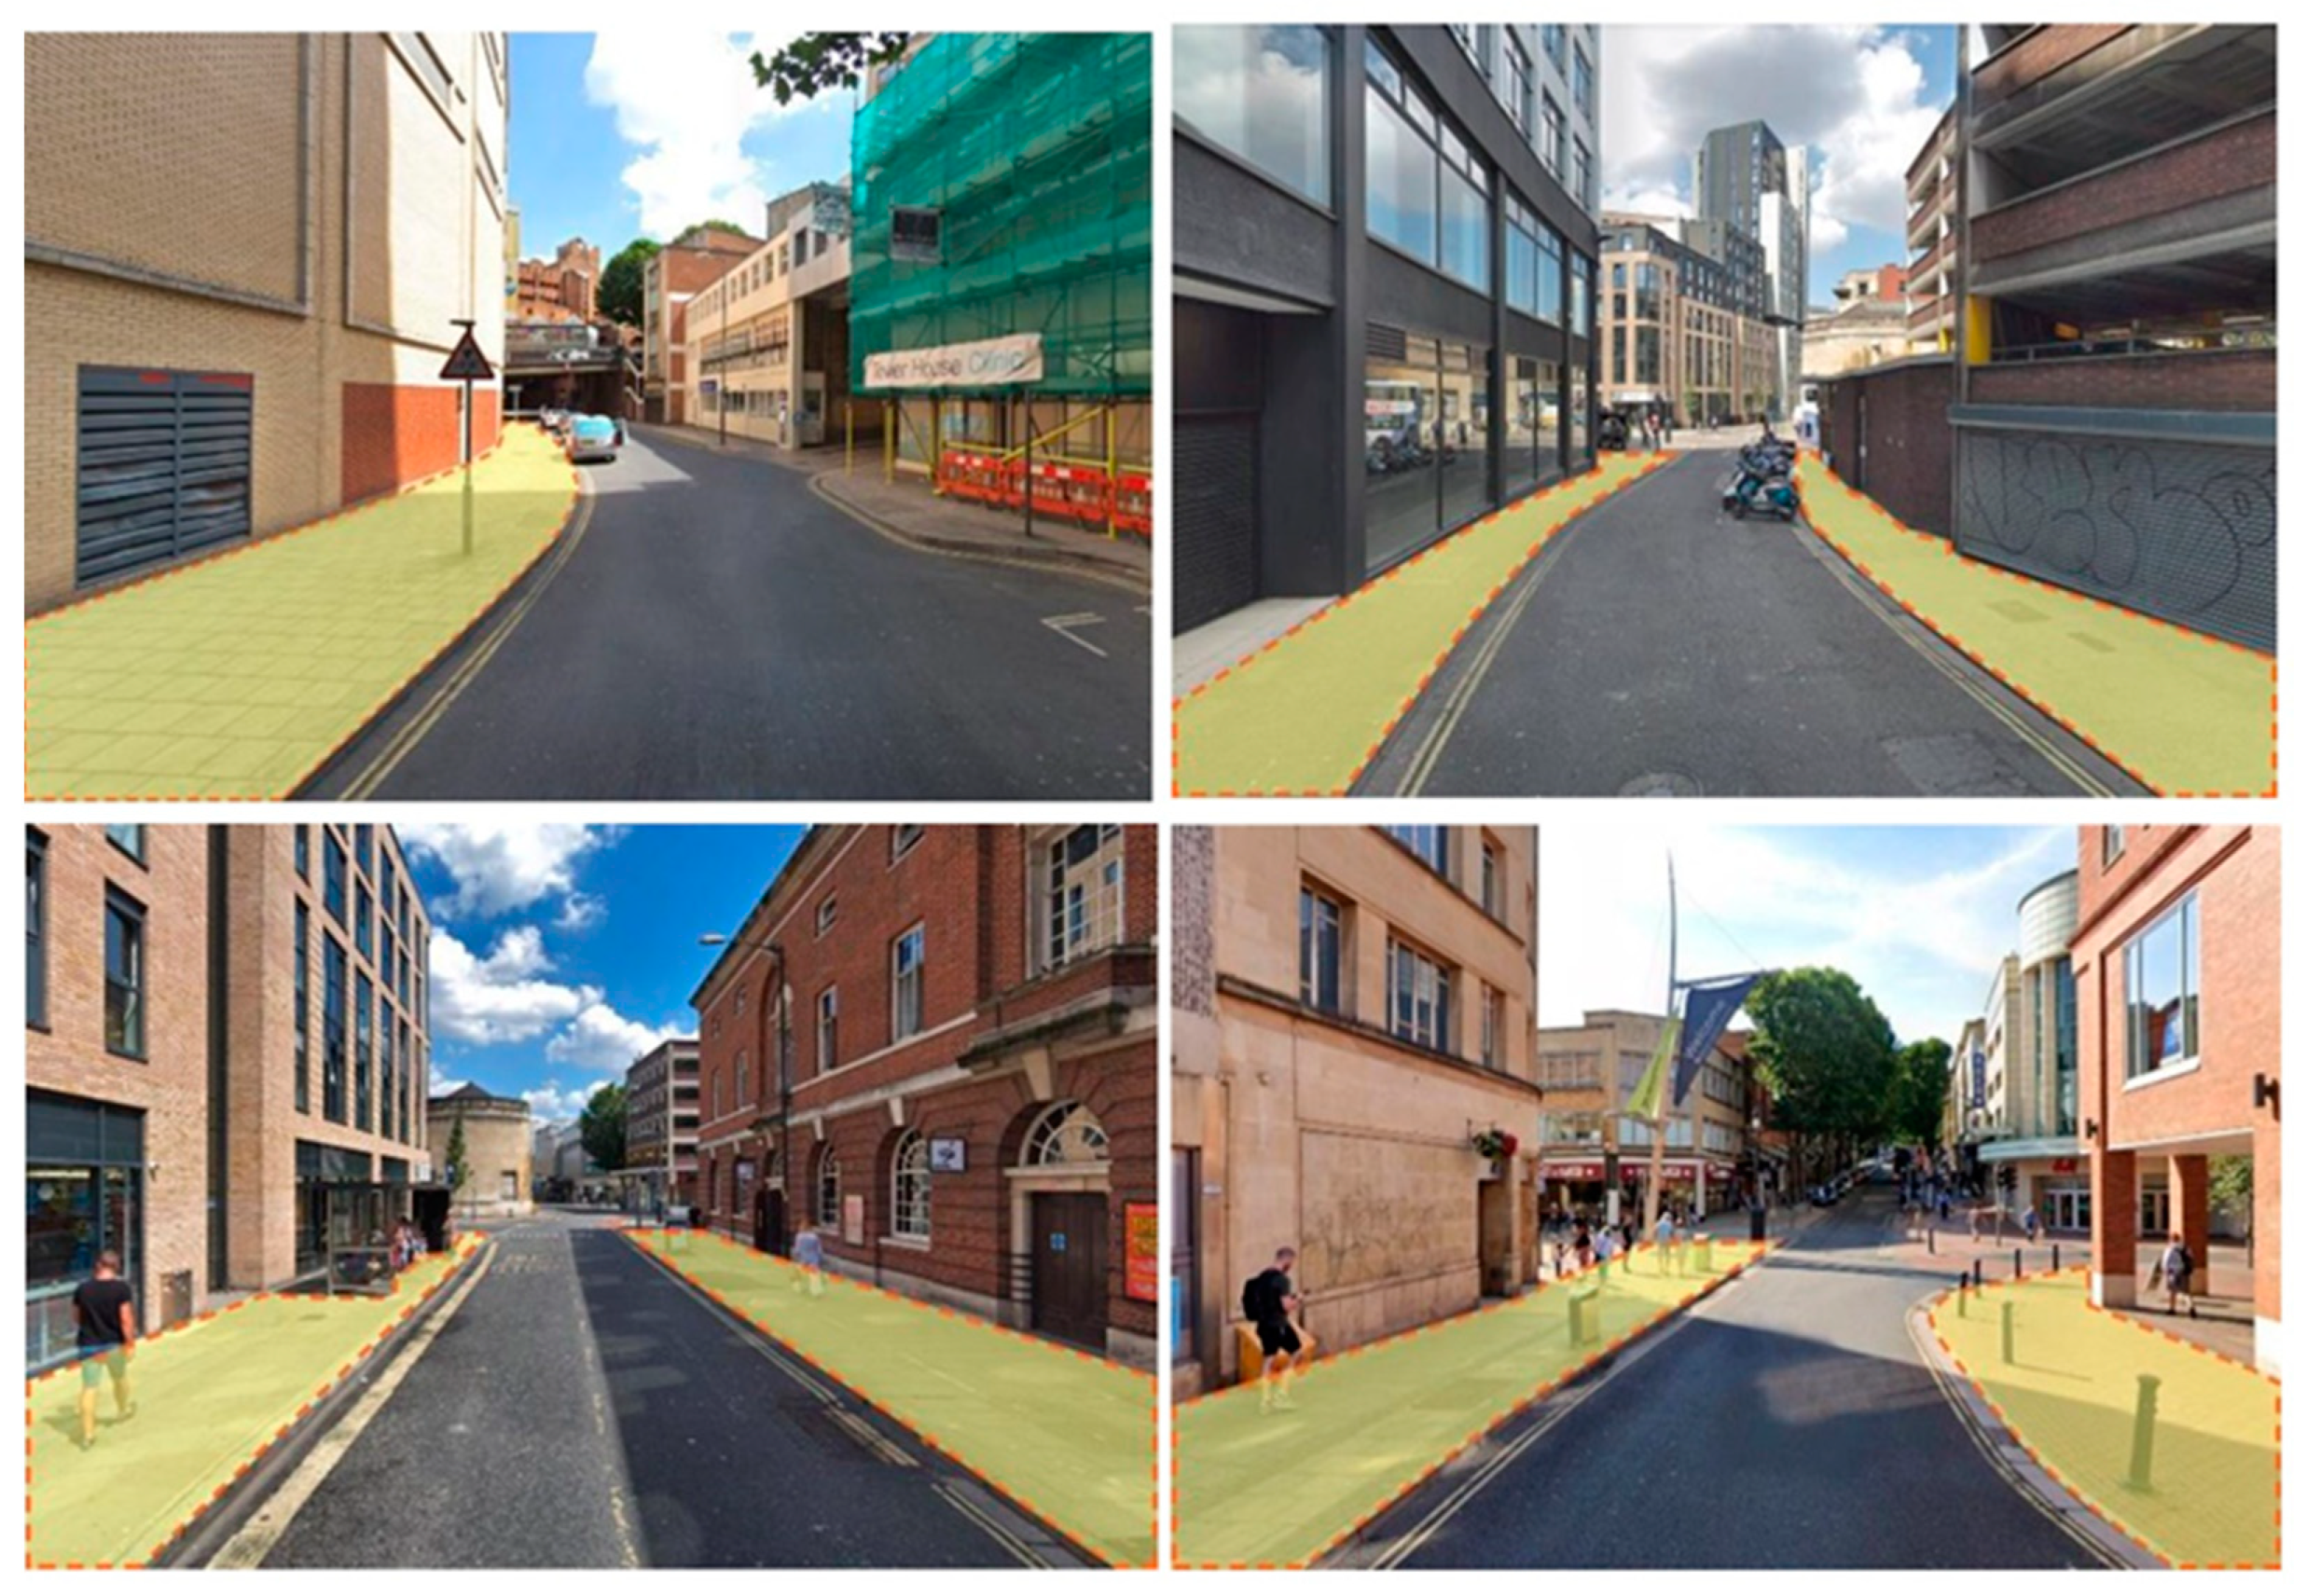
2.1. Study Area

Bristol is the largest city in South West England with an estimated population of 463,400 people [38]. In 2019, Bristol’s Council Cabinet approved a GBP 4 million, five-year management contract for preserving the city’s trees, with the goal of doubling the city’s tree canopy [39]. A commissioned report from the City Council showed that around 300 deaths each year (i.e., 8.5% of total deaths) in the City of Bristol had been attributed to air pollution [40], making it crucial to control and reduce air pollution in certain areas. The study area is comprised of six areas in Bristol City Centre according to the postcode BS1 (i.e., Bristol Central, see https://www.streetlist.co.uk/bs/bs1, accessed on 1 June 2021) with a population of 11,991 inhabitants living between Broadmead and Wapping Wharf (Figure 1). The choice was supported by: (1) preliminary desk research using ArcGIS Version 10.5.1 and the EDINA Digimap web-based mapping service that evaluated the physical BS1 zones, which took into account the location of air pollutant monitors, population density, and NO2 concentrations and found that NO2 is above the UK legal limits within postcodes BS1-2 and BS1-3 [41], and (2) according to council figures, it has planted approximately 6000 trees in each of the last four years. However, far too many of these are younger, smaller trees that are not in the city center, where they are most needed, and will take decades to reach maturity [42]. The six areas (i.e., letters A–F) represent the postcode sectors within the BS1 district—each with an area of 1 km2.

2.2. Office for National Statistics Web-based Application

Quantified pollution removed by vegetation (i.e., per kg) and avoided health damage costs (i.e., GBP per person) in each area is calculated using the Office for National Statistics website [43]—an online tool developed by the Centre for Ecology and Hydrology. The tool is available online at: https://www.ons.gov.uk/economy/environmentalaccounts/articles/ukairpollutionremovalhowmuchpollutiondoesvegetationremoveinyourarea/2018-07-30, accessed on 1 June 2021. This calculator also provides the avoidable health damage costs per person within postcodes and compares it to the UK average. In 2020, to calculate pollution removed by vegetation as well as the avoided health damage costs for the selected areas, we have entered postcodes within the BS1 district into the Office for National Statistics tool (i.e., area A = BS1-1 and BS1-2, area B = BS1-2 and BS1-6, area C = BS1-6, area D = BS1-6, area E = BS1-4 and BS1-6, and area F = 1-6). The Office for National Statistics website’s methods are being developed to incorporate the values within the UK’s natural capital accounts [44]. Air pollution removal by urban green and blue infrastructure is calculated using the EMEP4UK model which is a dynamic atmospheric chemistry transport model [44,45]. Table 1 illustrates pollutants removed by urban green and blue infrastructure (i.e., urban trees and woodland, urban grassland, and urban water) as dry pollutant deposition (i.e., in terms of kilo tonnes per year) throughout the UK in 2015. The negative values for several pollutants removed by urban water, which are legitimate outputs of the scenario comparison, imply that dry deposition to water would be higher if there were no woodland or grassland [44].
The monetary account’s economic and health calculations are based on damage cost per unit of exposure, with the economic benefit calculated directly from mortality and morbidity statistics for each local authority in the UK, as well as the receiving population’s change in pollutant exposure [44]. Detailed methods are given in Jones et al. [46].

2.3. i-Tree Canopy

To calculate the tree cover and the monetary value for the selected areas in Bristol, the free online tool i-Tree Canopy Version 6.1 in 2020 and Version 7.1 in 2021 was used. To compare the data from the Office for National Statistics, the Pollution Removal GeoPackage (i.e., found at: http://geoportal.statistics.gov.uk/search?q=Geopackage, accessed on 1 June 2021) was used to create six ESRI shapefiles in ArcGIS Version 10.5.1. The boundary of each postcode area and the ESRI shapefiles were imported into the i-Tree Canopy tool. Each boundary was 1 km2. A total of 500 random points (i.e., with a standard error (SE) < 3%) were photo interpreted for each area for a total of 3000 points. Within each area, the percentage of each cover class (i.e., ‘p’) was calculated as the number of sample points (i.e., ‘x’) hitting the cover attribute divided by the total number of interpretable sample points (i.e., ‘n’) within the area of analysis (i.e., p = x/n). The SE of the estimate is calculated using Equation (1) [47,48].
SE = p   ( 1 p )   n
where p = percentage of each cover class, n = total number of interpretable sample points.
For the photo interpretation, two photo interpreters with a background in landscape architecture and urban forestry classified each point using three cover classes: two default classes (i.e., tree and non-tree) and grass. i-Tree Canopy Version 6.1 calculates air pollutant removal and monetary values using the default values (i.e., the multipliers) of air pollutant removal rates (i.e., g/m2/year) and monetary values (i.e., USD m−2 year−1) for a unit tree cover derived from i-Tree Eco projects across the United States [49]. In this version for international projects (i.e., outside the United States), the default values are derived from the United States’ total removal amount and monetary values used from American urban areas [49]. The monetary values are in USD and the tool calculates currency values from the online currency exchange tool at: https://www.openexchangerates.org, accessed on 2 June 2021. On the other hand, i-Tree Canopy Version 7.1 estimates the ecosystem service rates using i-Tree Eco batch runs as well as using local pollution and weather data [50]. A description of the metadata used in the model is available in the i-Tree Canopy metadata and data sources [50]. Furthermore, the monetary values for ecosystem services in the UK are provided by Treeconomics, which are available online at: https://www.itreetools.org/documents/734/UK_Benefit_Prices_from_Danielle_Hill_Treeconomics_-_Benefits_Prices_by_County_Final_1.xlsx, accessed on 10 June 2021. In this study, both versions were run. Specific to Version 7.1, the tool used the UK’s average data as well local data in urban areas, i.e., the South West data (Table 2).

2.4. Comparison of the Office for National Statistics and i-Tree Canopy Tools

In terms of indicators, the i-Tree Canopy toolset contains six common air pollutants (i.e., carbon monoxide (CO), nitrogen dioxide (NO2), ozone (O3), particulate matter less than 2.5 microns (PM2.5), particulate matter greater than 2.5 microns and less than 10 microns (PM10), and sulfur dioxide (SO2) [49]) while the Office for National Statistics also contains six common air pollutants (i.e., ammonia (NH3), NO2, O3, PM2.5, PM10, and SO2). In order to compare the two tools, we have not included CO from i-Tree and NH3 from the Office for National Statistics. Furthermore, to compare the total pollutant removal amounts between i-Tree Canopy Version 7.1 with local data and the Office for National Statistics’ findings, the Office for National Statistics values were converted from kg/km2 to kg/ha.

3. Results and Discussion

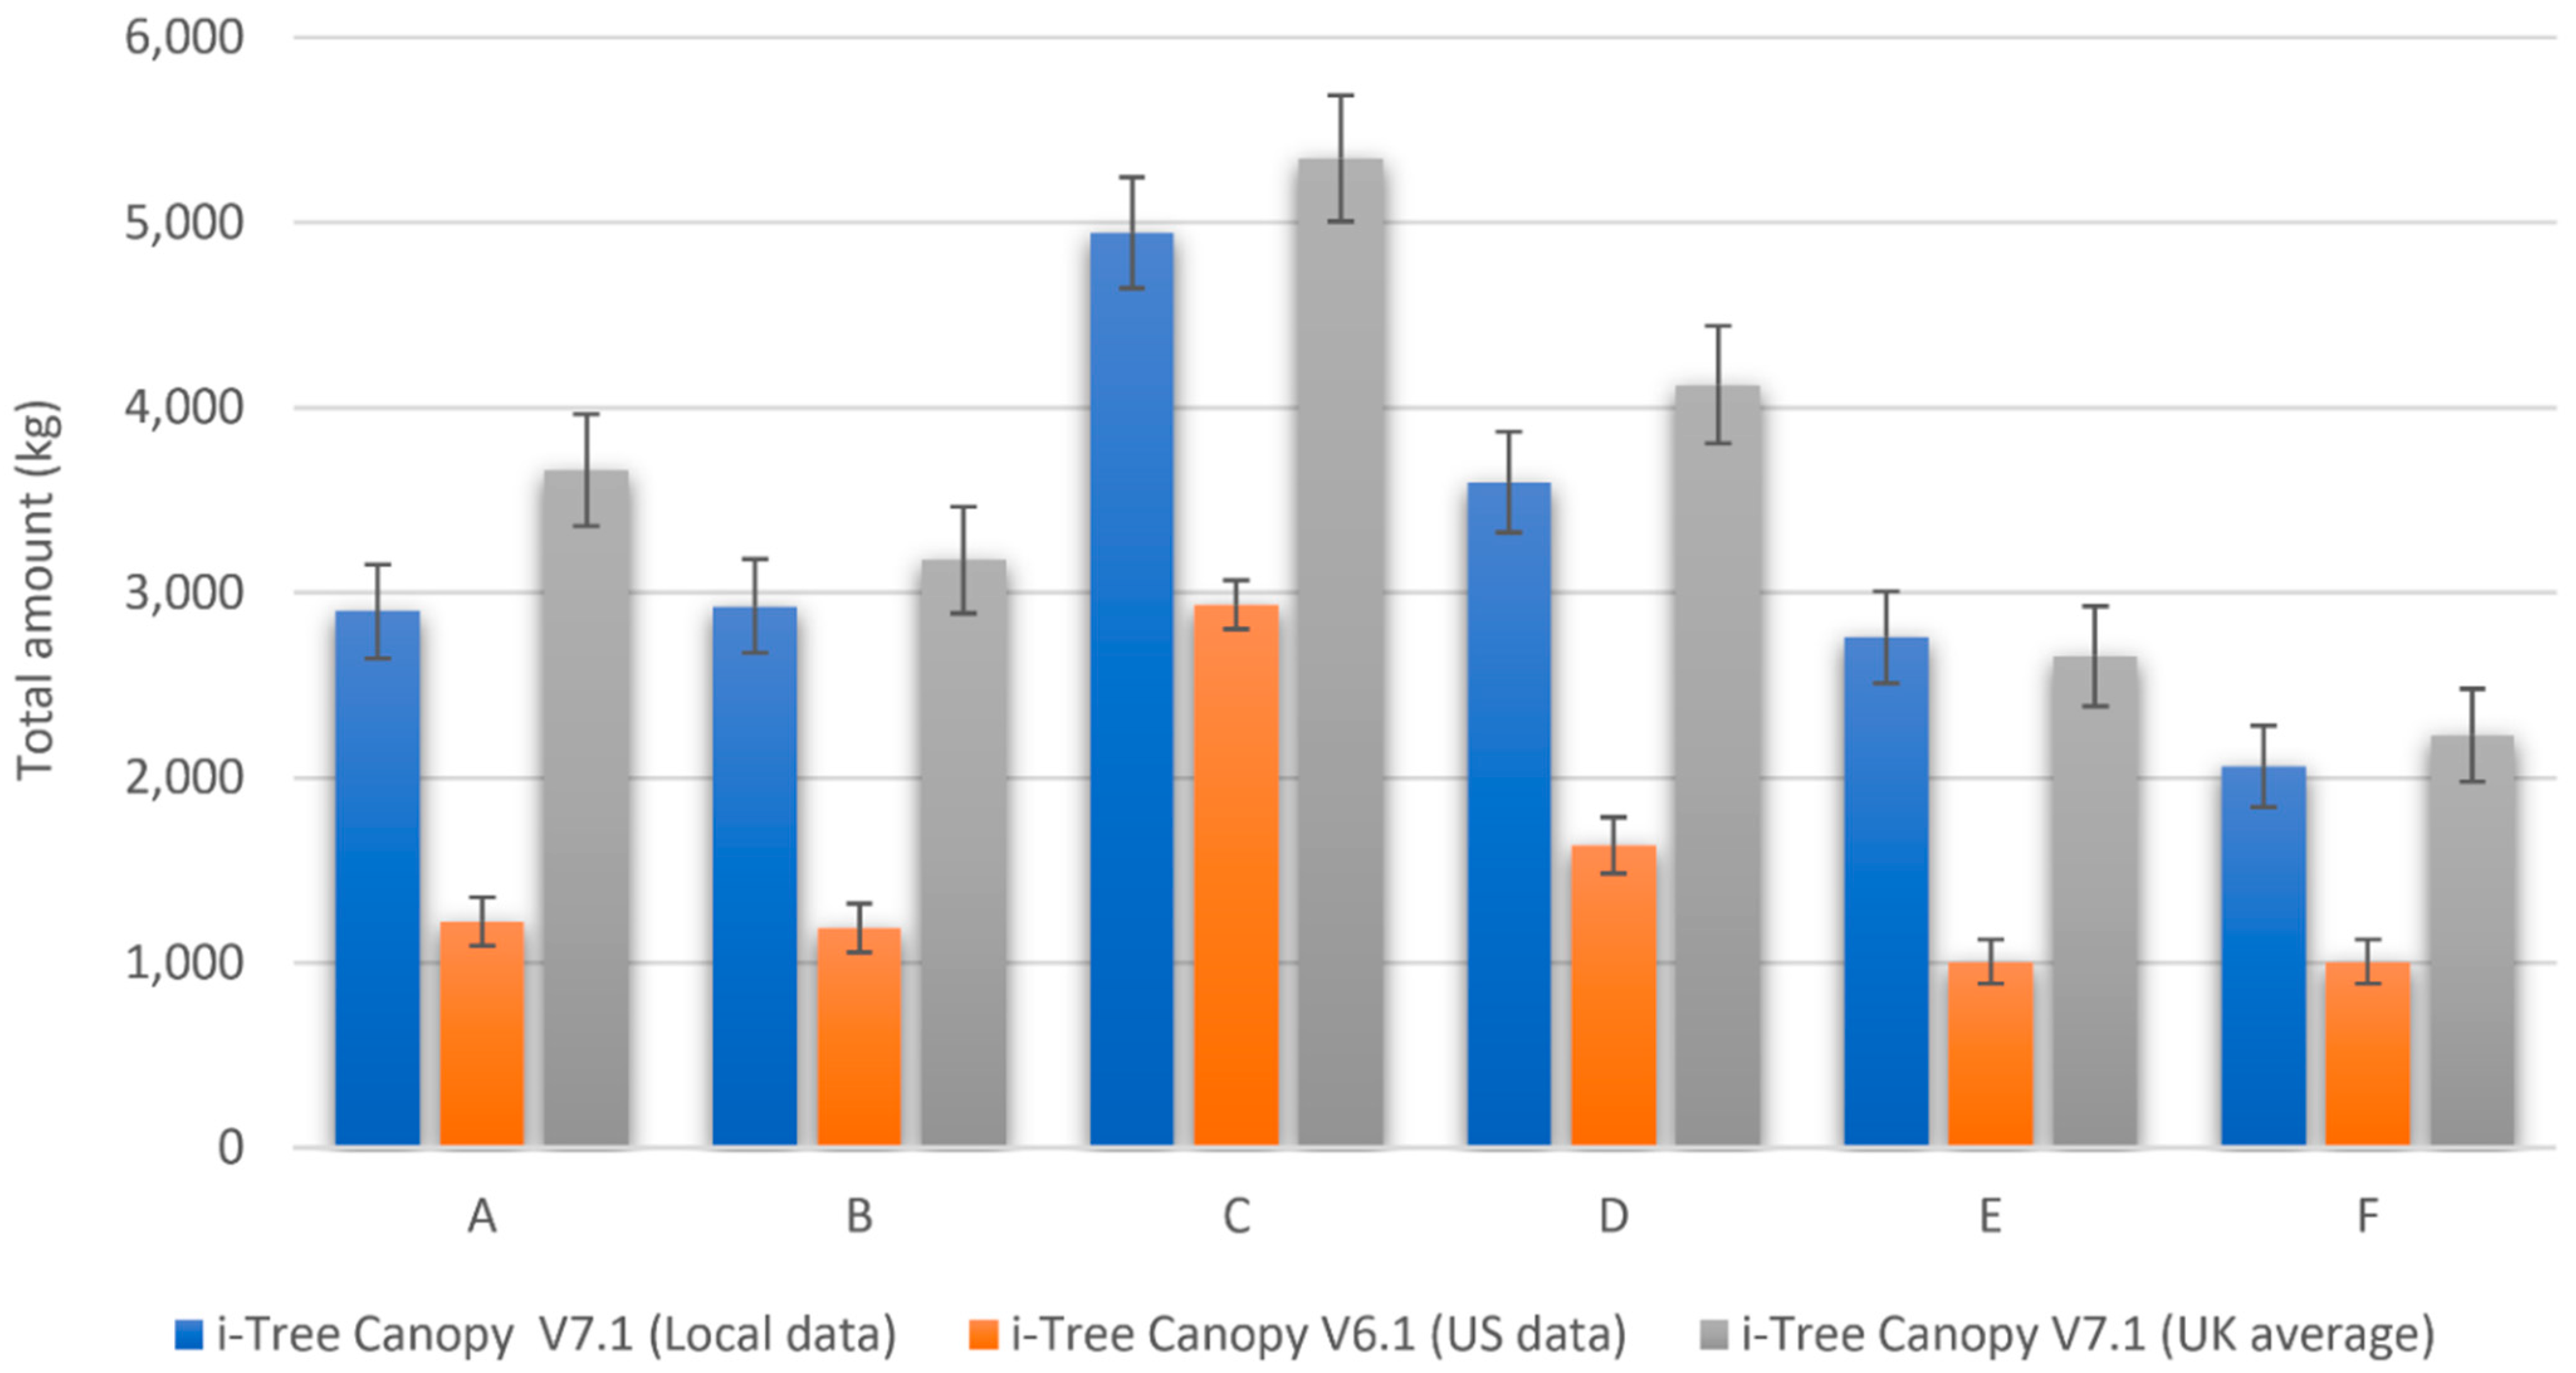
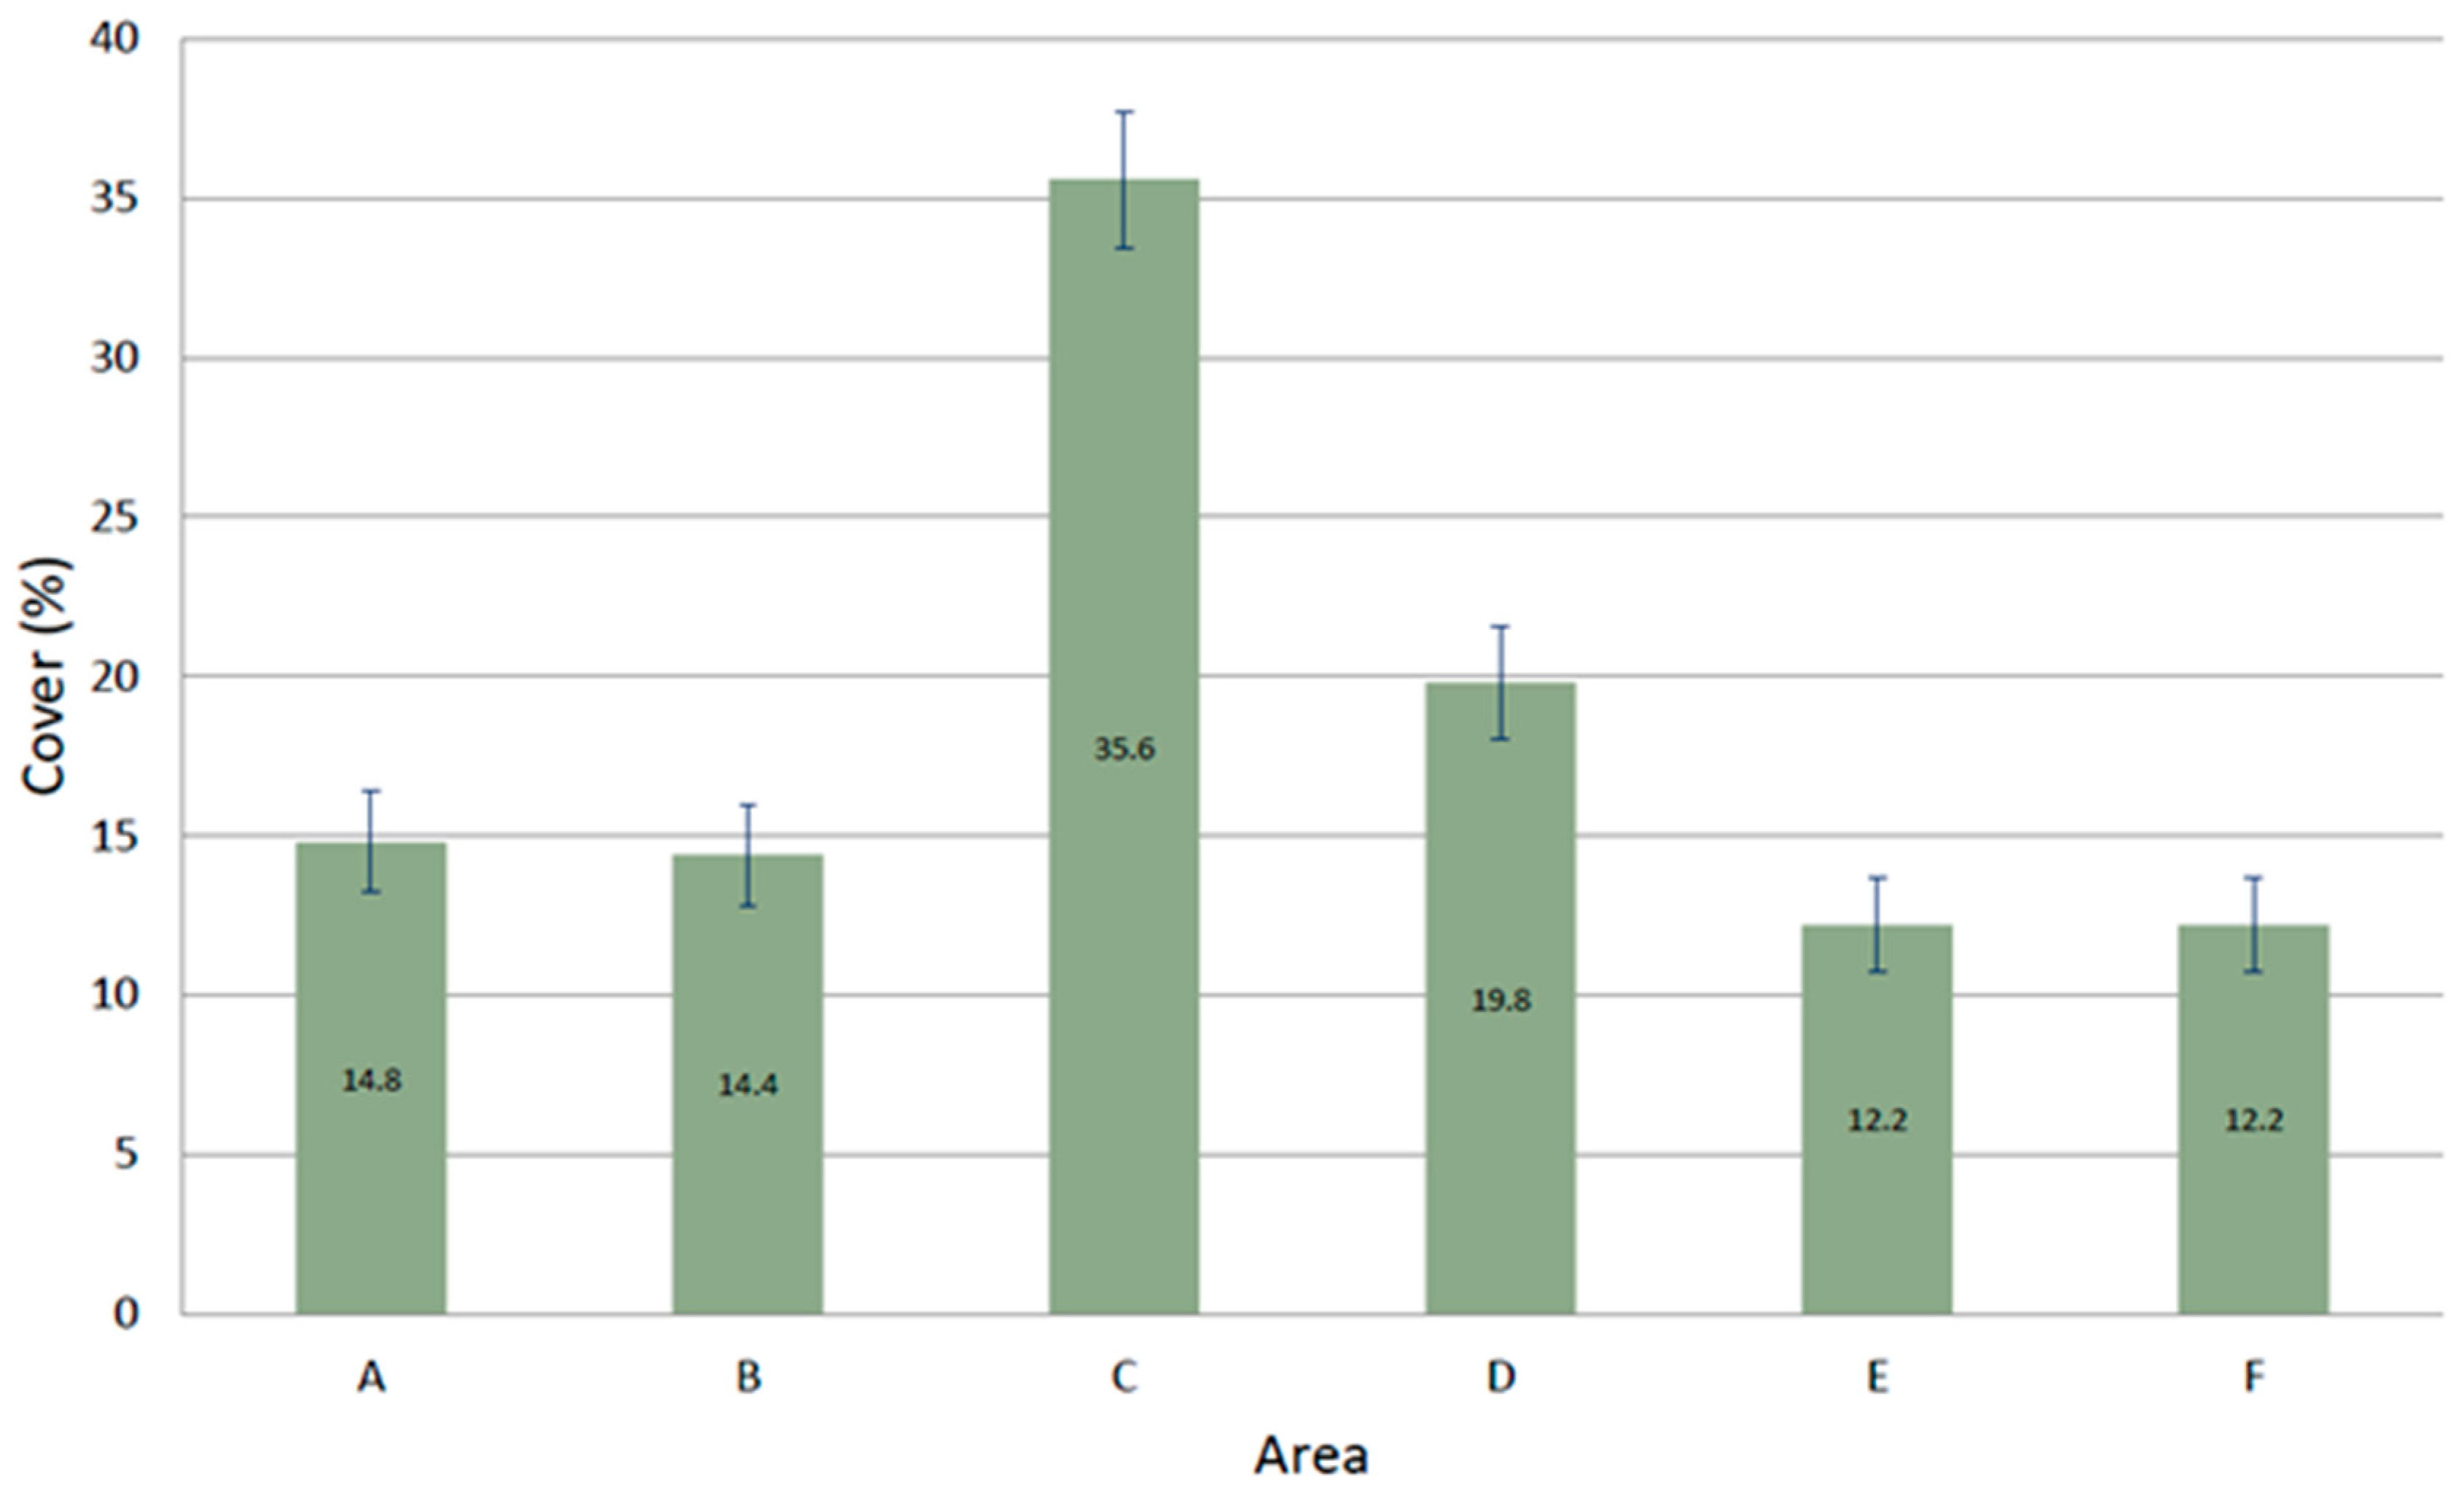
3.1. Tree Cover Results Using i-Tree Canopy

The percentage of tree cover in the six areas are given in Figure 2. Area E and F have the lowest coverage of 12.2 ± 1.46%, while the range of tree cover in the six study areas is between 12.2 ± 1.46% and 35.6 ± 2.14%. The lowest value is higher than in a previous study using i-Tree Canopy in Bristol, which found a value of 10% tree cover in the city center in 2018 [51]. This difference is due to the fact that the Bristol Tree Canopy Cover Survey in 2018 [51] assessed each area according to city council wards, e.g., Bristol Central was calculated using the total area of 223.14 ha with a tree canopy of 10.0 ± 1.62% using i-Tree Canopy and a tree canopy of 6.5% using i-Tree Eco. Furthermore, the UK tree cover, in general, was found to be lower than in other European and American cities [52]. Doick et al. [53] suggest that UK towns and cities strive to achieve a 20% tree canopy cover as a minimum standard while towns and cities with at least 20% cover should increase their tree cover by at least 5% within the next 10 to 20 years [53]. Unless supplemented by more comprehensive criteria, the canopy cover targets cannot give a true representation of the structure, health, and function of GI [54].
Studies have suggested that increasing tree canopy may provide more support for mental health [55]. Recently, Marselle et al. [56] found that people with a poor socioeconomic level who lived in an area with a high density of street trees within 100 m of their home had a lower chance of being given antidepressants. In a study conducted by Kondo et al. [57], it was found that a five-percentage-point increase in tree canopy might result in a 302-death decrease every year, worth USD 29 billion in Philadelphia. Moreover, a 10% increase in canopy over the city was linked to a USD 36 billion reduction in mortality. If Philadelphia achieves its objective of raising tree canopy cover to 30% by 2025, 403 premature adult deaths (i.e., 3% of total mortality) might be avoided annually [57]. On the contrary, UK city councils have raised concerns about the possible impact of increased tree cover in urban parks on crime and personal safety, as well as the fact that leaf fall from deciduous trees can obstruct urban run-off drains [58]. Furthermore, while increasing tree cover is associated with better pollution reduction, local-scale trees and forest design, it can also influence local-scale pollution concentrations [59]. In Baltimore, Troy et al. [60] found that a 10% increase in tree canopy was linked to a 12% reduction in crime. These conflicting findings between the American and British indicate a clear policy difference at the local level with different scientific viewpoints used to support their case.

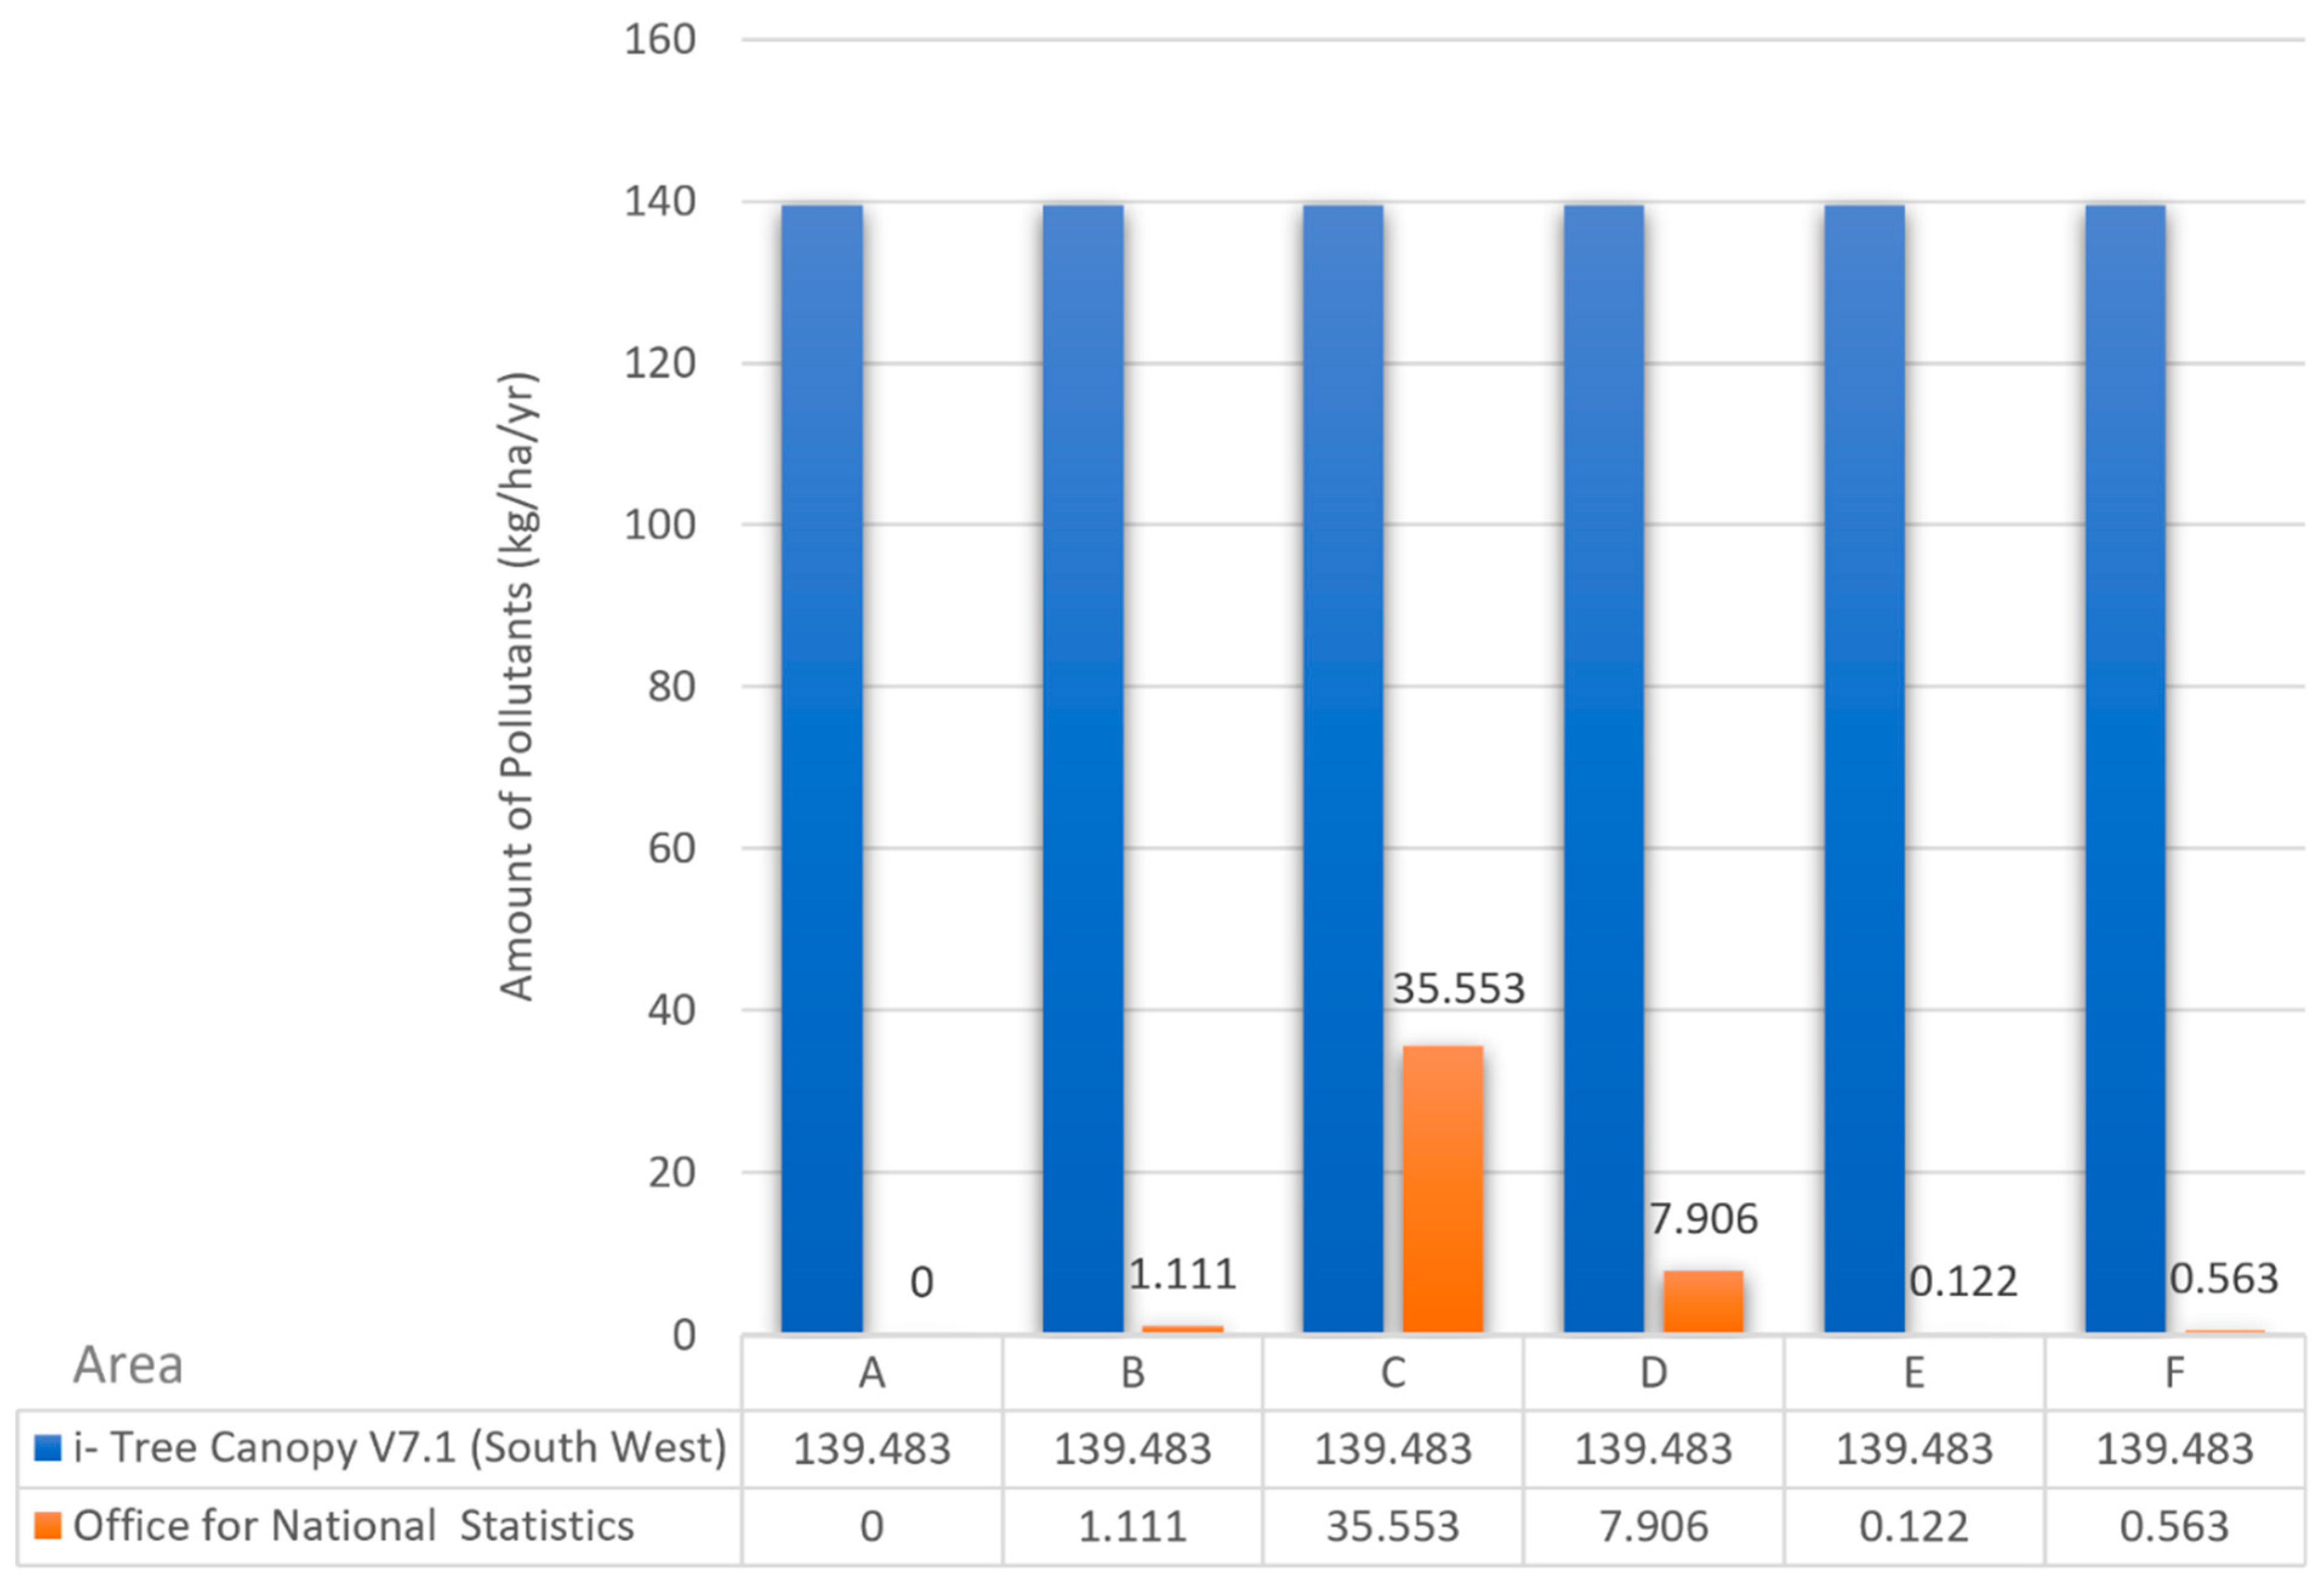
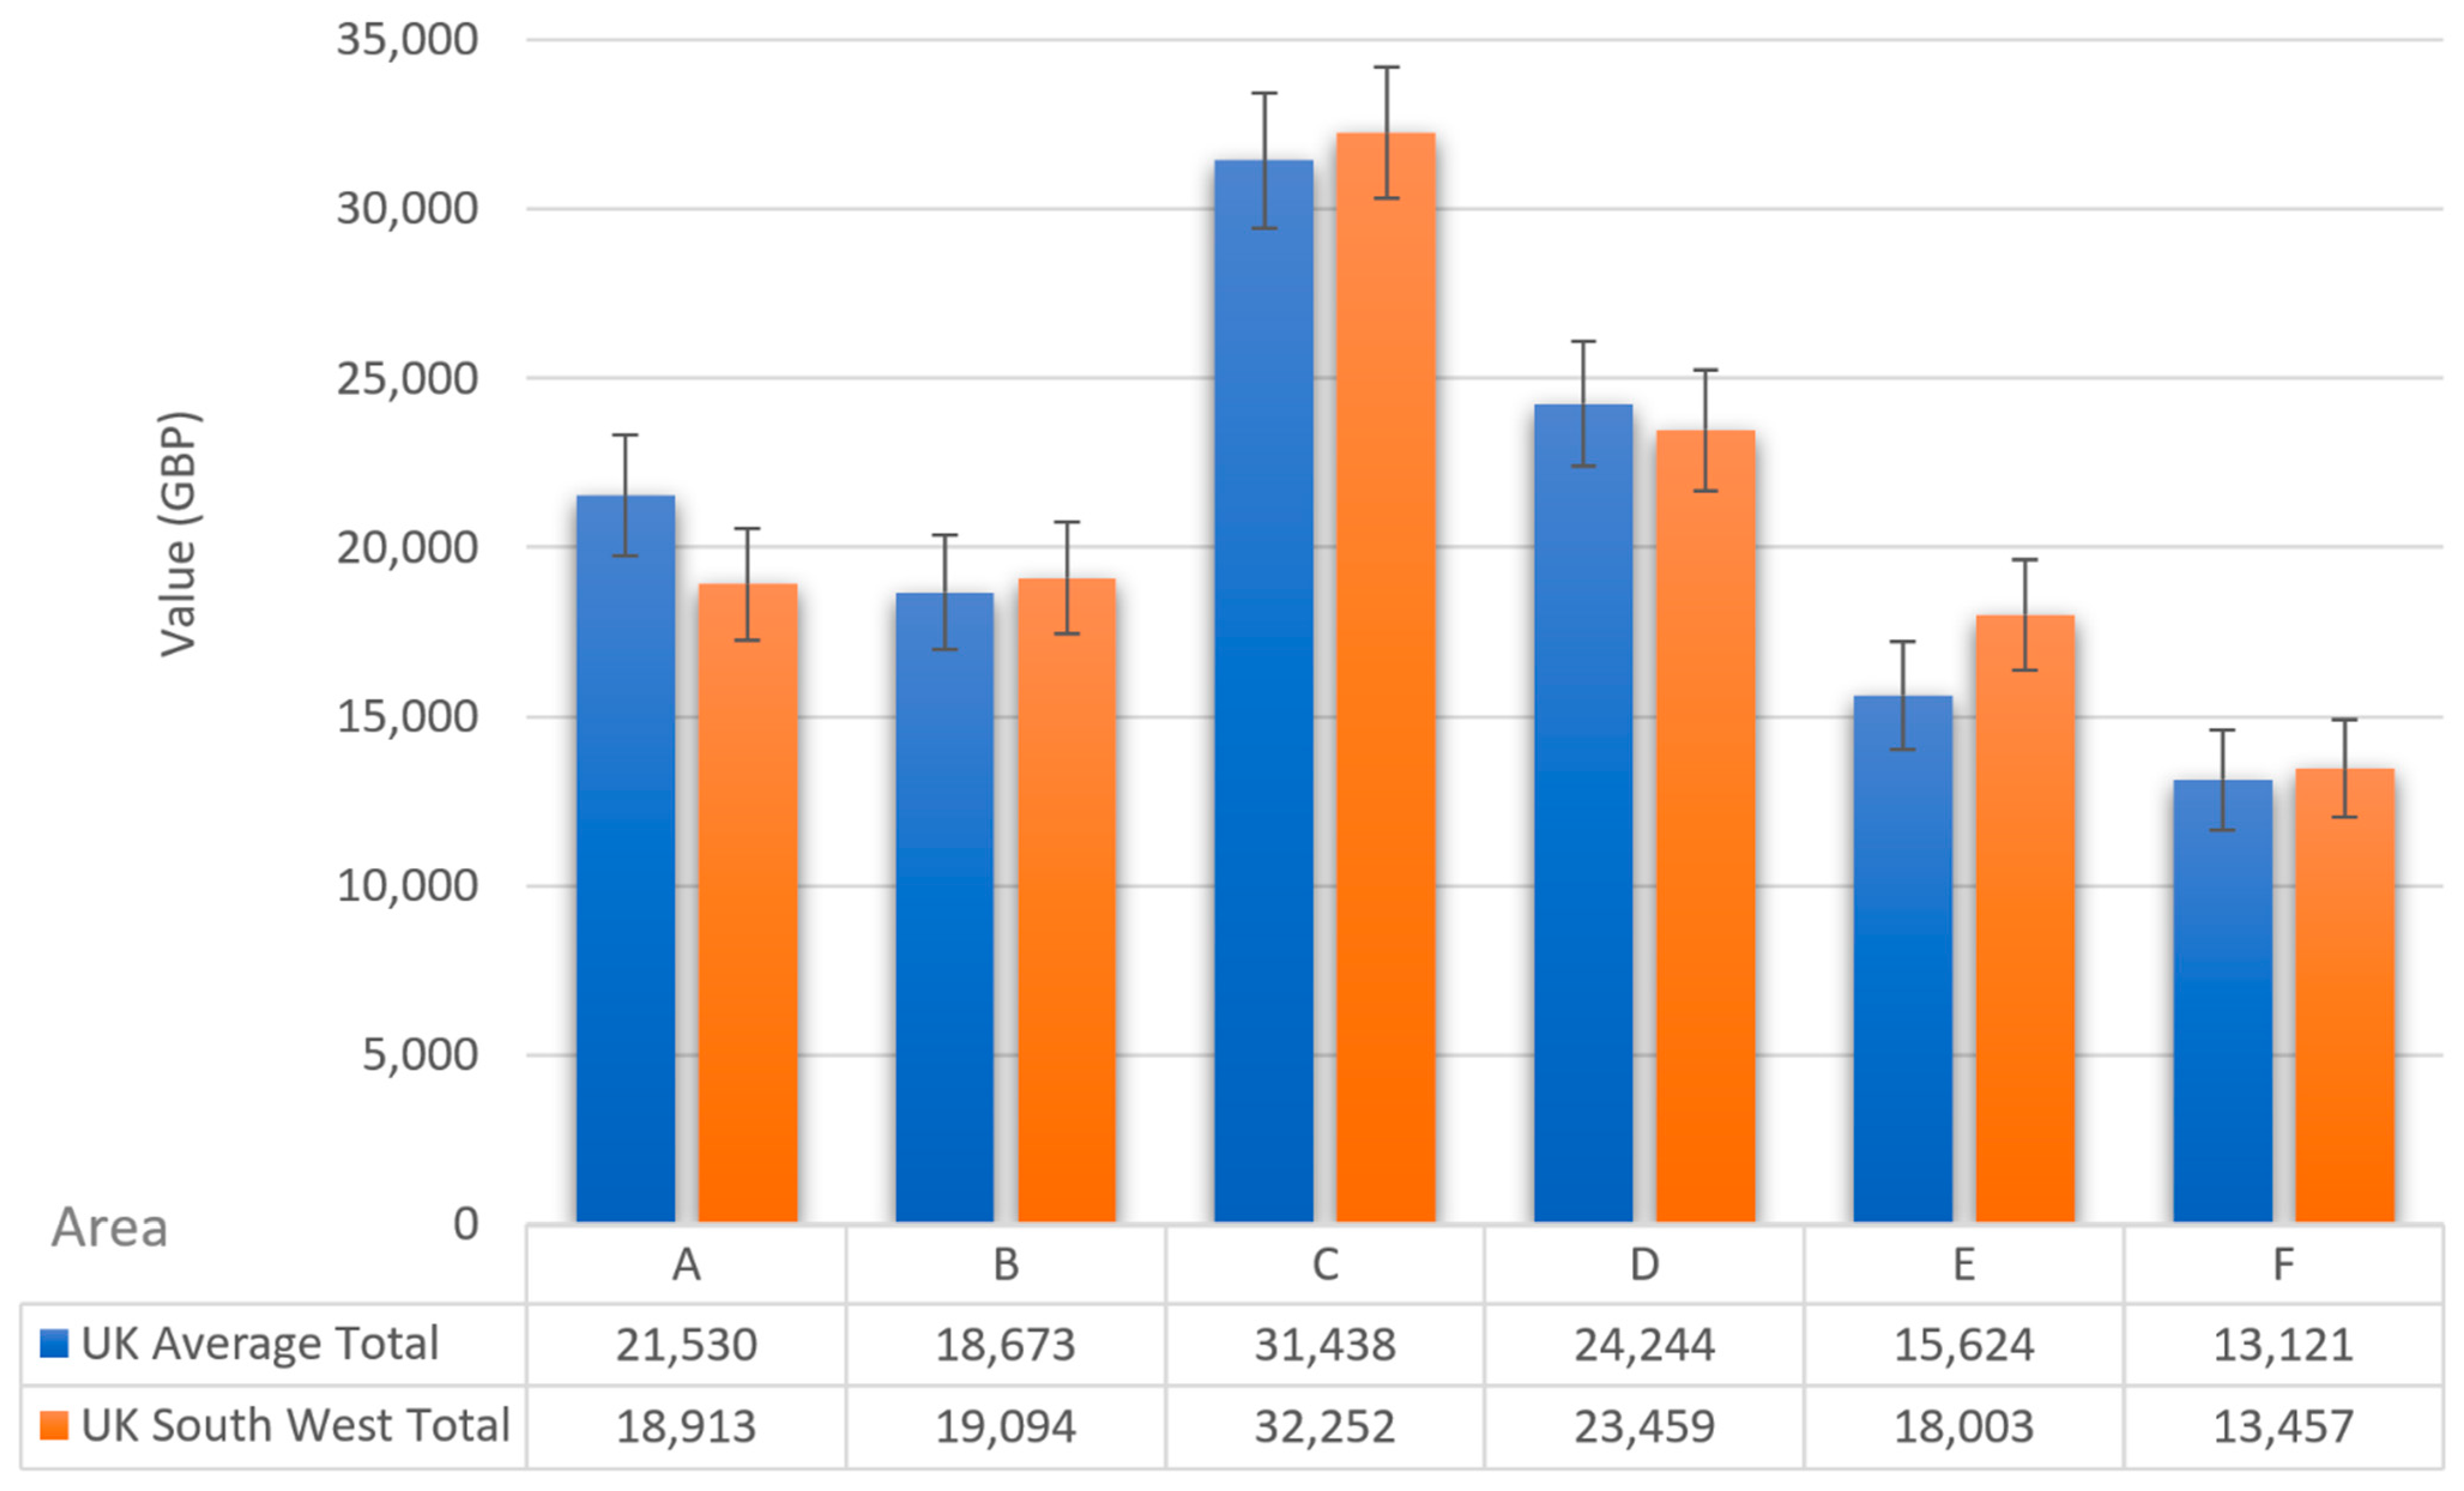
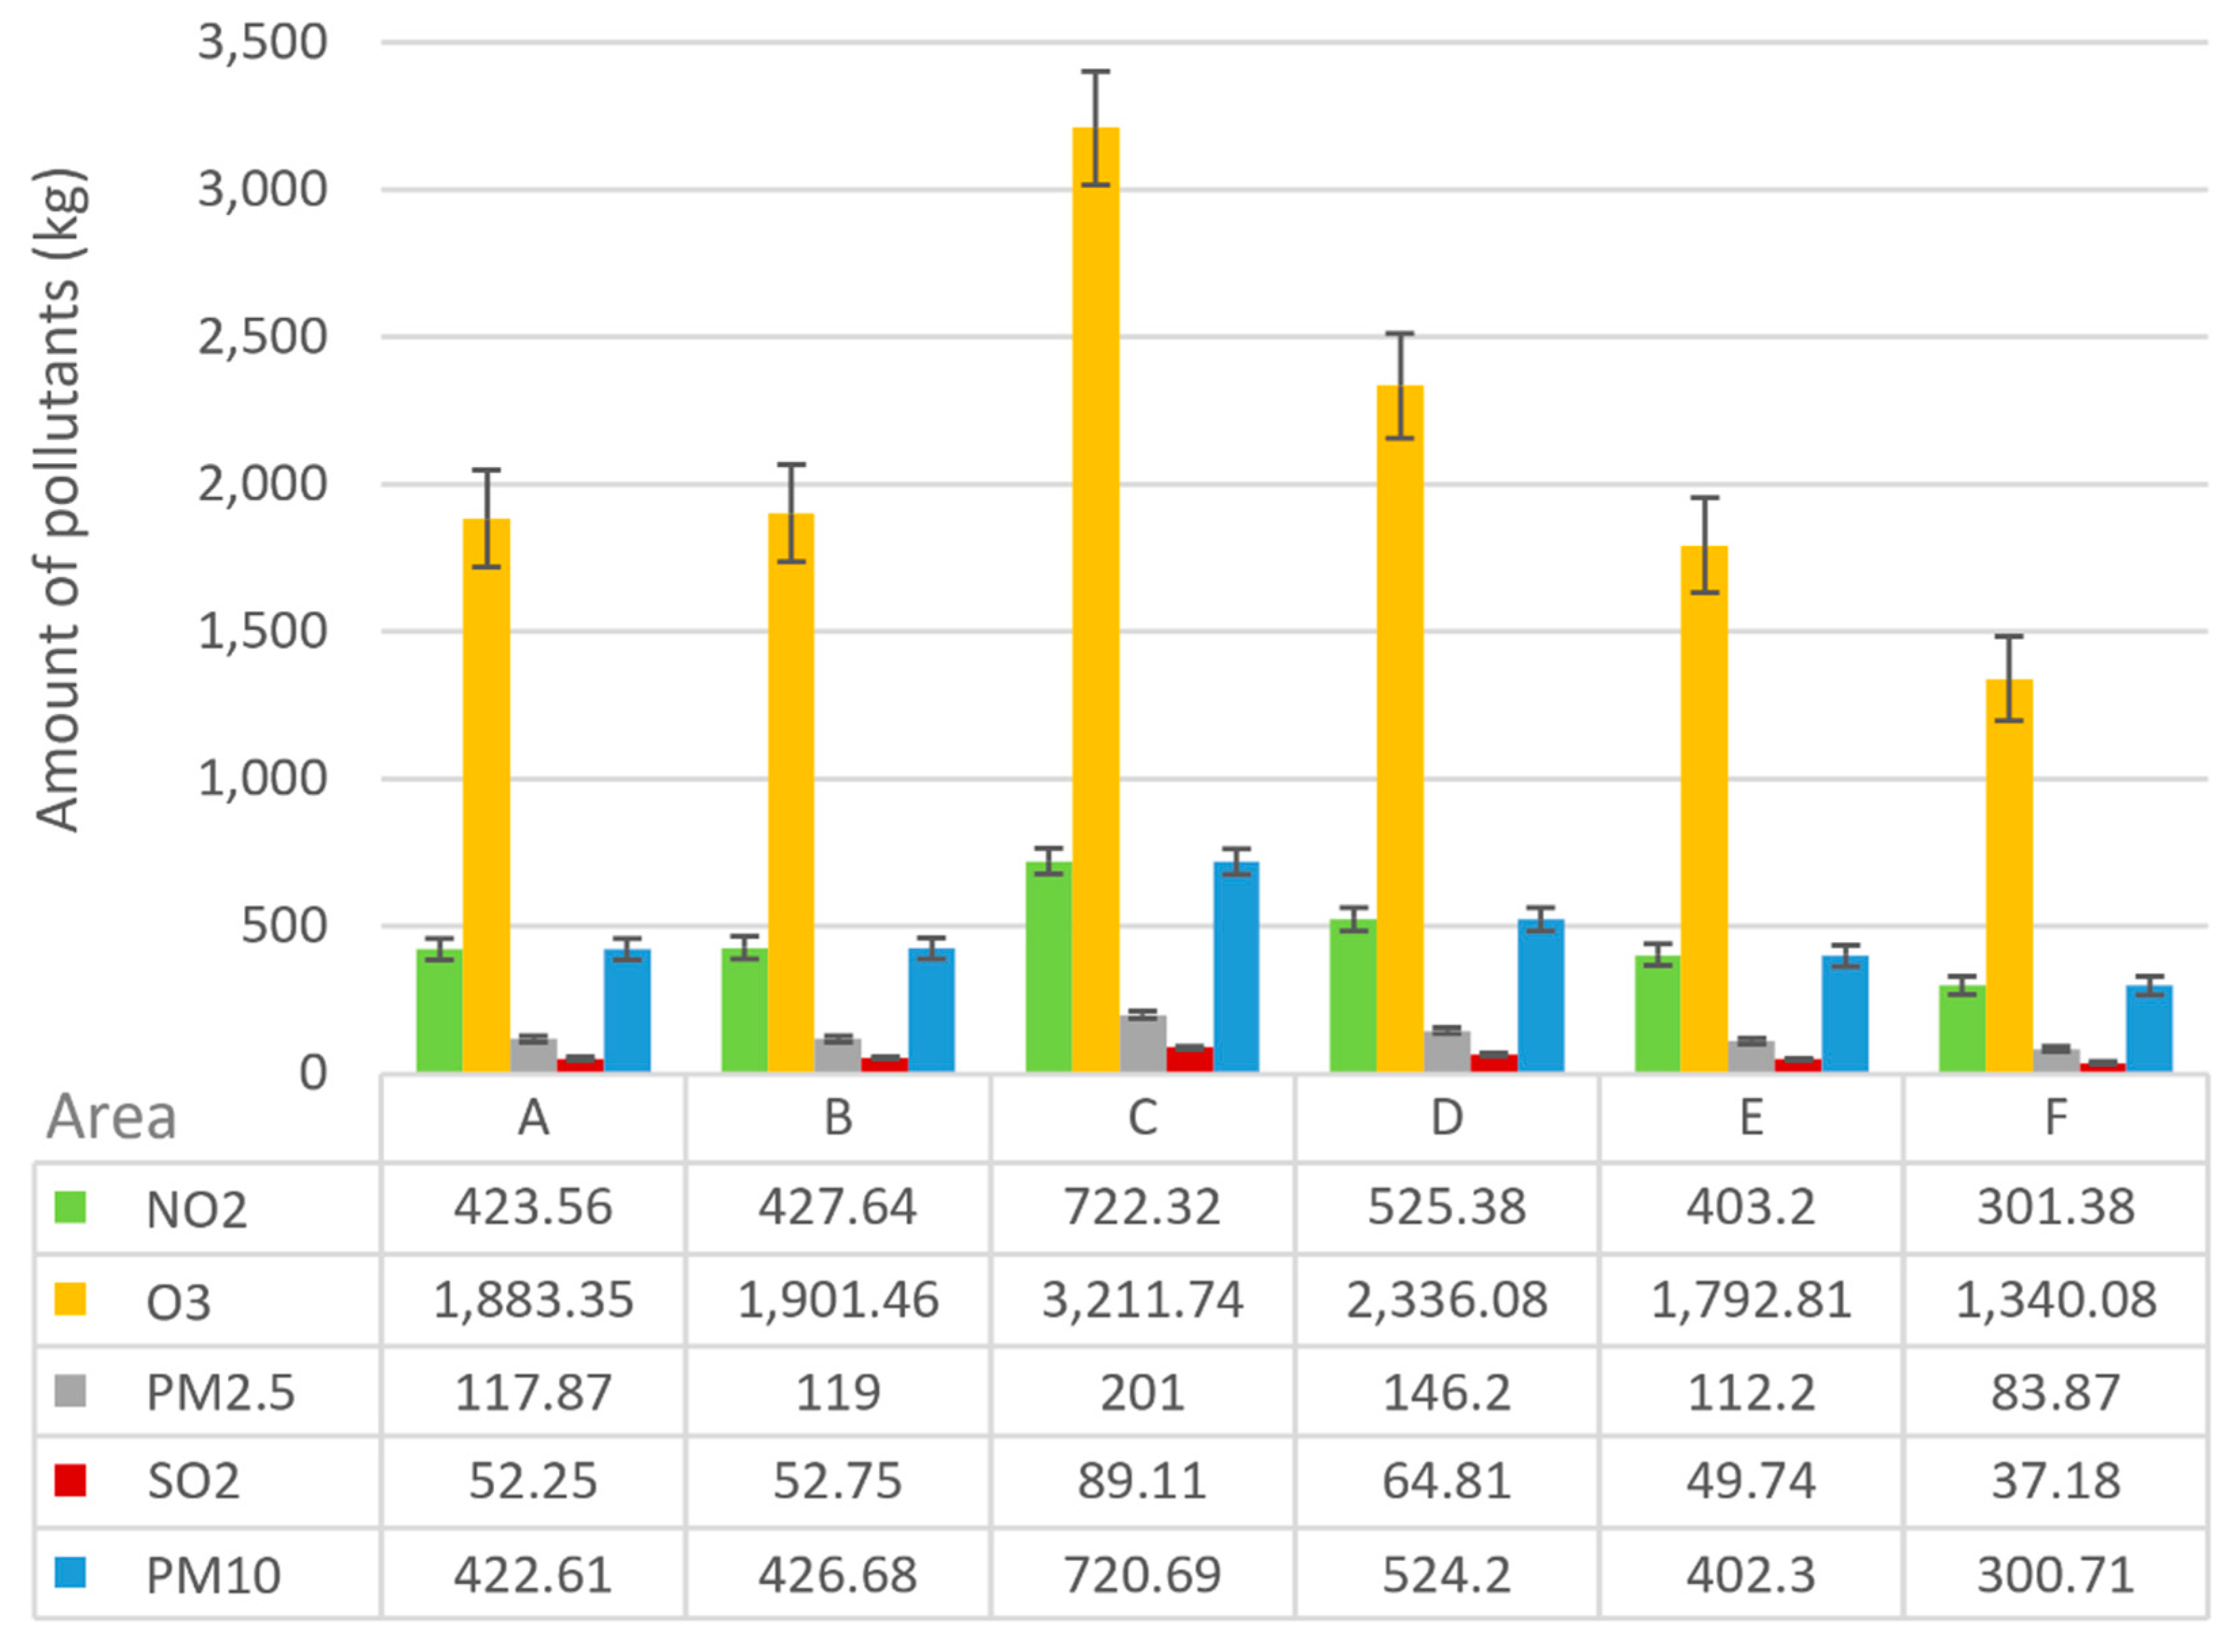
3.2. Air Pollution Removal, Monetary Value, and Tool Evaluation

The range of pollutants removed is between 1006.8 ± 120.79 to 2935.18 ± 129.58 kg using i-Tree Canopy Version 6.1 (i.e., calculated using the US average), while i-Tree Canopy Version 7.1 (i.e., using the UK average data) calculated a reduction between 2231.72 ± 249.68 and 5347.27 ± 341.57 kg. More specifically, at the local level, the results yielded a range between 2063.22 ± 221.29 and 4944.86 ± 298.57 kg (Figure 3). Area C recorded the highest removal of pollutants, which is nearly threefold compared to the lowest in area E and F. The difference between the US and the UK average data is more than double.
Using i-Tree Canopy Version 7.1 with the UK data, the data overestimated the reduction of pollutants in area A and underestimated it in area E by a total of 103 kg when compared to the local South West data. Figure 4 shows a comparison of the total pollutant removal amount between i-Tree Canopy Version 7.1 with the local data and the Office for National Statistics’ findings.
There is a very strong contrast between the results using either tool. Throughout the entire study area, the i-Tree Canopy results recorded a constant value of 139.483 kg/ha/year, while the Office for National Statistics did not record any pollutant removal for area A and near zero for areas B, E, and F. In area C, however, it recorded its highest pollutant removal amount at 35.553 kg/ha/year. Figure 5 shows the amount of each pollutant removed annually using i-Tree Canopy Version 7.1 with local data. Among the five pollutants, O3 had the highest removal amount and NO2 ranged between 301.38 ± 32.34 and 722.32 ± 43.61 kg. In contrast, the Office for National Statics did not estimate any NO2 removal in Areas A and E (Appendix A, Table A1). The Office for National Statistics’ NO2 estimates are significantly lower than those of i-Tree Canopy (i.e., from either version of the software). This outcome can be reasonably interpreted from the EMEP4UK model since, while trees remove NO2 from the atmosphere, natural NO emissions from the soil under trees also exist, and these values balance out to a substantial extent [44]. Our findings are consistent with those of Jones et al. [44] who found that pollutant quantities assessed using the EMEP4UK model are roughly half those found in i-Tree studies. Furthermore, because the Office for National Statistics tool is based on a dynamic model, inhabitants of one area may benefit from pollutants absorbed in neighboring areas due to the nature of the model [43,44]. Additional pilot modeling, outside the purview of this study, can inform possible locations and vegetation parameters to maximize its impact for the least polluted conditions [8]. In the comparison of these results, consideration must be given to the fact that both tools do not consider pollution removal by building integrated vegetation (e.g., green roofs and green walls). In this regard, previous studies have shown that green roofs and green walls are effective to reduce pollution in streets [8]. Green walls, for instance, have been shown to reduce NO2 levels at the street level by up to 40% and PM10 levels by 60%, according to researchers at Lancaster University [61]. It is also acknowledged that the impacts of vegetation on air quality at local scales (e.g., at the street level) are dependent on species composition and can be beneficial or negative. However, both tools were unable to model this level of detail [43,62].
The average monetary value of the Office for National Statistics is GBP 16.19 per person (i.e., the amount saved in healthcare costs) [44]. This result is higher than the UK average of GBP 15.39 per person. The i-Tree Canopy local data recorded a range between GBP 13,457 ± 1444 and GBP 32,252 ± 1948. Figure 6 shows the monetary value using i-Tree Canopy Version 7.1 with the UK average data and local data. There is a difference of GBP 2617 in area A while in area F it is only GBP 336 due to a lower tree canopy. The monetary values calculated using i-Tree Canopy Version 6.1 (i.e., using US average data) ranged from GBP 5486.59 ± 658.25 in area E and GBP 16,009.96 ± 962.99 in area C. However, these figures were estimated using the United States Environmental Protection Agency’s BenMAP, which assesses the incidence of adverse health impacts and related monetary values caused by changes in NO2, O3, PM2.5, and SO2 concentrations [49]. Therefore, urban values were approximated using the national median externality values from the United States [49]. Contrarywise, i-Tree Canopy Version 7.1 as well as i-Tree Eco have been implemented using appropriate official values from the UK [63].
For the monetary values provided by GI, the two tools (i.e., i-Tree Canopy and the Office for National Statistics) offer a distinct benefit—differing valuation approaches [46]. The researchers from the Centre for Ecology and Hydrology calculate the health benefit from a change in air pollutant concentrations, whereas the i-Tree tools calculate damage costs per tonne of pollutant emitted [46]. The monetary value from the Office for National Statistics considers the costs of avoided health damage to people—i.e., the greater the number of people who benefit from pollution removal, the higher the value [43]. As a result, population density plays a significant role in final valuation. Moreover, the Office for National Statistics calculates avoided damage costs caused by NH3 and PM10 within the parameters of PM2.5, as this includes the aerosol fraction derived from NH3 and PM2.5 as the riskiest (albeit bottom end) component of PM10 [43]. As such, these assumptions make it difficult to compare the two tools. The comparison between the UK and the United States toolsets is further complicated by differences in the pollution levels of specific chemicals. This includes the degree of segregation between emission zones, forests, and receptor regions [46].
One key difference between the two tools is the i-Tree Canopy software allows researchers to define the project area at the beginning of the survey, while the Office for National Statistics just allows researchers to enter the postcode to look for the study area and they provide the kilograms of the pollutant removed per km2. The precision of the result from i-Tree Canopy is based on researchers properly classifying each point into the correct cover type [62]. When the number of points augments, the accuracy of the survey increases. On the other hand, if insufficient points are input into the survey, SE increases. As stated in Section 2.3, 500 points were input into each area, i.e., within the suggested bounds of a proper i-Tree Canopy survey [62]. It is safe to suggest that some of the Google imagery provided when piecing together the survey may be of poor image resolution and may affect the decision of researchers during the input stage of the work [62].

3.3. Planting Strategies

In our study, we were only able to identify potential areas for future tree planting by combining the i-Tree Canopy and the Office for National Statistics results, using Google Maps as well as an online tree inventory (i.e., found at: https://bristoltrees.space/Locate/?latitude=51.47709&longitude=-2.58780, accessed on 3 June 2021). For example, to aid with the Office for National Statistics calculation for the postcode BS1-2 (i.e., area A where it recorded zero pollutant removal), city managers could think to increase the tree canopy as illustrated in Figure 7. However, both tools do not provide any information about soil and root space as they are not mainly designed for tree planting strategies. While the i-Tree Canopy’s planar cover is valuable, it leaves the very essential vertical dimension unbound, and neither stem count nor tree-crown cover locates GI in the urban canyon three-dimensionally [10]. Several modeling studies reported that dense high-level canopy vegetation can lead to increased pollution concentrations inside street canyons by reducing turbulence, mi xing fresh air with polluted air, and trapping pollution at ground level [64,65,66,67]. As a result, it is important to consider tree interaction with local meteorological conditions and building arrangements in street canyons [65].
It should also be noted that both tools do not provide information about species. However, species selection tools are available via i-Tree Species software which was created to assist urban foresters in choosing the best tree species for their needs (e.g., species’ potential environmental services and geographic location). Using this additional toolset, users rank the importance of each desired environmental function provided by trees and the tool estimates the appropriateness of the tree species based on weighted environmental advantages of tree species at maturity [50]. In addition, a tree selection guide is available online which provides nearly 300 potential species for GI [68]. Both tools do not design or integrate tree planting applications; however, the i-Tree suite contains i-Tree Design and i-Tree Planting, but these only function in North America. In particular, i-Tree Planting is an online tool that calculates the long-term environmental benefits of a tree-planting project with a variety of trees and species. Its methods are based on the i-Tree Design and i-Tree Forecast tools [30]. Future research could develop a similar tool for Europe or a geographic information system (GIS)-like tool similar to the one developed by Wu et al. [69] that identifies suitable tree-planting locations by simulating the planting of large, medium, and small trees on plantable areas, with large trees taking precedence because they are projected to provide considerable benefits.
The suitability of each plant for each location, including tolerance of relevant stress and projected growth form, must be carefully considered when implementing robust and effective GI [67]. Lack of growth space, poor soil quality, light heterogeneity, pollutants, diseases, and conflicts with human activities, constructions, and pavements are all key issues for vegetation and green spaces in compact cities like Bristol City Centre [70]. If trees are well-managed and the correct trees are planted in the right areas, the ecosystem services they provide can greatly exceed the disservices, contributing to a city’s or town’s long-term sustainability and livability [71]. Tree initiatives should include recommendations on how to make public trees more resilient (e.g., promoting a broader species choice for public areas and ways to achieve greater size diversification) [71]. Recognizing that the potential for improving air quality through urban vegetation is limited, one important limitation to mitigating current air quality problems through vegetation is that the most polluted areas of cities have very limited space for planting, greatly limiting the potential for mitigation using these methods [72]. The benefits of an integrated policy that geographically isolates people from major pollution sources as much as possible (i.e., particularly transportation) and uses vegetation between the sources and the urban population are maximized [72].

4. Conclusions and Recommendations

Many developed nations are beginning to reduce pollution emissions and deposition through successful environmental policies [73,74,75]. At the same time, cities are implementing strategies to tackle air pollution; e.g., large scale urban afforestation projects are becoming more popular as a strategy to improve urban sustainability and human health [76]. In order to design and plan sustainable cities, landscape architects and urban planners need accurate metrics and indicators. In this communication, we have illustrated two free user-friendly online tools (i.e., the Office for National Statistics and i-Tree Canopy) using Bristol City Centre as an example. We found both tools are easy to use and communicate ecosystem services and monetary values. However, they produce different results due to the different methods that the tools incorporate. Our findings are in accordance with the conclusions of Timilsina et al. [77], who reported that the disparity in predictions by general models or average data have an impact on the estimation of ecosystem services. We also discussed the use of these tools for future tree planting strategies. According to Keith Sacre, co-founder of Treeconomics, the tree planting process should be strategized into several elements: “(1) creating a vision: what is wanted? (based on ‘What is there now?’); (2) setting targets which are achievable and deliverable; (3) creating an action plan, comprising: where to plant, what to plant, how to plant, and what is needed to maintain?; and (4) monitoring and reviewing progress” [78]. This approach would potentially allow for “realistic and achievable targets to be set [and] suitable species to be selected” [78].
In terms of a key strength of the i-Tree Canopy tool, it allows users to simply photo-interpret Google aerial images to obtain statistically valid estimates of tree and other cover types, as well as evaluations of their uncertainty [30]. Random point sampling approaches such as i-Tree Canopy have the benefit of openly available data and software that may be used by a wide range of people [79]. Users of any random point sampling method, on the other hand, should be cognizant of the uncertainties involved with any urban tree cover estimate, especially if it is being used to track change [79]. i-Tree Canopy, as such, calculates several ecosystem services, e.g., avoided runoff, carbon storage and sequestration, and air pollutants removal; however, European users should be aware that i-Tree Canopy benefits (i.e., ecosystem services and monetary values) from selected locations are available only in Sweden and the UK. Using the i-Tree suite software, one can identify landscape features to predict other phenomena as well, e.g., wood tick presence [80]. Future research could explore the use of i-Tree Canopy to map edible green infrastructure as well as urban food provisioning ecosystem services [81]. The Office for National Statistics tool, on the other hand, provides meaningful urban metrics that highlight the linkages between GI and health which can improve health impacts through urban policies [82]. The Office for National Statistics website formulates its research from inputting postcodes and working from the preset-2015 dataset. The use of postcodes is a standard that many epidemiological studies utilize when pinpointing or narrowing in on specific phenomena (e.g., pollutants) [83,84,85]. This, in turn, parallels the tool’s parameter structure and offers the prospect of measuring other performance or production elements via overlaid GIS. As an extension, we recommend the use of locals models for ecosystem services assessments [77]. Therefore, the Office for National Statistics uses landcover maps that are more appropriate for analyzing ecosystem services at the regional scale rather than the local scale since maps with limited resolution are unreliable for local studies unless additional data or fine-adjustments are supplied [86,87].
At length, both tools are excellent online resources which are easy to use, require little to no expert knowledge, and parallel a bottom-up concept, i.e., they are simplistic, fast, and trackable. A key difference, however, is that the i-Tree Canopy software specifically takes into account only tree (i.e., green) coverage while the Office for National Statistics considers the total environment (e.g., water, vegetation, etc.). This methodological difference would explain much of the discrepancy in results since Bristol is situated on the River Avon and water is considered a negative value in the Office for National Statistics methodology. However, results must be validated by fieldwork so future research could compare both tools using a stratified sample according to a rural-urban gradient [88,89,90]. Further case research would aid in better explaining if the toolsets could be integrated somehow (e.g., GIS) and if GI strategy can reliably be sought after if vast differences are present. Nonetheless, when factoring in an urban sustainable vision of designing green, urban-friendly cities, an uncertainty analysis should become a formal practice and necessary component of any modeling exercises, especially for models which aim to support “model transparency, model development, effective communication of model output, […] decision-making” [91] and policy formation. To further improve or develop new tools, researchers should also account for ecosystem disservices in order to assess the net benefits of GI [92,93]. To conclude, the results of this communication have updated the literature on the evaluation of GI tools in the UK [34] as well as provide a basis for the future development of a comprehensive online design tool that is site-specific for GI strategy and for the assessment of urban ecosystem services in Europe.

Author Contributions

Conceptualization, software, investigation, resources, data curation, writing—original draft preparation, methodology, validation, formal analysis, A.R. and W.T.C.; writing—review and editing, A.R. and G.T.C.; supervision, project administration, funding acquisition, A.R. All authors have read and agreed to the published version of the manuscript.

Funding

This research received no external funding.

Institutional Review Board Statement

Not applicable.

Informed Consent Statement

Not applicable.

Data Availability Statement

All datasets are available from the corresponding author on reasonable request.

Acknowledgments

The authors would like to thank the i-Tree team for clarification about the i-Tree model in the UK.

Conflicts of Interest

The authors declare no conflict of interest.

Appendix A

Table A1. Amount of each pollutant removed by trees using i-Tree Canopy Version 7.1 and Version 6.1 (kg), and the amount of each pollutant removed by blue and green infrastructure (i.e., urban trees and woodland, urban grassland, and urban water) using the Office for National Statistics (kg/km2).
AreaABCDEF
NO2i- Tree Canopy Version 7.1 UK 685.52594.521000.97771.93497.45417.76
i-Tree Canopy Version 6.1 US103.48100.68248.9138.4385.385.3
i-Tree Canopy Version 7.1 UK South West 423.56427.64722.32525.38403.2301.38
Office for National Statistics09.6238.749.504.8
O3i- Tree Canopy Version 7.1 UK 2304.311998.433364.692594.771672.161404.28
i-Tree Canopy Version 6.1 US799.32777.7219201070658.9658.9
i-Tree Canopy Version 7.1 UK South West 1883.351901.463211.742336.081792.811340.08
Office for National Statistics0882685.8526.5−8.843.5
PM2.5i- Tree Canopy Version 7.1 UK 116.54101.07170.17131.2384.5771.02
i-Tree Canopy Version 6.1 US40.8339.7398.2254.6333.6633.66
i-Tree Canopy Version 7.1 UK South West 117.87119201146.2112.283.87
Office for National Statistics00.512534.6−3.60.1
PM10i- Tree Canopy Version 7.1 UK 465.23403.48679.32523.88337.6283.52
i-Tree Canopy Version 6.1 US226.86220.73545.7303.51187.01187.01
i-Tree Canopy Version 7.1 UK South West 422.61426.68720.69524.2402.3300.71
Office for National Statistics00.7193.955.5−4.30.1
SO2i- Tree Canopy Version 7.1 UK 90.4878.47132.12101.8965.6655.14
i-Tree Canopy Version 6.1 US50.8749.49122.3668.0541.9341.93
i-Tree Canopy Version 7.1 UK South West 52.2552.7589.1164.8149.7437.18
Office for National Statistics012.3311.9124.528.97.8

References

  1. Ritchie, H.; Roser, M. Outdoor Air Pollution. Available online: https://ourworldindata.org/outdoor-air-pollution (accessed on 20 June 2021).
  2. Yim, S.H.L.; Fung, J.C.H.; Lau, A.K.H.; Kot, S.C. Air ventilation impacts of the “wall effect” resulting from the alignment of high-rise buildings. Atmos. Environ. 2009, 43, 4982–4994. [Google Scholar] [CrossRef]
  3. Li, Z.; Zhou, Y.; Wan, B.; Chen, Q.; Huang, B.; Cui, Y.; Chung, H. The impact of urbanization on air stagnation: Shenzhen as case study. Sci. Total Environ. 2019, 664, 347–362. [Google Scholar] [CrossRef]
  4. Śmiełowska, M.; Marć, M.; Zabiegała, B. Indoor air quality in public utility environments—A review. Environ. Sci. Pollut. Res. 2017, 24, 11166–11176. [Google Scholar] [CrossRef] [Green Version]
  5. Peters, A.; Dockery, D.W.; Muller, J.E.; Mittleman, M.A. Increased Particulate Air Pollution and the Triggering of Myocardial Infarction. Circulation 2001, 103, 2810–2815. [Google Scholar] [CrossRef] [Green Version]
  6. WHO World Health Assembly Closes, Passing Resolutions on Air Pollution and Epilepsy. Available online: https://apps.who.int/mediacentre/news/releases/2015/wha-26-may-2015/en/index.html (accessed on 15 July 2021).
  7. Royal College of Physicians. Every Breath We Take: The Lifelong Impact of Air Pollution; Royal College of Physicians: London, UK, 2016. [Google Scholar]
  8. Abhijith, K.V.; Kumar, P.; Gallagher, J.; McNabola, A.; Baldauf, R.; Pilla, F.; Broderick, B.; Di Sabatino, S.; Pulvirenti, B. Air pollution abatement performances of green infrastructure in open road and built-up street canyon environments—A review. Atmos. Environ. 2017, 162, 71–86. [Google Scholar] [CrossRef]
  9. Kumar, P.; Druckman, A.; Gallagher, J.; Gatersleben, B.; Allison, S.; Eisenman, T.S.; Hoang, U.; Hama, S.; Tiwari, A.; Sharma, A.; et al. The nexus between air pollution, green infrastructure and human health. Environ. Int. 2019, 133, 105181. [Google Scholar] [CrossRef]
  10. Hewitt, C.N.; Ashworth, K.; MacKenzie, A.R. Using green infrastructure to improve urban air quality (GI4AQ). Ambio 2020, 49, 62–73. [Google Scholar] [CrossRef] [PubMed] [Green Version]
  11. Russo, A.; Cirella, G.T. Urban Sustainability: Integrating Ecology in City Design and Planning. In Sustainable Human–Nature Relations: Environmental Scholarship, Economic Evaluation, Urban Strategies; Cirella, G.T., Ed.; Springer: Singapore, 2020; pp. 187–204. [Google Scholar]
  12. Jim, C.Y.; Chen, W.Y. Assessing the ecosystem service of air pollutant removal by urban trees in Guangzhou (China). J. Environ. Manag. 2008, 88, 665–676. [Google Scholar] [CrossRef]
  13. Cavanagh, J.-A.E.; Zawar-Reza, P.; Wilson, J.G. Spatial attenuation of ambient particulate matter air pollution within an urbanised native forest patch. Urban For. Urban Green. 2009, 8, 21–30. [Google Scholar] [CrossRef]
  14. Dadea, C.; Russo, A.; Tagliavini, M.; Mimmo, T.; Zerbe, S. Tree Species as Tools for Biomonitoring and Phytoremediation in Urban Environments: A Review with Special Regard to Heavy Metals. Arboric. Urban For. 2017, 43, 155–167. [Google Scholar]
  15. Brancalion, P.H.S.; Holl, K.D. Guidance for successful tree planting initiatives. J. Appl. Ecol. 2020, 57, 2349–2361. [Google Scholar] [CrossRef]
  16. Pynnönen, S.; Haltia, E.; Hujala, T. Digital forest information platform as service innovation: Finnish Metsaan.fi service use, users and utilisation. For. Policy Econ. 2021, 125, 102404. [Google Scholar] [CrossRef]
  17. Jones, B.A. Planting urban trees to improve quality of life? The life satisfaction impacts of urban afforestation. For. Policy Econ. 2021, 125, 102408. [Google Scholar] [CrossRef]
  18. TDAG. Trees in the Townscape: A Guide for Decision Makers; Trees and Design Action Group: London, UK, 2012. [Google Scholar]
  19. Mullaney, J.; Lucke, T.; Trueman, S.J. A review of benefits and challenges in growing street trees in paved urban environments. Landsc. Urban Plan. 2015, 134, 157–166. [Google Scholar] [CrossRef]
  20. Bodnaruk, E.W.; Kroll, C.N.; Yang, Y.; Hirabayashi, S.; Nowak, D.J.; Endreny, T.A. Where to plant urban trees? A spatially explicit methodology to explore ecosystem service tradeoffs. Landsc. Urban Plan. 2017, 157, 457–467. [Google Scholar] [CrossRef] [Green Version]
  21. Urban, J. Up by Roots; ISA: New York, NY, USA, 2008; ISBN 1881956652. [Google Scholar]
  22. Jerome, G.; Sinnett, D.; Burgess, S.; Calvert, T.; Mortlock, R. A framework for assessing the quality of green infrastructure in the built environment in the UK. Urban. For. Urban. Green. 2019, 40, 174–182. [Google Scholar] [CrossRef]
  23. Ellis, J.B. Sustainable surface water management and green infrastructure in UK urban catchment planning. J. Environ. Plan. Manag. 2013, 56, 24–41. [Google Scholar] [CrossRef]
  24. Joint Core Strategy. Green Infrastructure Strategy; Joint Core Strategy: Gloucester, UK, 2014.
  25. Natural England. Green Infrastructure Strategies: An Introduction for Local Authorities and Their Partners; Natural England: London, UK, 2008.
  26. Russo, A.; Escobedo, F.J.; Timilsina, N.; Schmitt, A.O.; Varela, S.; Zerbe, S. Assessing urban tree carbon storage and sequestration in Bolzano, Italy. Int. J. Biodivers. Sci. Ecosyst. Serv. Manag. 2014, 10, 54–70. [Google Scholar] [CrossRef]
  27. Daily, G.; Polasky, S.; Goldstein, J.; Kareiva, P.; Mooney, H. Ecosystem services in decision making: Time to deliver. Front. Ecol. Environ. 2009, 7, 21–28. [Google Scholar] [CrossRef] [Green Version]
  28. Villa, F.; Bagstad, K.J.; Voigt, B.; Johnson, G.W.; Portela, R.; Honzák, M.; Batker, D. A Methodology for Adaptable and Robust Ecosystem Services Assessment. PLoS ONE 2014, 9, e91001. [Google Scholar] [CrossRef]
  29. Brown, M.E.; McGroddy, M.; Spence, C.; Flake, L.; Sarfraz, A.; Nowak, D.J.; Milesi, C. Modeling the Ecosystem Services Provided by Trees in Urban Ecosystems: Using Biome-BGC to Improve i-Tree Eco; NASA: Washington, DC, USA, 2012.
  30. Nowak, D.J. Understanding i-Tree: Summary of Programs and Methods; General Technical Report NRS-200; Northern Research Station, Forest Service, Department of Agriculture: Madison, WI, USA, 2020; 100p, [plus 14 appendices].
  31. Roy, S.; Byrne, J.; Pickering, C. A systematic quantitative review of urban tree benefits, costs, and assessment methods across cities in different climatic zones. Urban For. Urban Green. 2012, 11, 351–363. [Google Scholar] [CrossRef] [Green Version]
  32. Rogers, K.; Hansford, D.; Sunderland, T.; Brunt, A.; Coish, N. Measuring the ecosystem services of Torbay’s trees: The Torbay i-Tree Eco pilot project. In Proceedings of the Urban Trees Research Conference, London, UK, 26–27 July 2021; Forestry Commission: Edinburgh, UK, 2011; pp. 18–26. [Google Scholar]
  33. Raum, S.; Hand, K.L.; Hall, C.; Edwards, D.M.; O’Brien, L.; Doick, K.J. Achieving impact from ecosystem assessment and valuation of urban greenspace: The case of i-Tree Eco in Great Britain. Landsc. Urban Plan. 2019, 190, 103590. [Google Scholar] [CrossRef]
  34. Natural England. Green Infrastructure—Valuation Tools Assessment; Natural England: Exeter, UK, 2013.
  35. Greater London Authority. A Natural Capital Account for Public Green Space in London: How It Can Shape Future Policy and Decision-Making. Available online: https://www.london.gov.uk/sites/default/files/nca_supplementary_document.pdf (accessed on 14 July 2021).
  36. UK Government. The England Trees Action Plan. 2021–2024; UK Government: London, UK, 2021.
  37. Pincetl, S.; Gillespie, T.; Pataki, D.E.; Saatchi, S.; Saphores, J.-D. Urban tree planting programs, function or fashion? Los Angeles and urban tree planting campaigns. GeoJournal 2013, 78, 475–493. [Google Scholar] [CrossRef]
  38. Bristol City Council. The Population of Bristol; Bristol City Council: Bristol, UK, 2019.
  39. Climate Action. Friends of the Earth Bristol’s One City Plan to Create an Urban Forest. 2021. Available online: https://takeclimateaction.uk/solutions/bristols-one-city-plan-create-urban-forest (accessed on 1 June 2021).
  40. Consultants Air Quality. Health Impacts of Air Pollution; Consultants Air Quality: Bristol, UK, 2017. [Google Scholar]
  41. Chan, W.T. The Benefit of Green Infrastructure on Air Quality in Bristol; University of Gloucestershire: Cheltenham, UK, 2019. [Google Scholar]
  42. Garrett, J.; Connett, J. Campaigners Accuse Marvin Rees of Not Protecting Bristol’s Mature Trees. Available online: https://thebristolcable.org/2021/02/campaigners-accuse-marvin-rees-of-putting-housing-above-climate-by-not-protecting-bristols-mature-trees/ (accessed on 14 July 2021).
  43. Office for National Statistics UK Air Pollution Removal: How Much Pollution Does Vegetation Remove in Your Area? Available online: https://www.ons.gov.uk/economy/environmentalaccounts/articles/ukairpollutionremovalhowmuchpollutiondoesvegetationremoveinyourarea/2018-07-30 (accessed on 16 June 2021).
  44. Jones, L.; Vieno, M.; Fitch, A.; Carnell, E.; Steadman, C.; Cryle, P.; Holland, M.; Nemitz, E.; Morton, D.; Hall, J.; et al. Urban natural capital accounts: Developing a novel approach to quantify air pollution removal by vegetation. J. Environ. Econ. Policy 2019, 8, 413–428. [Google Scholar] [CrossRef] [Green Version]
  45. Vieno, M.; Heal, M.R.; Williams, M.L.; Carnell, E.J.; Nemitz, E.; Stedman, J.R.; Reis, S. The sensitivities of emissions reductions for the mitigation of UK PM2.5. Atmos. Chem. Phys. 2016, 16, 265–276. [Google Scholar] [CrossRef] [Green Version]
  46. Jones, L.; Vieno, M.; Morton, D.; Cryle, P.; Holland, M.; Carnell, E.; Nemitz, E.; Hall, J.; Beck, R.; Reis, S.; et al. Developing Estimates for the Valuation of Air Pollution Removal in Ecosystem Accounts: Final Report Office for National Statistics; Centre for Ecology and Hydrology (CEH): Wallingford, UK, 2017. [Google Scholar]
  47. Nowak, D.J.; Greenfield, E.J. Tree and impervious cover change in U.S. cities. Urban For. Urban Green. 2012, 11, 21–30. [Google Scholar] [CrossRef] [Green Version]
  48. Russo, A.; Escobedo, F.J.; Timilsina, N.; Zerbe, S. Transportation carbon dioxide emission offsets by public urban trees: A case study in Bolzano, Italy. Urban For. Urban Green. 2015, 14, 398–403. [Google Scholar] [CrossRef]
  49. Hirabayashi, S. i-Tree Canopy Air Pollutant Removal and Monetary Value Model Descriptions. 2014, pp. 1–11. Available online: https://www.itreetools.org/documents/560/i-Tree_Canopy_Air_Pollutant_Removal_and_Monetary_Value_Model_Descriptions.pdf (accessed on 10 June 2021).
  50. Tree i-Tree Species. Available online: https://species.itreetools.org/ (accessed on 15 June 2021).
  51. Trees of Bristol Bristol Tree Canopy Cover Survey. 2018. Available online: https://bristoltrees.space/trees/treecover-map.xq?fbclid=IwAR1QpV-CYSE6LYwZjd5yak_S3QZpoqBqILnj7_O3-SdzmTtBwwhbdg9dgcA (accessed on 16 June 2021).
  52. Rogers, K.; Jaluzot, A. Treeconomics Oxford i-Tree Canopy Cover Assessment; Treeconomics: Oxford, UK, 2015. [Google Scholar]
  53. Doick, K.J.; Davies, H.J.; Moss, J.; Coventry, R.; Handley, P.; VazMonteiro, M.; Rogers, K.; Simpkin, P. The Canopy Cover of England’s Towns and Cities: Baselining and setting targets to improve human health and well-being. In Proceedings of the Trees, People and the Built Environment 3: Urban Trees Research Conference, Birmingham, UK, 5–6 April 2017. [Google Scholar]
  54. Kenney, W.A.; Van Wassenaer, P.J.E.; Satel, A.L. Criteria and indicators for strategic urban forest planning and management. Arboric. Urban For. 2011, 37, 108–117. [Google Scholar]
  55. Astell-Burt, T.; Feng, X. Association of Urban Green Space with Mental Health and General Health among Adults in Australia. JAMA Netw. Open 2019, 2, 1–22. [Google Scholar] [CrossRef] [Green Version]
  56. Marselle, M.R.; Bowler, D.E.; Watzema, J.; Eichenberg, D.; Kirsten, T.; Bonn, A. Urban street tree biodiversity and antidepressant prescriptions. Sci. Rep. 2020, 10, 22445. [Google Scholar] [CrossRef]
  57. Kondo, M.C.; Mueller, N.; Locke, D.H.; Roman, L.A.; Rojas-Rueda, D.; Schinasi, L.H.; Gascon, M.; Nieuwenhuijsen, M.J. Health impact assessment of Philadelphia’s 2025 tree canopy cover goals. Lancet Planet. Health 2020, 4, e149–e157. [Google Scholar] [CrossRef]
  58. Nemitz, E.; Vieno, M.; Carnell, E.; Fitch, A.; Steadman, C.; Cryle, P.; Holland, M.; Morton, R.D.; Hall, J.; Mills, G.; et al. Potential and limitation of air pollution mitigation by vegetation and uncertainties of deposition-based evaluations. Philos. Trans. R. Soc. A Math. Phys. Eng. Sci. 2020, 378, 20190320. [Google Scholar] [CrossRef] [PubMed]
  59. Nowak, D.J.; Hirabayashi, S.; Bodine, A.; Greenfield, E. Tree and forest effects on air quality and human health in the United States. Environ. Pollut. 2014, 193, 119–129. [Google Scholar] [CrossRef] [Green Version]
  60. Troy, A.; Morgan Grove, J.; O’Neil-Dunne, J. The relationship between tree canopy and crime rates across an urban–rural gradient in the greater Baltimore region. Landsc. Urban Plan. 2012, 106, 262–270. [Google Scholar] [CrossRef]
  61. Pugh, T.A.M.; MacKenzie, A.R.; Whyatt, J.D.; Hewitt, C.N. Effectiveness of Green Infrastructure for Improvement of Air Quality in Urban Street Canyons. Environ. Sci. Technol. 2012, 46, 7692–7699. [Google Scholar] [CrossRef] [PubMed] [Green Version]
  62. Tree. i-Tree Canopy Technical Notes. Available online: https://canopy.itreetools.org/references (accessed on 16 June 2021).
  63. Sunderland, T.; Rogers, K.; Coish, N. What proportion of the costs of urban trees can be justified by the carbon sequestration and air-quality benefits they provide? Arboric. J. 2012, 34, 62–82. [Google Scholar] [CrossRef]
  64. Janhäll, S. Review on urban vegetation and particle air pollution—Deposition and dispersion. Atmos. Environ. 2015, 105, 130–137. [Google Scholar] [CrossRef]
  65. Jeanjean, A.P.R.; Buccolieri, R.; Eddy, J.; Monks, P.S.; Leigh, R.J. Air quality affected by trees in real street canyons: The case of Marylebone neighbourhood in central London. Urban For. Urban Green. 2017, 22, 41–53. [Google Scholar] [CrossRef]
  66. Riondato, E.; Pilla, F.; Sarkar Basu, A.; Basu, B. Investigating the effect of trees on urban quality in Dublin by combining air monitoring with i-Tree Eco model. Sustain. Cities Soc. 2020, 61, 102356. [Google Scholar] [CrossRef]
  67. Barwise, Y.; Kumar, P. Designing vegetation barriers for urban air pollution abatement: A practical review for appropriate plant species selection. NPJ Clim. Atmos. Sci. 2020, 3, 12. [Google Scholar] [CrossRef] [Green Version]
  68. Hirons, A.; Sjöman, H. Tree Species Selection for Green Infrastructure: A Guide for Specifiers; Trees and Design Action Group: London, UK, 2019; ISBN 978-0-9928686-4-2. [Google Scholar]
  69. Wu, C.; Xiao, Q.; McPherson, E.G. A method for locating potential tree-planting sites in urban areas: A case study of Los Angeles, USA. Urban For. Urban Green. 2008, 7, 65–76. [Google Scholar] [CrossRef]
  70. Jim, C.Y.; Konijnendijk van den Bosch, C.; Chen, W.Y. Acute Challenges and Solutions for Urban Forestry in Compact and Densifying Cities. J. Urban Plan. Dev. 2018, 144, 04018025. [Google Scholar] [CrossRef]
  71. Vaz Monteiro, M.; Handley, P.; Morison, J.; Doick, K. The Role of Urban Trees and Greenspaces in Reducing Urban Air Temperatures; Forest Research: Surrey, UK, 2019; ISBN 978-0-85538-984-0. [Google Scholar]
  72. Defra Air Quality Expert Group—Defra, UK. Available online: https://uk-air.defra.gov.uk/research/aqeg/ (accessed on 20 June 2021).
  73. Miranda, M.L.; Edwards, S.E.; Keating, M.H.; Paul, C.J. Making the environmental justice grade: The relative burden of air pollution exposure in the United States. Int. J. Environ. Res. Public Health 2011, 8, 1755–1771. [Google Scholar] [CrossRef] [PubMed]
  74. Duvall, R.M.; Long, R.W.; Beaver, M.R.; Kronmiller, K.G.; Wheeler, M.L.; Szykman, J.J. Performance evaluation and community application of low-cost sensors for ozone and nitrogen dioxide. Sensors 2016, 16, 1698. [Google Scholar] [CrossRef]
  75. Stevens, K.A.; Bryer, T.A.; Yu, H. Air Quality Enhancement Districts: Democratizing data to improve respiratory health. J. Environ. Stud. Sci. 2021, 1–6. [Google Scholar] [CrossRef]
  76. Yao, N.; Konijnendijk van den Bosch, C.C.; Yang, J.; Devisscher, T.; Wirtz, Z.; Jia, L.; Duan, J.; Ma, L. Beijing’s 50 million new urban trees: Strategic governance for large-scale urban afforestation. Urban For. Urban Green. 2019, 44, 126392. [Google Scholar] [CrossRef]
  77. Timilsina, N.; Beck, J.L.; Eames, M.S.; Hauer, R.; Werner, L. A comparison of local and general models of leaf area and biomass of urban trees in USA. Urban For. Urban Green. 2017, 24, 157–163. [Google Scholar] [CrossRef] [Green Version]
  78. Sacre, K. i-Tree focus Tree planting strategies. ARB Mag. 2020, 190, 15–16. [Google Scholar]
  79. Parmehr, E.G.; Amati, M.; Taylor, E.J.; Livesley, S.J. Estimation of urban tree canopy cover using random point sampling and remote sensing methods. Urban For. Urban Green. 2016, 20, 160–171. [Google Scholar] [CrossRef]
  80. Omodior, O.; Eze, P.; Anderson, K.R. Using i-tree canopy vegetation cover subtype classification to predict peri-domestic tick presence. Ticks Tick Borne Dis. 2021, 12, 101684. [Google Scholar] [CrossRef]
  81. Russo, A.; Cirella, G.T. Edible urbanism 5.0. Palgrave Commun. 2019, 5, 1–9. [Google Scholar] [CrossRef]
  82. Prasad, A.; Gray, C.B.; Ross, A.; Kano, M. Metrics in Urban Health: Current Developments and Future Prospects. Annu. Rev. Public Health 2016, 37, 113–133. [Google Scholar] [CrossRef] [Green Version]
  83. Grubesic, T.H.; Matisziw, T.C. On the use of ZIP codes and ZIP code tabulation areas (ZCTAs) for the spatial analysis of epidemiological data. Int. J. Health Geogr. 2006, 5, 1–15. [Google Scholar] [CrossRef] [Green Version]
  84. Krieger, N.; Waterman, P.; Chen, J.T.; Soobader, M.J.; Subramanian, S.V.; Carson, R. Zip code caveat: Bias due to spatiotemporal mismatches between zip codes and US census-defined geographic areas: The public health disparities geocoding project. Am. J. Public Health 2002, 92, 1100–1102. [Google Scholar] [CrossRef]
  85. Acevedo-Garcia, D. Zip code-level risk factors for tuberculosis: Neighborhood environment and residential segregation in New Jersey, 1985–1992. Am. J. Public Health 2001, 91, 734–741. [Google Scholar] [CrossRef] [Green Version]
  86. Liu, O.Y.; Russo, A. Assessing the contribution of urban green spaces in green infrastructure strategy planning for urban ecosystem conditions and services. Sustain. Cities Soc. 2021, 68, 102772. [Google Scholar] [CrossRef]
  87. Dales, N.P.; Brown, N.J.; Lusardi, J. Assessing the Potential for Mapping Ecosystem Services in England Based on Existing Habitats; Natural England: Newcastle, UK, 2014.
  88. Baró, F.; Gómez-Baggethun, E.; Haase, D. Ecosystem service bundles along the urban-rural gradient: Insights for landscape planning and management. Ecosyst. Serv. 2017, 24, 147–159. [Google Scholar] [CrossRef] [Green Version]
  89. Zardo, L.; Geneletti, D.; Pérez-Soba, M.; Van Eupen, M. Estimating the cooling capacity of green infrastructures to support urban planning. Ecosyst. Serv. 2017, 26, 225–235. [Google Scholar] [CrossRef]
  90. Larondelle, N.; Haase, D. Urban ecosystem services assessment along a rural–urban gradient: A cross-analysis of European cities. Ecol. Indic. 2013, 29, 179–190. [Google Scholar] [CrossRef]
  91. Lin, J.; Kroll, C.N.; Nowak, D.J. An uncertainty framework for i-Tree eco: A comparative study of 15 cities across the United States. Urban For. Urban Green. 2021, 60, 127062. [Google Scholar] [CrossRef]
  92. Russo, A.; Escobedo, F.J.; Cirella, G.T.; Zerbe, S. Edible green infrastructure: An approach and review of provisioning ecosystem services and disservices in urban environments. Agric. Ecosyst. Environ. 2017, 242, 53–66. [Google Scholar] [CrossRef]
  93. Von Döhren, P.; Haase, D. Ecosystem disservices research: A review of the state of the art with a focus on cities. Ecol. Indic. 2015, 52, 490–497. [Google Scholar] [CrossRef]
Figure 1. The study area made up of the six quadrants, i.e., AF, included in the postcode BS1. Source: Google Earth.
Land 10 00788 g001
Figure 2. Tree cover in the six study areas shown in percentage (error bars represent SE).
Land 10 00788 g002
Figure 3. Total amount of air pollutants (i.e., NO2, O3, PM2.5, PM10, and SO2) removed by trees in a year estimated using i-Tree Canopy Version 6.1 and i-Tree Canopy Version 7.1 with local and UK average data (error bars represent SE, calculated from SEs of sampled and classified points).
Land 10 00788 g003
Figure 4. Comparison of the estimates of air pollutants (i.e., NO2, O3, PM2.5, PM10, and SO2) removed per ha by trees using i-Tree Canopy Version 7.1 (local Data) and the urban green and blue infrastructure using the Office for National Statistics. Metric units: kg = kilograms, ha = hectares; Office for National Statistics values were converted from kg/km2 to kg/ha; i-Tree Canopy Version 7.1 values are based on the removal multipliers (i.e., NO2 = 20.375, O3 = 90.596, PM2.5 = 5.670, PM10 = 20.329, and SO2 = 2.513) in kg/ha/year from South West data.
Land 10 00788 g004
Figure 5. Amount of each air pollutant removed annually using i-Tree Canopy Version 7.1 with local data (South West) (error bars represent SE, calculated from SEs of sampled and classified points).
Land 10 00788 g005
Figure 6. Monetary values calculated using i-Tree Canopy Version 7.1 with the UK average and local data. Notes: currency is in GBP and rounded; UK air pollution estimates are based on these values in GBP/kg/year and rounded: NO2 = GBP 0.19, O3 = BGP 0.93, SO2 = GBP 0.06, PM2.5 = GBP 30.65, PM10 = GBP 33.71; local data air pollution estimates are based on these values in GBP/kg/year and rounded: NO2 = GBP 0.11, O3 = GBP 0.77, SO2 = GBP 0.04, PM2.5 = GBP 26.84, PM10 = GBP 33.71.
Land 10 00788 g006
Figure 7. Possible areas for future tree planting: (top left) Fairfax Street, (top right) All Saints’ Street, (bottom left) Nelson Street, and (bottom right) Union Street. Source: Google Maps.
Land 10 00788 g007
Table 1. UK pollutants removed by GI as dry pollutant deposition (kilo tonnes per year), 2015 [46].
PollutantUGBI Year 2015
Urban trees and woodland1.23
PM10Urban grassland1.45
Urban water−0.004
Urban trees and woodland0.70
PM2.5Urban grassland0.31
Urban water−0.003
Urban trees and woodland0.59
SO2Urban grassland1.00
Urban water −0.049
Urban trees and woodland0.44
NH3Urban grassland0.95
Urban water−0.045
Urban trees and woodland0.41
NO2Urban grassland1.61
Urban water0.000
Urban trees and woodland4.97
O3Urban grassland16.94
Urban water−0.003
urban green and blue infrastructure.
Table 2. Multipliers derived from i-Tree Eco projects in the UK and using South West data [50].
Pollutant Removal Rate (g/m²/Year) *Monetary Value (GBP/t/Year) *Removal Rate (g/m²/Year) **Monetary Value (GBP/t/Year) **
CO0.148956.630.072956.63
NO23.065187.912.037114.41
O310.304928.159.06770.40
PM102.0833,713.002.03333,713.00
PM2.50.52130,654.870.56726,838.42
SO20.40564.930.25141.56
* UK average data; ** South West data; Metric units: g = grams, m = meters, t = metric tons.
Publisher’s Note: MDPI stays neutral with regard to jurisdictional claims in published maps and institutional affiliations.

