Article

Can Agricultural Disaster Relief Programs Affect Farmland Prices? Empirical Evidence from Farmland Transaction Data

1
School of Economics and Management, Hubei Polytechnic University, No. 16 North Road, Guilin 435003, China
2
Department of Agricultural Economics, National Taiwan University, No. 1 Roosevelt Road, Section 4, Taipei 10617, Taiwan
3
Graduate School of Engineering Science and Technology, National Yunlin University of Science and Technology, 123 University Road, Section 3, Douliou 64002, Taiwan
*
Author to whom correspondence should be addressed.
Land 2021, 10(7), 728; https://doi.org/10.3390/land10070728
Submission received: 14 June 2021 / Revised: 3 July 2021 / Accepted: 9 July 2021 / Published: 10 July 2021
(This article belongs to the Special Issue Sustainable Rural Transformation under Rapid Urbanization)

Abstract

:
The literature on the capitalization of agricultural policies documents that government subsidies can increase farmland values with attesting empirical evidence found in a variety of agricultural programs. This study argues that the well-documented capitalization effect of agricultural subsidies on farmland prices may not be directly related to the agricultural disaster relief program (ADRP). On the one hand, disaster relief payments can positively capitalize into farmland prices. On the other hand, disaster shocks may result in farm income loss which can decrease farmland prices. This paper empirically examines the overall effect of the ADRP on farmland prices in Taiwan. A unique dataset on 97,864 parcels of farmland transacted in the farmland market is used. By estimating the fixed effect and instrumental variable fixed effect model, a negative overall effect of the incidence and the level of ADRP payments on farmland prices is evident. Moreover, the effect is more pronounced among farmland located in urban areas. This finding provides evidence that the negative stigmatized effect dominates the positive capitalization effect of the ADRP payments on farmland values, especially for farmland located in urban areas (JEL Q15, Q18, Q54).

1. Introduction

Farmland is not only the most important input of farm production, but also the main asset of a farm household. The price of farmland is an important determinant of farm household wellbeing in that it represents a major proportion of farm production expenses [1]. There has been longstanding research interest in the determinants of farmland values. The correlation between agricultural subsidies and farmland values has been acknowledged. Floyd’s seminal paper on this topic provided a simple theory to demonstrate that agricultural subsidies can affect farmers’ gross income and contribute to increasing returns related to farmland [2]. The author stated that different agricultural programs can impact farmland values to different extents. This strand of literature highlights the capitalization effect of agricultural subsidies on farmland values.
Copious empirical studies have examined the capitalization effect of different forms of agricultural support programs on farmland values. This strand of literature focuses on a variety of government policies in different countries; it includes the assessment of the impacts on farmland values resulting from the subsidies of farm programs [3,4,5,6,7,8,9]. A general consensus drawn from the existing studies is that subsidies of agricultural programs can capitalize farmland values to some extent. Few studies found insignificant capitalization effects. For instance, Devadoss and Manchu [10] found an insignificant influence of government payments on farmland prices in the state of Idaho in the United States. A negative effect of direct payments on farmland values is found in Mishra et al. [11]. The authors argued that the negative capitalization effect is due to credit constraints. A comprehensive review of the theory and empirical evidence regarding the capitalization effect of agricultural program subsides on farmland values can be found in Latruffe and Mouel [12]. However, not much is known about agricultural disaster relief subsidies.
In this study, we argue that the agricultural disaster relief program (ADRP) should not be treated in the same manner as other farm programs because the nature of the ADRP is quite different from other farm support programs. On the one hand, when farmland is affected by disaster and it could result in a stigmatized effect on the affected parcels of land, which can lower its overall market value. The concept of the stigmatized effect has been used to examine the impacts of environmental risk, such as flood hazards [13,14,15], on housing or property values. For example, McKenzie and Levendis [14] examined the influences of consumers’ willingness to pay for housing in New Orleans before and after the flooding of hurricane Katrina. That study pointed out a negative stigmatized effect on housing prices after Katrina. Beltran, Maddison, and Elliott [15] recently conducted a meta-analysis that summarized 384 point estimates from journal articles and found a 4.6% price reduction for land located in a 100 year inland floodplain area. In sum, most studies in this strand of literature focus on the impacts on housing prices or property values by different types of environmental risk. Relatively little research has focused on farmland. One exception is found. Wang [16] investigated the extent to which flood risk premiums can capitalize into farmland values in Lancaster County in the state of Pennsylvania in the United States. The author found a 6% reduction in market prices on farmland located in Federal Emergency Management Agency (FEMA) flood zones.
The primary objective of this paper is to quantify the effects of the ADRP payments on farmland prices using a case study of Taiwan as an illustration. Since urban-rural disparity of farmland values has been documented in existing studies [17,18], we also examine the regional differences in relation to the effects of the ARDP on farmland values. In Taiwan, farmers can receive cash payments to compensate for their losses in farm production resulting from natural disaster shocks (the ADRP program in Taiwan is described in Section 2). In contrast to the cases in other countries such as the United States, there is no private crop insurance programs available to farmers in Taiwan. The ADRP is therefore the only program that can be used to compensate farmers’ loss resulting from disaster shocks. As documented in the literature [19,20], farmers can decide whether they want to participate in private crop insurance programs or not. This can result in self-selection bias and create complications in the empirical analysis regarding the disaster shocks on farm production practice.
This study contributes to existing studies with respect to several aspects. A sizable body of literature has documented the stigmatized effect of real estate values that are associated with a variety of environmental risks, but not much attention has been paid to farmland. This study complements this strand of literature by examining the stigmatized effect on farmland prices resulting from disaster shocks. Only two studies were found that examined the capitalization effect of agricultural disaster payments on farmland values in the United States [19,20]. Our study differs from these two studies in several manners. First, farmland prices and the amount of disaster relief payments in their studies are self-reported by the farmers. In contrast, our measurements of farmland prices were drawn from the sale values of farmland transacted in the farmland market and the level of disaster payments was drawn from the administrative profile managed by the government. Using these objective measurements can avoid measurement errors in statistical analysis. Second, the category of disaster payments was documented in the farm household survey data as conducted by Goodwin et al. [19] and includes payments from different government programs. In contrast, our study only considers payments for disaster relief assistance. Our measure is more likely to capture the pure effect of the disaster relief payments on farmland values. Third, we address the issue of urban-rural disparity with respect to the effect of the ADRP on farmland prices which has not been addressed in previous two studies.
The remainder of this paper is constructed as follows. A brief introduction to the farmland market and agricultural disaster relief program in Taiwan is provided in the next section. The data used in this study are introduced in the following section. We then discuss the econometric strategy. After presenting and discussing the empirical results, we conclude this paper with a brief summary.

2. The Agricultural Disaster Relief Program in Taiwan

Agriculture production in Taiwan is vulnerable to natural disasters because it is located in a semi-tropical zone. On average, 3.2 typhoons struck Taiwan annually between 1960 and 2010 [21]. Heavy rainfall brought by typhoons causes severe damage to agriculture, especially to crop production. In 2015, the aggregated annual loss in agricultural products and farm facilities due to natural disasters amounted to USD$ 535 million [22]. To compensate farmers for their losses, the Agricultural Disaster Relief Program (ADRP) was launched in 1991 and agricultural disaster payments were instituted. The ADRP is applicable to farm damages caused by natural disasters. From 2000 to 2010, the total ADRP cash payments reached US$ 935 million [21]. Unlike the United States where different types of agricultural insurance programs (such as crop insurance programs) are available to farmers, the government-sponsored ADRP is the only program in Taiwan that provides compensation to farmers for their losses resulting from natural disasters.
The ADRP payments are provided by the central government’s financial budget. The ADRP program provides lump sum cash payments to farm producers who have suffered catastrophic losses and the cash payments are used to reimburse producers for crop and facility losses. The calculation of the crop losses is based on the following criteria. For crops which can be harvested by transferred cultivation, losses are calculated as 50% of the total production costs; for crops that cannot be transferred for cultivation, losses are calculated as total production costs; and for crops that cannot be harvested, losses are calculated as the cost of restoring the farm. Similarly, the level of ADRP payments paid for livestock farms depend on the values of production costs, which vary according to the types of livestock. After the occurrence of a natural disaster, the officials at the local agricultural station collect information on all of the applications and report to the Council of Agriculture for final inspection and approval. The administrative profile of the ADRP program provides precise measurement of the crop and facility losses due to natural disasters.
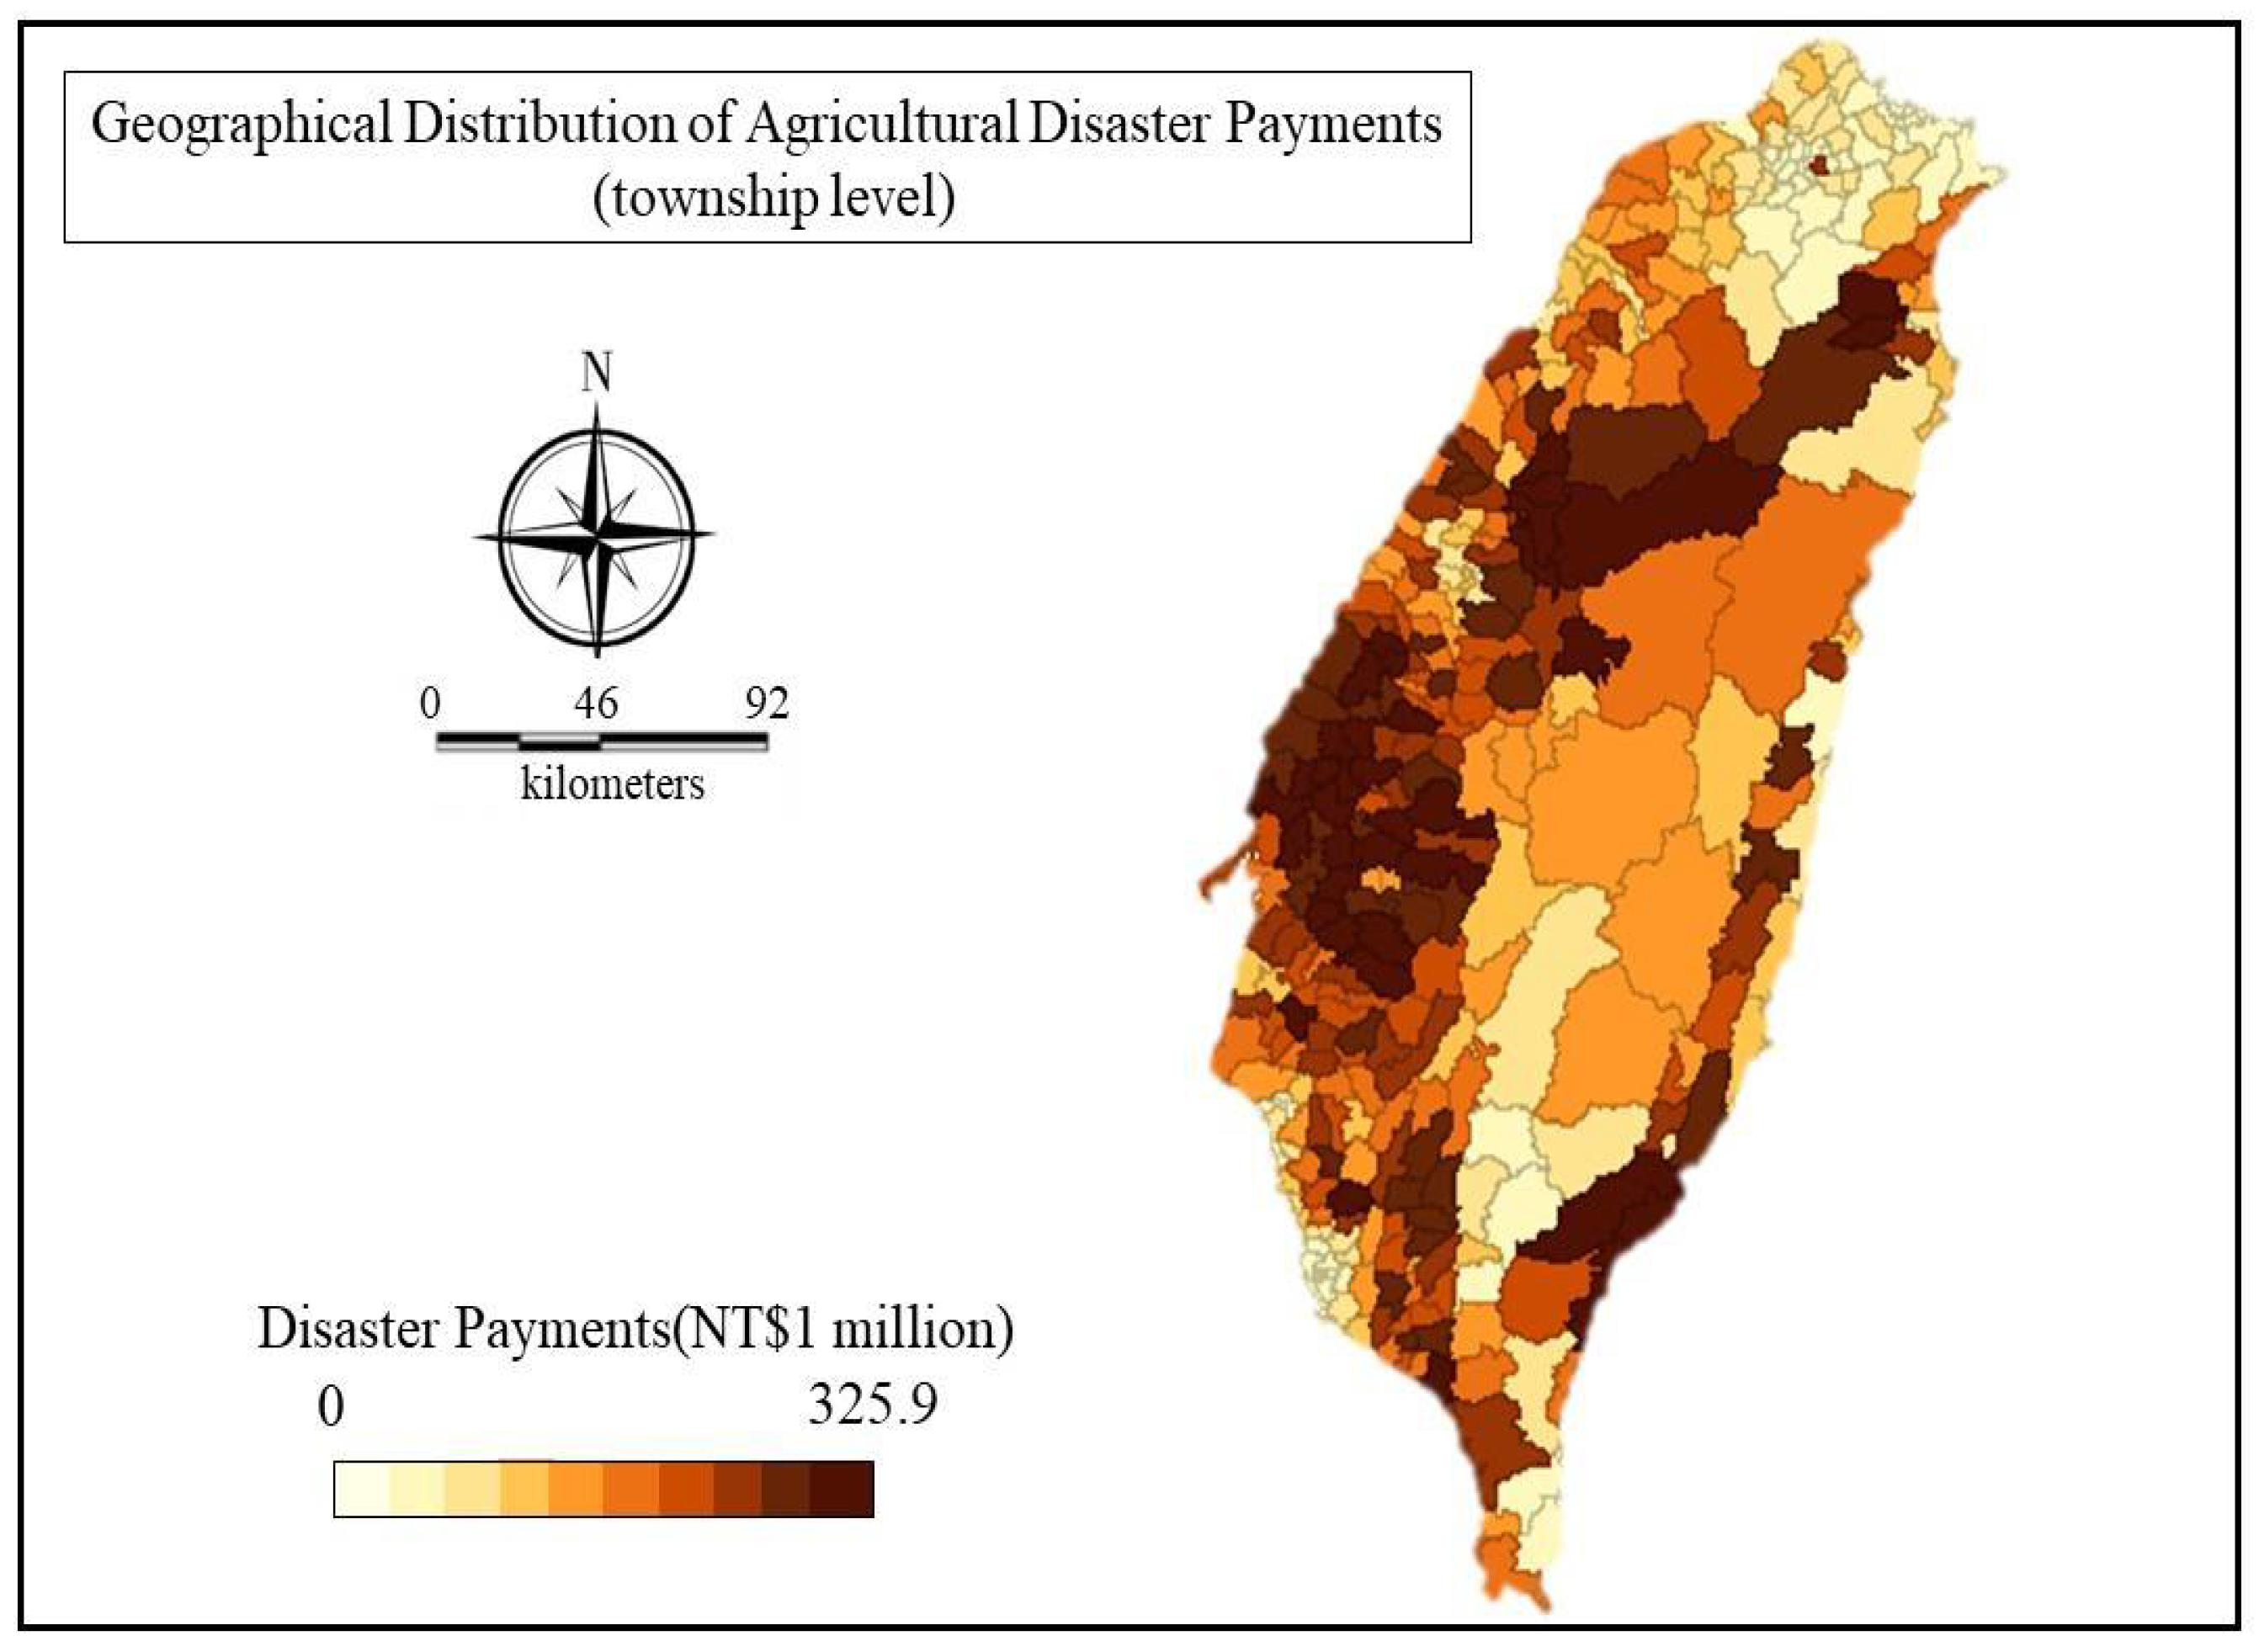
To provide a visual understanding of the regional disparity of the ADRP payments, we depict the distribution of the cumulated ADRP payments from August 2012 to December 2015 in each township in Figure 1. In total, there are 368 townships in Taiwan. Of these, 311 (approximately 87%) have been affected by agricultural disasters. Among the 311 disaster-affected townships, those with darker color have higher ADRP payments. It appears that townships located in mid-western areas tend to be the hot spots of receiving ADRP payments. The distribution of the ADRP payments is consistent with the fact that the mid-western areas are flatter and they are the primary agricultural production zones (i.e., rural areas) in Taiwan.

3. Data

Our data are unique in that we combined information from different sources. We describe each of the data sources in detail below.

3.1. Administrative Profile of Agricultural Disaster Relief Program

The first dataset we used is a national administrative profile that contains all of the recipients of the ADRP payments between August 2012 and December 2015 (41 months in total). This profile was managed by the Agriculture and Food Agency of the Council of Agriculture. This profile documents the size of the damaged farm, total received cash payments, and the township of each parcel of farmland. Moreover, it documents the name of each disaster event that is associated with the payments. Due to the concern of confidentiality, we could not access each individual farm record in this data. With the technical assistance provided by the Council of Agriculture, we were only able to access the information of the ADRP in each township.
Based on the information in the ADRP administrative profile, we categorize the types of disasters into two groups: typhoons and non-typhoons events (including strong wind, heavy rainfall, low or high temperature, droughts, and cold fronts). In Table 1, we report sample statistics for the number of visits, the number of townships that were affected, total disaster payments, sizes of the affected farmland, and average ADRP payments. As reported in Table 1, there were 50 natural disasters that struck Taiwan between August 2012 and December 2015; of these, 41 and 9 were typhoons and non-typhoon events, respectively. In total, 1166 townships were affected by disasters; 52% of them were affected by typhoons (603/1166 = 0.52). With respect to the total amount of ADRP payments, a higher level of payments was found to compensate for farmers’ losses resulting from typhoons (approximately 81% of the total ADRP payments). In terms of the average ADRP payments, farmland was paid NTD 62,000/hectare and NTD 37,000/hectare for typhoons and non-typhoons, respectively.
In accordance with the information contained in the administrative ADRP profile, two variables are defined. The first variable is a dummy variable which indicates the specific townships that received the ADRP payments in each month. Since ADRP payments were only paid to the farmland that was affected by disasters, this variable captures the extensive margin of disaster shocks. The second variable is the average monthly ADRP payments per hectare of the damaged farmland in each township between August 2012 and December 2015. These two variables are then merged into the individual farmland sales dataset by the township of the transacted farmland and the month of transaction (see more of the introduction below).

3.2. Administrative Profile of the Sales Record in the Farmland Market

The primary dataset is the farmland sales records drawn from the Actual Price Registration System (APRS). The APRS is an administrative and population-based sales dataset of property transactions conducted by the Minister of the Interior in Taiwan. The profile contains all of the real estate transactions since 1 August 2012. Information contained in this administrative profile includes sales prices, date of transaction, size and other characteristics of the property, and geographic location of each transacted object. To maintain confidentiality, the Minister of the Interior in Taiwan only releases the month of the transaction and the township of the real estate; the exact date and geographical location of the real estate are not released.
Since this study focuses on farmland, we first limit our sample to farmland only. Farmland is defined following the criterion used by the Council of Agriculture. The final sample contains 97,864 parcels of farmland that were transacted in the farmland market between August 2012 and December 2015 (41 months in total). For each parcel of the transacted farmland, the characteristics of the farmland are documented. The value of farmland is captured by the sales price per hectare of the transacted farmland. In accordance with the hedonic price theory and information documented in the data, we specify a continuous variable for the size of each parcel of the farmland. In addition, four dummy variables are specified if the farmland is located in a specific agricultural zone, regular agricultural zone, conservation zone, or other types of agricultural zones, respectively.

3.3. Characteristics of Typhoons

We collected additional information to capture the severity of the disaster shocks. Given that the ADRP payments associated with typhoons account for approximately 81% of the total ADRP payments and that there were nine typhoons that passed through Taiwan during our sample period, we defined two variables that captured the severity of each typhoon: the minimum central pressure and the maximum wind speed of each typhoon. For each typhoon, we assigned the same value of the minimum central pressure and the maximum wind speed to its affected townships. These two variables were constructed and provided by the Central Weather Bureau.
The definitions and sample statistics of the selected variables are reported in Table 2. In Table 2, we report the sample statistics of the selected variables in the full sample and the two subgroups of farmland: those affected by disasters and those that were not. In the full sample, the average sales price was NTD 39,680,000 per hectare of farmland. It appears that the average sales price is lower among the farmlands that had been affected by natural disasters (NTD 39,060,000/hectare) than their counterparts that were never affected by natural disasters (NTD 39,740,000/hectare). The average ADRP payments were NTD 4270/hectare in the full sample and NTD 45,220/hectare for the farmland affected by natural disasters.
To provide snapshot evidence of the regional differences in the association between the ADRP and farmland prices, we report the sample statistics of the selected variables for the urban and rural sample, respectively, in Table 3. The definition of rural and urban areas follows the categorization of Chang and Fu [23]. These authors applied the Beale code which has been used in the United States to categorize all of the townships in Taiwan into seven subgroups of different economic development based on population density, the degree of industrialization, public facilities, and geographic characteristics. For simplicity, the authors further combine the seven subgroups of townships into a binary classification for rural and urban area. This binary categorization has been a protocol of rural-urban classification in official governmental reports.
In our sample, approximately 26% of the farmland transactions occurred in urban areas (24,966/97,864 = 0.26). It appears that the average prices per hectare are much higher for farmland in urban areas than in rural areas (NTD 6315 vs. NTD 3164, respectively). Regarding the urban-rural disparity in farmland prices, it appears that the average price of farmland is higher for those that were never affected by disasters compared to the disaster-affected farmland.
In addition to the differences in farmland prices displayed in Table 2, Table 3 also indicates the differences in the sample statistics of other explanatory variables between the disaster-affected and non-disaster-affected groups of farmland. For example, farmland located in a specific agricultural zone is more likely to be affected by natural disasters. This finding reveals that it is necessary to control for the differences in other explanatory variables between farmland in the two groups in order to identify the effects of the ADRP on farmland prices.

4. Econometric Framework

The primary objective of the empirical analysis is to estimate the farmland price equation. To reach this objective, it is important to understand the determinants of farmland prices. We build our empirical estimation based on the hedonic price theory. The hedonic price model is a revealed preference technique which states that the price of a good observed in the marketplace is a function of its attributes or characteristics. It provides the theoretical underpinnings for empirical models that estimate the marginal prices for a product’s characteristics. This model has been widely used to examine the role of environmental factors and land characteristics on farmland prices (see Nickerson and Zhang [24] for a comprehensive review of the literature). In the case of farmland prices, the hedonic price theory predicts that farmland characteristics, geographic location, and government programs should be associated with farmland prices. We follow the guidance of the hedonic price model to specify our farmland price equation.
In addition to the variables that reflect farmland characteristics and government program, some unobserved environmental factors may also determine farmland prices. For example, the unobserved soil quality in an area that each farmland is located can possibly be associated with farmland prices. That is, farmland that is located in an environmentally sensitive area may have lower market value and may be more vulnerable to natural disaster shocks. In this case, the unobserved soil quality will result in lower farmland prices and a higher likelihood of receiving ADRP payments. This problem refers to the omitted variable bias or endogeneity bias [25]. The endogeneity issue of modeling the farmland price equation has been addressed. A literature review of modeling farmland price equations can be found in Nickerson and Zhang [24]. In this study, we apply the fixed effect (FE) model and the instrumental variable fixed effect (IV-FE) model to cope with endogeneity bias. By using the FE model, bias can be controlled for in terms of modeling farmland prices that is due to time-invariant unobserved factors, such as soil quality. The FE model has been shown as a powerful method to deal with the endogeneity bias resulting from unobserved factors [25].

4.1. The Fixed Effect Model

The baseline model we estimate is the FE model for the farmland price equation. The equation that controls for the township and month fixed effects is specified as the following:
log ( P i j t ) = γ × D j t + β X i j t + v j + u t + ε i j t
where log ( P i j t ) is the logarithm of the sale prices of ith parcel of farmland in township j and time t. The variable D j t is related to the ADRP. In the empirical analysis, we used the likelihood of receiving ADRP payments and the amount of ADRP payments to measure the extensive and intensive margin of the ADRP, respectively. X i j t is a vector of explanatory variables related to farmland prices (i.e., different types of agricultural zones and the size of farmland; see Table 2). v j and u t are the fixed effects in townships and months, respectively, and ε i j t is the random error. γ ,   β are the parameters to be estimated. In Equation (1), the most interesting parameter is γ , which captures the effect of the ADRP on farmland prices, ceteris paribus.

4.2. The Instrumental Variable Fixed Effect Model

In addition to the standard FE model, we estimate the farmland price equation using the Instrumental Variable Fixed Effect (IV-FE) model. The IV-FE model is a straightforward application of the IV method to the FE framework. The IV-FE can overcome the endogeneity bias that is due to unobservable heterogeneity [25]. In this study, we use the minimum central pressure and the maximum wind speed of each typhoon that struck Taiwan in our sample period as the IVs. The justification of using these two IVs is as follows. First, nine typhoons hit Taiwan in our sample period, with 603 townships affected by them (approximately 52% of the 1166 disaster-affected townships). The characteristics of typhoons provide enough statistical power of exogenous variation to identify the econometric model. Second, it is expected that the characteristics of typhoons and the severity of damages are directly correlated. Given that the ADRP payments are used to compensate for the loss of farm production and farm facilities, the characteristics of typhoons and the ADRP payments should be directly connected as well. This argument is also supported by some studies which have pointed out a positive correlation between weather conditions and agricultural disaster payments. For example, Nadolnyak and Hartarska [26] used county-level data from four states in the Southeastern United States to show that weather and climate variables explain most of the crop disaster payments. They also suggest that advancements in weather and climate forecasts could be used to determine disaster compensation.

4.3. Identification Conditions

The identification condition of the standard FE model relies on the assumption that the inclusion of the township and time fixed effects can cope with endogeneity bias as long as the source of endogeneity is due to time-invariant unobservable factors [25]. As an example, soil quality may vary by township and it cannot be observed by researchers. If soil quality does not change over time in a specific township, the endogeneity bias of the ADRP on farmland prices can be controlled by the fixed effect parameter v j .
Although the standard FE model can ease the endogeneity bias, its identification condition relies on the assumption that all of the sources that result in endogeneity bias must come from unobservable time-invariant factors. This assumption is somewhat a strong one in that some unobservable determinants of farmland prices may change over time. If any of the time-variant unobservable determinants exist, the standard FE model will produce inconsistent estimation results. In continuing with the example of soil quality for illustration, the standard FE model can produce inconsistent estimates if the unobservable soil quality changes over time in a specific township. To further avoid the endogeneity bias due to time-variant unobservable factors, we estimate the farmland price equation using the IV-FE model. Although the IV-FE models can further control for endogeneity bias due to time-variant unobservable factors on farmland prices, the validation of the IV model relies on two critical assumptions. We will discuss each of them in the following and empirically test the appropriateness of these assumptions in Section 6.

5. Results and Discussion

The empirical results are presented in several tables. Table 4 presents the estimation results of the farmland price equations using the FE and IV-FE models. Table 5 and Table 6 report the estimation results of the farmland price equations separately for urban and rural samples when the incidence and the level of the ADRP payments are specified as the key endogenous variables, respectively.

5.1. The Effects of Agricultural Disaster Relief Program on Farmland Prices

Table 4 reports the estimation results of the farmland price equation using the FE and IV-FE models. In each model, the logarithm of the farmland price is specified as the dependent variable and the list of explanatory variables includes the likelihood or the level of the ADRP payments, different geographical zones of farmland, size of farmland, months, and townships fixed effects (see Table 2). The reported standard errors of the estimates are clustered in townships. In columns (A4)–(C4), we report the estimation results when the likelihood of receiving the ADRP payments is specified as the key endogenous variable in the farmland price equation, while columns (D4)–(F4) report the estimation results when the amount of ADRP payments is specified as the key endogenous variable in the farmland price equation.
We begin our discussions of the results presented in Table 4 by looking at the role of the characteristics of typhoons on the likelihood and the level of the ADRP payments. As reported in columns (B4) and (E4), both the minimum central pressure (the variable IV_pressure) and the maximum wind speed (the variable IV_wind) of typhoons are positively and statistically significant and associated with the incidence and level of disaster payments. This result is not unexpected since more severe typhoons are more likely to cause large farm damages and the level of the ADRP payments highly depends on the severity of farm damage. With respect to modeling issues, this result provides some evidence that the two IVs are not statistically weak. They have enough statistical power to predict the incidence and the level of the ADRP payments.
With respect to the incidence of the ADRP on farmland prices, the estimation results of the FE model point to a significant and negative average treatment effect (ATE) on farmland prices (see column A4). Specifically, farmland that was affected by agricultural disasters has a lower market price by 3.99% on average compared to farmland that was never affected by agricultural disasters ceteris paribus. The estimate of the IV-FE model provides a more conservative result: the estimated local average treatment effect (LATE) is −0.0243, as reported in column C3. This result indicates that, among the farmlands for which the price would be changed by disaster shocks (i.e., the compliers [27]), farmland prices are 2.43% lower on average among farmland that was affected by disasters compared to farmland that was never affected by disasters ceteris paribus. Although the estimation results between the FE and IV-FE cannot be directly compared, the difference in the magnitudes of the estimates can be partially attributed to time-variant unobservable factors (i.e., endogeneity bias).
Similar results are found when the amounts of the ADRP payments were specified as the key endogenous variable in the farmland price equation. As reported in column D5 of Table 5, the ATE estimated by the FE model is −0.017, which indicates that every NTD 10,000 increase in the ADRP payments per hectare of the disaster-affected farmland decreases farmland prices by 1.17% on average compared to farmland that was never affected by disasters. A smaller effect is found in the estimation result of the IV-FE model. The estimated LATE points out that, among the farmlands for which the price would be changed by disaster shocks, an additional increase in NTD 10,000 of the ADRP payments per hectare of the disaster-affected farmland decreases farmland prices by 0.54% on average compared to farmland that was not affected by disaster shocks, ceteris paribus.

5.2. Regional Disparity of the Effects

To explore the regional disparity of the ADRP effect on farmland prices, we estimate farmland price equations using the IV-FE model for farmland located in urban and rural areas, respectively. The estimation results that use the incidence of the ADRP and the associated payments as the key endogenous variable in the farmland price equations are reported in Table 5 and Table 6, respectively. The results indicate a significant and negative effect of the ADRP on farmland prices for farmland located in an urban area. Specifically, farmland that is located in an urban area that was affected by natural disasters possess a lower market price by 5.13% on average compared to those never affected by disaster shocks, ceteris paribus (see column B5 of Table 5). With respect to the impacts of the ADRP payments on farmland prices, the results in column B6 of Table 6 indicate that an additional NTD 10,000 ADRP payments per hectare of the affected farmland decreases farmland prices by 1.21% on average compared to farmland that was never affected by disaster shocks, ceteris paribus. In contrast, an insignificant effect of the ADRP payments on farmland prices is found for farmland in a rural area.

5.3. The Validity of the IV

A valid IV requires that the IVs have to be highly correlated with the endogenous variable. In our case, the characteristics of typhoons (i.e., IV_pressure and IV_wind) have to be correlated with the extensive and intensive margins of the ADRP payments (i.e., the variable Disaster and Payments). To address this issue, we tested if the two selected IVs are statistically correlated with the ADRP in the first stage equation of the instrumental variable of two stage least squares (IV-2SLS) estimation. The results of the F test are reported in the bottom of Table 4, Table 5 and Table 6. For all of the models, the F statistics are larger than 10 and the rule of thumb critical value is suggested by Staiger and Stock [28]. Therefore, this result provides some confidence that the selected IVs are not statistically weak.

5.4. Discussions of Our Findings

Previous studies of disaster relief programs in the United States have found a positive impact of the disaster relief payments on farmland prices. For example, using an individual farm household survey data between 1998 and 2001, Goodwin et al. [19] found that disaster payments significantly increased farmland prices. Using the same data but in different years, Ifft et al. [20] also found a positive capitalization effect from disaster payments on cropland values. Both papers treated disaster payments in the same manner as payments from other farm programs and paid little attention to examining the extent to which disaster payments may affect farmland values.
In this study, we find a negative impact of ADRP payments on farmland prices. Although findings of this paper are in contrast to the ones revealed in the United States, our results may provide some interesting implications for the disaster relief program design in Taiwan. On the one hand, the shocks of natural disasters on farmland may lower farmland values due to the stigmatized effect. On the other hand, the subsidies of the ADRP may increase farmland values due to the capitalization effect of the payments. Given that the overall effect is negative, this result may suggest that the negative stigmatized effect dominates the positive capitalization effect. Moreover, this evidence may possibly imply that the current level of the ADRP payments may not be high enough to compensate the public-aware stigma on farmland values associated with disaster shocks. We offer some possible explanations of our findings in urban-rural disparity below. On average, farmland prices are much higher for farmland in an urban area than in a rural area (NTD 63.15 million vs. NTD 31.63 million; see Table 3). The urban-rural difference in the average price of farmland may reflect different purposes of land use and different option values for future development of the farmland between urban and rural areas. In Taiwan, most of the farmlands in a rural area are owned by full-time farmers and rural farmland is primarily used for farm production. In contrast, a significant proportion of the farmland in urban areas is owned by part-time farmers and used for building farmhouses for residency or for asset investment [29]. Given that residential housing prices are much higher in metropolitan areas, urban farmland is more valuable than the rural farmland. Another reason for the observed higher prices for farmland in an urban area may reflect the urban-rural differences in option values of the land for future development [30,31]. For example, Plantinga and Miller developed a theory to illustrate that the farmland’s potential rights for future development will be reflected in the current land price [30]. Given that farmland in an urban area possesses higher option values for building farmhouses for residency, a higher value with respect to urban farmland is expected. Since ADRP payments are used to compensate for the loss in farm production values associated with disaster shocks, it is likely that the current level of agricultural disaster payments may not be high enough to overweigh the negative stigmatized effect on farmland prices among farmlands located in an urban area. Therefore, a negative effect of the ADRP payments on prices for farmland in urban areas is not unexpected.

6. Conclusions

The world has witnessed a rapid increase in extreme natural events and natural disasters are expected to be more frequent in the future. The need to address the impacts of natural disaster shocks on farmland values is becoming more important. This study contributes to this issue by examining the effects of the agricultural disaster relief program on farmland prices. In contrast to other farm support programs, the effect of agricultural disaster relief programs on farmland prices can be either positive or negative depending on the trade-off between a positive capitalization effect of the subsidies into farmland and a negative stigmatized effect on farmland values resulting from disaster shocks.
Using a unique dataset that combines the sales records of farmland in the farmland market and the administrative profile of the agricultural disaster relief program in Taiwan, we estimated a farmland price equation using the fixed effect and the instrumental variable fixed effect model to cope with endogeneity bias. The results pointed out a negative program effect on farmland prices. Farmland affected by disasters has a lower market price by 2.43% on average compared to farmland that was never affected by disasters. Moreover, an increase of NTD 10,000 in disaster relief payments lowers farmland prices by 0.54%, ceteris paribus. Furthermore, compared to farmland located in a rural area, the negative effect of disaster shocks on farmland prices is more pronounced among farmlands in an urban area.
In regard to policy relevance, the evident negative effect of the disaster relief subsidies on farmland prices may point out the possibility that the current level of the cash subsidies on the disaster-affected farmland is not high enough to outweigh the negative stigmatized effect resulting from disaster shocks. This result may not be too surprising since the level of the disaster relief subsidies in the current policy regime is meant to compensate for the loss of farm production and does not account for the non-production values of the farmland, such as the option values in development.
Although this paper reveals interesting findings, some caveats remain. For instance, it will be interesting to further investigate whether different types of disasters result in different effects on farmland prices. This paper omits this issue due to the difficulty in accessing the payments data on non-typhoon events because such events only affect a limited number of farms in a few townships. For example, droughts have been found to be a severe event that affects farm production in other countries. However, this is not the case in Taiwan. Given the geographic location of Taiwan, agricultural disaster payments given to farmers as a result of drought damage only accounts for approximately 5% of the total payments of the agricultural disaster relief program. Another potential caveat is the lack of buyers’ information in farmland transactions, especially buyers’ motivation and purposes in regard to purchasing farmland. If this information becomes available, it will be helpful to understand whether farmland in an urban area is more likely to be used for farm production or asset investment.

Author Contributions

Conceptualization, H.-H.C.; methodology, T.-H.L., Y.-T.H. and H.-H.C.; software, T.-H.L., Y.-T.H. and H.-H.C.; formal analysis, T.-H.L., Y.-T.H. and H.-H.C.; investigation, B.-Y.C.; resources, B.-Y.C.; writing—original draft preparation, H.-H.C.; writing—review and editing, T.-H.L. and B.-Y.C.; supervision, H.-H.C. All authors have read and agreed to the published version of the manuscript.

Funding

Time spent on this paper by Chang. H-H was supported by the Ministry of Science and Technology in Taiwan under the grant number 110-3.1.2-Q4 and 110-3.1.3-Q2(2).

Institutional Review Board Statement

The authors thank the Ministry of Interior in Taiwan for making the individual farmland data available. Since the analysis did not use individual identity, the rule of RBI approval does not apply in this study.

Informed Consent Statement

Informed consent was obtained from all subjects involved in the study.

Data Availability Statement

Readers who are interested in accessing the farmland transaction data can contact the Ministry of Interior in Taiwan.

Conflicts of Interest

The authors declare no conflict of interest.

References

  1. Barlowe, R. Land Resource Economics: The Economics of Real Estate, 4th ed.; Prentice Hall: Upper Saddle River, NJ, USA, 1986. [Google Scholar]
  2. Floyd, J. The effects of farm price supports on the returns to land and labor in agriculture. J. Polit. Econ. 1965, 73, 148–158. [Google Scholar] [CrossRef]
  3. Barnard, C.; Whittaker, G.; Westenbarger, D.; Ahearn, M. Evidence of capitalization of direct payments into U.S. cropland values. Am. J. Agric. Econ. 1997, 79, 1642–1650. [Google Scholar] [CrossRef]
  4. Kirwan, B. The incidence of U.S. agricultural subsidies on farmland rental rates. J. Polit. Econ. 2009, 117, 138–164. [Google Scholar] [CrossRef] [Green Version]
  5. Shaik, S.; Helmers, G.; Atwood, J. The evolution of farm programs and their contribution to agricultural land values. Am. J. Agric. Econ. 2005, 87, 1190–1197. [Google Scholar] [CrossRef]
  6. Weersink, A.; Clark, S.; Turvey, C.; Sarker, R. The effect of agricultural policy on farmland values. Land Econ. 1999, 75, 425–439. [Google Scholar] [CrossRef]
  7. Vyn, R.; Haq, Z.; Weerahewa, J.; Meilke, K. The influence of market returns and government payments on Canadian farmland values. J. Agric. Resour. Econ. 2012, 37, 199–212. [Google Scholar]
  8. Jerzy, M.; Ciaian, P.; d’Artic, K. Capitalization of the single payment scheme into land value: Generalized propensity score evidence from the European Union. Land Econ. 2014, 90, 260–289. [Google Scholar]
  9. Patton, M.; Kostov, P.; McErlean, S.; Moss, J. Assessing the influence of direct payments on the rental value of agricultural land. Food Policy 2008, 33, 397–405. [Google Scholar] [CrossRef]
  10. Devadoss, S.; Manchu, V. A comprehensive analysis of farmland value determination: A county-level analysis. Appl. Econ. 2007, 39, 2323–2330. [Google Scholar] [CrossRef]
  11. Mishra, A.; Moss, C.; Erickson, K. The role of credit constraints and government subsidies in farmland valuations in the US: An options pricing model approach. Empir. Econ. 2008, 34, 285–297. [Google Scholar] [CrossRef]
  12. Latruffe, L.; Le Mouel, C. Capitalization of government support in agricultural land prices: What do we know? J. Econ. Surv. 2009, 23, 659–691. [Google Scholar] [CrossRef]
  13. Daniel, V.; Florax, R.; Rietveld, P. Flooding risks and housing values: An economic assessment of housing hazards. Ecol. Econ. 2009, 69, 355–365. [Google Scholar] [CrossRef] [Green Version]
  14. McKenzie, R.; Levendis, J. Flood hazards and urban housing markets: The effects of Katrina on New Orleans. J. Real Estate Financ. 2010, 40, 62–76. [Google Scholar] [CrossRef]
  15. Beltran, A.; Madison, D.; Elliott, R. Is flood risk capitalised into property values? Ecol. Econ. 2018, 146, 668–685. [Google Scholar] [CrossRef]
  16. Wang, H. Market response to flood risk: A matching study of farmland values using boundary discontinuities. In Proceedings of the Annual Meeting, Boston, MA, USA, 31 July–2 August 2016. [Google Scholar]
  17. Nilsson, P.; Johansson, S. Location determinants of agricultural land prices. Rev. Reg. Res. 2013, 33, 1–21. [Google Scholar] [CrossRef] [Green Version]
  18. Cavailhes, J.; Wavresky, P. Urban influences on peri-urban farmland prices. Eur. Rev. Agric. Econ. 2003, 30, 333–357. [Google Scholar] [CrossRef]
  19. Goodwin, B.; Mishra, A.; Ortalo-Magne, F. What is wrong with our models of agricultural land values? Am. J. Agric. Econ. 2003, 85, 744–752. [Google Scholar] [CrossRef]
  20. Ifft, J.; Kuethe, T.; Morehart, M. The impact of decoupled payments on U.S. cropland values. Agric. Econ. 2005, 46, 643–652. [Google Scholar] [CrossRef]
  21. Council of Agriculture. Agricultural Statistics Yearbook; Council of Agriculture: Taipei, Taiwan, 2011.
  22. Council of Agriculture. Agricultural Statistics Yearbook; Council of Agriculture: Taipei, Taiwan, 2015.
  23. Chang, Y.; Fu, Y. Taiwan Social Change Survey; Institute of Sociology, Academia Sinica: Taipei, Taiwan, 2006. [Google Scholar]
  24. Nickerson, C.; Zhanga, W. Modeling the determinants of farmland values in the United States. In The Oxford Handbook of Land Economics, 1st ed.; Duke, J., Wu, J., Eds.; Oxford University Press: Oxford, UK, 2014; pp. 111–138. [Google Scholar]
  25. Wooldridge, J. Econometric Analysis of Cross Section and Panel Data, 2nd ed.; MIT Press: Cambridge, MA, USA, 2010. [Google Scholar]
  26. Nadolnyak, D.; Hartarska, V. Agricultural disaster payments in the southeastern US: Do weather and climate variability matter? Appl. Econ. 2012, 44, 4331–4342. [Google Scholar] [CrossRef]
  27. Angrist, J.; Imbens, G.; Rubin, D. Identification of causal effects using instrumental variables. J. Am. Stat. Assoc. 1996, 91, 444–455. [Google Scholar] [CrossRef]
  28. Staiger, D.; Stock, J. Instrumental variables regression with weak instruments. Econometrica 1997, 65, 557–586. [Google Scholar] [CrossRef]
  29. Chang, H.; Lin, T. Does the minimum lot size program affect farmland values? Empirical evidence using administrative data and regression discontinuity design in Taiwan. Am. J. Agric. Econ. 2016, 98, 785–801. [Google Scholar] [CrossRef] [Green Version]
  30. Plantinga, A.; Miller, D. Agricultural land values and the value of rights to future land development. Land Econ. 2001, 77, 56–67. [Google Scholar] [CrossRef]
  31. Plantinga, A.; Lubowski, R.; Stavins, R. The effects of potential land development on agricultural land prices. J. Urban Econ. 2002, 52, 561–581. [Google Scholar] [CrossRef] [Green Version]
Figure 1. Geographical distribution of agricultural disaster payments (township level). Note: The agricultural disaster payments assigned to each township are the cumulative values between July 2012 and October 2015. There are 368 townships in Taiwan in total. The grey areas are those townships without any disaster shocks (57 townships). For the areas with marked colors (311 townships), darker colored townships are those with higher disaster payments, while those with lighter colors have lower disaster payments.
Land 10 00728 g001
Table 1. Sample distribution of agricultural disaster payments at the township level.
Event TypeNumber of
Disasters
Number of
Townships
Total Payments
(NTD 100,000)
Affected Areas
(Hectare)
Average Payments
(NTD 100,000/Hectare)
Typhoons960368,617110,6480.62
Non-typhoons #4156315,94643,4460.37
All50116684,564154,0940.55
Note: The time period of disaster shocks is between August 2012 and December 2015 (41 months). In total, there are 368 townships in Taiwan. # Including 10 strong wind (gale), 12 heavy rainfall shocks, 7 low temperature shocks, 5 droughts, and 7 cold frontals.
Table 2. Distribution of agricultural disaster payments in the township level.
All SampleIf Ever Affected by Disaster Shocks If Never Affected by Disaster Shocks
VariableDefinitionMeanS.D.MeanS.D.MeanS.D.
PriceFarmland price (NTD 10,000/hectare).3968 6465 3906 8155 3974 6262
PaymentsDisaster payments (NTD 10,000/hectare).0.427 1.514 4.522 2.392 0 0
Land sizeThe size of the parcel of farmland (hectare).0.296 0.625 0.291 0.655 0.297 0.622
Land_type1If the land is located in a specific agricultural zone (=1).0.516 0.500 0.548 0.498 0.513 0.500
Land_type2If the land is located in a regular agricultural zone (=1).0.254 0.435 0.228 0.419 0.256 0.437
Land_type3If the land is located in a conservation zone (=1).0.221 0.415 0.220 0.414 0.221 0.415
Land_type4If the land is located in other types of agricultural zones (=1).0.009 0.092 0.004 0.061 0.009 0.095
IV_pressureMinimum central pressure of typhoons (hPa).60.61 230.98 641.24 438.33 00
IV_windMaximum wind speed of typhoons (m/s).2.86 11.09 30.24 21.74 00
Number of months 412441
Number of townships 291263290
Parcels of farmland 97,864
(100%)
9250
(9.5%)
81,164
(90.5%)
Note: The sample includes all parcels of farmland transactions between August 2012 and December 2015 (41 months in total) in 291 townships in Taiwan.
Table 3. Sample statistics of the selected variables by urban and rural areas.
Urban SampleRural Sample
All SampleIf Ever Affected by Disaster ShocksIf Never Affected by Disaster ShocksAll SampleIf Ever Affected by Disaster ShocksIf Never Affected by Disaster Shocks
VariableMeanS.D.MeanS.D.MeanS.D.MeanS.D.MeanS.D.MeanS.D.
Price6315 7626 6198 6540 6326 7718 3164 5801 3156 8455 3235 5435
Payments0.365 1.412 4.345 2.539 0.000 0.000 0.449 1.546 4.574 2.345 0.000 0.000
Land size0.239 0.359 0.231 0.353 0.239 0.360 0.316 0.692 0.308 0.719 0.316 0.689
Land_type10.611 0.488 0.627 0.484 0.609 0.488 0.484 0.500 0.525 0.499 0.480 0.500
Land_type20.227 0.419 0.220 0.415 0.228 0.420 0.263 0.440 0.230 0.421 0.266 0.442
Land_type30.153 0.360 0.150 0.357 0.153 0.360 0.245 0.430 0.241 0.427 0.245 0.430
Land_type40.009 0.095 0.002 0.044 0.010 0.099 0.008 0.091 0.004 0.066 0.009 0.094
IV_pressure58.22 226.48 693.43 412.97 0 0 61.43 232.49 625.95 444.36 0 0
IV_wind2.80 11.04 33.32 20.88 0 0 2.88 11.10 29.34 21.90 0 0
Parcels of farmland 24,966
(100%)
2096
(8.4%)
22,870
(91.6%)
72,898
(100%)
7154
(9.8%)
65,744
(90.2%)
Note: The sample includes all parcels of farmland transactions between August 2012 and December 2015. The detailed definition of each variable can be found in Table 2.
Table 4. Estimation results of the farmland price equation.
Part A: Incidence of Disaster Shocks on Farmland Price
(Key Variable)
Part B: Disaster Payments on Farmland Price
(Key Variable)
Fixed Effect (FE)IV-Fixed Effect (IV-FE)Fixed Effect (FE)IV-Fixed Effect (IV-FE)
(A4)(B4)(C4)(D4)(E4)(F4)
First StageSecond Stage First StageSecond Stage
VariableCoefficientS.E.CoefficientS.E.CoefficientS.E.CoefficientS.E.CoefficientS.E.CoefficientS.E.
Disaster #1−0.0399 **0.0183 −0.0243 **0.0118
Payments −0.0117 ***0.0039 −0.0054 **0.0027
IV_pressure 0.0009 ***0.0000 0.0036 ***0.0001
IV_wind 0.0024 ***0.0002 0.0203 ***0.0015
Land size−0.1554 ***0.0297 0.0016 *0.0009 −0.1553 ***0.0045 −0.1554 ***0.0297 0.0057 0.0056 −0.1553 ***0.0045
Land_type11.9094 ***0.1301 0.0050 0.0060 1.9089 ***0.0306 1.9088 ***0.1301 −0.0549 0.0381 1.9085 ***0.0306
Land_type21.6980 ***0.1381 0.0043 0.0060 1.6976 ***0.0309 1.6981 ***0.1381 −0.0038 0.0385 1.6975 ***0.0309
Land_type30.4973 ***0.1246 0.0067 0.0060 0.4970 ***0.0308 0.4977 ***0.1247 0.0376 0.0383 0.4970 ***0.0308
Constant6.8001 ***0.2105 0.0384 ***0.0065 6.7968 ***0.0331 6.8068 ***0.2105 0.5180 ***0.0412 6.7987 ***0.0332
Control for monthsYesYesYesYesYesYes
Control for townshipsYesYesYesYesYesYes
Weak IV test #2--56,240 --45,000
Adjusted/centered R20.4857 0.6671 0.4857 0.4858 0.4959 0.4857
Parcels of farmland97,864 97,864 97,864 97,864
Note: The dependent variable is the logarithm of the farmland price. #1: The Disaster is a binary indicator (=1 if any disaster shock; =0 otherwise). #2: H0: The IVs are statistically weak. The rule-of-thumb threshold for instrument weakness is 10. Standard errors are clustered in townships. ***, **, and * indicate significance at the 1%, 5%, and 10% level.
Table 5. Estimation results of the incidence of receiving agricultural disaster payments on farmland prices by regions (IV-FE model).
Urban AreasRural Areas
(A5)(B5)(C5)(D5)
First StageSecond StageFirst StageSecond Stage
VariableCoefficientS.E.CoefficientS.E.CoefficientS.E.CoefficientS.E.
Disaster #1 −0.0513 **0.0213 −0.0174 0.0133
IV_pressure0.0009 ***0.0000 0.0009 ***0.0000
IV_wind0.0021 ***0.0004 0.0025 ***0.0003
Land size−0.0018 0.0026 −0.2778 ***0.0139 0.0018 **0.0010 −0.1304 ***0.0046
Land_type10.0003 0.0102 2.0295 ***0.0542 0.0080 0.0073 1.7360 ***0.0348
Land_type20.0023 0.0103 1.8999 ***0.0547 0.0045 0.0074 1.5087 ***0.0352
Land_type30.0012 0.0102 0.8089 ***0.0542 0.0057 0.0073 0.4197 ***0.0350
Constant0.0306 ***0.0108 6.8965 ***0.5743 0.0669 ***0.0081 6.5298 ***0.0390
Control for monthsYesYesYesYes
Control for townshipsYesYesYesYes
Weak IV test #231,000 64,000
Adjusted/centered R20.7255 0.3942 0.6511 0.4926
Parcel of farmland24,966 24,966 72,898 72,898
Note: The dependent variable is the logarithm of the farmland price. #1: The Disaster is a binary indicator (=1 if any disaster shock; =0 otherwise). #2: H0: The IVs are statistically weak. The rule-of-thumb threshold for instrument weakness is 10. Standard errors are clustered in townships. *** and ** indicate significance at the 1% and 5% level.
Table 6. Estimation results of the agricultural disaster relief payments on farmland prices by regions (IV-FE model).
Urban AreasRural Areas
(A6)(B6)(C6)(D6)
First StageSecond StageFirst StageSecond Stage
VariableCoefficientS.E.CoefficientS.E.CoefficientS.E.CoefficientS.E.
Payments −0.0121 **0.0050 −0.0039 0.0030
IV_pressure0.0042 ***0.0001 0.0034 ***0.0001
IV_wind0.0053 *0.0030 0.0253 ***0.0018
Land size−0.0049 0.0177 −0.2778 ***0.0139 0.0063 0.0060 −0.1304 ***0.0046
Land_type1−0.0387 0.0690 2.0291 ***0.0542 −0.0405 0.0455 1.7357 ***0.0348
Land_type2−0.0363 0.0696 1.8993 ***0.0547 0.0197 0.0460 1.5087 ***0.0352
Land_type3−0.0380 0.0690 0.8084 ***0.0542 0.0424 0.0457 0.4198 ***0.0350
Constant0.3794 ***0.0731 6.8995 ***0.0575 0.8054 ***0.0509 6.5318 ***0.0392
Control for monthsYesYesYesYes
Control for townshipsYesYesYesYes
Weak IV test #112,000 33,000
R20.5120 0.3944 0.4955 0.4926
Parcel of farmland24,966 24,966 72,898 72,898
Note: #1: H0: The IVs are statistically weak. The rule-of-thumb threshold for weak instruments is 10. ***, **, and * indicate significance at the 1%, 5%, and 10% level.
Publisher’s Note: MDPI stays neutral with regard to jurisdictional claims in published maps and institutional affiliations.

