
Exploring the Spatio-Temporal Dynamics of Development of Specialized Agricultural Villages in the Underdeveloped Region of China

Abstract
1. Introduction
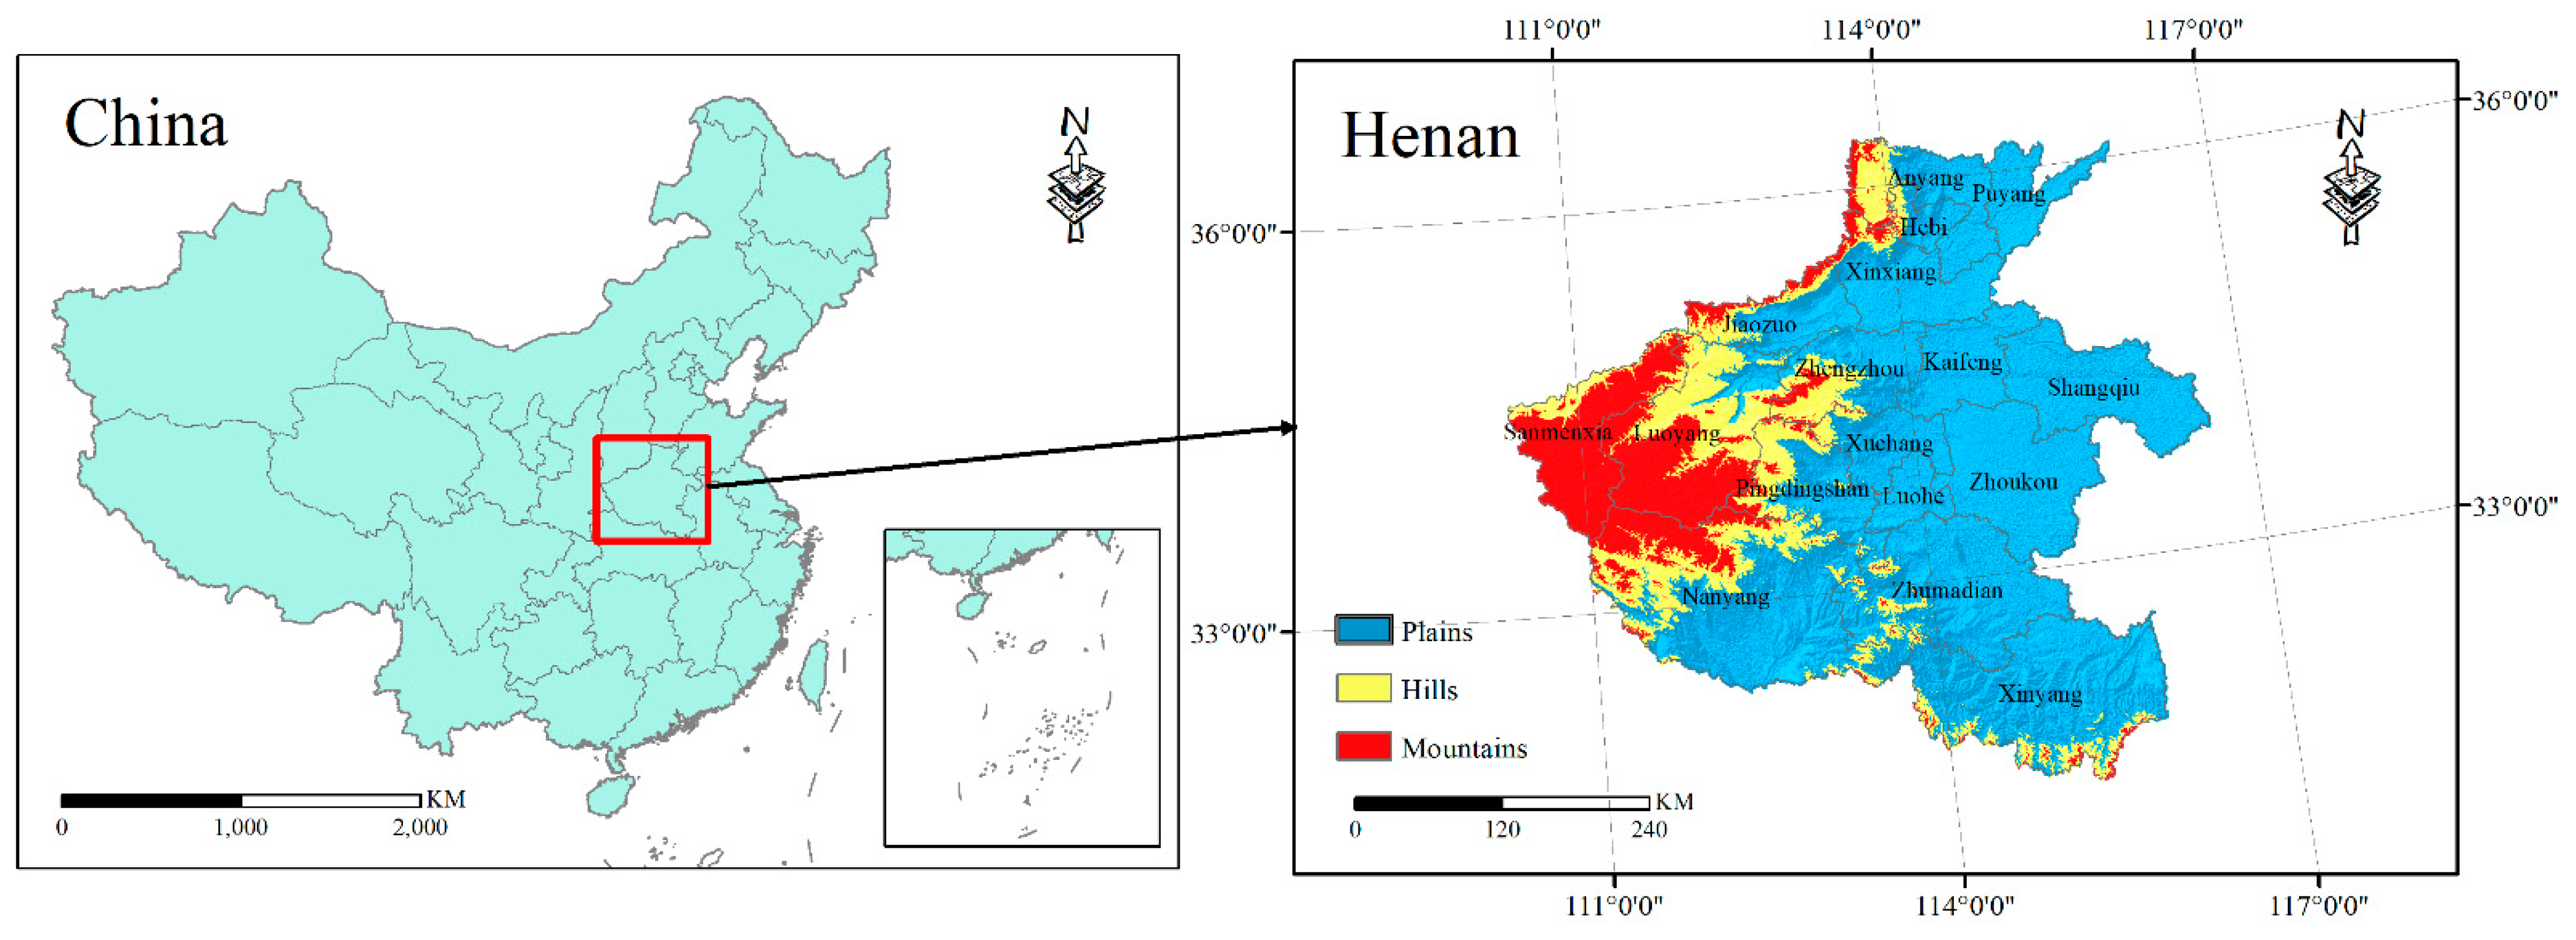
2. Study Area and Data Processing
3. Method
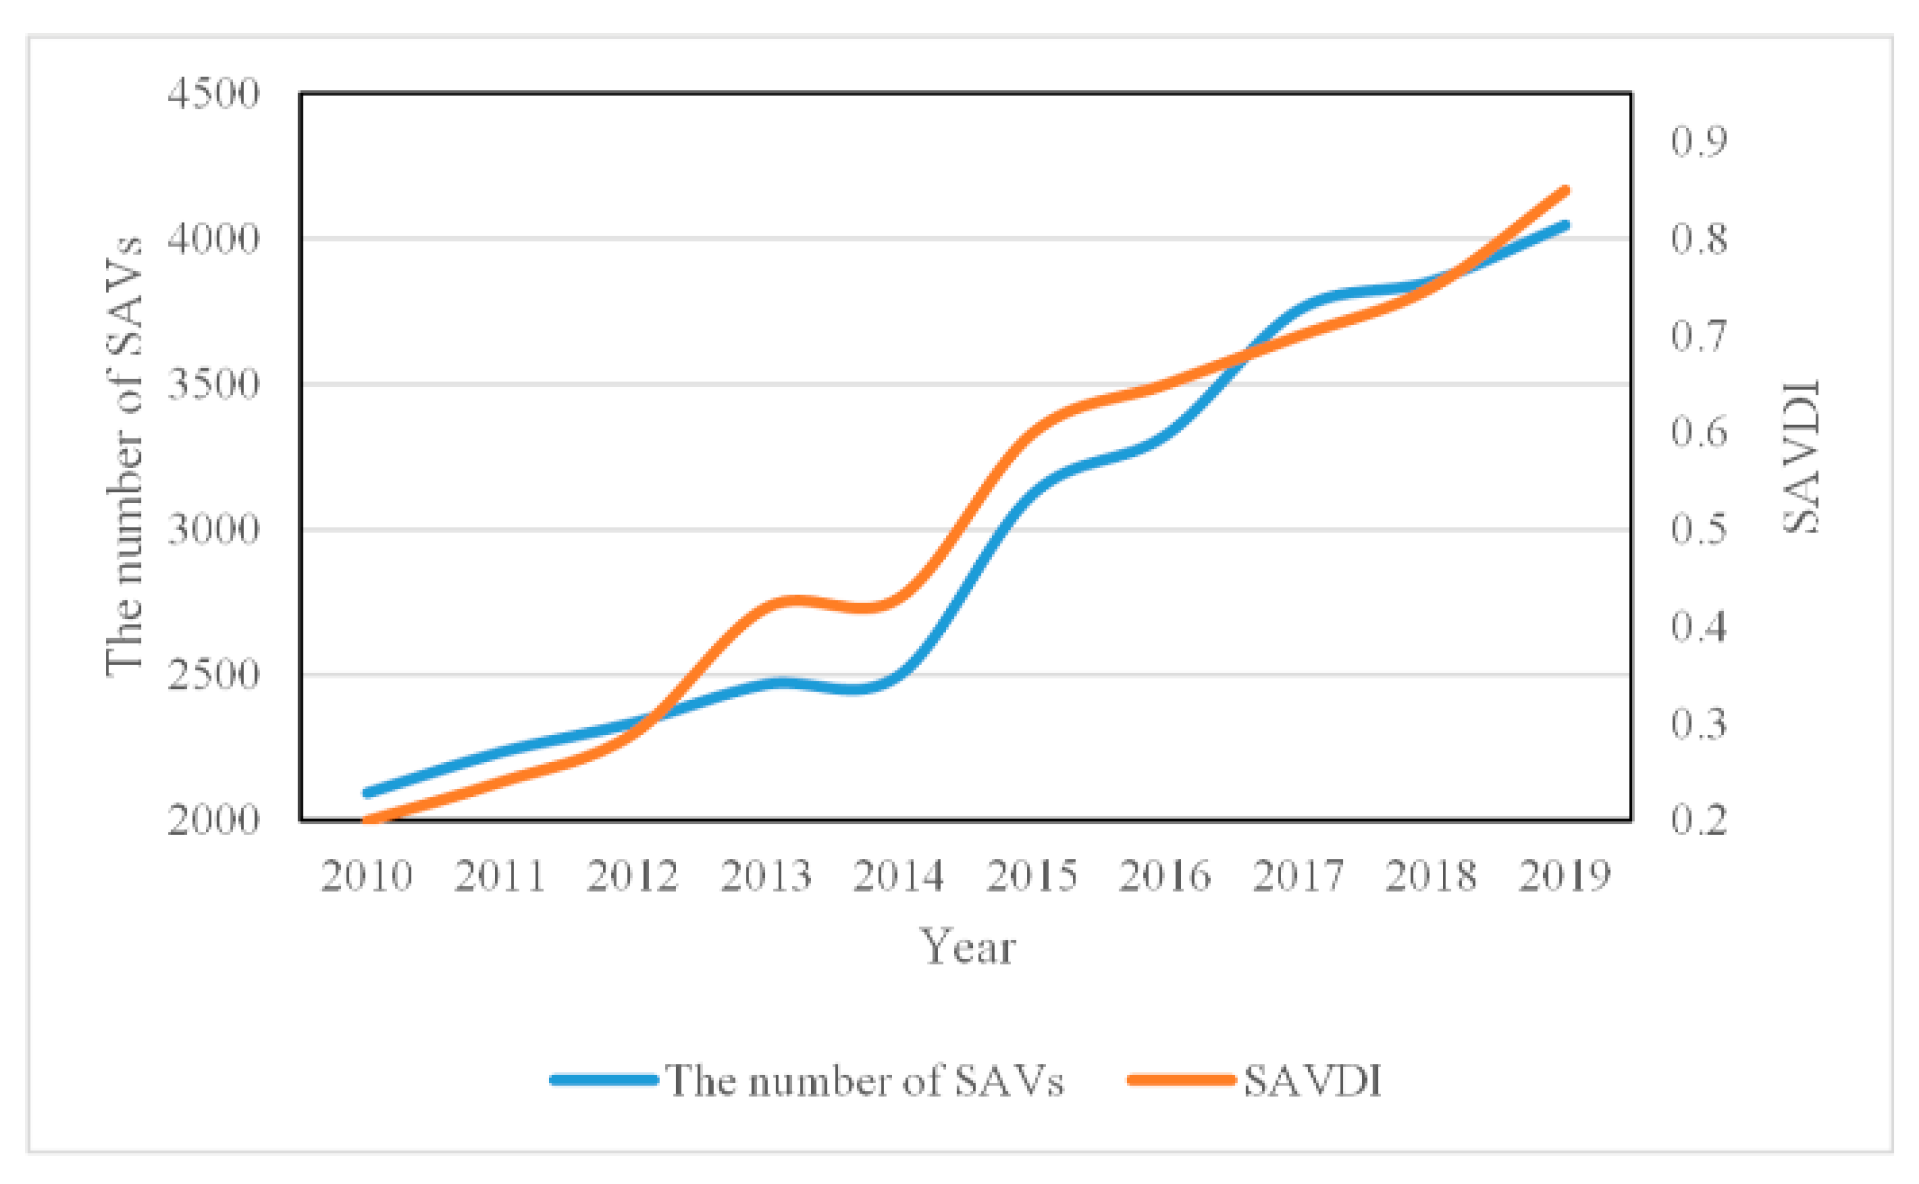
3.1. Measurement of DSAVs
3.2. Quantification of the Potential Association Factors
3.3. Global Moran’s I
3.4. Analyzing the Spatial Pattern of DSAVs
3.5. Using Geographic Detectors to Identify the Significant Factors of DSAVs
4. Results
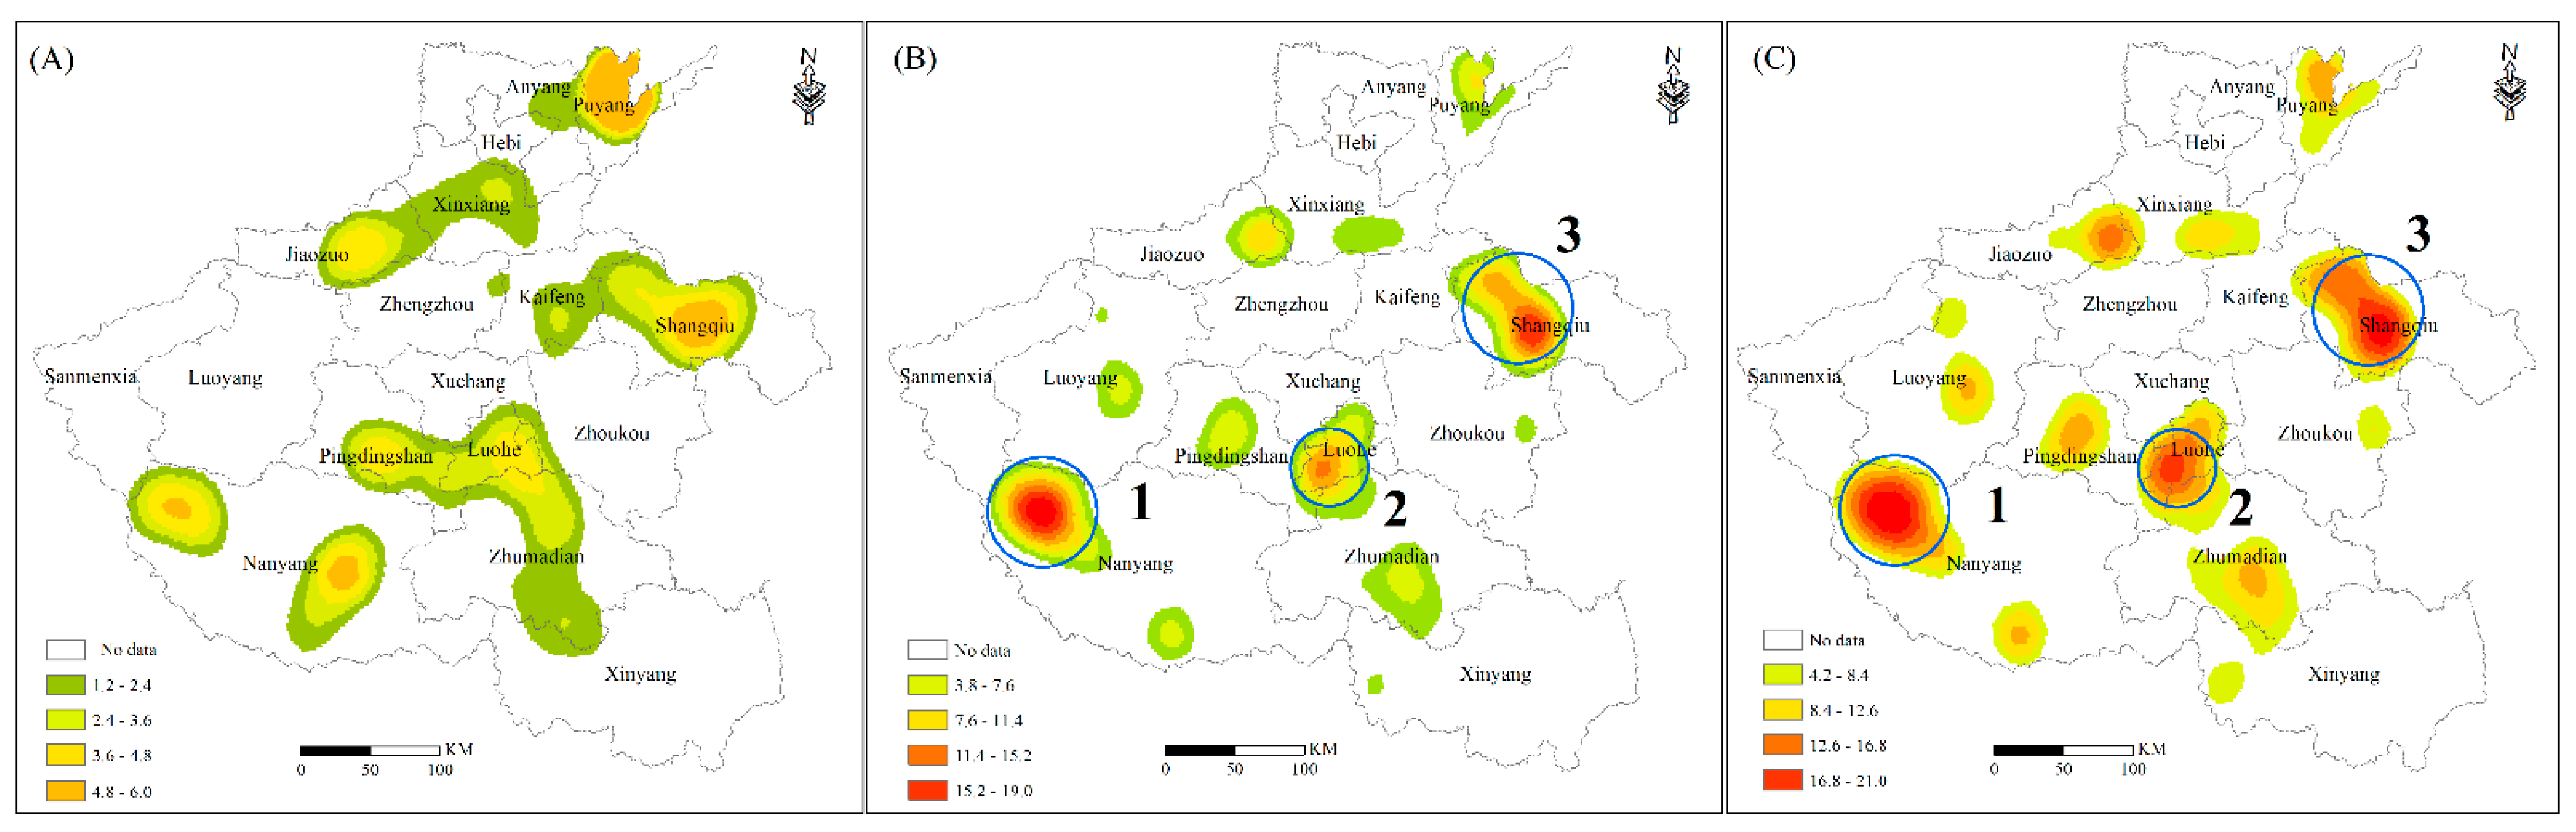
4.1. Spatial Pattern of DSAVs
4.2. Identifying the Key Influencing Factors of DSAVs
5. Discussion
6. Conclusions
Author Contributions
Funding
Data Availability Statement
Acknowledgments
Conflicts of Interest
References
- Liu, Y.; Li, Y. Revitalize the world’s countryside. Nature 2018, 548, 275–277. [Google Scholar] [CrossRef]
- Li, X.; Zhou, X.; Zheng, C.; Scott, R. Development of Specialized Villages in Various Environments of Less Developed China. Acta Geogr. Sin. 2012, 67, 783–792. (In Chinese) [Google Scholar]
- Bellandi, M.; Di Tommaso, M.R. The case of specialized towns in Guangdong, China. Eur. Plan. Stud. 2005, 13, 707–729. [Google Scholar] [CrossRef]
- Cao, Z.; Liu, Y.; Li, Y.; Wang, Y. Spatial pattern and its influencing factors of specialized villages and towns in China. Acta Geogr. Sin. 2020, 75, 1647–1666. (In Chinese) [Google Scholar]
- MARAC. Reply to Recommendation No. 3421 of the Fifth Session of the Twelfth National People’s Congress. Available online: http://www.moa.gov.cn/gk/jyta/201710/t20171017_5842497.htm (accessed on 18 October 2017).
- Omamo, S.W. Farm to market transaction costs and specialisation in small scale agriculture: Explorations with a non-separable household model. J. Dev. Stud. 1998, 35, 152–163. [Google Scholar] [CrossRef]
- Leaman, J.H.; Conkling, E.C. Transport change and agricultural specialization. Ann. Assoc. Am. Geogr. 1975, 65, 425–432. [Google Scholar] [CrossRef]
- Pachoud, C.; Delay, E.; Re, R.D.; Ramanzin, M.; Sturaro, E. A relational approach to studying collective action in dairy cooperatives producing mountain cheeses in the Alps: The case of the primiero cooperative in the eastern Italians Alps. Sustainability 2020, 12, 4596. [Google Scholar] [CrossRef]
- De Roest, K.; Ferrari, P.; Knickel, K. Specialisation and economies of scale or diversification and economies of scope? Assessing different agricultural development pathways. J. Rural Stud. 2017, 59, 222–231. [Google Scholar] [CrossRef]
- Emran, M.S.; Shilpi, F. The Extent of the Market and Stages of Agricultural Specialization; The World Bank: Washington, DC, USA, 2008; pp. 1123–1126. [Google Scholar]
- Mora, R.; San Juan, C. Geographical specialisation in Spanish agriculture before and after integration in the European Union. Reg. Sci. Urban. Econ. 2004, 34, 309–320. [Google Scholar] [CrossRef][Green Version]
- Li, Y.; Fan, P.; Liu, Y. What makes better village development in traditional agricultural areas of China? Evidence from long-term observation of typical villages. Habitat. Int. 2019, 83, 111–124. [Google Scholar] [CrossRef]
- Chen, G.; Hamori, S. Rural Labor Migration, Discrimination, and the New Dual Labor Market in China; Springer Science & Business Media: Berlin, Germany, 2013; pp. 154–196. [Google Scholar]
- Li, X.; Ye, X.; Zhou, X.; Zheng, C.; Leipnik, M.; Lou, F. Specialized villages in inland China: Spatial and developmental issues. Sustainability 2018, 10, 2994. [Google Scholar] [CrossRef]
- Gao, G.; Shi, L. The formation process of specialized village and its influence factors-a case study for three sample villages in the southwest of Henan province. Econ. Geogr. 2011, 31, 1165–1170. (In Chinese) [Google Scholar]
- Qiao, J.; Lee, J.; Ye, X. Spatiotemporal evolution of specialized villages and rural development: A case study of Henan province, China. Ann. Am. Assoc. Geogr. 2016, 106, 57–75. [Google Scholar] [CrossRef]
- Wu, N.; Li, E.; Li, X. Spatial distribution of specialized vegetable cultivation villages and its influencing factors: A case study of capsicum plantation in Zhecheng County, Henan Province. Geogr. Res. 2013, 32, 1303. (In Chinese) [Google Scholar]
- Wu, N.; Li, L.; Li, E.; Li, X. The Spatial Continuity of Specialized Plantation: A Case Study of Raspberry Farm in Fengqiu County, Henan Province. Sci. Geogr. Sin. 2018, 38, 428–436. (In Chinese) [Google Scholar]
- Liu, Y.; Lu, S.; Chen, Y. Spatio-temporal change of urban–rural equalized development patterns in China and its driving factors. J. Rural Stud. 2013, 32, 320–330. [Google Scholar] [CrossRef]
- Ngugi, J.; Bwisa, H. Factors influencing growth of group owned small and medium enterprises: A case of one village one product enterprises. Int. Educ. Res. J. 2013, 1, 1–14. [Google Scholar]
- Liu, S.; Qin, Y.; Xu, Y. Inequality and influencing factors of spatial accessibility of medical facilities in rural areas of China: A case study of Henan province. Int. J. Environ. Res. Public Health 2019, 16, 1833. [Google Scholar] [CrossRef] [PubMed]
- Gudjonsson, G. An easy guide to factor analysis. Personal. Individ. Differ. 1994, 17, 302. [Google Scholar] [CrossRef]
- Moran, P.A. Notes on continuous stochastic phenomena. Biometrika 1950, 37, 17–23. [Google Scholar] [CrossRef] [PubMed]
- Shi, X. Selection of bandwidth type and adjustment side in kernel density estimation over inhomogeneous backgrounds. Int. J. Geogr. Inf. Sci. 2010, 24, 643–660. [Google Scholar] [CrossRef]
- Wang, J.; Li, X.; Christakos, G.; Liao, Y.; Zhang, T.; Gu, X.; Zheng, X. Geographical detectors-based health risk assessment and its application in the neural tube defects study of the Heshun region, China. Int. J. Geogr. Inf. Sci. 2010, 24, 107–127. [Google Scholar] [CrossRef]
- Ju, H.; Zhang, Z.; Zuo, L.; Wang, J.; Zhang, S.; Wang, X.; Zhao, X. Driving forces and their interactions of built-up land expansion based on the geographical detector—A case study of Beijing, China. Int. J. Geogr. Inf. Sci. 2016, 30, 2188–2207. [Google Scholar] [CrossRef]
- Zhao, Y.; Deng, Q.; Lin, Q.; Cai, C. Quantitative analysis of the impacts of terrestrial environmental factors on precipitation variation over the Beibu gulf economic zone in coastal southwest China. Sci. Rep. 2017, 7, 44412. [Google Scholar] [CrossRef] [PubMed]
- Liao, Y.; Wang, J.; Du, W.; Gao, B.; Liu, X.; Chen, G.; Song, X.; Zheng, X. Using spatial analysis to understand the spatial heterogeneity of disability employment in China. Trans. GIS 2017, 21, 647–660. [Google Scholar] [CrossRef]
- Li, X.; Zhou, X.; Zheng, C. Geography and Economic Development in Rural China: A Township Level Study in Henan Province, China. Acta Geogr. Sin. 2008, 63, 147–155. (In Chinese) [Google Scholar]


| First-Order | Second-Order | Detailed Indicators |
|---|---|---|
| Terrain | Elevation | Elevation (T1) *, Mean coefficient of elevation (T2) *, Extreme coefficient of elevation (T3) * |
| Slope | Slope (T4) *, Mean coefficient of slope (T5) *, Extreme coefficient of slope (T6) * | |
| Resource | Water resource | Spatial distance from SAVs to river (R1) *, Mean coefficient of spatial distance from SAV to River (R2) *, Extreme coefficient of spatial distance to the river, Rainfall (R3) *, Mean coefficient of rainfall, Extreme value coefficient |
| Soil resource | Soil quality grade (R4) *, Mean coefficient, Extreme value coefficient | |
| Location | Distance to city | Spatial distance from SAVs to county (L1) *, Spatial distance from SAV to city |
| Traffic accessibility | Network distance from SAVs to road network (L2) *, Mean coefficient of the network distance from SAVs to road network (L3) *, Extreme coefficient of the network distance from SAVs to road network (L4) * | |
| Market | Market scale | County urbanization population (M1) *, Prefecture-level urban population, |
| Degree of supply and demand | County urbanization rate (M2) *, Prefecture-level urbanization rate | |
| Consumption level | Disposable income of urban residents in the county (M3) * | |
| Economy | Total output value | Mean county GDP of former 5 years (E1) *, Mean municipal GDP of former 5 years |
| Number of enterprises | The number of agricultural enterprises in the county (E2) * |
| DSAV. | Global Moran’s I | Z-Value | P-Value |
|---|---|---|---|
| 0.47 | 19.25 | 0.001 | |
| 0.51 | 18.12 | 0.001 | |
| 0.49 | 15.25 | 0.001 | |
| SAVDI | 0.45 | 17.56 | 0.001 |
| Period of Time | Original Variables | Factors | ||||
|---|---|---|---|---|---|---|
| SSVDI | SGVDI | SFVDI | SLVDI | SCVDI | ||
| 2011–2014 | 0.332 | 0.258 | 0.102 | 0.155 | 0.752 | |
| 0.211 | 0.554 | 0.552 | 0.641 | 0.341 | ||
| 0.635 | 0.285 | 0.311 | 0.166 | 0.156 | ||
| 2015–2019 | 0.212 | 0.125 | 0.158 | 0.265 | 0.711 | |
| 0.601 | 0.561 | 0.441 | 0.421 | 0.256 | ||
| 0.635 | 0.251 | 0.321 | 0.321 | 0.100 | ||
| Indicator | SAVDI (2011–2014) | SAVDI (2015–2019) | ||
|---|---|---|---|---|
| q Statistic | p Value | q Statistic | p Value | |
| T1 | 0.1311 | 0.0000 | 0.1012 | 0.0000 |
| T4 | 0.3158 | 0.0000 | 0.1581 | 0.0000 |
| R1 | 0.1521 | 0.0000 | 0.0325 | 0.0311 |
| R3 | 0.1112 | 0.0000 | - | - |
| R4 | - | - | 0.0125 | 0.0221 |
| L1 | 0.4120 | 0.0000 | 0.1251 | 0.0000 |
| L2 | 0.1985 | 0.0000 | - | - |
| M1 | 0.1421 | 0.0000 | 0.3814 | 0.0000 |
| M2 | 0.1025 | 0.0000 | 0.1528 | 0.0000 |
| M3 | 0.0211 | 0.0325 | 0.1645 | 0.0000 |
| E1 | - | - | 0.4021 | 0.0000 |
| E2 | 0.0112 | 0.0412 | 0.1514 | 0.0000 |
| Indicator | SSVDI (2011–2014) | SSVDI (2015–2019) | ||
|---|---|---|---|---|
| q Statistic | p Value | q Statistic | p Value | |
| T1 | 0.1211 | 0.0000 | 0.1010 | 0.0000 |
| T4 | 0.1158 | 0.0000 | 0.1147 | 0.0000 |
| R1 | 0.1521 | 0.0000 | 0.1245 | 0.0000 |
| R3 | 0.1011 | 0.0000 | - | - |
| R4 | - | - | - | - |
| L1 | 0.1623 | 0.0000 | 0.1058 | 0.0000 |
| L2 | 0.4712 | 0.0000 | 0.0812 | 0.0301 |
| M1 | 0.1371 | 0.0000 | 0.1821 | 0.0000 |
| M2 | 0.1125 | 0.0000 | 0.1258 | 0.0000 |
| M3 | - | - | 0.4513 | 0.0000 |
| E1 | 0.1123 | 0.0000 | 0.1122 | 0.0000 |
| E2 | 0.1128 | 0.0000 | 0.2115 | 0.0000 |
| Indicator | SCVDI (2011–2014) | SCVDI (2015–2019) | ||
|---|---|---|---|---|
| q Statistic | p Value | q Statistic | p Value | |
| T1 | 0.2211 | 0.0000 | 0.1561 | 0.0000 |
| T4 | 0.1350 | 0.0000 | 0.1012 | 0.0000 |
| R1 | 0.0121 | 0.0000 | 0.0000 | 0.0000 |
| R3 | 0.0011 | 0.0000 | - | - |
| R4 | - | - | 0.0320 | 0.0221 |
| L1 | 0.1214 | 0.0000 | 0.0058 | 0.0311 |
| L2 | 0.1104 | 0.0000 | 0.1012 | 0.0000 |
| M1 | 0.0121 | 0.0111 | 0.0032 | 0.0124 |
| M2 | 0.0352 | 0.0344 | 0.1058 | 0.0000 |
| M3 | 0.0214 | 0.0221 | 0.0522 | 0.0000 |
| E1 | 0.1251 | 0.0000 | 0.2136 | 0.0000 |
| E2 | 0.3258 | 0.0000 | 0.4125 | 0.0000 |
| Indicator | SCCVDI (2011–2014) | SCCVDI (2015–2019) | ||
|---|---|---|---|---|
| q Statistic | p Value | q Statistic | p Value | |
| T1 | 0.1444 | 0.0000 | 0.1015 | 0.0000 |
| T4 | 0.1026 | 0.0000 | 0.1145 | 0.0000 |
| R1 | 0.2521 | 0.0365 | 0.0056 | 0.0311 |
| R3 | 0.1147 | 0.0000 | 0.0651 | 0.0452 |
| R4 | 0.1256 | 0.000 | - | - |
| L1 | 0.3521 | 0.0000 | 0.4114 | 0.0000 |
| L2 | 0.1099 | 0.0000 | 0.1789 | 0.0000 |
| M1 | 0.0547 | 0.0211 | 0.3796 | 0.0000 |
| M2 | 0.0158 | 0.0355 | 0.1485 | 0.0000 |
| M3 | - | - | 0.1254 | 0.0000 |
| E1 | - | - | 0.4388 | 0.0000 |
| E2 | 0.1125 | 0.0000 | 0.2411 | 0.0000 |
| Indicator | SFVDI (2011–2014) | SFVDI (2015–2019) | ||
|---|---|---|---|---|
| q Statistic | p Value | q Statistic | p Value | |
| T1 | 0.0325 | 0.0362 | 0.0025 | 0.0488 |
| T4 | 0.0012 | 0.0500 | 0.0204 | 0.0362 |
| R1 | 0.2111 | 0.0000 | 0.1145 | 0.0000 |
| R3 | 0.1525 | 0.0000 | 0.1741 | 0.0000 |
| R4 | 0.2855 | 0.0000 | 0.1401 | 0.0000 |
| L1 | 0.1117 | 0.0000 | - | - |
| L2 | 0.1109 | 0.0000 | 0.1789 | 0.0000 |
| M1 | 0.0547 | 0.0311 | - | - |
| M2 | 0.1425 | 0.0000 | 0.1811 | 0.0000 |
| M3 | 0.1845 | 0.0000 | 0.3477 | 0.0000 |
| E1 | - | - | 0.1201 | 0.0000 |
| E2 | 0.1114 | 0.0000 | 0.1000 | 0.0000 |
| Indicator | SAVDI (2011–2014) | SAVDI (2015–2019) | ||
|---|---|---|---|---|
| q Statistic | p Value | q Statistic | p Value | |
| T1 | - | - | - | - |
| T4 | - | - | - | - |
| R1 | 0.0045 | 0.0211 | 0.1156 | 0.0359 |
| R3 | - | - | - | - |
| R4 | - | - | - | - |
| L1 | 0.1147 | 0.0000 | 0.1341 | 0.0000 |
| L2 | 0.3250 | 0.0000 | 0.1658 | 0.0000 |
| M1 | 0.1166 | 0.0000 | 0.1230 | 0.0000 |
| M2 | 0.1014 | 0.0000 | 0.1552 | 0.0000 |
| M3 | 0.1254 | 0.0000 | 0.3125 | 0.0000 |
| E1 | 0.1030 | 0.0000 | 0.1311 | 0.0000 |
| E2 | 0.1141 | 0.0000 | 0.1115 | 0.0000 |
| Indicator | Shiitake | Coarse Cereals | Fruit | Livestock | Chinese Herbal Medicine |
|---|---|---|---|---|---|
| T2 | 0.84 | 0.85 | 0.8 | 0.94 | 0.83 |
| T3 | 0.2 | 0.22 | 0.18 | 0.21 | 0.19 |
| T5 | 0.75 | 0.73 | 0.83 | 0.82 | 0.81 |
| T6 | 0.16 | 0.18 | 0.2 | 0.22 | 0.23 |
| R2 | 0.85 | 0.91 | 0.88 | 1.03 | 0.93 |
| L3 | 0.78 | 0.72 | 0.79 | 0.8 | 0.77 |
| L4 | 0.19 | 0.21 | 0.21 | 0.20 | 0.23 |
Publisher’s Note: MDPI stays neutral with regard to jurisdictional claims in published maps and institutional affiliations. |
© 2021 by the authors. Licensee MDPI, Basel, Switzerland. This article is an open access article distributed under the terms and conditions of the Creative Commons Attribution (CC BY) license (https://creativecommons.org/licenses/by/4.0/).
Share and Cite
Niu, N.; Li, X.; Li, L. Exploring the Spatio-Temporal Dynamics of Development of Specialized Agricultural Villages in the Underdeveloped Region of China. Land 2021, 10, 698. https://doi.org/10.3390/land10070698
Niu N, Li X, Li L. Exploring the Spatio-Temporal Dynamics of Development of Specialized Agricultural Villages in the Underdeveloped Region of China. Land. 2021; 10(7):698. https://doi.org/10.3390/land10070698
Chicago/Turabian StyleNiu, Ning, Xiaojian Li, and Li Li. 2021. "Exploring the Spatio-Temporal Dynamics of Development of Specialized Agricultural Villages in the Underdeveloped Region of China" Land 10, no. 7: 698. https://doi.org/10.3390/land10070698
APA StyleNiu, N., Li, X., & Li, L. (2021). Exploring the Spatio-Temporal Dynamics of Development of Specialized Agricultural Villages in the Underdeveloped Region of China. Land, 10(7), 698. https://doi.org/10.3390/land10070698