Article

Micro-Geographies of Information and Communication Technology Firms in a Shrinking Medium-Sized Industrial City of Ostrava (Czechia)

1
Department of Human Geography and Regional Development, University of Ostrava, 702 00 Ostrava, Czech Republic
2
Cultural Centre- Ostrava-Jih, 700 30 Ostrava, Czech Republic
3
Department of Regional and Rural Development, Slovak University of Agriculture in Nitra, 949 76 Nitra, Slovakia
4
Autocont a.s., 702 00 Ostrava, Czech Republic
*
Author to whom correspondence should be addressed.
Land 2021, 10(7), 695; https://doi.org/10.3390/land10070695
Submission received: 28 May 2021 / Revised: 25 June 2021 / Accepted: 28 June 2021 / Published: 1 July 2021
(This article belongs to the Special Issue Cities' Spatial Structure and Drivers of its Transformation)

Abstract

:
We aimed to explain the spatial distribution of information and communication technology (ICT) firms in the city of Ostrava as an example of a medium-sized, shrinking, polycentric industrial city. The primary research question was to what extent micro-geographic location factors affect the current spatial clustering of ICT firms in polycentric cities characteristic by relatively weak urbanization economies and mostly routine character of ICT activities. We analyse and test the effects of the urban form at the level of urban blocks and individual buildings (considering their height, technical condition, age and dominant function) on the clustering of ICT firms of various sizes and ownership statuses. The inquiry was based on a detailed field mapping (using ArcGIS Collector) of ICT firms and physical/functional characteristics of the buildings and their immediate surroundings. ICT firms are significantly spatially concentrated in the historic city centre and inner city. Spatial patterns of ICT firms focused on less knowledge-intensive, routine and/or lower value-added functions do not differ fundamentally from innovative firms developing new products. Preference of denser, walkable, mixed-use neighbourhoods in urban cores/inner cities can be found in the group of firms focusing on routine functions: rather for larger than for smaller firms and domestic than foreign-owned firms.

1. Introduction

Economic growth and competitiveness of cities and regions in developed countries have been increasingly associated with the knowledge economy (KE) [1]. Knowledge-intensive business services (KIBS) are among the most important components of the KE [2]. Their spatial clustering in large cities is driven by a combination of demand and supply factors [3], including the population/firm density and diversity [4], proximity to their principal customers/suppliers [5] and accessibility [6]. ICT firms, the key actors of economic, employment and innovation dynamics in many metropolitan regions [7], are among the most spatially concentrated KIBS not only at a regional but also at an intra-urban level. Their tendency to form clusters and hubs is driven by various kinds of agglomeration economies [8,9].
Agglomeration economies attenuate sharply with increasing horizontal distance (e.g. [7,10,11,12,13,14]) and vertical distance in buildings [15]. Hawken and Han [16] documented the relevance of 3D economic heterogeneity measured at the most fine-grained spatial level of urban blocks/buildings for the location of economic activities in commercial downtowns and designing urban innovation districts. As Rosenthal and Strange [17] (p. 1) argued, “… agglomeration effects operate below the neighbourhood level, including within buildings and organizations”. Therefore, growing empirical evidence suggests that a comprehensive understanding of the spatial distribution of knowledge-intensive business services in cities requires spatial analysis at the level of urban blocks and individual buildings, as proposed in this paper.
ICT firms, mostly representants of a synthetic knowledge base [18], are likely to locate where they can maximize their economic output and minimize their costs [9], following the spatial distribution of their principal suppliers and customers [19]. Concentration into CBDs and inner cities can be expected only if their parent companies, key suppliers or customers have located there (cf. [20]). If not, ICT firms should develop in less dense suburban locations to capitalize on: i. lower rents [21]; ii. collocation with manufacturing companies as their customers [22]; iii. proximity to large (technical) university campuses, office parks, science parks and research institutes [21,23] that are often located in suburban localities near the junctions of major highways [22]; iv. proximity to the residential suburban neighbourhoods that might serve as their labour pools. Suburban (car-dependent) “scientific neighbourhoods”, where ICT firms are expected to cluster, are characterized by the low–medium firm and street density, modern (higher) monofunctional buildings, few public/private places allowing for meetings (parks, cafes, restaurants, bars) and inauthentic atmosphere [24].
Nevertheless, a trend of increasing spatial concentration of digital economy, ICT firms (and other knowledge-intensive business services) into dense inner-city “creative/cool neighbourhoods” has also been observed [22,25,26,27]. These neighbourhoods are characterized by high physical, social and functional diversity [28], high firm density, walkability [21] and a mix of (older) buildings diverse in size, height, age, size and public–private interface [28,29] that are not always in perfect technical condition [26]. The local intersection of morphological diversity, socio-economic diversity (activities associated with bohemians, rich gentrifiers and local communities with lower social status) and functional diversity (consumer services, culture, amenities, housing) favour localized creation and dissemination of knowledge. Besides, the creation of new ICT clusters influences the transition of urban space and its reterritorialization [26] and may be connected with the revitalization and transindustrialization of post-industrial cities [30], which means that the process of functional transformation of post-industrial cities may follow different paths, including development based on high-tech industries [31,32].
Correspondingly, there has been growing awareness that “macro” localization factors such as proximity to the CBD, transport infrastructure, major universities or technology parks—while important [33]—cannot sufficiently explain geographies of ICT (or more generally, knowledge-intensive services) firms at the intra-urban level. Their spatial dynamics can be significantly affected by morphological, demographic, social and cultural factors and functions found in a firm’s immediate neighbourhoods [34]. Location factors at the micro-geographic scale might be relevant for all ICT firms, those located in isolation, clustered in creative neighbourhoods or scientific neighbourhoods. According to Adler et al., “Micro-clusters work to harness the Marshallian (as opposed to Jacobian) benefits of a deeper spatial division of labour” [35,36,37].
In this paper, we mapped the current micro-geographies of ICT firms in the medium-sized polycentric industrial city of Ostrava (Czechia). We aimed to contribute to the theoretical discussion on the spatial distribution of knowledge-intensive business services at the intra-urban level in several ways. Firstly, the paper contributes to the discussion of the role of urban contextual factors in the location patterns of ICT firms. While recent studies focused mostly on economically highly developed, tertiarized, large metropolitan regions (e.g., Montreal, Toronto and Vancouver [12,13]; Barcelona [14]), we offer empirical evidence from a polycentric, highly industrialized medium-sized city. Besides that, on the empirical level, the paper contributes to the discussion on the functional and morphological transformation of urban spaces in Central European post-industrial (e.g., Bielsko-Biała [38], Cracow [39], Warsaw [40]) and post-mining cities (e.g., Katowice conurbation in Poland [32], Karviná and Orlová in Czechia [41]) that are still less described than their Western European counterparts [42]. The question was whether the clustering of ICT firms in dense, walkable inner-city neighbourhoods also occurs in cities characterized by relatively weak urbanization economies, a lower degree of centrality and a routine character of ICT activities [43], where rather dispersed spatial patterns of ICT firms (motivated by lower rents) could be expected (see [44]).
Secondly, we focused on spatial patterns of firms performing mostly routine and lower value-added production that prevail in the ICT sector of Ostrava [43]. These firms are not likely to capitalize significantly on local buzz (see [45] for the concept). Therefore, we asked whether routine ICT firms cluster in dense, walkable, amenity-rich inner-city neighbourhoods even when they are not likely to capitalize on localized knowledge creation and dissemination.
Thirdly, we compared location patterns and neighbourhood characteristics of small/medium and large firms. We expected that larger firms depending more on intra-firm and/or extra-regional knowledge networks may prefer suburban settings as suggested by Spencer [24]. Smaller firms, start-ups and individual entrepreneurs, on the other hand, should cluster more in walkable neighbourhoods located in the inner city [21] or may be collocated with the place of residence to reduce costs. We also compared location patterns of domestic and foreign-owned firms.
Finally, we conducted a detailed field survey and for each ICT firm. We collected a highly detailed description of the respective buildings (height, age, function and technical condition) and their immediate surroundings (50 m perimeter). Therefore, location factors were analysed at the most fine-grained spatial level possible, following the recent focus of several important studies on a micro-geographic scale [16,46,47,48,49].
In the following section, we discuss theoretical aspects of the intra-urban location of ICT firms, focusing on the role of micro-geographic location factors. The third section summarizes data and methods. In the fourth section, a brief contextualization of the city of Ostrava is provided. The fifth section includes the basic results of statistical tests and mapping. In the sixth section, we discuss our findings in regard to those of other authors and consider the limits of the research, while in the seventh section, conclusions and implications for future research are drawn and policy recommendations are provided.

2. Spatial Distribution of ICT Firms in Cities: The Role of Micro-Geographic Location Factors

Let us start with a discussion on why and how physical and functional urban structures can affect the localization of ICT firms. Population firm, built-up volume and institutional densities may support clustering of ICT (KIBS, creative) firms through the reduction of distances, easing of face-to-face contacts, and increasing frequency and probability of accidental meetings that may foster localized (tacit) knowledge creation and spillovers [28]. Correspondingly, the magnitude of agglomeration economies [10,11,13,15,50,51,52] sharply attenuates with increasing distance. However, a distance decay should be expected, mostly for knowledge spillovers [11,53]. Other mechanisms related to localization economies (input–output linkages, sharing of infrastructure and specialized suppliers) are less distance sensitive and may materialize at the level of an urban region [11]. While face-to-face contacts and (tacit) knowledge spillovers are more important for innovative than for routine economic activities [49], reduction of transport/transaction costs through agglomeration and labour market pooling/sharing of suppliers may also be relevant for standardized production activities.
Another question is the relationship between the urban form and the location of ICT firms. More specifically, do spatial patterns of ICT firms and jobs differ significantly among various types of urban structures? Do ICT firms cluster in compact, dense, amenity-rich and walkable neighbourhoods the way firms in creative industries do (see [54]), or are they rather dispersed and located in lower-cost suburban residential or commercial areas? To answer these questions, we distinguished among several basic types of urban structures (organic, urban blocks, estates and high rises, mixed building types and low-density residential and commercial structures) and discussed their potential relationships with the location of ICT firms and jobs (the typology is based on the approach of [55,56]).
The organic urban structure is characterized by high built-up volume density, (usually) irregular blocks of houses, squares and streets designed mainly for pedestrian traffic. These urban structures can be found in the oldest parts of urban cores. While the high aesthetic value of buildings, residential “coolness”, amenities, concentrations of corporate headquarters and public institutions as important customers may create an attractive mix for ICT firms, high rents, land regulation and historic preservation may push firms outside of historical cores.
The urban block structure consists of compact, closed blocks of buildings, mostly from the second half of the 19th and the first half of the 20th century, connected by a regular hierarchical network of streets supplemented by parks. Some parts of these structures may be very attractive both for housing and entrepreneurship, combining the relatively high aesthetic value of buildings with amenity richness, walkability and presence of third places [57] including parks (see [58]), allowing for meetings and associated knowledge spillovers. Therefore, “creative neighbourhoods” [24] are likely to be found in this type of urban structure. Clusters of smaller ICT firms and start-ups might be present, capitalizing on the combination of lower rents (compared to CBDs) and the proximity of their major customers located in urban centres. In medium-sized industrial cities such as Ostrava, however, these creative clusters may be rare and small, covering only a couple of streets or blocks.
Estates and high rises are densely populated residential neighbourhoods where buildings are surrounded by greenery and relatively generous parking places. Despite the lower aesthetic value and residential “coolness”, these structures may be relatively rich in public amenities that are concentrated around main public transport stations. Ground floors of high-rise blocks may be suitable for small-scale entrepreneurial activities, while larger firms may use modern monofunctional buildings.
Low-density urban structures consist of three similar urban structures: the garden city urban structure, single-detached houses and paired villas and row houses (see [55]). Despite their relatively high residential attractivity, these neighbourhoods are usually not amenity-rich and are not expected to attract a significant portion of ICT employment. We expected scattered patterns of small firms that are bound to the residence of their respective owners.
Mixed building types are relatively densely populated urban structures combining compact blocks and semi-open blocks. These neighbourhoods usually gravitate around a square surrounded by a compact building block, where potential clustering of ICT firms can be expected, and an outer ring of lower density residential or commercial premises. High physical and functional diversity and the intersection of commerce, residential function and public services might be conducive for the development of ICT firms.
Association between the built form and spatial patterns of knowledge-intensive economic activities [26,59] might manifest not only at the level of city neighbourhoods [7], but also at the level of urban blocks or buildings [16,28,60]. If the location patterns of (small) ICT firms resemble those of creative industries, as suggested by Duvivier et al. [22], they might prefer older (built before 1945) former industrial or warehouse buildings on smaller grain lot sizes, lower than five storeys high, that are not necessarily completely renovated [28] and that should be located in dense, permeable and walkable neighbourhoods characterized by mixed land use, a mix of functions and abundant urban amenities. On the other hand, if the concept of “science neighbourhoods” [24] is relevant for capturing spatial patterns of ICT firms and jobs, high-rise modern monofunctional buildings on large lots in monofunctional neighbourhoods can be expected.
The effects of micro-geographic location factors on the spatial distribution of ICT firms should be considered in the geographical context of the shrinking polycentric post-industrial metropolitan region. Urban shrinkage and a gradual shift of population from dense centres/inner cities towards suburban zones [56,61,62] are associated with relatively low rents in the city centres/inner cities, “creating thus a vast market for inexpensive and ‘accidental’ development” [63] (p. 5). Affordable real estate and general availability of space allow for the construction of office parks/buildings in inner cities. Nevertheless, the expansion of ICT firms in city centres/inner cities in cities such as Ostrava is constrained by perforated urban structures, brownfields, vacant/derelict land and perhaps also by the attractivity of the secondary business districts (see also [64,65]) outside the historical urban core for standardized and lower value-added services [9].
Relationships between the built form and ICT firm location might differ significantly among firms of various sizes and ownership statuses. Larger and foreign-owned firms should be less sensitive to the spatial differentiation of rents. We expected them to locate either in completely renovated historic buildings in the urban core or modern monofunctional high rises along the main streets in inner cities or suburbs. Smaller (domestic) firms may be bound to the place of residence and over-represented in estates and high rises and low-density urban structures. On the other hand, if the finding of Duvivier et al. [22] that ICT firms start to resemble creative industries in their location requirements is relevant for Ostrava, smaller and domestic firms should cluster in inner cities, preferring former industrial/warehouse (now polyfunctional) buildings of high aesthetic value that are not necessarily completely renovated [26,60]. We expected that the immediate surroundings of larger firms would be monofunctional and specialized in commercial functions (services), while the immediate neighbourhoods of smaller firms would be characterized by a mix of functions.

3. Case Study of Ostrava

Ostrava is the core of an old metropolitan industrial region that is still characterized by relatively high specialization in traditional heavy manufacturing industries. In the transformation period since 1989, the city has experienced population shrinkage [9], a dramatic fall of industrial employment, the closure of the last coal mine (1994) and a rapid shift towards service employment and the service economy. The transformation and decline of industrial production altered the spatial–functional structure of the city and created a possibility for new economic activities (mostly services) to locate and develop in former industrial buildings [66].
According to Zarecor (p. 13), “Ostrava as a city is still physically oriented around its socialist-era scaffold, but now the nodes of its economic network have changed… To regenerate itself, the city repurposed its industrial nodes, the steel mills, coal mines, and state-run businesses that were the foundation of the socialist economy and replaced them with shopping malls, tourist sites, office towers, light industry, and research parks” [67] (see also [68]). Although the inner city has largely maintained its industrial character [59], the location of knowledge-intensive business services has been constrained by the typical problems of Central European post-industrial or post-mining urban regions (see [63,69]): perforated and often erratic urban structure, the emergence of large brownfields [41,56,59,60,61,62,63,64,65,66,67,68,69,70,71,72,73], vacant or under-used land and socially excluded localities [74]. On the other hand, unlike many other shrinking cities, Ostrava has no significant problem with empty flats that would require the demolition of entire residential buildings [70].
As already suggested, the urban structure of the city is polycentric, historically formed by spontaneous growths of coal mining, metallurgy/other heavy manufacturing industries, settlement and services [50,75]. The organic urban structure represents only a small central area in the historical core, which can be explained by the relatively short industrial history of Ostrava [56] and insensitive reconstruction of the historic centre in the second half of the 20th century. Therefore, the street pattern is rather regular, resembling more the urban block structures in inner cities such as Prague. In the socialist period, 1948–1989, Ostrava (and other socialist cities) were surrounded by a concrete ring of housing estates [65] and newly built or extended industrial complexes. The polycentric character of Ostrava has been thus multiplied by the construction of new residential areas (sub-centres) in the western part (Poruba) and southern part (Ostrava-Jih), which “resulted in the emergence of a city comprising three spatially divided areas arranged in the shape of an equilateral triangle” [76] (p. 4) and the development of three commercial subcentres.
Like many other Central European shrinking cities [76], Ostrava has lost its population as a consequence of three major interrelated processes: demographic transition, suburbanization and a partial decline of mining and heavy manufacturing followed by a shift towards the service-based economy (see [65]). The development of ICT industries, mostly driven by an inflow of foreign direct investment [77] and supported by regional political representation, was an integral part of the city economic transformation. An important stimulus for ICT development was the expansion of information science at the Technical University of Ostrava [78].

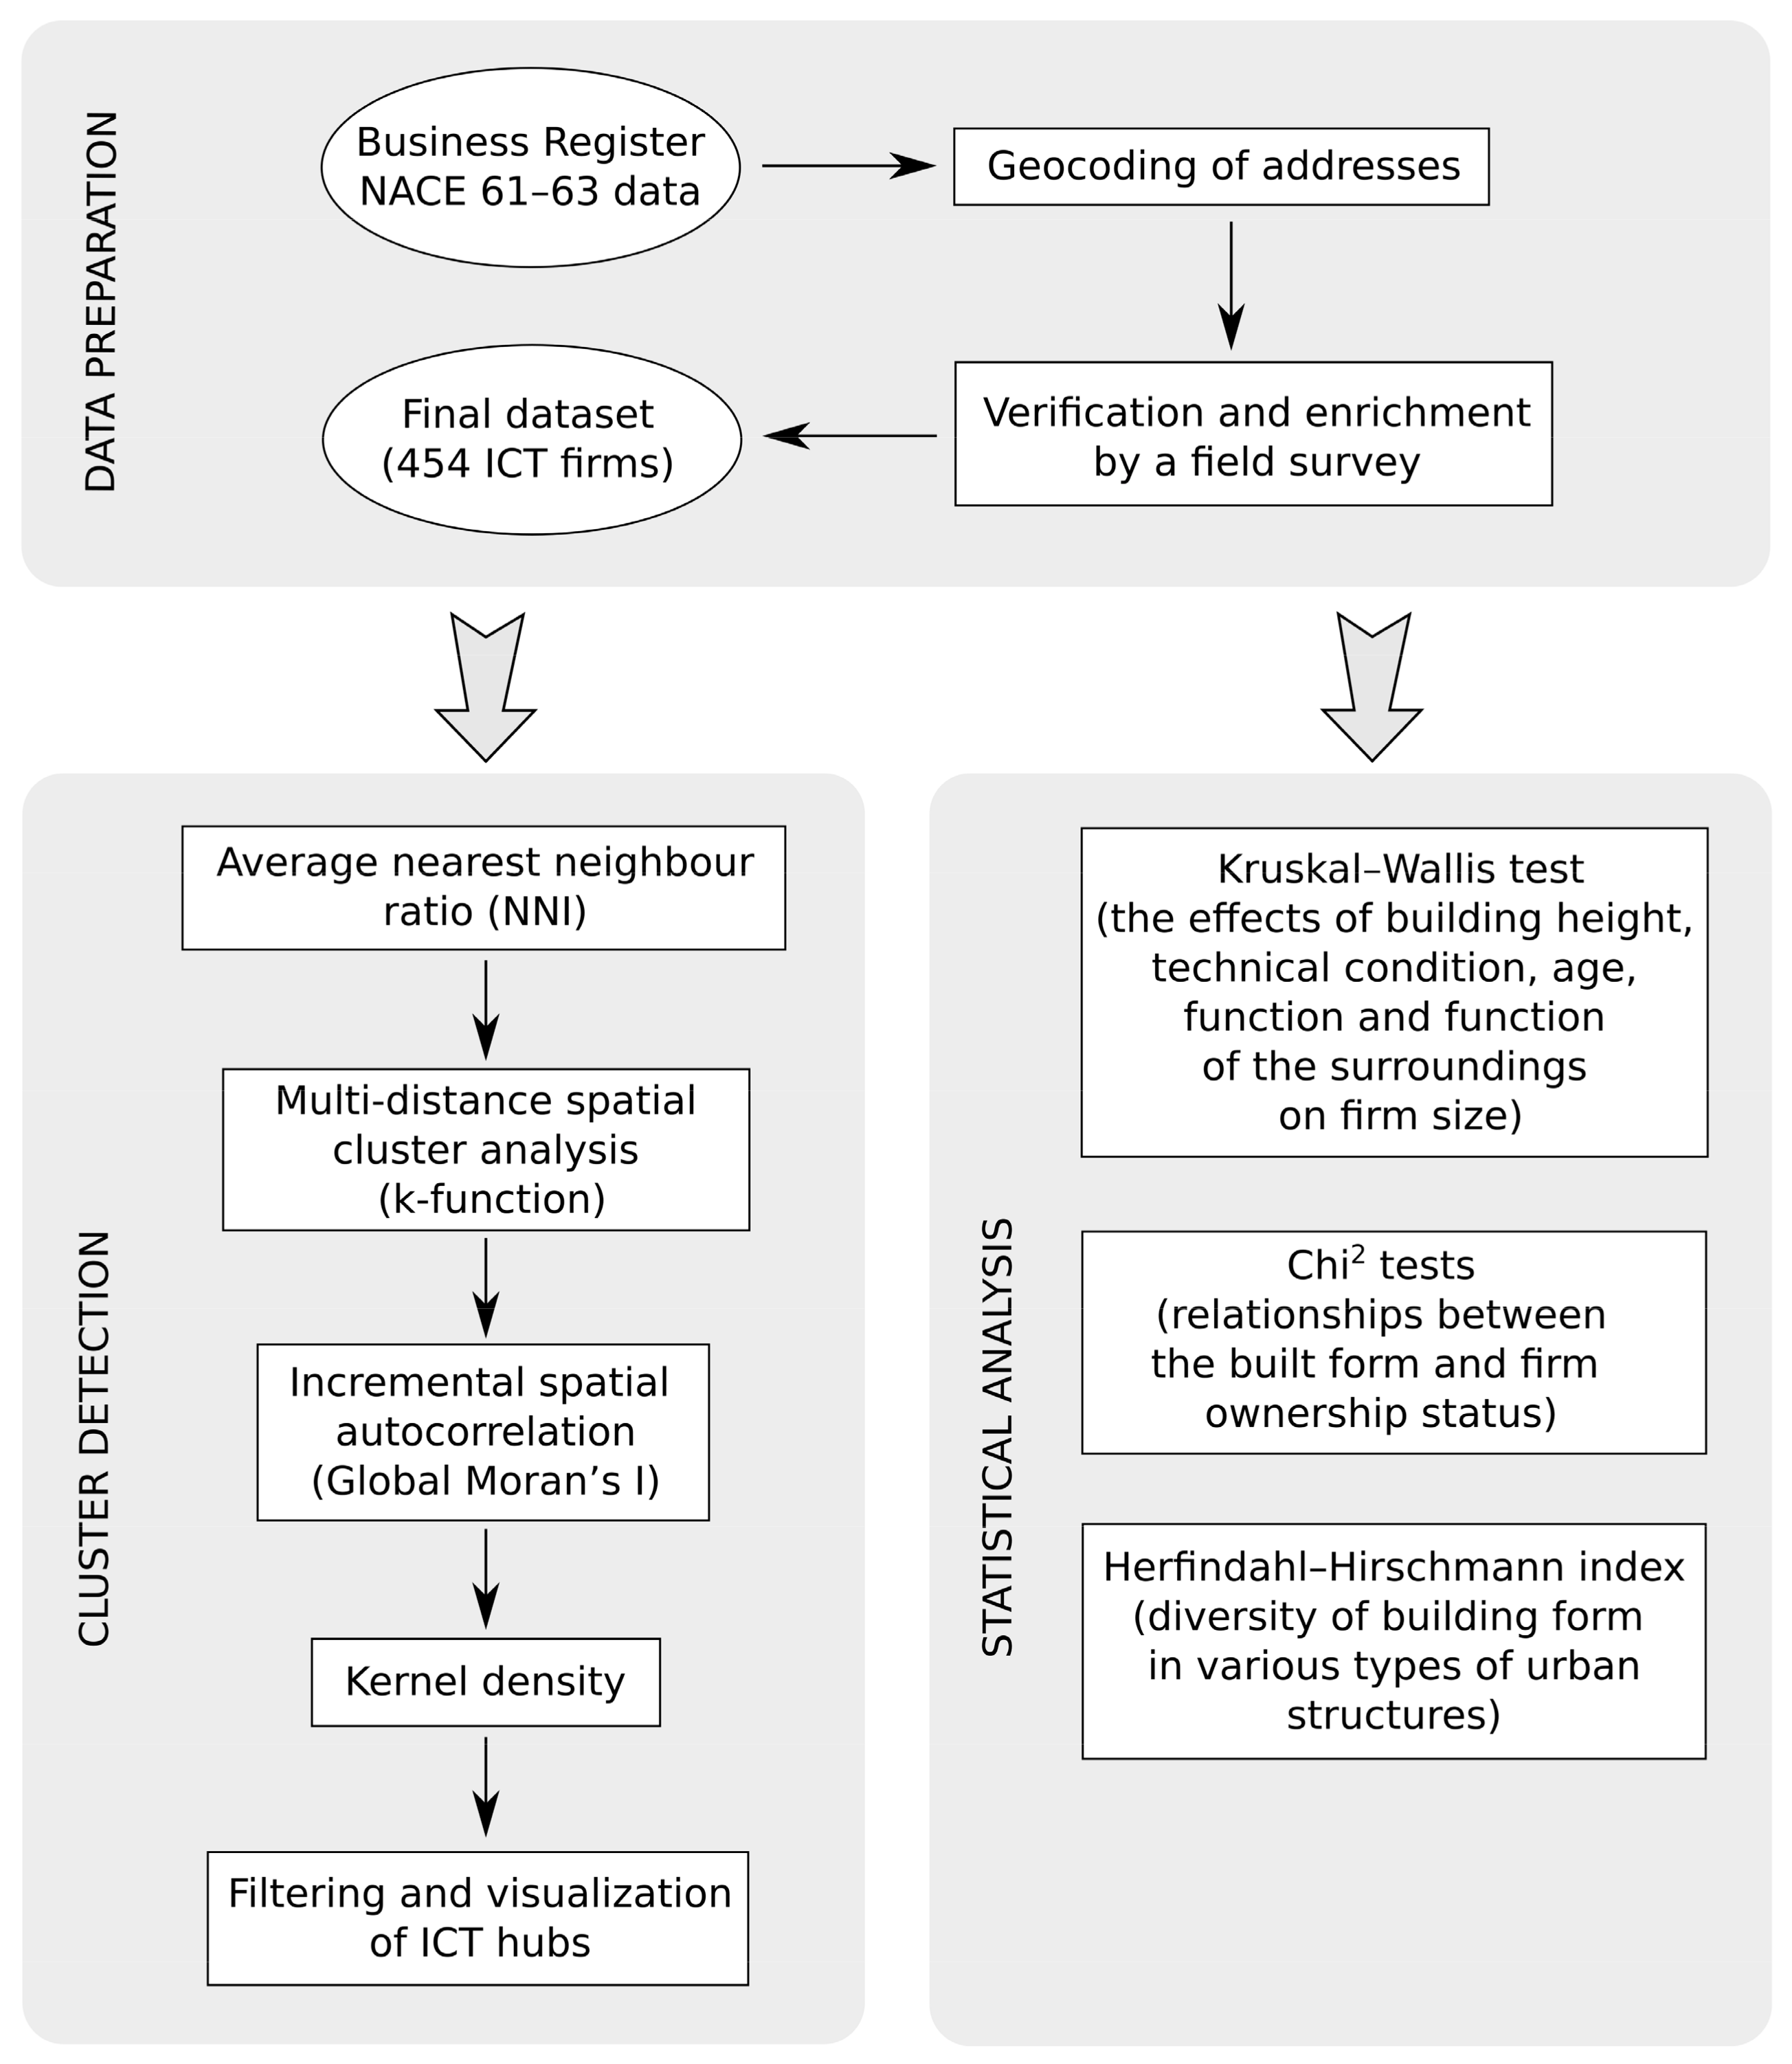
4. Materials and Methods

The initial source of data was the Business Register by the Czech Statistical Office. The Register records firms, which are legal entities, and self-employed workers [79]. For our research, we selected only firms classified in the following NACE divisions: 61—Telecommunications, 62—Computer programming, consultancy and related activities and 63—Information service activities. Data from the Business Register were obtained via the information system ARES maintained by the Ministry of Finance (2019). Data were subsequently the subject of a detailed survey aimed to verify the primary NACE division (Figure 1). Only firms with NACE divisions 61/62/63 as their primary economic activity were included. Then, data were geocoded and verified by field research using the Collector for ArcGIS application. The existence of the firm at the given address was checked, new firms (not listed in the Business Register) were mapped, and the database was supplemented with additional data on the physical condition of the buildings and the function of their surroundings. This procedure proved to be very beneficial, as it turned out that the data from the registry are burdened with a high error rate. The input records were outdated, incomplete or irrelevant. A common problem was a discrepancy between the official location of the firm’s headquarters and their actual locations, resulting in several cases in the identification of the “false hubs”.
The field survey identified and located a total of 454 ICT firms, of which 32 firms were classified under telecommunications (NACE 61) and the remaining 422 firms under the IT group (NACE 62 and 63). Another significant problem was determining the size of firms in terms of employment. The register lists only employment categories (range of the number of workers) when the number refers to the firm as a whole, and the numbers of employees for branches are not available. We tried to verify the current number of employees by interviewing companies, studying web resources, researching companies’ annual reports and studying information about companies listed in the official materials of the city of Ostrava. In a few cases where the data could not be verified, 60% of employees were assigned to the company’s headquarters and the remaining number was evenly distributed among the branches.
In addition to traditional visualizing cartographic methods, localization patterns were analysed in GIS using several spatial statistics methods to answer the question of whether the firms were creating clusters (here we call them hubs). Such a task could be based only on a visual analysis of spatially visualized data; however, the use of spatial statistics underlies this estimate by numerical tests and makes it more reliable [80]. We analysed data using tools average nearest neighbour, k-function, kernel density and incremental spatial autocorrelation.
The average nearest neighbour tool measures the distance between each event (here firm) and its nearest neighbouring feature. It then averages all these nearest neighbour distances. If the average distance is less than the average for a hypothetical random distribution, the distribution of the features is considered clustered. If the average distance is greater than a hypothetical random distribution, the firms are considered dispersed. The average nearest neighbour ratio (NNI) is calculated as the observed average distance divided by the expected average distance. If the resulting index is less than 1, the pattern exhibits clustering. If the index is greater than 1, the trend is toward dispersion.
Although the NNI is a useful index for the initial assessment of spatial patterns, as a single value it does not tell much about the way individual features are distributed in the pattern. Quite a common approach to analysing point distributions is to use a k-function working with a range of distances from every feature [81]. The method has also recently been used by several authors for the identification of knowledge-intensive business services at the urban scale [82,83]. The k-function, which considers all features and provides the standardized average number of features at the distance d from any feature, is used to provide greater detail on how the firms are clustered in space [9]. Within the ESRI ArcGIS Pro multi-distance spatial cluster analysis tool, a common transformation of the k-function, often referred to as L(d), is used. Then, the expected k value is equal to distance. The k-function is given as:
L d = A i = 1 n j = 1 , j 1 n k i , j π n n 1
where d is the distance, n is the total number of features, A is the total area of the features and ki,j is a weight. If there is no edge correction, then the weight is equal to one when the distance between i and j is less than d and equal to zero otherwise. Using a given edge correction method will modify ki,j slightly.
The kernel density method is a density method having its main use in geovisualization, i.e., to express the continuous spatial density of the observed phenomenon [81]. The method calculates the density of features in any area of the studied region, not only in places with the existence of features. Density is estimated by counting events in an area or core centred at the point where the estimate is to be made, with each point being replaced by a three-dimensional moving function. The population field can be used to weigh some features more heavily than others or allow one point to represent several observations. The density estimation is then calculated as:
f ^ h x = 1 n i = 1 n K h x x i = 1 n h i = 1 n K x x i h
where K is a kernel-smoothing function, h > 0 is bandwidth-defining smoothing and Xi are individual objects (in our case, firms).
The variable h is of key importance here, as this parameter controls the variance of the density function K. If the bandwidth is set too large, the estimated densities will be similar everywhere and close to the average point density of the entire study area. If the bandwidth size is too small, the surface pattern will focus on individual point records. Krisp and Špatenková [84] stated that experimentation is necessary to derive the optimal bandwidth setting to achieve a satisfactory result. However, this procedure requires knowledge of the nature of the processes that determine the creation of spatial patterns. To support the appropriate determination of bandwidth, we used spatial autocorrelation (based on the Moran’s I criterion) with all possible distances.
Incremental spatial autocorrelation uses the Global Moran’s I tool for a series of increasing distances measuring the intensity of spatial clustering for each distance. Z-scores reflect the intensity of spatial clustering, and statistically significant peak z-scores indicate distances where spatial processes promoting clustering are most pronounced. These peak distances are often appropriate values to use for tools with a distance bandwidth or search radius parameter.
To test the effects of building height, technical condition, age, function and function of the surroundings on firm size (employment), we used the Kruskal–Wallis test (Table 1). Relationships between the built form and firm ownership status were tested by Chi2 tests. Diversity of the building form in various types of urban structures was measured by the Herfindahl–Hirschmann index, which was calculated from the percentual shares of individual types of buildings (from the viewpoint of height, condition, age and function).

5. Results

First, we analysed the average distance between firms’ positions using the average nearest neighbour tool. The result for observed mean distance was 135 meters, and for expected mean distance, 343 meters. The NNI thus reached 0.39, indicating that the pattern showed statistically significant clustering. The z-score value reached −24.7, and the city area size was used in the area parameter. The distribution of firms was further analysed using multi-distance spatial cluster analysis, which is based on Ripley’s k-function. We used 10 distance bands with an increment of 343 meters and ran the analysis twice to compare clustering of unweighted (feature locations alone) and weighted (number of firm employees) firms. The confidence envelope was computed against 99 random distributions, and the area parameter was used again in this calculation. Both methods demonstrated clustering of firms, with significant differences between the L-functions of the weighted and unweighted input data (Figure 2). Up to a distance of 500 m, the observed weighted L-function shows an almost double rate of clustering compared to the observed unweighted L-function. Within the entire analysed distance, the clustering of the weighted variant was approximately on average 40% higher than the unweighted variant. From a distance of 1900 m, the weighted observed L-function rises above a higher confidence envelope and shows statistically significant clustering.
For the needs of suitable geovisualization of hubs using the kernel density method, we used incremental spatial autocorrelation to determine the distance bandwidth parameter. We used 10 distance bands with a beginning distance and an increment of 135 m without row standardization. Only one max peak at a distance of 675 m was detected. Subsequently, hubs were modelled using kernel density. The number of employees was used in the population field and the search radius was set to 675 m. The result was stored in a raster with a 10-m cell size. Subsequently, the hubs were extracted by filtering the values on the 99th percentile and visualized using a multi-part colour scheme. The results of this procedure were nine well identifiable ICT hubs within the city (see Figure 3 and Figure 4).
Hub A (roughly 200 jobs) is located in the northeastern part of the city centre in an organic urban structure type. The hub consists of small- to medium-sized ICT firms located in old but renovated commercial multifunctional buildings. The area is characterized by a mix of functions, the location is very well served by public transport and the central square is within walking distance. However, two major concentrations of ICT firms can be found in office parks, not in authentic historic buildings (Figure 5).
Hub B (more than 700 jobs) can be considered as a wider city centre (Figure 6). The area is dominated by the urban structure of mixed building types, where older multifunctional buildings dominate in turn. ICT companies of all sizes are represented, of which the most important is the transnational corporation OKIN BPS. On the west side, Hub B is bounded by a railway, which creates a significant barrier. However, there is a local train station, and other public transport is within walking distance. To the south, the New Karolina shopping centre is located, negatively affecting the retail development in the historic centre of Ostrava [85].
Hub C (more than 1000 jobs) is located in an urban structure of mixed building types that have been recently divided by a four-lane road on which a modern office complex has been built (Figure 7). Even though it is the biggest office complex in Ostrava (34,000 m2), it is used by only a few companies, the largest being Autocont and OKIN BPS (both 250+ employees). In the immediate vicinity, there is the Fifejdy housing estate with a population of more than 6000.
Hubs D (3000 jobs), E (1800 jobs) and F (300 jobs) are located on the major street 28. října, forming an axis of the area (Figure 8, Figure 9 and Figure 10). The mixed building type urban structure dominates. While several small- and medium-sized firms are present, large firms account for the majority of ICT employment. The biggest ICT firm, Tieto Czech with approximately 2400 employees, is located in a modern and rather inauthentic office building (Figure 7b) similarly to a majority of other large firms.
Hub H is the smallest identified hub with approximately 150 employees. Several small- to medium-sized ICT firms reside here. It is located at the northeastern edge of the most populated city district, Ostrava-Jih. The urban structure is formed by single detached houses, and the surroundings are residential or mixed function. Buildings with ICT firms are in good or excellent condition, and the function of these buildings is commercial monofunctional or partly residential. Rudná Street, which currently forms the main west–east traffic axis, passes close to the hub.
Hub I (450 jobs) is located in the western part of the city in the Ostrava-Pustkovec district (Figure 10). It can be found at the end of the wider strip of services comprising the Technical University of Ostrava and University Hospital of Ostrava. Thanks to the expressway the location is easily accessible for commuters by car. The hub consists of several small- to medium-sized firms and start-ups located in new buildings of Science Technology Park, the Business Incubator of the Technical University Ostrava or the EU-funded IT4Innovations National Supercomputing Centre. The total employment in ICT is approximately 450 employees.
Identification of hubs shows that the vast majority of ICT firms (51.5%) and jobs (74.6%) in Ostrava are located at urban structures characterized by a mix of buildings of various sizes, architectonic styles and functions (Table 2). The second-highest number (13.4%) of ICT firms resides in the estates and high rises, followed by the monofunctional areas dominated by services, mostly the university campus. The historic core accounts for 9.5% of firms and only 3.8% of jobs, amounts roughly comparable with those of the low-density urban structures. Almost no presence of the ICT sector was found in the urban block structures around the historical core.
The diversity of buildings hosting ICT firms varies significantly among various types of urban structure. Not surprisingly, the highest diversity of buildings (apart from height) and their surroundings was found in the structure of mixed building types and the lowest in the organic urban structure of the historical core. Generally, both the physical and functional diversity of buildings where ICT firms reside and their surroundings is relatively high. The expectation that ICT firms reside primarily in monofunctional buildings and neighbourhoods was not supported by empirical evidence.
Large firms are almost exclusively found in mixed building urban structures and industrial/service-oriented monofunctional areas. Almost half of small firms and self-employed ICT workers are also located in mixed building types. Nevertheless, they are also significantly represented in the organic structure of the historic core and residential buildings in estates/high rises and low-density urban structures, which distribution is characteristic of the small mean employment size of ICT firms. There was no direct relationship between firm size and building density: the dense organic and low-density suburban structures were characteristic of small firms, while relatively dense mixed building structures generally hosted larger firms (Table 2 and Table 3).
Large and small- to medium-sized firms also differed in their preference for buildings. Except for building height, all other variables (building condition, age, function and functions in the surroundings) showed statistically significant effects in regard to firm size (Table 4). While 45.8% of firms reside in buildings 3–4 storeys high, 50.4% of jobs are found in 5+ storey buildings. Large firms prefer high rises significantly more than smaller firms (up to 5 workers), the latter of which reside mostly in 3–4 storey (46.8%) and 5+ storey (30.9%) buildings (Table 2). Almost half of small firms can be found in partly renovated buildings, while larger firms are located mostly (not exclusively) in buildings in perfect technical condition. Only 12.8% of ICT firms reside in buildings built before 1945 of (usually) high aesthetic value. Surprisingly, 60.8% of firms stay in buildings built or fundamentally rebuilt in the socialist period, 1948–1989. Larger firms (50 and more persons employed) reside mostly in modern buildings (since 1989) that account for 60.6% of total jobs. More than half of all ICT firms (and 76.9% of those with 50+ persons employed) reside in commercial polyfunctional buildings, which also account for 81.5% of total ICT jobs. Small firms, on the other hand, are almost equally represented in residential and commercial polyfunctional buildings. In terms of surroundings, 53.7% of ICT firms are surrounded by mixed-use buildings and 28.2% by residential buildings.
Foreign-owned firms are mostly centrally located (Figure 11 and Figure 12) and can be found primarily in three types of urban structure: mixed building types (47.11%), monofunctional areas dominated by services (19.1%) and the organic structure of the historic urban core (14.7%) (see Figure 12). The spatial patterns of domestic firms and self-employed workers are not completely different: 52.5% of those subjects are located also in mixed-building-type structures.
Compared to foreign-owned firms, only 8.1% of domestic firms and self-employed workers are located in the organic urban structure, while a significantly higher share (15.0%) can be found in the estates and high rises. As expected, employment is higher in foreign-owned ICT firms (59.1%) compared to their domestic counterparts (18.3%). Domestic and foreign-owned firms are not fundamentally different in their preferences for various types of buildings. However, minor differences were found; foreign-owned firms prefer more modern buildings in perfect technical condition.

6. Discussion

We found strong support for the thesis that ICT firms resemble creative industries in their location patterns [22,54]. A high rate of clustering in the urban core and inner city was found. Comparison with previous papers [9,78] indicates that the spatial patterns of ICT firms and creative industries in Ostrava largely overlap. ICT companies form hubs in mixed-use, dense, walkable and accessible places in inner cities, capitalizing on the proximity of customers in CBDs and other locations [86,87]. Therefore, our empirical case study supports the narrative of the economy of inner cities [26,59] and the association between urban form and the clustering of knowledge-based industries in general [42] (p. 1). However, location patterns of ICT firms differ from creative industries at the level of urban blocks and individual buildings. The former are mostly found in larger, newly built (or recently rebuilt) buildings even though they are located in historic parts of the city. The majority of large (but also many small) ICT firms are located in dense walkable inner-city neighbourhoods. When looking at the level of particular urban blocks and buildings, ICT firms often reside in inauthentic modern office parks and commercial buildings with “closed facades” [88] that are not well connected to the locality. This finding might be partly explained by the fact that larger firms profit rather from urbanization economies over a wider geographical area (city/regional level) than from localization economies, which are characterized by a sharp distance decay function and mostly neighbourhood-level effects [14] (see also [89]).
Previous research on ICT (and more generally KIBS) firms in Ostrava and other large Czech cities shows that local firms focus primarily on routine, lower value-added functions [8] and incremental rather than radical innovations [90,91]. A significant portion of ICT firms in Ostrava focus on partial tasks for their parent companies located outside Czechia or in the capital city of Prague, relying on extra-regional knowledge pipelines [43] rather than on local buzz as a source of tacit knowledge. Departing from these results, we argue that the clustering of ICT around the urban core is not primarily motivated by localized knowledge spillovers. The geographical proximity paradox [92]—limited contacts between proximate firms—is relevant for ICT firms in Ostrava. Clustering on the edge of the city centre (documented also by Smętkowski, Celińska-Janowicz and Wojnar [64] in Warsaw or Helbich [93] in Vienna) is probably based on the combination of proximity to the CBD, customers and accessibility; rents in and around the CBD of a shrinking industrial city are not prohibitively high. Therefore, not only financial industries [94] and headquarters of large firms but also smaller firms and entrepreneurs can afford to stay in the CBD/inner city. We confirmed fully the findings of Smetkowski et al. [64] about the strong role of car accessibility and parking as important location factors in Central European post-socialist cities and, correspondingly, a tight relationship between the transport infrastructure and ICT hubs [33]. Despite the lower importance of rents in Ostrava, our findings support the previous conclusions of Dainov and Sauka [95], which suggested the key role of hard localization factors (access, parking, proximity to clients) for the localization of firms in creative and knowledge-intensive economic activities in four metropolitan cities: Budapest, Sofia, Riga and Helsinki.
In contrast with Spencer [24] or Zandiatashbar et al. [87], we found only limited empirical support for the development of ICT hubs in suburban low-density neighbourhoods. The suburban ICT hub in Ostrava-Pustkovec seems to benefit from the proximity of the Technical University of Ostrava and the available premises and institutional support of the Science Technology Park, the Business Incubator of the Technical University Ostrava and/or the EU-funded IT4Innovations National Supercomputing Centre [94]. Public support of firm incubation/growth [96], traditional Marshallian externalities and other benefits provided by the science and technology parks [97] are probably more important for smaller suburban firms than transport accessibility or lower rents. Our results confirmed the importance of clustering around the technological core for smaller firms, as suggested by Méndez-Ortega and Arauzo-Carod [37]. Therefore, we did not find empirical evidence supporting the thesis that shrinking industrial cities will be characterized by spatial dispersion or cost-motivated clustering of (routine) ICT activities in suburban locations (in line with Ženka et al. [9]).
Results of statistical tests showed significant effects of building condition and age (but not height), building function and function of the firm’s surroundings on the location patterns of ICT firms of various sizes and ownership statuses. Supporting partly the findings of Spencer [24] or Duvivier et al. [22], larger firms were found to reside more often in modern buildings in perfect technical condition, while smaller firms were more often found in older, not perfectly renovated premises. In contrast to their expectations, however, larger (and also foreign-owned) firms prefer commercial polyfunctional rather than monofunctional buildings, mixed-use rather than monofunctional immediate neighbourhoods (in line with Hawken and Han [16]) and central/inner-city locations rather than suburban locations.
Our results partly support the conclusions of Ó hUallacháin and Leslie [98], who documented the concentration of large KIBS firms and their headquarters in the CBD/inner city and spatial dispersion of small firms in the outskirts of the city of Phoenix in Arizona. Large (and foreign-owned) firms in Ostrava mostly do not reside in the historical core, preferring inner-city neighbourhoods of mixed buildings, land uses and functions close to the arterial streets. Accessibility, proximity to the urban core (customers), space for expansion and less strict or missing protection of historical monuments are probably the key location factors of large ICT firms in Ostrava and similar industrial cities. As Méndez-Ortega and Arauzo-Carod [37] suggest, large firms can internalize external resources and depend less on external economies. Therefore, small ICT firms show a bigger propensity to cluster in proximity to other ICT firms and prefer either denser, walkable, cool neighbourhoods in the historic urban core/inner city or suburban residential neighbourhoods (estates and high rises).

7. Conclusions

The spatial patterns of ICT firms observed in Ostrava might also occur in other medium-sized polycentric industrial (shrinking) cities. While a combination of low urbanization economies and polycentricity should favour firm dispersion or the formation of isolated clusters scattered around the city (see [44] for a related discussion of creative industries), clustering of (mostly small) ICT firms in the historic urban core (CBD) and its immediate surroundings might be expected (see also Slach et al. [78]; Ženka et al. [9]. There are several reasons for the higher attractivity of the CBDs and their immediate surroundings for ICT firms in medium-sized industrial cities compared to economically more dynamic large metropolitan regions such as Toronto, Sydney, London or Barcelona.
Firstly, walkable inner-city “cool neighbourhoods” of high aesthetic value might be limited only to a couple of streets or urban blocks, because these areas in shrinking industrial urban regions may preserve (at least partly) their original industrial function. Secondly, while potentially highly attractive, urban structures of these inner-city neighbourhoods are usually perforated by brownfields and vacant/underused land and their economic development constrained by pockets of social deprivation. Thirdly, attractive and renovated inner-city localities can be occupied by luxurious residential premises, cultural institutions [67,99], entertainment zones or other functions, leaving not enough space for the development of KIBS firms. Fourthly, shrinking industrial cities might be characterized by relatively low rents and available land even in the CBDs. Therefore, dense, walkable and amenity-rich neighbourhoods in the historic urban cores might be the most attractive localities for (smaller) ICT firms, considering the lack of high-quality dense urban spaces outside the central parts of the city. These findings further illustrate the value of the spatially highly disaggregated level of analysis and potential relationships between the building form and ICT location.
Our empirical evidence also shows that spatial patterns of ICT firms focused on less knowledge-intensive, routine and/or lower value-added functions are not necessarily fundamentally different from highly innovative firms developing new products. Preference for dense, walkable, amenity-rich and mixed-use neighbourhoods in urban cores and inner cities is not limited to innovators relying on localized knowledge spillovers and other potential benefits of urban density. Therefore, spatial patterns of ICT hubs and hubs of creative industries largely overlap in urban cores and inner cities. Similarities in localization preferences for creative and ICT industries are stronger for smaller than for larger firms and for domestic than for foreign-owned firms.
While located in dense, central and mostly walkable neighbourhoods, the majority of large and foreign-owned firms reside in modern, inauthentic buildings that are often not well integrated into the locality and rely rather on car accessibility. The prevalence of the routine and less knowledge-intensive character of the production together with the mostly extra-regional supplier–customer linkages and knowledge pipelines of ICT firms often correspond with the physical characteristics of their buildings, including the private–public interfaces. Although the majority of ICT firms are located in mixed building type urban structures, the firms are probably motivated by the availability of land, proximity to the CBD and car accessibility rather than by the physical, functional and social diversity of these urban structures.
Finally, authors dealing with the spatial distribution of firms at the intra-urban level should consider several major issues associated with data collection and analysis. It is necessary to check the accuracy, relevance and quality of the data obtained from publicly available sources such as censuses and business registers. Our detailed survey in the streets of Ostrava revealed that a high share of firms (81% in the urban core) listed in the Business Register either did not exist or were not found at their official addresses. Results might be distorted by differences between the official residence of a firm/corporate headquarters and the firm’s subsidiaries. Another source of confusion can be “fake hubs”, dozens of firms residing officially in a single building/street while having their economic activities located elsewhere. Although it is not possible to rely on field surveys in large metropolitan regions, we recommend checking the quality of datasets using small-scale, detailed case studies based on data collection in the streets.

Supplementary Materials

The following are available online at https://www.mdpi.com/article/10.3390/land10070695/s1.

Author Contributions

All authors contributed to the manuscript in a substantial way. J.Ž. did the conceptualization, designed and wrote the manuscript, and performed statistical analysis. L.K. was responsible for data curation, methodology, writing manuscript and visualizations. L.P. and T.P. cared about investigation, data verification and enrichment, K.R. contributed with supervision, editing and project administration at all stages, S.Š. participated in data curation and verification, V.S. performed literature review and manuscript editing, J.M. was responsible for software and formal analysis. All authors have read and agreed to the published version of the manuscript.

Funding

The authors acknowledge support from the Ministry of Education, Youth and Sports through the research grant “SMART technologies to improve the quality of life in cities and regions” (no. CZ.02.1.01/0.0/0.0/17_049/0008452).

Data Availability Statement

The data presented in this study are available as Supplementary Materials.

Acknowledgments

We would like to thank Ondřej Slach, Alexandr Nováček, Vojtěch Bosák and Petr Rumpel for the data covering urban structures in Ostrava. We also thank the Master’s students of Economic Geography and Regional Development for the data collection.

Conflicts of Interest

The authors declare no conflict of interest.

References

  1. Solis, E.; Karimi, K.; Garcia, I.; Mohino, I. Knowledge Economy Clustering at the Intrametropolitan Level: Evidence from Madrid. J. Knowl. Econ. 2021. [Google Scholar] [CrossRef]
  2. Romero de Ávila Serrano, V. The Intrametropolitan Geography of Knowledge-Intensive Business Services (KIBS): A Comparative Analysis of Six European and U.S. City-Regions. Econ. Dev. Q. 2019, 33, 279–295. [Google Scholar] [CrossRef]
  3. Aslesen, H.W.; Isaksen, A. Knowledge intensive business services and urban industrial development. Serv. Ind. J. 2007, 27, 321–338. [Google Scholar] [CrossRef]
  4. Duranton, G.; Puga, D. Diversity and specialisation in cities: Why, where and when does it matter? Urban Stud. 2000, 37, 533–555. [Google Scholar] [CrossRef] [Green Version]
  5. Cuadrado-Roura, J. Service Industries and Regions: Growth, Location and Regional Effects; Cuadrado-Roura, J., Ed.; Spring: Berlin, Germany, 2013; ISBN 978-3-642-35800-5. [Google Scholar]
  6. Gallego, J.; Maroto, A. The Specialization in Knowledge-Intensive Business Services (KIBS) across Europe: Permanent Co-Localization to Debate. Reg. Stud. 2015, 49, 644–664. [Google Scholar] [CrossRef]
  7. Arauzo-Carod, J.-M. Location determinants of high-tech firms: An intra-urban approach. Ind. Innov. 2021, 1–24. [Google Scholar] [CrossRef]
  8. Ženka, J.; Novotný, J.; Slach, O.; Ivan, I. Spatial Distribution of Knowledge-Intensive Business Services in a Small Post-Communist Economy. J. Knowl. Econ. 2017, 8, 385–406. [Google Scholar] [CrossRef]
  9. Ženka, J.; Slach, O.; Ivan, I. Spatial patterns of knowledge-intensive business services in cities of various sizes, morphologies and economies. Sustainability 2020, 12, 1845. [Google Scholar] [CrossRef] [Green Version]
  10. Rosenthal, S.S.; Strange, W.C. The attenuation of human capital spillovers. J. Urban Econ. 2008, 64, 373–389. [Google Scholar] [CrossRef]
  11. Andersson, M.; Klaesson, J.; Larsson, J.P. How Local are Spatial Density Externalities? Neighbourhood Effects in Agglomeration Economies. Reg. Stud. 2016, 50, 1082–1095. [Google Scholar] [CrossRef]
  12. Coll-Martínez, E.; Moreno-Monroy, A.I.; Arauzo-Carod, J.M. Agglomeration of creative industries: An intra-metropolitan analysis for Barcelona. Pap. Reg. Sci. 2019, 98, 409–431. [Google Scholar] [CrossRef]
  13. Kekezi, O.; Klaesson, J. Agglomeration and innovation of knowledge intensive business services. Ind. Innov. 2020, 27, 538–561. [Google Scholar] [CrossRef] [Green Version]
  14. Lavoratori, K.; Castellani, D. Too close for comfort? Microgeography of agglomeration economies in the United Kingdom. J. Reg. Sci. 2021, 1–27. [Google Scholar] [CrossRef]
  15. Liu, C.; Rosenthal, S.; Strange, W. Employment density and agglomeration economies in tall buildings. Reg. Sci. Urban Econ. 2020, 84, 103555. [Google Scholar] [CrossRef]
  16. Hawken, S.; Han, J.H. Innovation districts and urban heterogeneity: 3D mapping of industry mix in downtown Sydney. J. Urban Des. 2017, 22, 568–590. [Google Scholar] [CrossRef]
  17. Rosenthal, S.S.; Strange, W.C. How close is close? The spatial reach of agglomeration economies. J. Econ. Perspect. 2020, 34, 27–49. [Google Scholar] [CrossRef]
  18. Pina, K.; Tether, B.S. Towards understanding variety in knowledge intensive business services by distinguishing their knowledge bases. Res. Policy 2016, 45, 401–413. [Google Scholar] [CrossRef] [Green Version]
  19. Isaksen, A. Knowledge-based clusters and urban location: The clustering of software consultancy in Oslo. Urban Stud. 2004, 41, 1157–1174. [Google Scholar] [CrossRef]
  20. Musil, R.; Eder, J. Towards a location sensitive R&D policy. Local buzz, spatial concentration and specialisation as a challenge for urban planning—Empirical findings from the life sciences and ICT clusters in Vienna. Cities 2016, 59, 20–29. [Google Scholar] [CrossRef]
  21. Bereitschaft, B. Are walkable places tech incubators? Evidence from Nebraska’s ‘Silicon Prairie’. Reg. Stud. Reg. Sci. 2019, 6, 339–356. [Google Scholar] [CrossRef]
  22. Duvivier, C.; Polèse, M.; Apparicio, P. The location of information technology-led new economy jobs in cities: Office parks or cool neighbourhoods? Reg. Stud. 2018, 52, 756–767. [Google Scholar] [CrossRef]
  23. Guzman, J.; Stern, S. Where is silicon valley? Science 2015, 347, 606–609. [Google Scholar] [CrossRef] [PubMed]
  24. Spencer, G.M. Knowledge Neighbourhoods: Urban Form and Evolutionary Economic Geography. Reg. Stud. 2015, 49, 883–898. [Google Scholar] [CrossRef]
  25. Guzman, J.; Stern, S. Nowcasting and placecasting entrepreneurial quality and performance. In Measuring Entrepreneurial Businesses: Current Knowledge and Challenges; University of Chicago Press: Chicago, IL, USA, 2016; pp. 63–109. [Google Scholar]
  26. Hutton, T.A. Spatiality, built form, and creative industry development in the inner city. Environ. Plan. A 2006, 38, 1819–1841. [Google Scholar] [CrossRef]
  27. Shearmur, R. The Geography of Intrametropolitan KIBS Innovation: Distinguishing Agglomeration Economies from Innovation Dynamics. Urban Stud. 2012, 49, 2331–2356. [Google Scholar] [CrossRef]
  28. Wood, S.; Dovey, K. Creative Multiplicities: Urban Morphologies of Creative Clustering. J. Urban Des. 2015, 20, 52–74. [Google Scholar] [CrossRef]
  29. Montgomery, J. Cultural quarters as mechanisms for urban regeneration. Part 1: Conceptualising cultural quarters. Plan. Pract. Res. 2003, 18, 293–306. [Google Scholar] [CrossRef]
  30. Kaczmarek, S. Post-industrial areas in modern cities. Bull. Geogr. (Socio-Econ. Ser.) 2003, 2, 39–46. [Google Scholar]
  31. Krzysztofik, R.; Tkocz, M.; Spórna, T.; Kantor-Pietraga, I. Some dilemmas of post-industrialism in a region of traditional industry: The case of the Katowice conurbation, Poland. Morav. Geogr. Rep. 2016, 24, 42–54. [Google Scholar] [CrossRef] [Green Version]
  32. Krzysztofik, R.; Kantor-Pietraga, I.; Kłosowski, F. Between Industrialism and Postindustrialism—the Case of Small Towns in a Large Urban Region: The Katowice Conurbation, Poland. Urban Sci. 2019, 3, 68. [Google Scholar] [CrossRef] [Green Version]
  33. Inkinen, T.; Kaakinen, I. Economic Geography of Knowledge-Intensive Technology Clusters: Lessons from the Helsinki Metropolitan Area. J. Urban Technol. 2016, 23, 95–114. [Google Scholar] [CrossRef]
  34. Kinne, J.; Resch, B. Analyzing and predicting micro-location patterns of software firms. ISPRS Int. J. Geo-Inf. 2018, 7, 1. [Google Scholar] [CrossRef] [Green Version]
  35. Adler, P.; Florida, R.; King, K.; Mellander, C. The city and high-tech startups: The spatial organization of Schumpeterian entrepreneurship. Cities 2019, 87, 121–130. [Google Scholar] [CrossRef]
  36. Duvivier, C.; Polèse, M. The great urban techno shift: Are central neighbourhoods the next silicon valleys? Evidence from three Canadian metropolitan areas. Pap. Reg. Sci. 2018, 97, 1083–1111. [Google Scholar] [CrossRef]
  37. Méndez-Ortega, C.; Arauzo-Carod, J.M. Locating Software, Video Game, and Editing Electronics Firms: Using Microgeographic Data to Study Barcelona. J. Urban Technol. 2019, 26, 81–109. [Google Scholar] [CrossRef]
  38. Białka, M. Functional transformations of post-industrial areas of the central part of Bielsko-Biała. Pr. Geogr. 2005, 115, 107–133. [Google Scholar]
  39. Gyurkovich, M.; Gyurkovich, J. New housing complexes in post-industrial areas in city centres in Poland versus cultural and natural heritage protection—With a particular focus on Cracow. Sustainability 2021, 13, 418. [Google Scholar] [CrossRef]
  40. Sadowy, K.; Lisiecki, A. Post-industrial, post-socialist or new productive city? Case study of the spatial and functional change of the chosen Warsaw industrial sites after 1989. City, Territ. Archit. 2019, 6. [Google Scholar] [CrossRef] [Green Version]
  41. Martinát, S.; Navrátil, J.; Dvořák, P.; Klusáček, P.; Kulla, M.; Kunc, J.; Havlíček, M. The expansion of coal mining in the depression areas - A way to development? Hum. Geogr. 2014, 8, 5–15. [Google Scholar] [CrossRef] [Green Version]
  42. Krätke, S. Metropolisation of the European economic territory as a consequence of increasing specialisation of urban agglomerations in the knowledge economy. Eur. Plan. Stud. 2007, 15, 1–27. [Google Scholar] [CrossRef]
  43. Blažek, J.; Žížalová, P.; Rumpel, P.; Skokan, K. Where does the knowledge for knowledge-intensive industries come from? The case of biotech in Prague and ICT in Ostrava. Eur. Plan. Stud. 2011, 19, 1277–1303. [Google Scholar] [CrossRef]
  44. Boix, R.; Hervás-Oliver, J.L.; De Miguel-Molina, B. Micro-geographies of creative industries clusters in Europe: From hot spots to assemblages. Pap. Reg. Sci. 2015, 94, 753–772. [Google Scholar] [CrossRef]
  45. Storper, M.; Venables, A.J. Buzz: Face-to-face contact and the urban economy. J. Econ. Geogr. 2004, 4, 351–370. [Google Scholar] [CrossRef] [Green Version]
  46. Catalini, C. Microgeography and the Direction of Inventive Activity. Manage. Sci. 2018, 64, 4348–4364. [Google Scholar] [CrossRef] [Green Version]
  47. Kabo, F.W.; Cotton-Nessler, N.; Hwang, Y.; Levenstein, M.C.; Owen-Smith, J. Proximity effects on the dynamics and outcomes of scientific collaborations. Res. Policy 2014, 43, 1469–1485. [Google Scholar] [CrossRef]
  48. Liu, C.; Marx, M. Micro-geography: A fundamental organizing attribute. Ind. Innov. 2020, 27, 837–841. [Google Scholar] [CrossRef]
  49. Rammer, C.; Kinne, J.; Blind, K. Knowledge proximity and firm innovation: A microgeographic analysis for Berlin. Urban Stud. 2020, 57, 996–1014. [Google Scholar] [CrossRef]
  50. Havrlant, M. Geografie Severomoravského kraje; Pedagogická fakulta v Ostravě: Ostrava, Czech Republic, 1980. [Google Scholar]
  51. Coll-Martínez, E. Creativity and the City: Testing the Attenuation of Agglomeration Economies in Barcelona; Springer: New, York, NY, USA, 2019; Volume 43, ISBN 0123456789. [Google Scholar]
  52. Arzaghi, M.; Henderson, J.V. Networking off Madison Avenue. Rev. Econ. Stud. 2008, 75, 1011–1038. [Google Scholar] [CrossRef]
  53. Larsson, J.P. Non-routine activities and the within-city geography of jobs. Urban Stud. 2017, 54, 1808–1833. [Google Scholar] [CrossRef]
  54. Granpayehvaghei, T.; Bonakdar, A.; Zandiatashbar, A.; Hamidi, S. The Quest for Creative Industries: A Multilevel National Study of the Impacts of Urban Form on the Geography of Creative Industries. Transp. Res. Rec. 2019, 2673, 157–168. [Google Scholar] [CrossRef]
  55. Hudeček, T.; Hnilička, P.; Dlouhý, M.; Leňo Cutáková, L.; Leňo, M. Urban structures, population density and municipal expenditures: An empirical study in the Czech Republic. Urban Stud. 2019, 56, 3450–3465. [Google Scholar] [CrossRef]
  56. Slach, O.; Bosák, V.; Krtička, L.; Nováček, A.; Rumpel, P. Urban shrinkage and sustainability: Assessing the nexus between population density, urban structures and urban sustainability. Sustainability 2019, 11, 4142. [Google Scholar] [CrossRef] [Green Version]
  57. Oldenburg, R. The Great Good Place: Cafes, Coffee Shops, Bookstores, Bars, Hair Salons and Other Hangouts at the Heart of a Community; De Capo Press: Boston, MA, USA, 1999. [Google Scholar]
  58. Pancewicz, A. Contemporary Parks in Post-Industrial Cities of Upper Silesian-Zaglebie Metropolis. IOP Conf. Ser. Mater. Sci. Eng. 2019, 471, 092037. [Google Scholar] [CrossRef]
  59. Hutton, T. Trajectories of the new economy: Regeneration and dislocation in the inner city. Urban Stud. 2009, 46, 987–1001. [Google Scholar] [CrossRef]
  60. Kiroff, L. Nexus between creative industries and the built environment: Creative placemaking in inner Auckland. Front. Archit. Res. 2019, 9, 119–137. [Google Scholar] [CrossRef]
  61. Spórna, T.; Krzysztofik, R. ‘Inner’ suburbanisation—Background of the phenomenon in a polycentric, post-socialist and post-industrial region. Example from the Katowice conurbation, Poland. Cities 2020, 104, 102789. [Google Scholar] [CrossRef]
  62. Stanilov, K.; Sýkora, L. Confronting Suburbanization: Urban Decentralization in Postsocialist Central and Eastern Europe, 1st ed.; Wiley Blackwell: Chichester, UK, 2014; ISBN 978-1-4051-8548-6. [Google Scholar]
  63. Runge, A.; Kantor-Pietraga, I.; Runge, J.; Krzysztofik, R.; Dragan, W. Can depopulation create urban sustainability in postindustrial regions? A case from Poland. Sustainability 2018, 10, 4633. [Google Scholar] [CrossRef] [Green Version]
  64. Smętkowski, M.; Celińska-Janowicz, D.; Wojnar, K. Location patterns of advanced producer service firms in Warsaw: A tale of agglomeration in the era of creativity. Cities 2021, 108, 102937. [Google Scholar] [CrossRef]
  65. Rumpel, P.; Slach, O. Je Ostrava „ smršťujícím se městem“? Sociol. časopis/Czech Sociol. Rev. 2012, 48, 859–878. [Google Scholar]
  66. Bosák, V.; Nováček, A.; Slach, O. Industrial culture as an asset, barrier and creative challenge for restructuring of old industrial cities: Case study of Ostrava (Czechia). GeoScape 2018, 12, 52–64. [Google Scholar] [CrossRef] [Green Version]
  67. Zarecor, K.E. What Was So Socialist about the Socialist City? Second World Urbanity in Europe. J. Urban Hist. 2018, 44, 95–117. [Google Scholar] [CrossRef]
  68. Korwel-Lejkowska, B. Transformation of the Landscape Structure of the Selected Testing Grounds in the Tri-city Agglomeration in the Years 1985–2012. Quaest. Geogr. 2020, 39, 31–42. [Google Scholar] [CrossRef]
  69. Duží, B.; Jakubínský, J. Brownfield dilemmas in the transformation of post-communist cities: A case study of Ostrava, Czech Republic. Hum. Geogr. 2013, 7, 53–64. [Google Scholar] [CrossRef] [Green Version]
  70. Martinát, S.; Kunc, J.; Klusáček, P.; Krejčí, T.; Navrátil, J.; Vnenková, J.; Černík, J. Spatial relations and perception of brownfields in old industrial region: Case study of Svinov (Ostrava, Czech Republic). Geogr. Tech. 2015, 10, 66–77. [Google Scholar]
  71. Novosák, J.; Hájek, O.; Nekolová, J.; Bednář, P. Prostorový vzorec a charakteristiky brownfields a nově využitých lokalit v ostravské metropolitní oblasti (Česká Republika). Morav. Geogr. Reports 2013, 21, 36–45. [Google Scholar] [CrossRef]
  72. Vojvodíková, B.; Potužník, M.; Bürgermeisterová, R. The database on brownfields in Ostrava (Czech Republic): Some approaches to categorization. Morav. Geogr. Rep. 2011, 19, 50–60. [Google Scholar]
  73. Kunc, J.; Tonev, P.; Martinát, S.; Frantál, B.; Klusáček, P.; Dvořák, Z.; Chaloupková, M.; Janurová, M.; Krajčková, A.; Šilhan, Z.; et al. Industrial legacy towards brownfields: Historical and current specifics, territorial differences (Czech Republic). Geogr. Cassoviensis 2018, 12, 76–91. [Google Scholar]
  74. Ivan, I.; Horák, J. Registered crime hot spots in Ostrava—Location, development and influencing factors. Geogr. Cas. 2018, 70, 3–21. [Google Scholar] [CrossRef]
  75. Slach, O.; Koutský, J.; Novotný, J.; Ženka, J. Creative industries in the Czech Republic: A spatial perspective. Econ. Manag. 2013, 16, 14–29. [Google Scholar]
  76. Slach, O.; Ivan, I.; Ženka, J.; Sopkuliak, A. Intra-urban patterns of creative industries in polycentric city. GeoScape 2018, 9, 1–16. [Google Scholar] [CrossRef] [Green Version]
  77. Turok, I.; Mykhnenko, V. The trajectories of European cities, 1960–2005. Cities 2007, 24, 165–182. [Google Scholar] [CrossRef]
  78. Blažek, J.; Květoň, V. From coal-mining to data-mining: The role of leadership in the emergence of a regional innovation system in an old industrial region. In Handbook on City and Regional Leadership; Sotarauta, M., Beer, A., Eds.; Edward Elgar Publisher: Cheltenham, UK, 2021; pp. 168–186. ISBN 978 1 78897 967 2. [Google Scholar]
  79. Czech Statistical Office. Available online: https://www.czso.cz/csu/res/business_register (accessed on 20 May 2021).
  80. Redecker, A.; Burian, J.; Moos, N.; Macků, K. Spationomy. In Spationomy; Springer: Cham, Switzerland, 2020; pp. 65–92. [Google Scholar]
  81. O’Sullivan, D.; Unwin, D. Geographic Information Analysis, 2nd ed.; Wiley: Hoboken, NJ, USA, 2014; ISBN 9780470288573. [Google Scholar]
  82. Baviera-Puig, A.; Buitrago-Vera, J.; Mas-Verdú, F. Trade areas and knowledge-intensive services: The case of a technology centre. Manag. Decis. 2012, 50, 1412–1424. [Google Scholar] [CrossRef] [Green Version]
  83. Vallicelli, M. Smart cities and digital workplace culture in the global European context: Amsterdam, London and Paris. City, Cult. Soc. 2018, 12, 25–34. [Google Scholar] [CrossRef]
  84. Krisp, J.M.; Špatenková, O. Kernel density estimations for visual analysis of emergency response data. Lect. Notes Geoinf. Cartogr. 2010, 395–408. [Google Scholar] [CrossRef]
  85. Slach, O.; Nováček, A.; Bosák, V.; Krtička, L. Mega-retail-led regeneration in the shrinking city: Panacea or placebo? Cities 2020, 104, 102799. [Google Scholar] [CrossRef]
  86. Zandiatashbar, A.; Hamidi, S. Impacts of transit and walking amenities on robust local knowledge economy. Cities 2018, 81, 161–171. [Google Scholar] [CrossRef]
  87. Zandiatashbar, A.; Hamidi, S.; Foster, N. High-tech business location, transportation accessibility, and implications for sustainability: Evaluating the differences between high-tech specializations using empirical evidence from U.S. booming regions. Sustain. Cities Soc. 2019, 50, 101648. [Google Scholar] [CrossRef]
  88. Ponto, H.; Inkinen, T. Knowledge-based environments in the city: Design and urban form in the Helsinki metropolitan area. Int. J. Knowledge-Based Dev. 2019, 10, 155–175. [Google Scholar] [CrossRef]
  89. Fang, L.; Drucker, J. How Spatially Concentrated Are Industrial Clusters?: A Meta-analysis. J. Plan. Lit. 2021, 1–17. [Google Scholar] [CrossRef]
  90. Bumberová, V.; Milichovskỳ, F. Influence of determinants on innovations in small KIBS firms in the Czech Republic before COVID-19. Sustainability 2020, 12, 7856. [Google Scholar] [CrossRef]
  91. Tödtling, F.; Skokan, K.; Höglinger, C.; Rumpel, P.; Grillitsch, M. Innovation and knowledge sourcing of modern sectors in old industrial regions: Comparing software firms in Moravia-Silesia and Upper Austria. Eur. Urban Reg. Stud. 2013, 20, 188–205. [Google Scholar] [CrossRef]
  92. Micek, G. Geographical proximity paradox revisited: The case of IT service SMEs in Poland. Sustainability 2019, 11, 5770. [Google Scholar] [CrossRef] [Green Version]
  93. Helbich, M. Beyond postsuburbia? multifunctional service agglomeration in vienna’s urban fringe. Tijdschr. voor Econ. en Soc. Geogr. 2012, 103, 39–52. [Google Scholar] [CrossRef] [Green Version]
  94. Pan, F.; Hall, S.; Zhang, H. The spatial dynamics of financial activities in Beijing: Agglomeration economies and urban planning. Urban Geogr. 2020, 41, 849–864. [Google Scholar] [CrossRef]
  95. Dainov, E.; Sauka, A. Managers and Entrepreneurs in Creative and Knowledge-Intensive Industries: What Determines Their Location? Toulouse, Helsinki, Budapest, Riga and Sofia. In Making Competitive Cities; Musterd, S., Murie, A., Eds.; Wiley-Blackwell: Chichester, UK, 2010; p. 376. ISBN 978-1-405-19415-0. [Google Scholar]
  96. Colombo, M.G.; Delmastro, M. How effective are technology incubators? Evidence from Italy. Res. Policy 2002, 31, 1103–1122. [Google Scholar] [CrossRef]
  97. Arauzo-Carod, J.M.; Segarra-Blasco, A.; Teruel, M. The role of science and technology parks as firm growth boosters: An empirical analysis in Catalonia. Reg. Stud. 2018, 52, 645–658. [Google Scholar] [CrossRef]
  98. Huallacháin, B.Ó.; Leslie, T.F. Producer services in the urban core and suburbs of Phoenix, Arizona. Urban Stud. 2007, 44, 1581–1601. [Google Scholar] [CrossRef]
  99. Bosák, V.; Slach, O.; Nováček, A.; Krtička, L. Temporary use and brownfield regeneration in post-socialist context: From bottom-up governance to artists exploitation. Eur. Plan. Stud. 2020, 28, 604–626. [Google Scholar] [CrossRef]
Figure 1. Methodology flow chart.
Land 10 00695 g001
Figure 2. Weighted and unweighted L-functions for ICT firms in Ostrava (2019).
Land 10 00695 g002
Figure 3. The locations of ICT hubs within the city of Ostrava.
Land 10 00695 g003
Figure 4. The detailed locations for ICT hubs in the city of Ostrava.
Land 10 00695 g004
Figure 5. Building in Hub A (office centre “Na Nábřeží”).
Land 10 00695 g005
Figure 6. Hub B: selected buildings hosting ICT firms: (a) location B1, (b) location B2, (c) location B3.
Land 10 00695 g006aLand 10 00695 g006b
Figure 7. (a) Hub C: building on Hornopolní street, location C1, (b) Hub D: selected buildings hosting ICT firms, location D1 (photo source: Tieto Czech, s.r.o.).
Land 10 00695 g007
Figure 8. Hub F: a typical urban structure surrounding the hub, location F1.
Land 10 00695 g008
Figure 9. Selected buildings in the Hub E: (a) location E1, (b) location E2, and (c) location E3.
Land 10 00695 g009aLand 10 00695 g009b
Figure 10. Hub I: selected buildings hosting ICT firms, location I1.
Land 10 00695 g010
Figure 11. CT firms in Ostrava: size and ownership status.
Land 10 00695 g011
Figure 12. ICT firms in Ostrava and urban structures.
Land 10 00695 g012
Table 1. Variables used in statistical tests.
NameDescriptionSource
Urban structureType of urban structure: 1 = organic; 2 = urban blocks; 3 = estates and high rises; 4 = mixed building types; 5 = low-density structures; 6 = industry and transportation; 7 = services. Slach et al., 2019
Building heightNumber of storeys: 1 = up to 2; 2 = 3 to 4; 3 = 5 and more.own survey
Building condition1 = new or completely renovated building in perfect condition; 2 = partly renovated building; 3 = building in bad technical condition.own survey
Building age1 = built before 1945; 2 = built between 1945 and 1989; 3 = built since 1990.own survey
Building functions1 = commercial monofunctional; 2 = commercial polyfunctional; 3 = mostly residential; 4 = mix of functions.own survey
Surrounding functions1 = residential; 2 = public services; 3 = production; 4 = vacant; 5 = mix of functions; 6 = other commercial non-production; 7 = transport and warehousing. own survey
EmploymentNumber of persons employed (2019)Business Register 2019
Ownership status1 = domestic firms; 2 = foreign-owned firms; 3 = other.Business Register 2019
Table 2. ICT firms in Ostrava and urban forms: descriptive statistics.
Number of FirmsNumber of JobsMean JobsStDev Jobs
Urban structures
organic433678.515.1
urban blocks441.00.0
estates and high rises611542.55.0
mixed building types234725331.0166.2
low-density structures333239.822.0
industry and transportation2871325.438.5
services5191017.823.5
Building height
1-2 storeys121153412.722.0
3-4 storeys208328915.842.7
5+ storeys125490039.2221.8
Building condition
perfect237694429.3162.3
good201274413.64941.1
before renovation16352.1561.8
Building age
before 19455874012.820.8
1945-1989276309211.235.8
since 1990120589149.1226.2
Building function
commercial monofunctional67119617.825.6
commercial polyfunctional243792632.6162.9
residential1353622.77.4
public services351.50.9
mix of functions521943.890.8
other11515.00.0
Surroundings function
residential1289687.621.5
manufacturing or other production840350.349.5
transport and warehousing45714.123.9
public services2950517.426.1
other commercial non-production function3853114.017.4
mix of functions244725029.7162.7
All firms454972221.4120.6
Table 3. ICT firms/jobs density and urban structures.
Urban StructureArea (km2)ICT Firm DensityICT Jobs Density
Organic urban structure0.6764.4550.0
Urban block structure0.666.06.0
Urban structure of estates and high rises 14.744.110.4
Urban structure of mixed building types16.5114.2439.3
Low-density structures82.020.43.9
Industry and transportation39.000.718.3
Services4.1512.3219.4
Total157.752.961.6
Table 4. Urban form and ICT firm size and ownership: statistical tests.
Null HypothesisTestp-ValueDecision
The distribution of Employment is the same across categories of Urban structure.Kruskal–Wallis0.001reject
The distribution of Employment is the same across categories of Building height.Kruskal–Wallis0.188retain
The distribution of Employment is the same across categories of Building condition.Kruskal–Wallis<0.001reject
The distribution of Employment is the same across categories of Building age.Kruskal–Wallis<0.01reject
The distribution of Employment is the same across categories of Building function.Kruskal–Wallis<0.001reject
The distribution of Employment is the same across categories of Surroundings function.Kruskal–Wallis<0.001reject
Variables Urban structure and Firm ownership are statistically independent.Chi2 test<0.001reject
Variables Building height and Firm ownership are statistically independent.Chi2 test<0.001reject
Variables Building condition and Firm ownership are statistically independent.Chi2 test0.419retain
Variables Building age and Firm ownership are statistically independent.Chi2 test<0.001reject
Variables Building functions and Firm ownership are statistically independent.Chi2 test<0.001reject
Variables Surroundings function and Firm ownership are statistically independent.Chi2 test<0.001reject
Publisher’s Note: MDPI stays neutral with regard to jurisdictional claims in published maps and institutional affiliations.

