Article

Urban Land Use Transitions and the Economic Spatial Spillovers of Central Cities in China’s Urban Agglomerations

1
School of Economics, Central South University of Forestry and Technology, Changsha 410004, China
2
School of Public Administration, Hunan University, Changsha 410082, China
3
Institute of Geographic Sciences and Natural Resources Research, Chinese Academy of Sciences, Beijing 100101, China
4
School of Business, Central South University, Changsha 410083, China
5
College of Economics and Management, Changsha University, Changsha 410022, China
6
College of Tourism, Hainan University, Haikou 570228, China
*
Author to whom correspondence should be addressed.
Land 2021, 10(6), 644; https://doi.org/10.3390/land10060644
Submission received: 17 May 2021 / Revised: 11 June 2021 / Accepted: 14 June 2021 / Published: 17 June 2021
(This article belongs to the Special Issue Land Use Transitions under Rapid Urbanization)

Abstract

:
Urbanization and land use transformation are typical characteristics of China in recent decades. Studying the effects of urban land use transitions (ULUT) on the economic spatial spillovers of central cities (ESSCC) can provide a reference for China to optimize cities’ land space layout and promote their coordinated development. Based on the direct and indirect effects of ULUT in central cities on the production factors and economic growth in other cities, this paper reveals the mechanisms underlying the influence of ULUT on ESSCC. Then, we usethe expanded geographical distance-weighted spatial Durbin model with the panel data of 152 Chinese urban agglomeration cities from 2003 to 2016 to empirically test it. The results show that, since 2003, the rate of urban land expansions, the level of urban land intensive use (ULIU), the degree of land marketization, and the urban land prices in China have increased substantially; and the proportionate supplies of industrial land, commercial land, and residential land have decreased. Moreover, ULUT between cities have significant spatial autocorrelations. The current ULUT have positive but small effects on ESSCC. Among them, ULIU has the greatest promotion effects on ESSCC. The impacts of ULUT on ESSCC vary greatly among urban agglomerations. The ULUT in central cities indirectly enhance the ESSCC, which mainly depend on the positive effects of ULUT on enterprise investment, infrastructure investment, labor and technological efficiency and the spatial spread effects of these production factors. This is the main intermediate mechanism by which the ULUT in central cities enhance the ESSCC. Continuing to strengthen ULIU, promote the improvement of land marketization, and establish and improve the coordination mechanism for the economic development of urban agglomerations will help to strengthen the ESSCC in urban agglomerations. The results provide evidence for how the Chinese government can enhance the ESSCC and promote the coordinated development of cities through ULUT under new urbanization.

1. Introduction

Since China’s reform and opening up, its economy and urban population have both been growing rapidly, leading to the rapid and large-scale expansion of urban land [1,2,3] and the continuous reduction inagricultural land [4,5,6]. From 2000 to 2005, the area of construction land in China increased by 1,705,300 hectares and cultivated land decreased by 686,500 hectares [7]; from 2010 to 2015, construction land increased by 2.46 million hectares, and cultivated land decreased by 490,000 hectares [8]. However, these extensive expansions of urban land have led to problems such as low land use efficiency, idle land, and waste [9]. As land resource constraints continue to tighten [10,11], urban land use transitions (ULUT) should shift away from the previous explicit expansion and move toward the implicit transition of intensive land use [12,13,14], land marketization [15], and optimization of the land supply structure to promote the transformation of economic development [16,17].
In order to accelerate the implicit transitions of urban land use, the Chinese government has issued several policies. The Ministry of Land and Resources promulgated the Regulations on the Transfer of State-owned Construction Land Use Rights by Bidding, Auction, and Listing in 2007. It stipulates that industrial, commercial, tourism, entertainment, residential, and other operating land, as well as the same parcel of land with more than two intentional users, shall be leased by bidding, auction, or listing [18].This policy has further promoted the marketization of urban land leasing in China. In 2008, the State Council issued the Outline of the National Land Use Master Plan, which proposed to economically and intensively use construction land, strictly control the newly added construction land, control the rapid expansions of urban industrial and mining land, and give priority to ensuring the construction land for foundation facilities, public service facilities, low-rent housing, affordable housing, and ordinary housing, to promote the intensive use of urban land, control the scale of newly added urban land, and optimize the supply structure of urban land [19]. In 2014, the Ministry of Land and Resources issued the Guiding Opinions of the Ministry of Land and Resources on Promoting Land Conservation and Intensive Utilization, which required a gradual reduction in the scale of newly added construction land, improvements in construction land use efficiency, adjustments in the rational proportion of construction land, and expansions of the paid use range of state-owned land [20]. At this point, the scale of newly added construction land in cities had gradually decreased; the proportion of industrial and mining land, commercial land, and residential land in urban land leasing has gradually declined [21]; the level of urban land intensive use (ULIU) has further improved [11,22]; and the proportion of leased land for bidding, auction, and listing has further increased.
With China’s rapid urbanization over the past four decades, the scale of its cities’ areas has continued to expand and the connections between cities have become increasingly close, leading to the formation of many urban agglomerations [23]. Urban agglomerations have become an important growth pole for the rapid development of the national economy and an important engine for the coordinated development of regional economies [24,25]. The National New Urbanization Plan aims to establish a coordination mechanism for the development of urban agglomerations, enhance the economic spatial spillovers of central cities (ESSCC), accelerate the development of small and medium-sized cities, prioritize the development of small towns, and promote the coordinated development of various cities [26]. The 2018 Central Economic Work Conference further stated that “it is necessary to strengthen the ESSCC to boost China’s high-quality development”.
ULUT interact with urban economic growth, population, and production factors [27,28]. On the one hand, the rapid growth of the urban economy and population has driven the continuous expansions of urban land and improved land use efficiency [29,30,31,32]. On the other hand, urban land expansions are also used as an important tool to obtain local fiscal revenue and regional economic growth [33,34].ULUT have an important influence on production factor changes and spatial flows [35], while production factors and economic growth have spatial effects [36]. Therefore, ULUT may also have impacts on the ESSCC in urban agglomerations. The development of urban agglomerations has become the key to driving regional economic development, and the ESSCC in urban agglomerations is particularly important. China is in the process of transforming its economic development by encouraging urbanization and promoting the high-quality, coordinated development of cities. In 2016, the State Council pointed out the need to improve and perfect the land use mechanism in Several Opinions of the State Council on Deepening the Construction of New Urbanization. In 2020, the Chinese government promulgated the Proposals of the Central Committee of the Communist Party of China on Formulating the Fourteenth Five-Year Plan for National Economic and Social Development and Long-Term Goals for 2035, which further proposed “optimizing the layout of land and space and promoting coordinated regional development and new types of towns”. Therefore, how to promote new urbanization and the coordinated development of cities through ULUT is particularly important [37].
Europe and the United States are dominated by private ownership of land. The previous related research included land as a production factor in the economic growth model and explored the impact of land on economic growth [38,39,40,41]. In recent years, the research on the relationship between land and economic growth under the land private ownership system has mainly discussed the impact of land use control and land landscape on housing prices [42,43,44,45], and the impact of urban land use on the agglomeration of factors [46,47]. However, China has implementedpublic ownership of land, and urban land is supplied by the government. Therefore, the transition of urban land quantity and utilization is often used as a tool to stimulate production factors and fiscal revenue, thereby stimulating regional economic growth. Research on the impact of ULUT on economic growth mainly focuses on explicit ULUT—that is, the impacts of urban land expansions on the urban economy and its production factors. Studies have shown that the expansions of urban land have significantly expanded local fiscal revenue and basic investment in China, and urban land commodification has become a main source of municipal finance and funding for urban maintenance and construction [48]. At the same time, urban land is used as a tool to attract investment and drive urban investment. Through the expansions of urban land to drive urban investment, investment-driven growth in China has been generated in the past decade [49].The expansion of industrial land directly stimulates economic growth, and urban land leasing also indirectly drives economic growth by attracting foreign direct investment and infrastructure investment [35].Increasing land leasing revenues will directly speed up economic growth [50]. However, in the process of attracting investment, local governments often adopt low prices to obtain enterprise investment, which leads to inefficient land use [49] and low input–output efficiency [48], and makes them sometimes unable to achieve the goal of stimulating economic growth. At the same time, the expansions of urban construction land to increase fiscal revenue have also led to an excess of residential land and an imbalance in the land supply structure in China. It is necessary to reverse the low-price urban land leasing policy to create a properly functioning land market [51].
Some scholars have also considered the spatial effects of urban land use on production factors and economic growth. He et al. pointed out that interregional competition would lead to the spatial dependence of land supply and land use changes in China [35,52]. The landscape between cities also has significant spatial correlation [53]. At the same time, urban land expansions may also affect the changes in production factors and economic growth in other cities. Wu et al. pointed out that in the process of attracting investment in China, competition drives down industrial land prices, which leads to the spatial correlation of urban land prices [54,55,56]. Wei et al. found that there were more urban land expansions opportunities in provincial-level central cities, which inhibited the economic growth of other cities and widened the development gap between cities in the province [57].
The current urban land use policies in China promote ULUT from explicit urban land expansion to the implicit transitions of land intensive use, land marketization, and urban land supply structure optimization. The implicit transitions of urban land use replace the explicit transition, and become the leading factors to promote the new urbanization. However, existing studies have neglected the impact of the implicit transitions of urban land use on production factors and economic growth. In addition, although existing studies have paid attention to the spatial correlation and spatial effects on production factors and economic growth of urban land expansion and urban land prices in China, there is a lack of research on the impact of ULUT on ESSCC. Then, what are the impacts of ULUT on ESSCC? How do these effects (if any) come into being? How canthe ULUT be optimized to enhance the ESSCC and promote the coordinated development of cities? Answering these questions can provide a basis for tightening constraints on land resources and China’s ULUT under the background of new urbanization.
With urban land expansions representing the explicit ULUT, and ULIU, urban land supply structure (ULSS), urban land marketization and urban land prices representing the implicit ULUT, this paper first describes the characteristics of ULUT in China. Then, from the perspective of ULUT affecting the spatial flow and the spatial effect of production factors, we tease out the transmission mechanism of ULUT on the ESSCC in urban agglomerations. Finally, data on Chinese urban agglomerations from 2003 to 2016 were collected to estimate the influence of explicit and implicit ULUT on ESSCC in urban agglomerations and its intermediate mechanism.

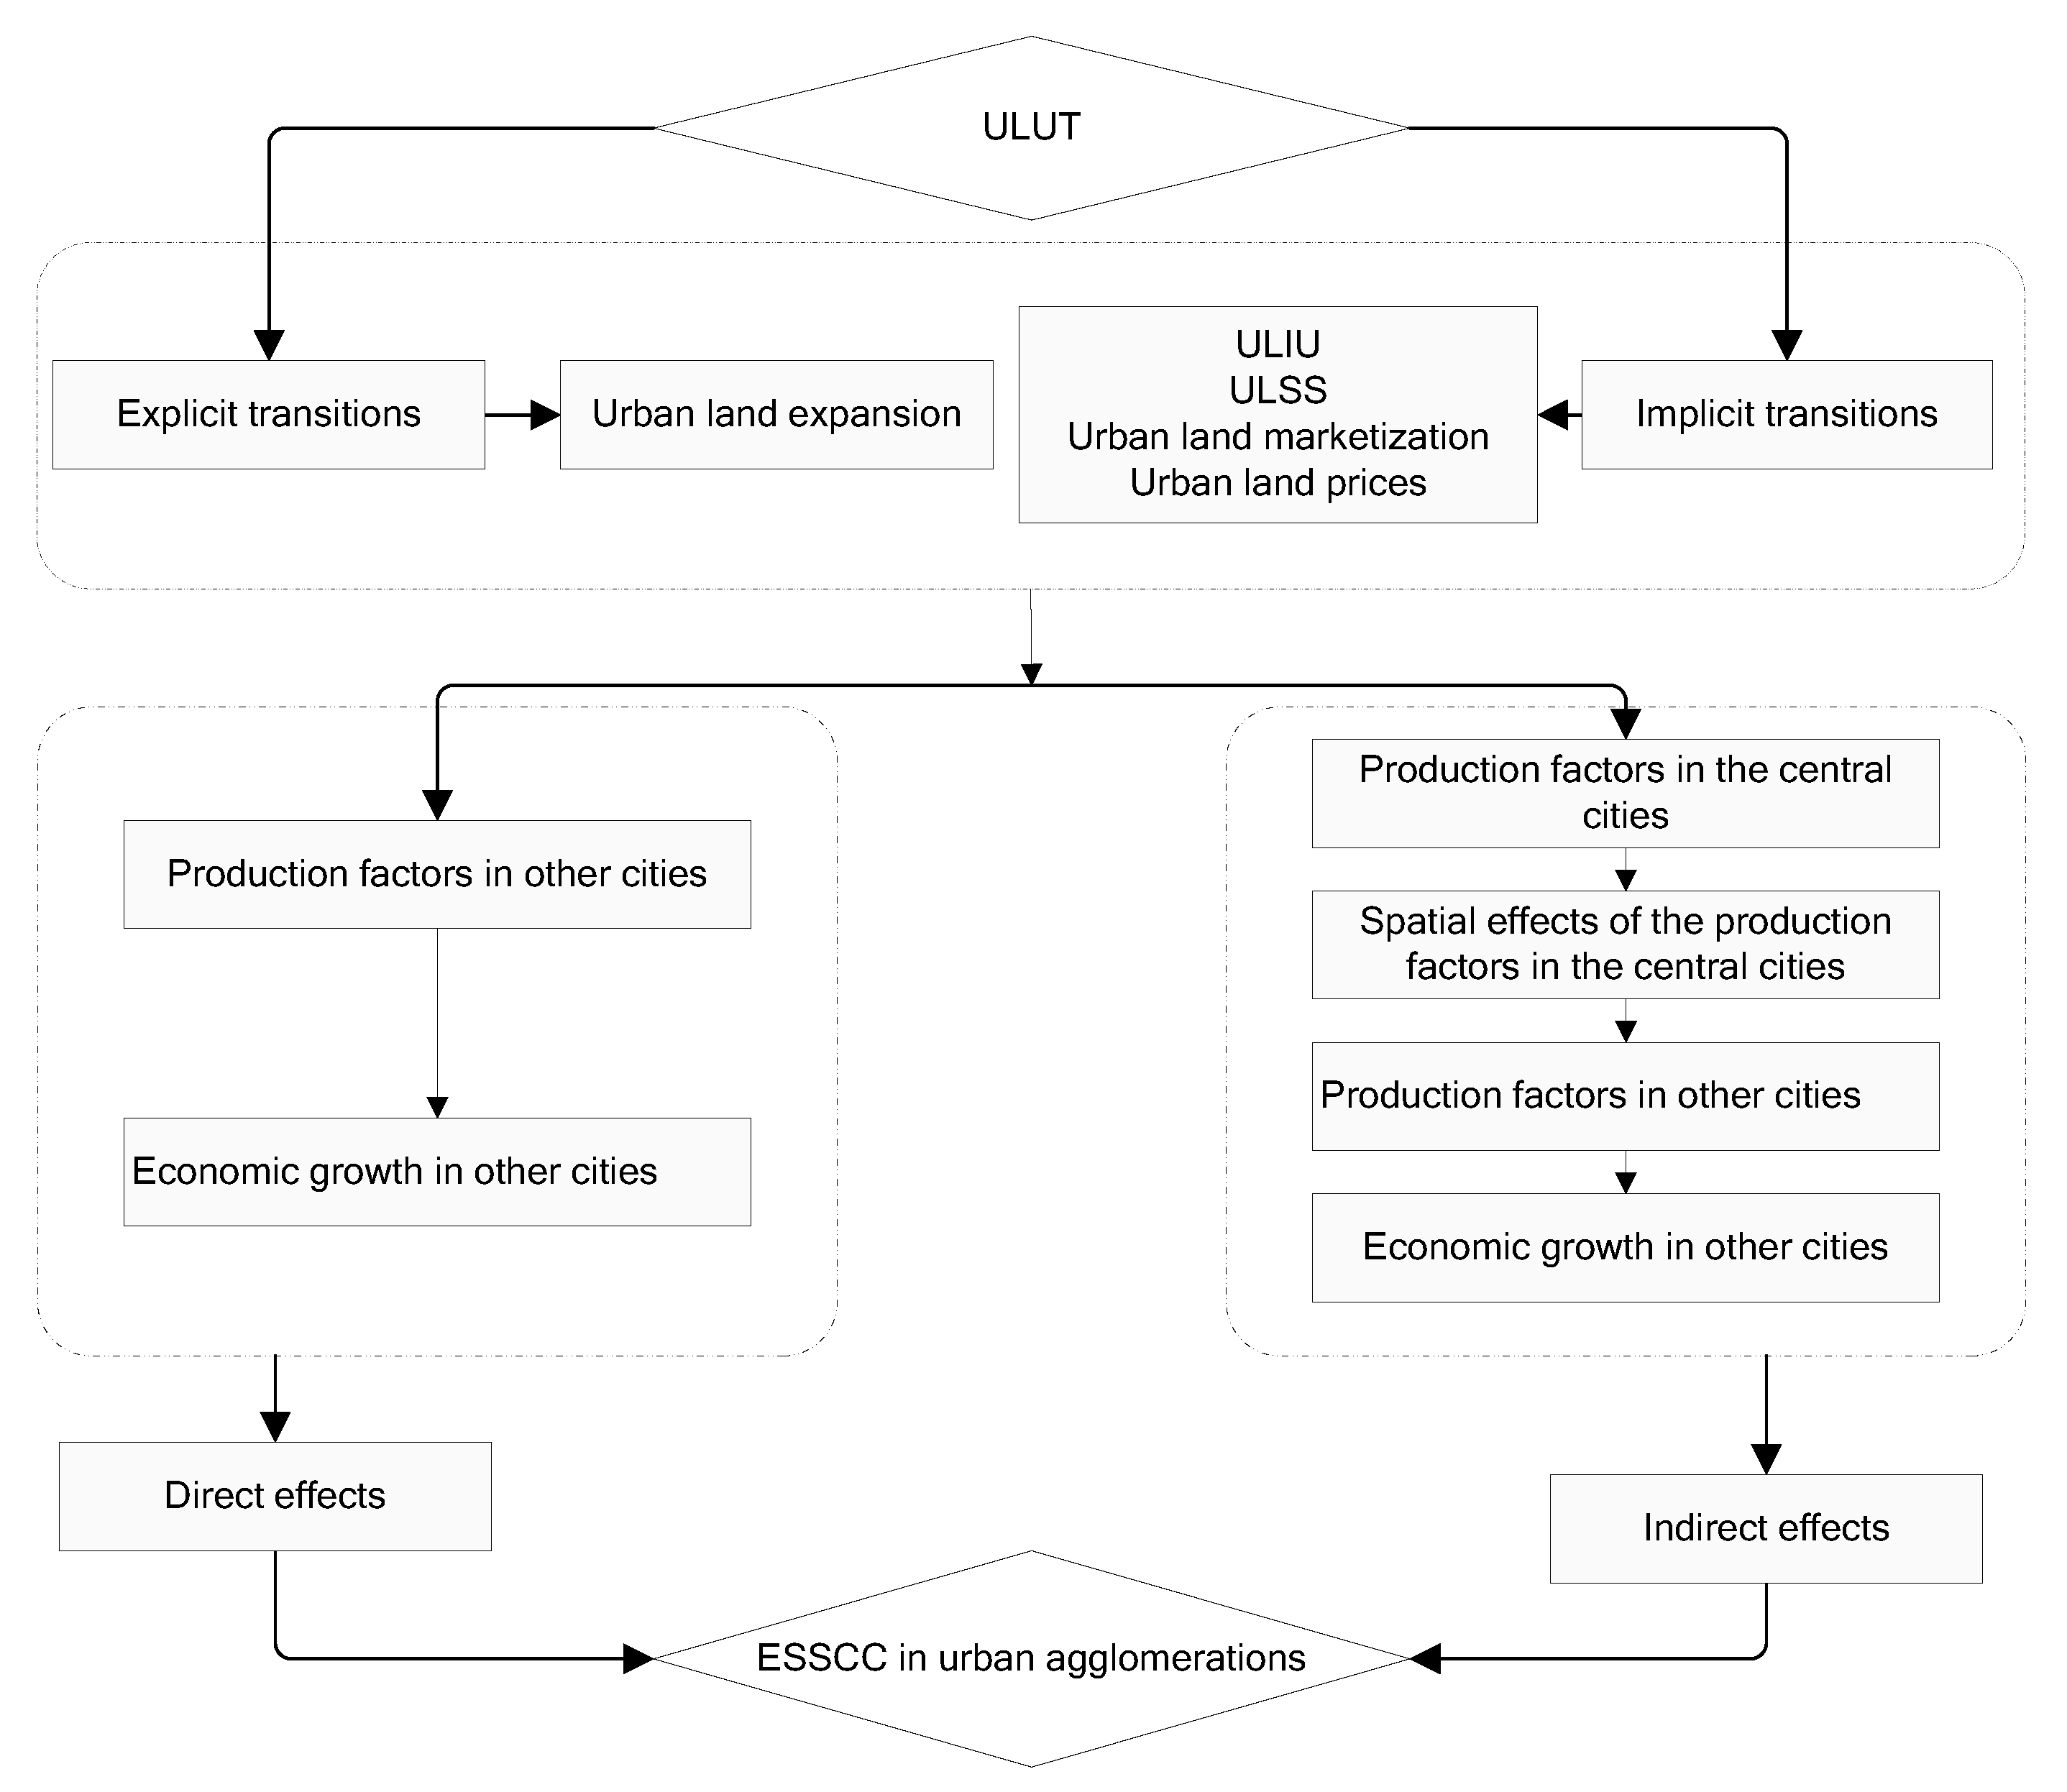
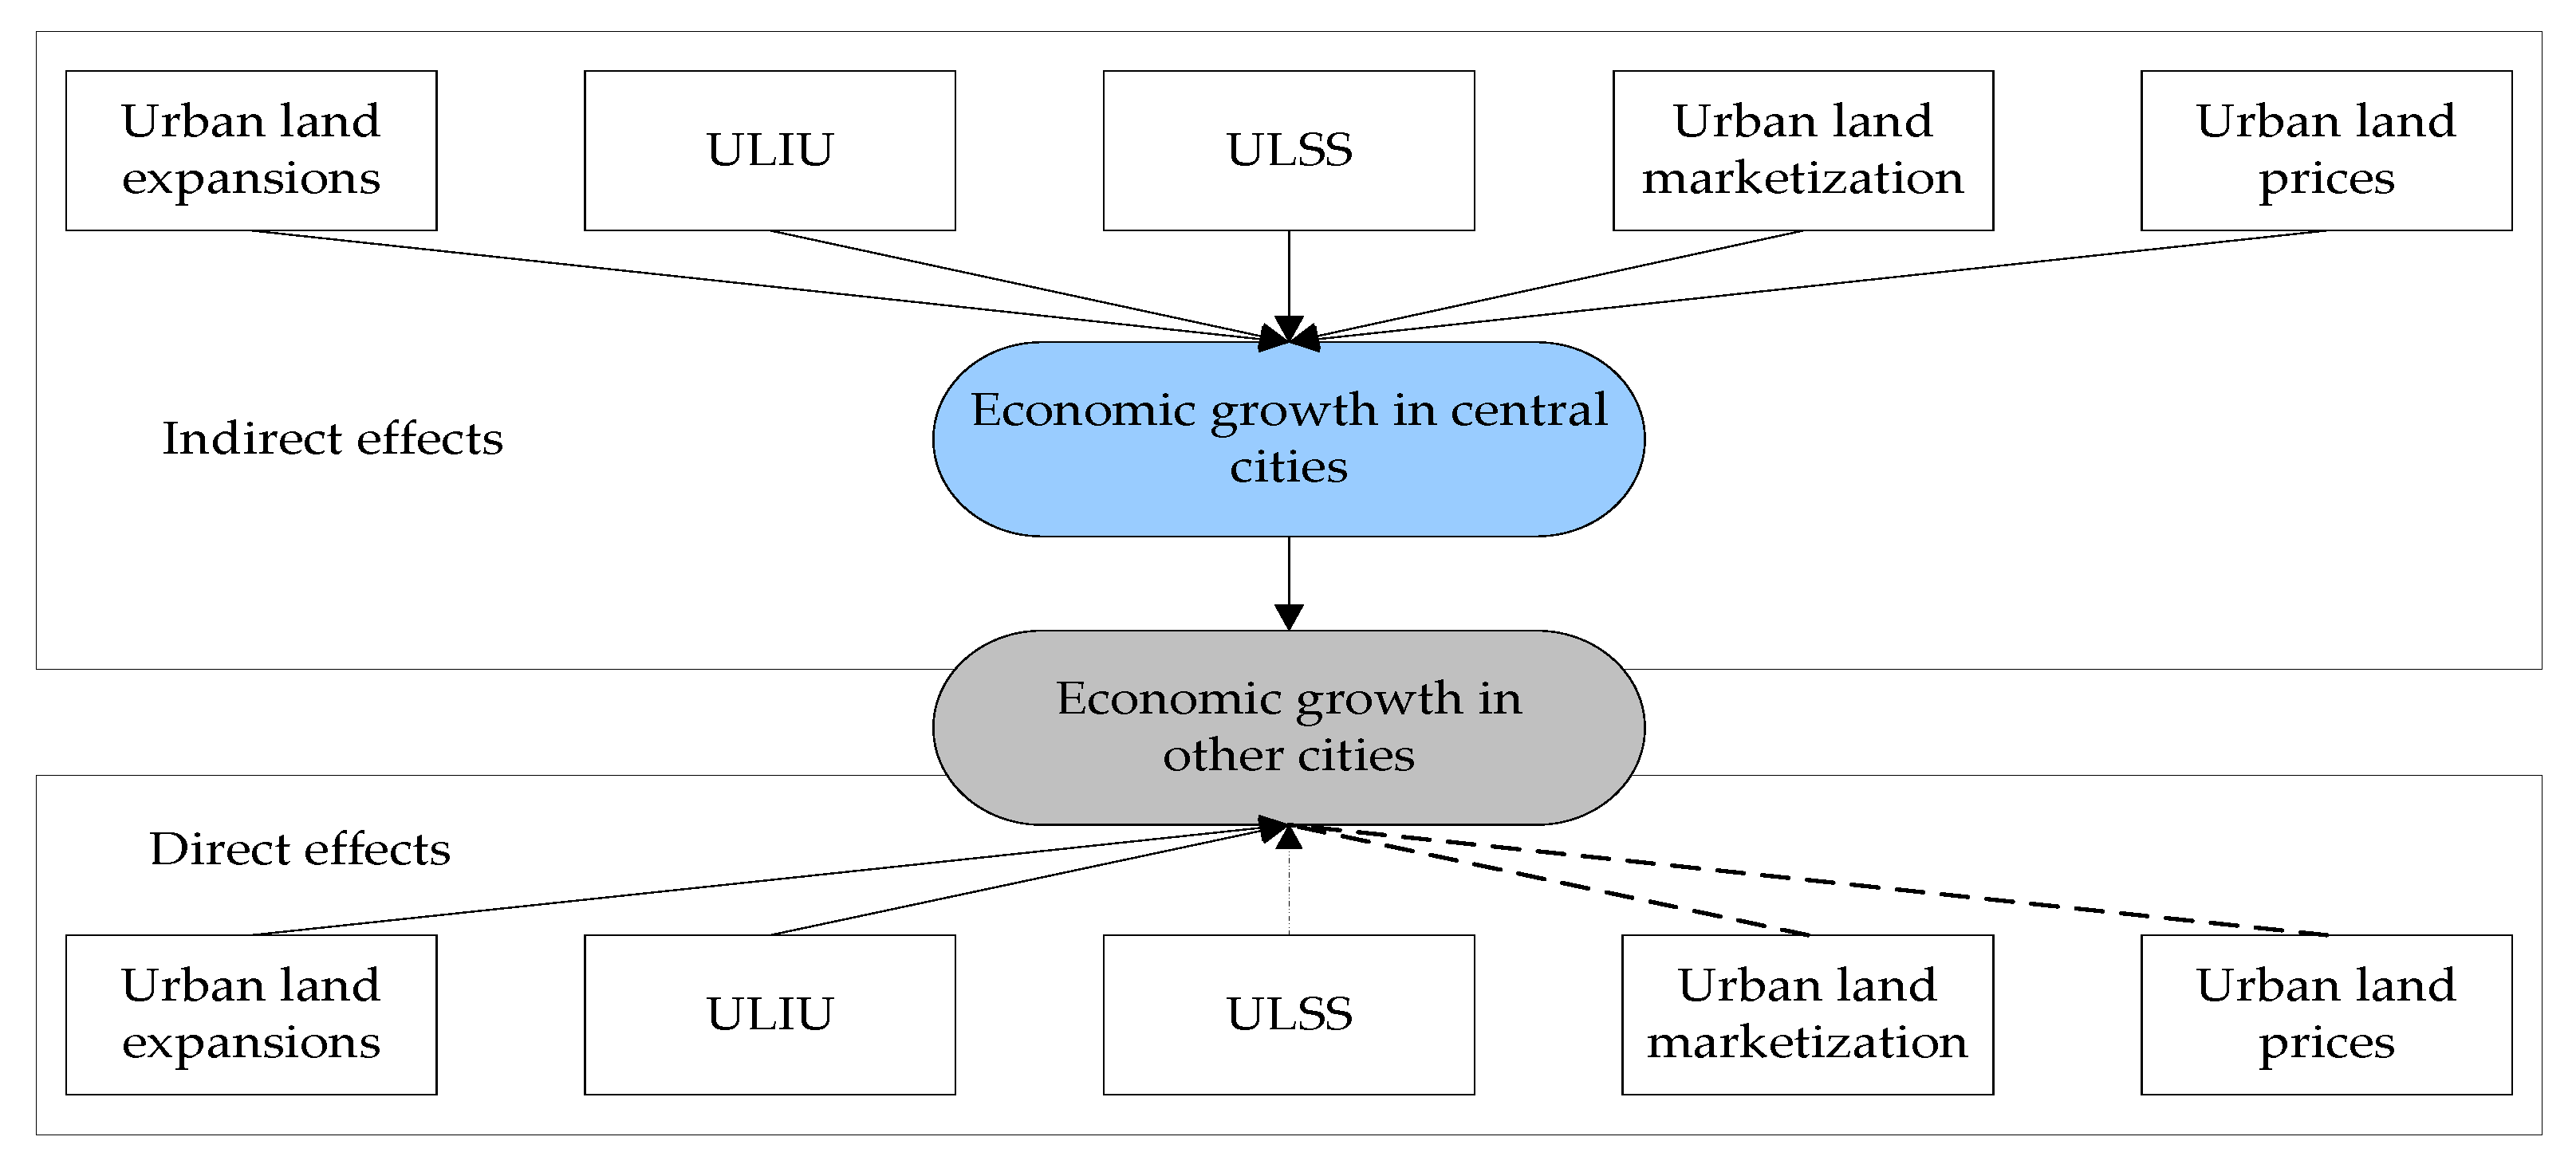
2. Influence Mechanism of ULUT on ESSCC

ULUT include explicit transitions and implicit transitions. Explicit ULUT refer to land use structure in a certain region over a specific period, with features such as the quantity and spatial pattern of land use types. In contrast, implicit ULUT are more profound and refer to land use that depends on the explicit morphology and requires analysis, testing, detection, and investigation. Implicit transitions have multiple attributes such as quality, property rights, operating methods, utilization efficiency, and functional structure [58,59,60,61,62,63]. In most countries such as the United States and Europe, land is privately owned, and land is used more as a factor of production to affect economic growth. Changes in urban land use are often more the result of urban economic growth. In China, land belongs to public ownership, and urban land is used more as a tool for local governments to drive the growth of production factors and stimulate economic growth. The ULUT in China areoften the cause of urban economic growth, or mutual causality. Therefore, the influence mechanism of ULUT on ESSCC in this article is especially applicable to China. ULUT affect the ESSCC in urban agglomerations in two ways. On the one hand, ULUT may affect the spatial flow of production factors and have a direct spatial effect on the economic growth of other cities; on the other hand, after ULUT affect the scale of a city’s production factors, those production factors will affect the economic growth of other cities through their own spatial effects. This means that ULUT will have indirect spatial effects on the economic growth of other cities due to the spatial effects of the production factors (see Figure 1).
The effect of ULUT on the ESSCC in urban agglomerations can also be considered from two perspectives. First, ULUT strengthen the diffusion effect of the central cities in urban agglomerations and drive the economic growth of other cities. ULUT of the central cities in urban agglomerations drive the growth of local production factors and economic growth and then promote the economic growth of other cities through the spatial spillover effects of production factors and economic growth [36].At the same time, ULUT of central cities in urban agglomerations may also directly drive the growth of production factors in surrounding cities. Second, ULUT intensify the agglomeration and back flow effects in central cities in urban agglomerations and inhibit the economic growth of other cities. ULUT in central cities in urban agglomerations may prompt other urban production factors to directly agglomerate and flow to central cities. It is also possible that ULUT indirectly drive the production factors of other cities to collect in central cities, because of the agglomeration effects of production factors and economic growth, thus hindering the economic growth of other cities [64].
First, urban land expansions will affect the ESSCC in urban agglomerations, which may cause a diffusion effect or a siphon effect. The supply of urban land is used as a tool to attract investment, absorb labor, expand local fiscal revenue, increase infrastructure investment, and stimulate regional economic growth [65]. Investment, transportation infrastructure, labor, and economic growth have spatial spillover effects that may drive economic growth in other cities [64]. In this way, the supply of urban land in the central cities of urban agglomerations may indirectly enhance ESSCC. At the same time, if acity adopts the industrial chain investment of urban agglomerations, the urban land expansion in one city will also increase the enterprise investment in other cities [66], and enhance the ESSCC. Infrastructure investment often supports investment between cities [67], which means that the expansion of urban land in central cities in urban agglomerations may also directly drive the growth of corporate investment and infrastructure investment in other cities and, in turn, drive their economic growth. However, larger scale central cities with stronger agglomeration effects may also attract production factors from surrounding cities through their newly added urban land, thereby having a siphon effect on other cities’ economic growth in the urban agglomeration. At the same time, local governments have bottom-line competition in the process of attracting capital and will compete for more land leasing indicators. As a result, central cities that are more capable of fighting for land leasing indicators [57,68] may also crowd out the economic growth of other cities in urban agglomerations.
Second, ULIU affects the ESSCC of urban agglomerations by influencing the industrial structure and its spatial emulation effect. Local governments continuously improve ULIU to ease the constraints of urban land resources on urban economic growth [69]. In the process of corporate investment, they gradually formulate assessments of land investment intensity and output intensity, to screen companies and industries. At the same time, they continue to revitalize the stock of construction land, eliminate enterprises and industries with low land use efficiency, and reintroduce enterprises with higher land use efficiency so as to improve land use efficiency and promote urban economic growth. The central government has increased ULIU, forcing local governments to continuously optimize the industrial structure to further stimulate urban economic growth. In the process of continuously improving the levels of ULIU, local governments also promote the flow of production factors, such as enterprise investment, labor force, and infrastructure investment, among cities, thus affecting the ESSCC of urban agglomerations. In addition, ULIU between cities has spatial learning and emulation effects that may also indirectly affect the ESSCC in urban agglomerations [70].
Third, the ULSS affects the urban investment structure and industrial structure, which in turn affect the ESSCC in urban agglomerations. The structure of urban land includes industrial and mining storage land, commercial land, residential land, and other lands. Industrial and mining storage land is used for industrial development, which mainly affects industrial investment; commercial land is used for commercial, financial, catering, hotels, and other operating service industries and their corresponding ancillary facilities, which mainly affects service industry investment; residential land mainly affects real estate investment; and other land includes public management, public services land, transportation land, water area, and water conservancy facilities land, which mainly affects infrastructure investment. With the continuous optimization of ULSS, urban investment structures and industrial structures have also changed [71]. Meanwhile, different industrial types also have different effects driving economic radiation. Therefore, ULSS will affect the ESSCC in urban agglomerations.
Fourth, urban land marketization affects economic growth through financing effects and resource allocation effects, which further affects the ESSCC in urban agglomerations. The ULUT away from planned allocation to market-oriented allocation are an important part of China’s economic market reform. Urban land leasing has changed from planned allocation to agreement to the current transfer method based on bidding, auctioning, and listing. In order to attract investment, local governments often resort to depressing land prices, or even offering land free of charge to enterprises [51,55]. As the degree of land marketization continues to increase, cities with less economic competitiveness have no way to attract investment by lowering land prices. The growing marketization of urban land can not only increase the degree of land capitalization and promote the expansion of the production scale by increasing urban financing [72], but it can also improve the efficiency of resource allocation through more effective uses of land price signals and more effective combinations of production factors. Ultimately, the increase in the marketization of urban land is conducive to the promotion of urban economic growth, and it can further affect the ESSCC of urban agglomerations through the spatial effects of production factors and economic output.
Fifth, urban land prices affect the ESSCC in urban agglomerations through bottom-line competition and the enterprise screening effect [54]. Economic growth competition between regions will cause local governments to continuously lower their land leasing prices and the quality of corporate investment in order to obtain investment [51,55]. The competition will not necessarily drive regional economic growth and may reduce the ESSCC in urban agglomerations. However, increasing urban land prices helps to screen companies by favoring those enterprises with high technical efficiency and high profit margins and squeezing out those with low profit margins and low technical efficiency, thus helping to strengthen the ESSCC [73]. However, the rapid increase in urban land prices in urban agglomerations’ central cities may also crowd out corporate investment, thus forcing some companies to migrate to surrounding cities. For example, due to the rapid increase in urban land prices and labor prices in China’s coastal cities, a large number of manufacturing companies have moved to Southeast Asia and the mid-western parts of China. At the same time, rising urban areas have brought about a rapid increase in housing prices, which may also cause labor to flow from central cities to surrounding cities. In this way, an increase in the urban land prices of a central city may directly drive the economic growth of other cities [74]. However, land prices are often spatially correlated. An increase in land prices in central cities will lead to the land prices rising in the surrounding cities as well, which will directly crowd out investment and labor in other cities and inhibit their economic growth.

3. Methodology

3.1. Spatial Autocorrelation Analysis

ULUT may have spatial autocorrelation, due to land use competition, imitation and technology spillover effect of land use among cities. This paper uses Moran I to test this spatial autocorrelation, and the calculation formula is as follows:
I = i = 1 n j i n W i j ( X i X ¯ ) ( X j X ¯ ) S 2 i = 1 n j i n W i j
where X i and X j refer to the variables of ULUT of the cities i and j , respectively; n is numbers of the samples. The sample of this paper is the panel data of 152 cities from 2003 to 2016, so n equals 2128. X ¯ is the average value of each variable. S 2 is the variance of each variable.
W i j is the spatial distance weight matrix. We take spherical distance as the geographical distance of two cities. The spatial effect tends to diminish with distance [36,75], so we use the inverse of the geographical distance square as the element of the spatial weight matrix. The calculation is as follows:
w i j = {                       = 0                                                           ( i = j )                       1 d i j 2                                                               ( i j )
where w i j is the element of the spatial weight matrix; d i j refers to spherical distance of two cities, d i j = R × arccos ( cos ( α i α j ) cos β i cos β j + sin β i sin β j ) . In the formula for d i j , R is the equatorial radius of the earth, determined to be 6378 km; α and β are longitude and latitude, respectively.
This paper uses the software stata.14 to estimate the spatial autocorrelation panel model. First, the spatial weight matrix is generated according to Equation (2). Then, based on this spatial weight matrix, we use the “spatgsa” command to estimate global spatial autocorrelation, and perform a 2-tailed test on the exponential significance.

3.2. The Econometric Model to Examine the Impacts of ULUT on ESSCC

Based on the traditional measurement model, considering the spatial differences and the spatial correlation between variables, a spatial measurement model has been developed [76]. Spatial measurement models help to test the spatial influence between variables. The spatial lag model can test the spatial influence of the dependent variable. The spatial Durbin model can simultaneously test the spatial effects of the key independent variables and dependent variables [77,78]. This article attempts to explore the direct and indirect spatial effects of the ULUT in central cities on the economic growth and production factors of other cities, and it is more suitable to adopt the spatial Durbin model. Therefore, this article draws on the form of the spatial Durbin model, incorporates the spatial lag variables that examine the independent variables and dependent variables in the model, and constructs a measurement model as shown in Equations (3) and (4).The paper constructs a basic production function equation in which the output is the regional gross product and the input factors are the capital stock and labor scale. To examine the impact of ULUT on the urban economics, variables reflecting ULUT are included in the model. To test the direct spatial effect of ULUT incentral cities on ESSCC, the spatial lag variable of ULUT in central cities was introduced as an explanatory variable. To examine the indirect effects of ULUT in the central cities on ESSCC, we further introduce the spatial lag variable of the regional gross product of central cities. Assuming that the production function is in the form of Cobb–Douglas, after taking the log of both sides, we obtain the measurement model of the impacts of ULUT on the ESSCC as follows:
ln y i t = β 0 + β 1 ln k i t + β 2 ln n i t + λ 1 W C ln u l e i t + λ 2 W C ln u l i u i t + λ 3 W C p i l i t                                                     + λ 4 W C p s l i t + λ 5 W C p h l i t + λ 6 W C u l m i t + λ 7 W C ln u l p i t                                                     + ρ ( W C ln y ) i t   + α 1 ln u l e i t + α 2 ln u l i u i t + α 3 p i l i t + α 4 p s l i t                                                     + α 5 p h l i t + α 6 u l m i t + α 7 ln u l p i t + ε i t
where ln y represents the gross domestic product (GDP) in a city, and its log is used as the dependent variable. The control variables are ln k and ln n , as the logs of capital stock and labor scale, respectively; ln u l e , ln u l i u , u l m and ln u l p are variables, representing urban land expansions, ULIU, urban land marketization and urban land prices, respectively; p i l , p s l , and p h l stand for the proportion of industrial and mining storage land, commercial service land, and residential land in the leased land, and together, they reflect the ULSS; W C ln y , W C ln u l e , W C ln u l i u , W C p i l , W C p s l , W C p h l , W C u l m , and W C ln u l p are the spatial lag variables of the corresponding variables of the central cities in the urban agglomerations; i and t represent the city and year, respectively; ε is the residual error; β , λ , ρ and α are the coefficients to be estimated. According to λ , the direct effects of ULUT on the ESSCC can be tested, which means that when a certain aspect of ULUT in a central city changes by 1%, the GDP of other cities will change by λ % ; by combining ρ and α , we can determine the indirect effects of ULUT on the ESSCC, which means that every 1% change of ULUT in the central city will result in economic changes ( ρ × α × 1 d 2 ) % in other cities d kilometers away from the central city.
The spatial lag variables of the corresponding variables of the central cities in the urban agglomerations are constructed as follows: first, set the dummy variable of the central city. Central cities include the central cities in the urban agglomeration development plan approved by China’s State Council. If a city is the central city in the urban agglomerations, it is given a value of 1, and 0 otherwise. Take the urban agglomeration in the Middle Reaches of the Yangtze River, for example. According to the urban agglomeration plan, the central cities are Wuhan, Changsha, and Nanchang. The urban agglomeration planning scope covers 28 cities above the prefecture level in the provinces of Hubei, Hunan, and Jiangxi. Additionally, the cities affected by ULUT of a central city are the other 27 cities in addition to the central city itself. Then, multiply each city’s corresponding variables by the dummy variable of the central cities, and finally, multiply by the spatial distance weight matrix W , to obtain the spatially lagged variables of the central cities in the urban agglomerations.

3.3. The Econometric Model to Examine the Intermediate Mechanism

Theoretical analysis shows that ULUT directly or indirectly affect the ESSCC in urban agglomerations by affecting production factors and their spatial effects. This paper selects five main production factors—enterprise investment, fiscal expenditure, infrastructure investment, labor, and technical efficiency—as the explained variables to test the intermediate mechanism of urban agglomeration central cities’ ULUT affecting the ESSCC. The econometric model is as follows:
f i t = a 0 + n = 1 a n x n , i t + z 1 W C ln u l e i t + z 2 W C ln u l i u i t + z 3 W C p i l i t                       + z 4 W C p s l i t + z 5 W C p h l i t + z 6 W C u l m i t + z 7 W C ln u l p i t                       + θ W C f i t   + b 1 ln u l e i t + b 2 ln u l i u i t + b 3 p i l i t + b 4 p s l i t                       + b 5 p h l i t + b 6 u l m i t + b 7 ln u l p i t + σ i t
where f i t is the explained variable. When testing the enterprise investment mechanism, fiscal expenditure mechanism, infrastructure investment mechanism, labor mechanism, and technical efficiency mechanism, the log of corporate investment, the log of fiscal expenditure, the log of infrastructure investment, the log of labor, and technical efficiency are used as explained variables, respectively. The control variable is x n . In the enterprise investment mechanism test, the control variables include the log of GDP lagged by one period, the log of capital stock lagged by one period, the log loan balance at the end of the year, and the log of the total population at the end of the year. In the fiscal expenditure mechanism test, the control variables include the log of GDP, the log of fiscal revenue, and the log of the total population at the end of the year. In the infrastructure investment mechanism test, the control variables include the log of fiscal expenditure and the log of the built-up area. In the labor mechanism test, the control variables include the log of the total population at the end of the year, the log of the number of hospitals per 10,000 people, the log of the number of pupils per 10,000 people, and the log of the built-up area. In the technical efficiency mechanism test, the control variables are the log of enterprise investment, the log of the number of college students per 10,000 people, and the log of foreign direct investment. σ is the residual error term. a , z , θ , and b are the coefficients to be estimated. The direct and indirect effects of ULUT of central cities in urban agglomerations on the production factors of other cities can be measured by the coefficient z and combining θ and b , respectively.

3.4. Solution of Endogeneity and Collinearity

The ULIU is obtained by dividing the city’s GDP by the urban construction land area. As an explanatory variable, it has a correlation with the explained GDP and various production factors. This makes a potentially endogenous variable in the two econometric models. Therefore, this paper adopts the two-stage estimation method of instrumental variables of the fixed effects model. We select the log of the total land leasing area of other cities in the province or the log of the sum of the land leasing areas of other provinces and cities with the exception of this municipality, the log of the built-up area, and the proportion of the urban construction land in the built-up area, the area of the built-up area, the age of the party secretary, the number of years as the party secretary, and the dummy variable of whether the tenure of the party secretary is within its first two years, as instrumental variables. The reasons are as follows: First, the land leasing area is often strictly limited to a certain period of time [79]. Therefore, the sum of the land leasing scale in other cities will affect the land leasing scale of the city, thus affecting the ULIU of the city, but it does not directly affect the GDP and production factors of the city. Second, existing studies have shown that the younger the party secretary, the fewer the number of years serving or when in the first two years serving as a party secretary, the party secretary will more impulsively use land to stimulate economic growth [80]. Third, the built-up area is often determined by the city in its long-term spatial evolution and can be regarded as an exogenous variable. When the area of urban construction land occupies a large area of the built-up area, it will force the ULIU, but it will not directly affect GDP and production factors of the city.
The explanatory variables in each estimation model of our Equations (3) and (4) are first analyzed by a correlation coefficient. The correlation coefficient test results show that the correlation between the independent variables in the six regression equations is not very high, and the absolute value of the highest correlation coefficient does not exceed 0.5. Then, after the mixed regression least squares estimation of the above equation, the independent variables’ variance inflation factors are analyzed. The results show that the variance inflation factors of most variables are below 10. Although the variance inflation factors of L 1 . ln k , ln g y , ln g e , ln y and l . ln y exceed 10, these variables are only control variables, and their estimated coefficients are not the focus of this article. Although the variance inflation factors of key observation variables such as w c ln u l p , w c ln u l i u , w c ln u l e , w c u l m , and w c ln n exceed 10, they are not large. Additionally, because this is just the variance inflation factors in the mixed regression model, after adopting the panel data model, it helps to reduce collinearity. Therefore, in the two-stage least squares estimation process of the panel data’s instrumental variables used in this paper, the collinearity of these observed variables has little effect on the accuracy of its estimated coefficients. Based on the above analysis, this article believes that the collinearity problem in the estimation equation is acceptable.

3.5. Variables and Data

Urban land expansions, ULIU, and urban land prices are measured by the newly added construction land area in the state-owned construction land leased, the GDP of the unit construction land, and the land leasing price, respectively; urban land marketization is calculated by the proportion of land leased by bidding, auction, and listing in the leased land. The proportion of industrial and mining storage land, commercial service land, and residential land in the leased land, together, reflects the ULSS. The labor is calculated by adding the number of employees to the number of self-employed private workers. Enterprise investment is obtained by subtracting investment in fixed assets for urban construction from investment in fixed assets for society as a whole. Drawing on the methods of Ke [81], the capital stock in the initial year 2003 is estimated by the average investment growth rate, depreciation rate, and investment in the initial year 2003, and then, the perpetual inventory method is used to calculate the capital stock of cities above the prefecture level from 2004 to 2016, for which the depreciation rate is 9.6%. Urban infrastructure investment is represented by urban construction fixed asset investment. Technical efficiency is estimated by using the stochastic frontier production function model with the total social capital stock and labor as input elements and GDP as output [82,83]. The relevant data affected by prices are transformed as comparable prices.
In this paper, 152 cities above the prefectural level in urban agglomerations are selected as samples (see Figure 2). The urban agglomerations in the samples, which are approved by the State Council of China as national urban agglomerations, include the Beijing–Tianjin–Hebei (including 11 cities), Yangtze River Delta (including 27 cities), Pearl River Delta (including 16 cities), Middle Reaches of the Yangtze River (including 28 cities), Central Plains (including 26 cities), Guanzhong Plain (including 5 cities), Lanzhou–Xining(including 4 cities), Hohhot–Baotou–Ordos–Yulin (including 4 cities), Chengdu–Chongqing (including 16 cities), Beibu Gulf (including 6 cities), and Harbin–Changchun (including 9 cities) urban agglomerations. Then, based on China’s regional differences, we select 8 urban agglomerations for typical analysis. Among them, we chose the Beijing–Tianjin–Hebei, Yangtze River Delta, and Pearl River Delta urban agglomerations in eastern China; the Middle Reaches of the Yangtze River and Central Plains urban agglomerations in central China; Guanzhong Plain urban agglomerations in northwestern China; the Chengdu–Chongqing urban agglomerations in southwestern China; the Harbin–Changchun urban agglomerations in northeastern China.
Data on newly added construction land leased; urban construction land area; land leasing area; bidding, auction, and listing leased area; land transaction price from 2003 to 2016; and the land leasing area distinguished by land type from 2009 to 2016 come from the China Land and Resources Statistical Yearbook. The China Land and Resources Statistical Yearbook did not record data on the land leasing area distinguished by land type from 2003 to 2008. Therefore, this paper matches the 398,706 land leases signed from 1 January 2003 to 31 December 2008 in the China Land Market Net to the prefecture level and sorts out and calculates the leased area of each city according to land type from 2003 to 2008. Data on urban built-up area and urban infrastructure investment are from the Statistical Yearbook of Urban Construction in China. The ages of the party secretaries of cities above the prefectural level and the number of years in office are manually collected from the Internet. The remaining data come from the China City Statistical Yearbook.

4. Results

4.1. ULUT in China during 2003–2016

Based on the mean values of ULUT indicators in 152 cities above the prefecture level in China from 2003 to 2016 (see Table 1), this paper analyzes the temporal change characteristics of ULUT in China. The rate of urban land expansion has increased. In 2003, the average size of newly added construction land in the land leased was 324.22 hectares, and thishad expanded to 573.87 hectares by 2016. The ULIU has increased significantly. In 2003, the GDP per hectare of urban construction land was 31.683 billion yuan, which had increased by 121.31% to reach 70.118 billion. Moran’s I is used to analyze the spatial autocorrelation of ULUT in Chinese urban agglomerations (see Table 2). The Moran’s I of urban land expansions, the ULIU, the proportion of industrial land in leased land, urban land marketization, and the urban land prices are positive, and the corresponding z statistic is relatively large; Moran’s I are significant at the 1% level. This indicates urban land expansions, the ULIU, the proportion of industrial land in leased land, urban land marketization, and the urban land prices have significantly positive spatial autocorrelations.
However, the differential analysis of the spatial correlations of ULUT of cities in typical urban agglomerations shows that there are great differences in the spatial autocorrelations of ULUT in urban agglomerations. The urban land expansions in the Beijing–Tianjin–Hebei, Yangtze River Delta, Central Plains, Guanzhong Plain, and Chengdu–Chongqing urban agglomerations have significant positive spatial autocorrelations, but are not significant in the Pearl River Delta and Middle Reaches of the Yangtze River Delta urban agglomerations. There are significant positive spatial autocorrelations in the ULIU in the Beijing–Tianjin–Hebei, Yangtze River Delta, Central Plains, Guanzhong Plain, and Chengdu–Chongqing urban agglomerations, but these are not significant in the Pearl River Delta, Middle Reaches of the Yangtze River, and Harbin–Changchun urban agglomerations; the spatial autocorrelation of the ULSS in urban agglomerations varies greatly. The proportion of industrial land in leased land, commercial land in leased land, and residential land in leased land has a significant positive spatial autocorrelation in the Yangtze River Delta and Chengdu–Chongqing urban agglomerations. However, the spatial autocorrelation of the above three types of urban land supply in the Beijing–Tianjin–Hebei, Pearl River Delta, and Harbin–Changchun urban agglomerations is not significant. The proportion of industrial land leased in the Middle Reaches of the Yangtze River urban agglomeration has a positive spatial autocorrelation, while the proportion of commercial land leased has a negative spatial autocorrelation. There is a significant positive spatial autocorrelation in the proportion of industrial land leased and commercial land leased in the Central Plains urban agglomeration. In the Guanzhong Plain urban agglomeration, the proportion of commercial land leased has a significant positive spatial autocorrelation, but the proportion of industrial land leased and residential land leased has no significant spatial autocorrelation.

4.2. The Impacts of ULUT on the ESSCC in Urban Agglomerations

Based on the estimated effects of ULUT on ESSCC (see Table 3), we conclude that: (1) Urban land expansion and ULIU directly and indirectly promote ESSCC in urban agglomerations; (2) ULSS, urban land marketization and urban land prices indirectly enhance ESSCC in urban agglomerations (see Figure 3). In the following figures, “→” refers to significantly positive effects, “→” refers to significantly negative effects, and “”refers to insignificant effects.

4.2.1. The Impacts of Urban Land Expansions on the ESSCC in Urban Agglomerations

From the empirical results (see Table 3), we can conclude that urban land expansions in central cities are helpful to enhance the ESSCC. On the one hand, the urban land expansions in central cities can directly drive the economic growth of other cities. Each 1% increase in urban land area in central cities will drive the economic growth of other cities in a radius of 100 km from central cities by 0.0004%. The calculation process is that the estimated coefficient of w c ln u l e is 3.785 multiplied by the reciprocal of the square of the distance 100, because this article chooses the reciprocal of the square of the distance as the element of the spatial weight matrix. The calculation process of direct influence effects below is similar to this. On the other hand, urban land expansions in central cities can indirectly drive the economic growth of other cities in the urban agglomerations, because of the significantly positive effects of urban expansions on urban economic growth and the significant spatial diffusion effect of central cities’ economics. Each 1% increase in the urban land expansions in central cities can significantly drive economic output growth by 0.0039% and indirectly drive the economic growth of other cities within a radius of 100 km from central cities by 0.000018%. The calculation process is to multiply ln u l e ’s estimated coefficient which is 0.004 by w c ln y ’s estimated coefficient which is 45.670, and then, multiply by the reciprocal of the square of 100, because the reciprocal of the square of the distance is an element of the spatial weight matrix in this paper. The calculation process of the indirect influence effect below is similar to this.
The empirical results of the urban land expansions affecting the ESSCC show that, although the urban land expansions in central cities can help to enhance the ESSCC, its direct and indirect effects are very small. Enhancing the ESSCC cannot rely on the expansions of urban land in central cities. At present, the Chinese central government has scientifically and rationally delineated urban boundaries through its territorial spatial planning and placed restrictions on the expansion of urban areas [84], which will have little negative impacts on the improvement of the ESSCC.
The estimation results of the typical agglomerations sample show that the impacts of urban land expansions on ESSCC vary greatly. The expansions of urban land in the Beijing–Tianjin–Hebei, Yangtze River Delta, Middle Reaches of the Yangtze River, Central City of Harbin–Changchun urban agglomerations did not have a significant impact on ESSCC. The urban land expansions of central cities in the Pearl River Delta can directly drive the economic growth of other cities in the urban agglomeration. The urban land expansions of central cities in the Central Plains urban agglomeration can directly and indirectly promote the economic growth of other cities in the urban agglomeration, but the urban land expansions of the central cities in the Chengdu–Chongqing urban agglomeration can directly inhibit the economic growth of other cities in the urban agglomerations.

4.2.2. The Influences of the ULIU on the ESSCC in Urban Agglomerations

ULIU in central cities can significantly enhance the ESSCC. Each 1% increase in ULIU in central cities can directly drive the economic growth of other cities in a radius of 100 km from central cities by 0.0007%. Additionally, each 1% increase in ULIU in central cities can drive the central cities’ economic growth by 1.0283% (see Table 3), and then, the GDPs of other cities in a radius of 100 km from central cities in the urban agglomeration can indirectly grow by 0.0047% through the diffusion effect of the central cities’ economic growth.
China’s rapid urban expansions in recent decades have led to the conversion of a large amount of agricultural land into urban construction land. Land resource constraints are becoming increasingly tight, and ULIU has become inevitable [68,69,70]. In general, ULIU has significantly promoted ESSCC, which is much higher than the positive effect of urban land expansions. This shows that ULIU should be prioritized over urban land expansions to promote ESSCC. However, since the diffusion effects of the economic growth of central cities aresmall, the current intensive use of urban land in central cities only has a small positive effect on the economic growth of other cities. It is necessary to further enhance the diffusion effects of the economic growth of the central cities in urban agglomerations to increase the positive impacts of ULIU on the ESSCC.
The estimation results show that the Pearl River Delta, Yangtze River Delta, Middle Reaches of the Yangtze River, Guanzhong Plain, and Harbin–Changchun urban agglomerations’ ULIU in central cities has no significant impact on the ESSCC. The ULIU in the central cities of the Beijing–Tianjin–Hebei urban agglomeration will directly drive the economic growth of other cities in the urban agglomeration. However, the ULIU in the central cities of the Central Plains urban agglomeration will directly inhibit the economic growth of other cities. Additionally, the intensive land use in the central cities of the Chengdu–Chongqing urban agglomeration will indirectly inhibit the economic growth of other cities in the urban agglomeration (see Table 3).

4.2.3. The Effects of the ULSS on the ESSCC in Urban Agglomerations

In the supply structure of urban land, only the proportion of industrial land in the leased land of central cities can indirectly significantly increase the GDP of other cities in urban agglomerations. However, the proportion of commercial land and the proportion of residential land in the leased land has no significant effect on ESSCC (see Table 3). This also confirms the local economic development model in which local governments boost the economy through industrial land leasing and increase fiscal revenue through commercial land leasing [85]. Industrial land leasing can drive economic growth through the introduction of industrial investment and then promote the economic growth of related industries in other cities in the urban agglomeration through diffusion effects such as industrial chains. However, it is relatively difficult to form a spatial correlation between commercial land and residential land in the cities and their spatial influence on economic growth.
The estimation results on typical urban agglomerations show that the increase in the proportion of residential land in the central cities of the Beijing–Tianjin–Hebei urban agglomeration can help to significantly drive the economic growth of other cities. The increase in the proportion of industrial land and the proportion of residential land in leased land can directly increase the ESSCC in the Yangtze River Delta, but an increase in the proportion of commercial land in leased land can inhibit the economic growth of other cities. The increase in the proportion of residential land in leased land of central cities in the Pearl River Delta can directly drive the economic growth of other cities in the urban agglomeration. The increase in the proportion of commercial land in leased land in the central cities of the Chengdu–Chongqing urban agglomeration can directly enhance its role in driving central cities’ economic spatial spillovers. However, the ULSS in the Middle Reaches of the Yangtze River, the Central Plains, the Guanzhong Plain, and the Harbin–Changchun urban agglomerations did not have significant impacts on the ESSCC (see Table 3).

4.2.4. The Impacts of Urban Land Marketization on the ESSCC in Urban Agglomerations

The marketization of urban land indirectly increases ESSCC in urban agglomerations. From 2003 to 2016, the proportion of urban land leased by bidding, auction, and listing increased by 60% in China. Assuming that the proportion of land leased by bidding, auction, and listing in central cities also increased by 60%, this will drive the central cities’ economic growth by 0.0660% and then indirectly drive the GDP of other cities in a radius of 100 km from central cities in urban agglomerations to increase by 0.0003% through the diffusion effect of the economic growth of the central cities (see Table 3). Overall, the degree of urban land marketization in China has greatly improved [86], but the marketization of urban land has less of a driving effect on economic growth. In addition, the diffusion effect of central cities is small, which leads to small positive effects of land marketization on the ESSCC.
The estimation results of typical urban agglomerations show that the marketization of urban land in the central cities of the Yangtze River Delta, Central Plains, and Harbin–Changchun urban agglomeration can help to enhance the ESSCC. However, the marketization of urban land in central cities in the Chengdu–Chongqing urban agglomeration indirectly enhances its siphon effect, leading to a decline in economic growth in other cities in the urban agglomeration. The urban land marketization of central cities in Beijing–Tianjin–Hebei can directly crowd out the economic growth of other cities. The urban land marketization of central cities in the Pearl River Delta, the Middle Reaches of the Yangtze River, and the Guanzhong Plain urban agglomerations have no significant impacts on ESSCC.

4.2.5. The Influences of the Urban Land Prices on the ESSCC in Urban Agglomerations

Rising urban prices indirectly strengthen the ESSCC. Each 1% increase in urban land prices drives the economic growth of central cities by 0.0537%, and then, indirectly promotes the economic growth of other cities in a radius of 100 km from central cities by 0.0002% through the diffusion effects of economic growth in the central cities. The direct effects of urban land prices on the ESSCC are non-significant (see Table 3).
The estimation results show that China’s urban land prices rose rapidly, and effectively stimulated urban economic growth. On the one hand, the increase in urban land prices has compelled enterprises to increase their investment, thereby driving economic growth [73]. On the other hand, as urban prices rise, it may be conducive to the expansion of fiscal revenue to stimulate economic growth through fiscal expenditures and infrastructure investment [50]. Finally, through the spatial spillovers of the economic growth in central cities, urban land prices indirectly promote the economic growth of other cities in the urban agglomerations.
The estimated results of the urban agglomerations show that an increase in the urban land prices in the central cities of the Central Plains urban agglomeration can indirectly enhance ESSCC. However, urban land prices’ increase in the central cities of the Chengdu–Chongqing urban agglomeration can weaken its siphon effect. The urban land prices in other representative urban agglomerations do not have significant impacts on the ESSCC.

4.3. The Intermediate Mechanism of the ULUT Affect the ESSCC in Urban Agglomerations

The estimation results show that there are significant spatial diffusion effects on enterprise investment, infrastructure investment, labor, and technical efficiency in the central cities in urban agglomerations. Only the spatial diffusion effects of fiscal expenditure are not significant (see Table 4). The spatial diffusion effects of the production factors in central cities also give economic growth a significant radiating driving effect.

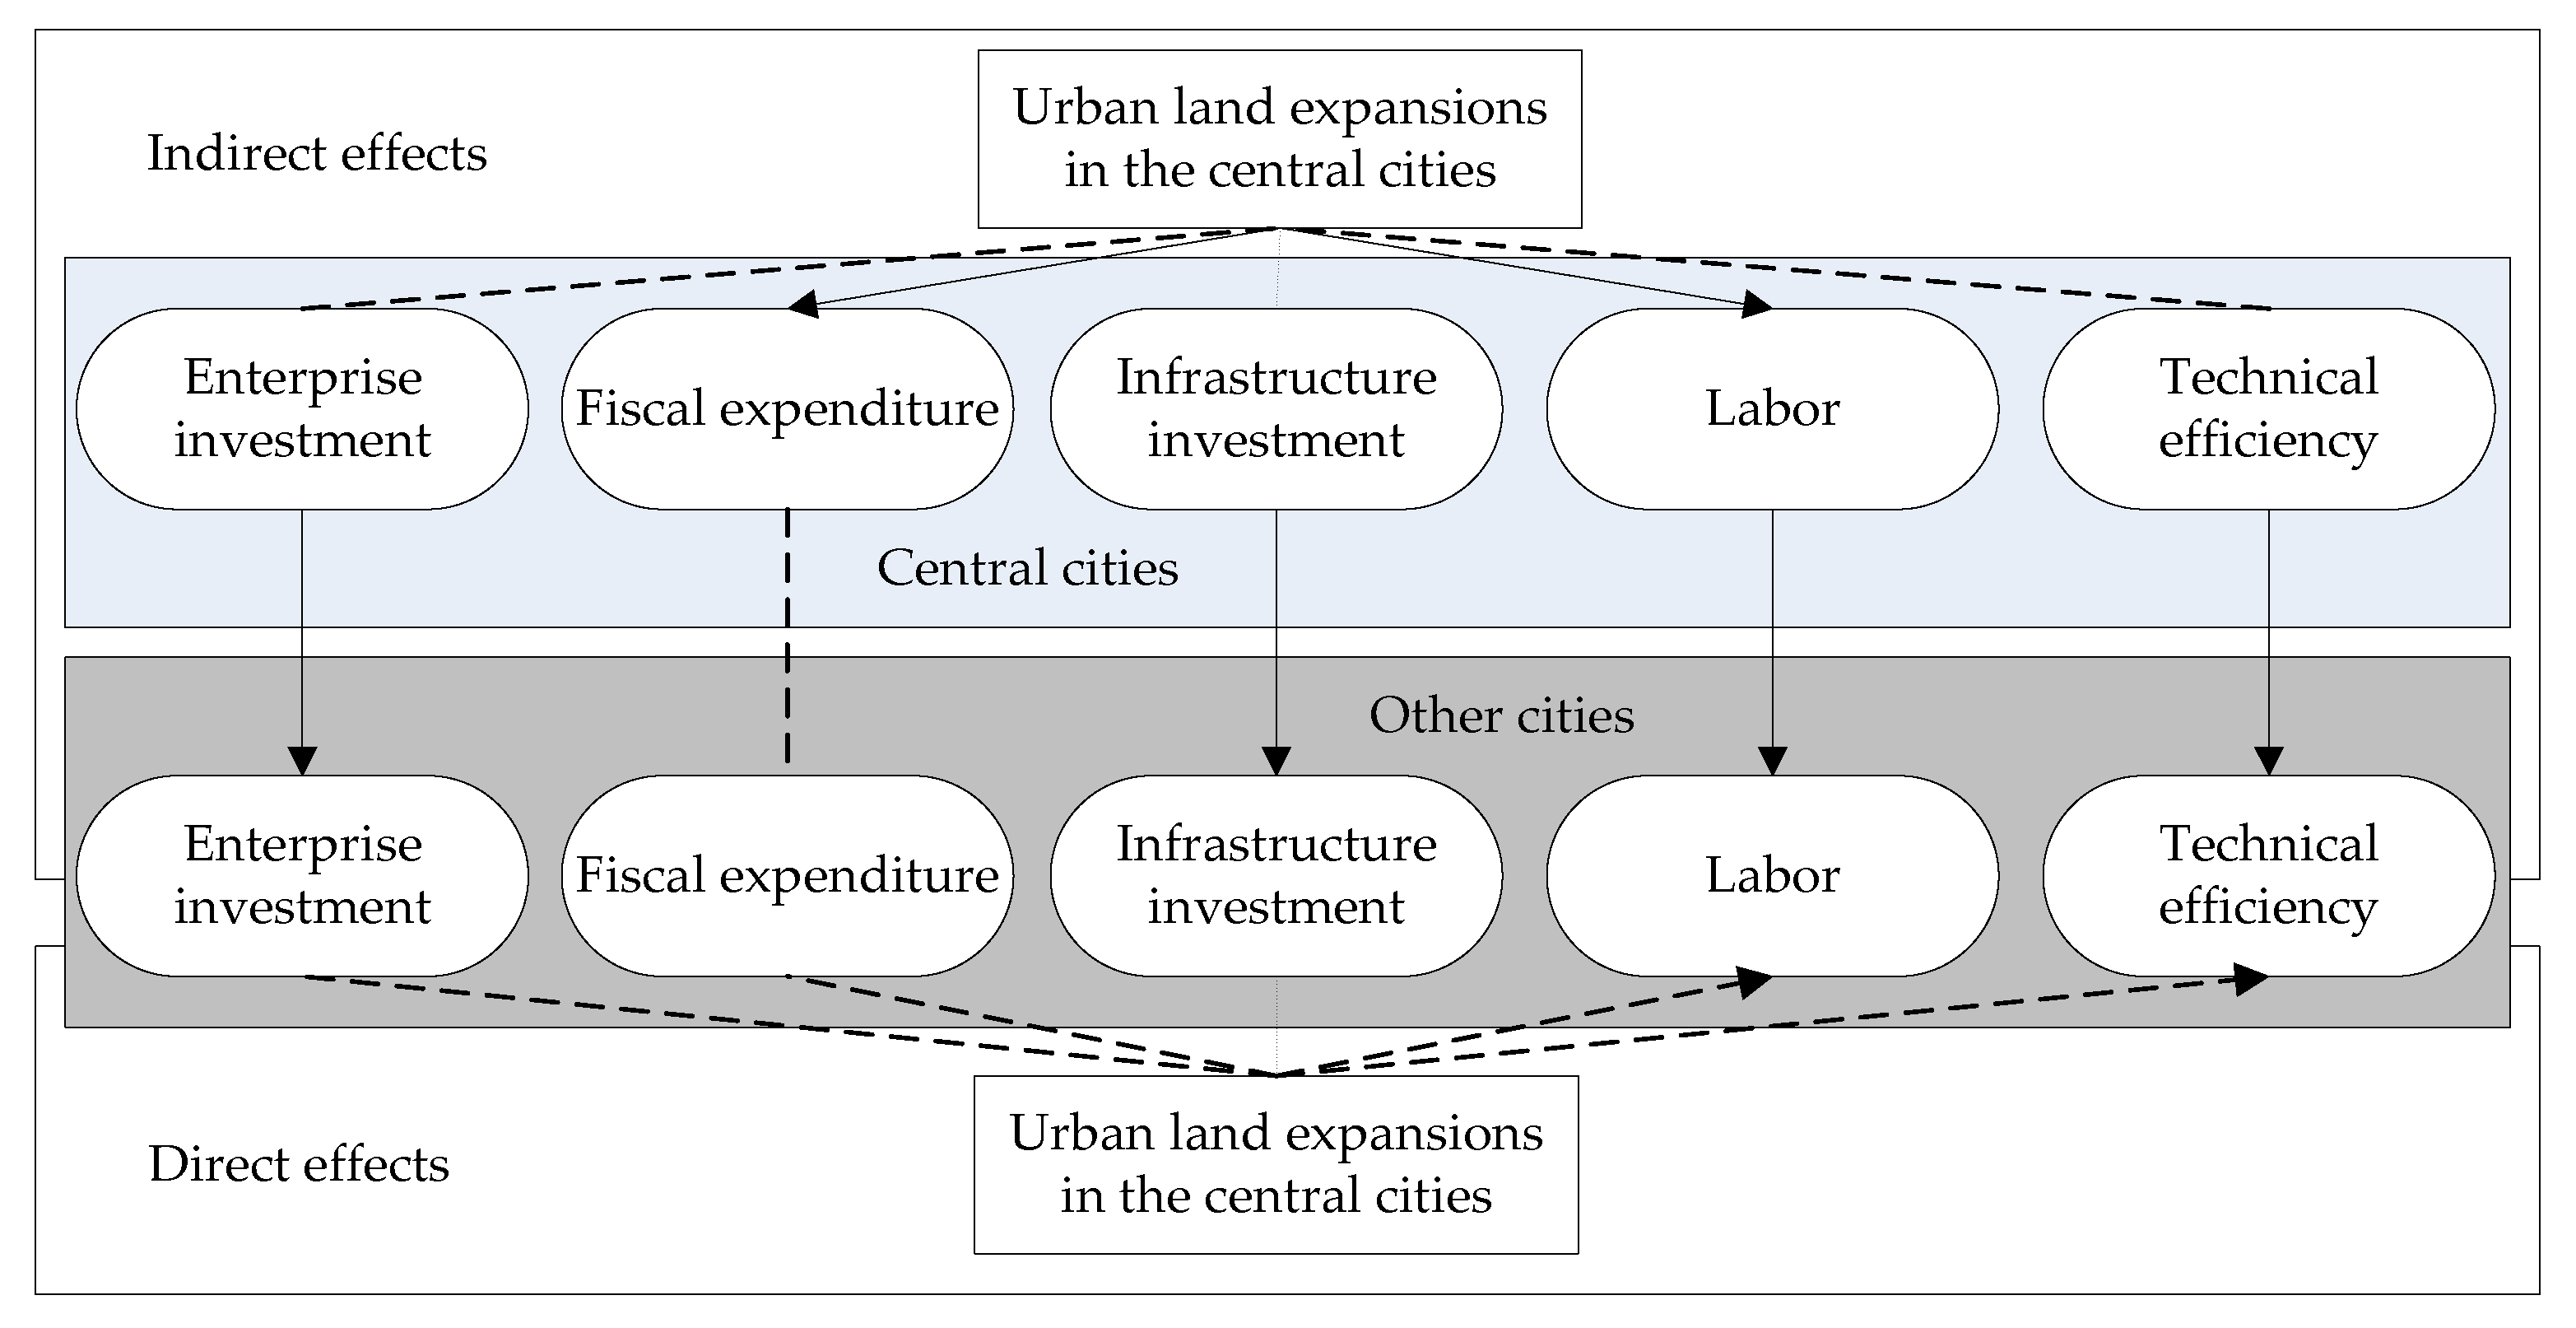
4.3.1. The Influences of the Urban Land Expansions on the Production Factors and Their Spatial Effects in Urban Agglomerations

The urban land expansions in central cities can drive the growth of labor therein and then, indirectly drive the growth of labor in other cities through the spatial linkage effect of labor (see Table 4 and Figure 4). However, the urban land expansions in central cities will directly inhibit the growth of labor and technical efficiency in other cities in the urban agglomeration. Urban land expansions have no direct significant impact on corporate investment, fiscal expenditure, and infrastructure investment in other cities.

4.3.2. The Influences of the ULIU on the Production Factors and Their Spatial Effects in Urban Agglomerations

Intensive of urban land use in central cities has significantly driven the growth of production factors in other cities. The ULIU in central cities hassignificant positive effects on enterprise investment, infrastructure investment, and technical efficiency, and it can indirectly drive the growth of these production factors in other cities through their spatial diffusions (see Table 4 and Figure 5). Simultaneously, the ULIU in central cities can also directly drive enterprise investment in other cities. Thus, strengthening ULIU is currently an effective way to strengthen the ESSCC in China [84].

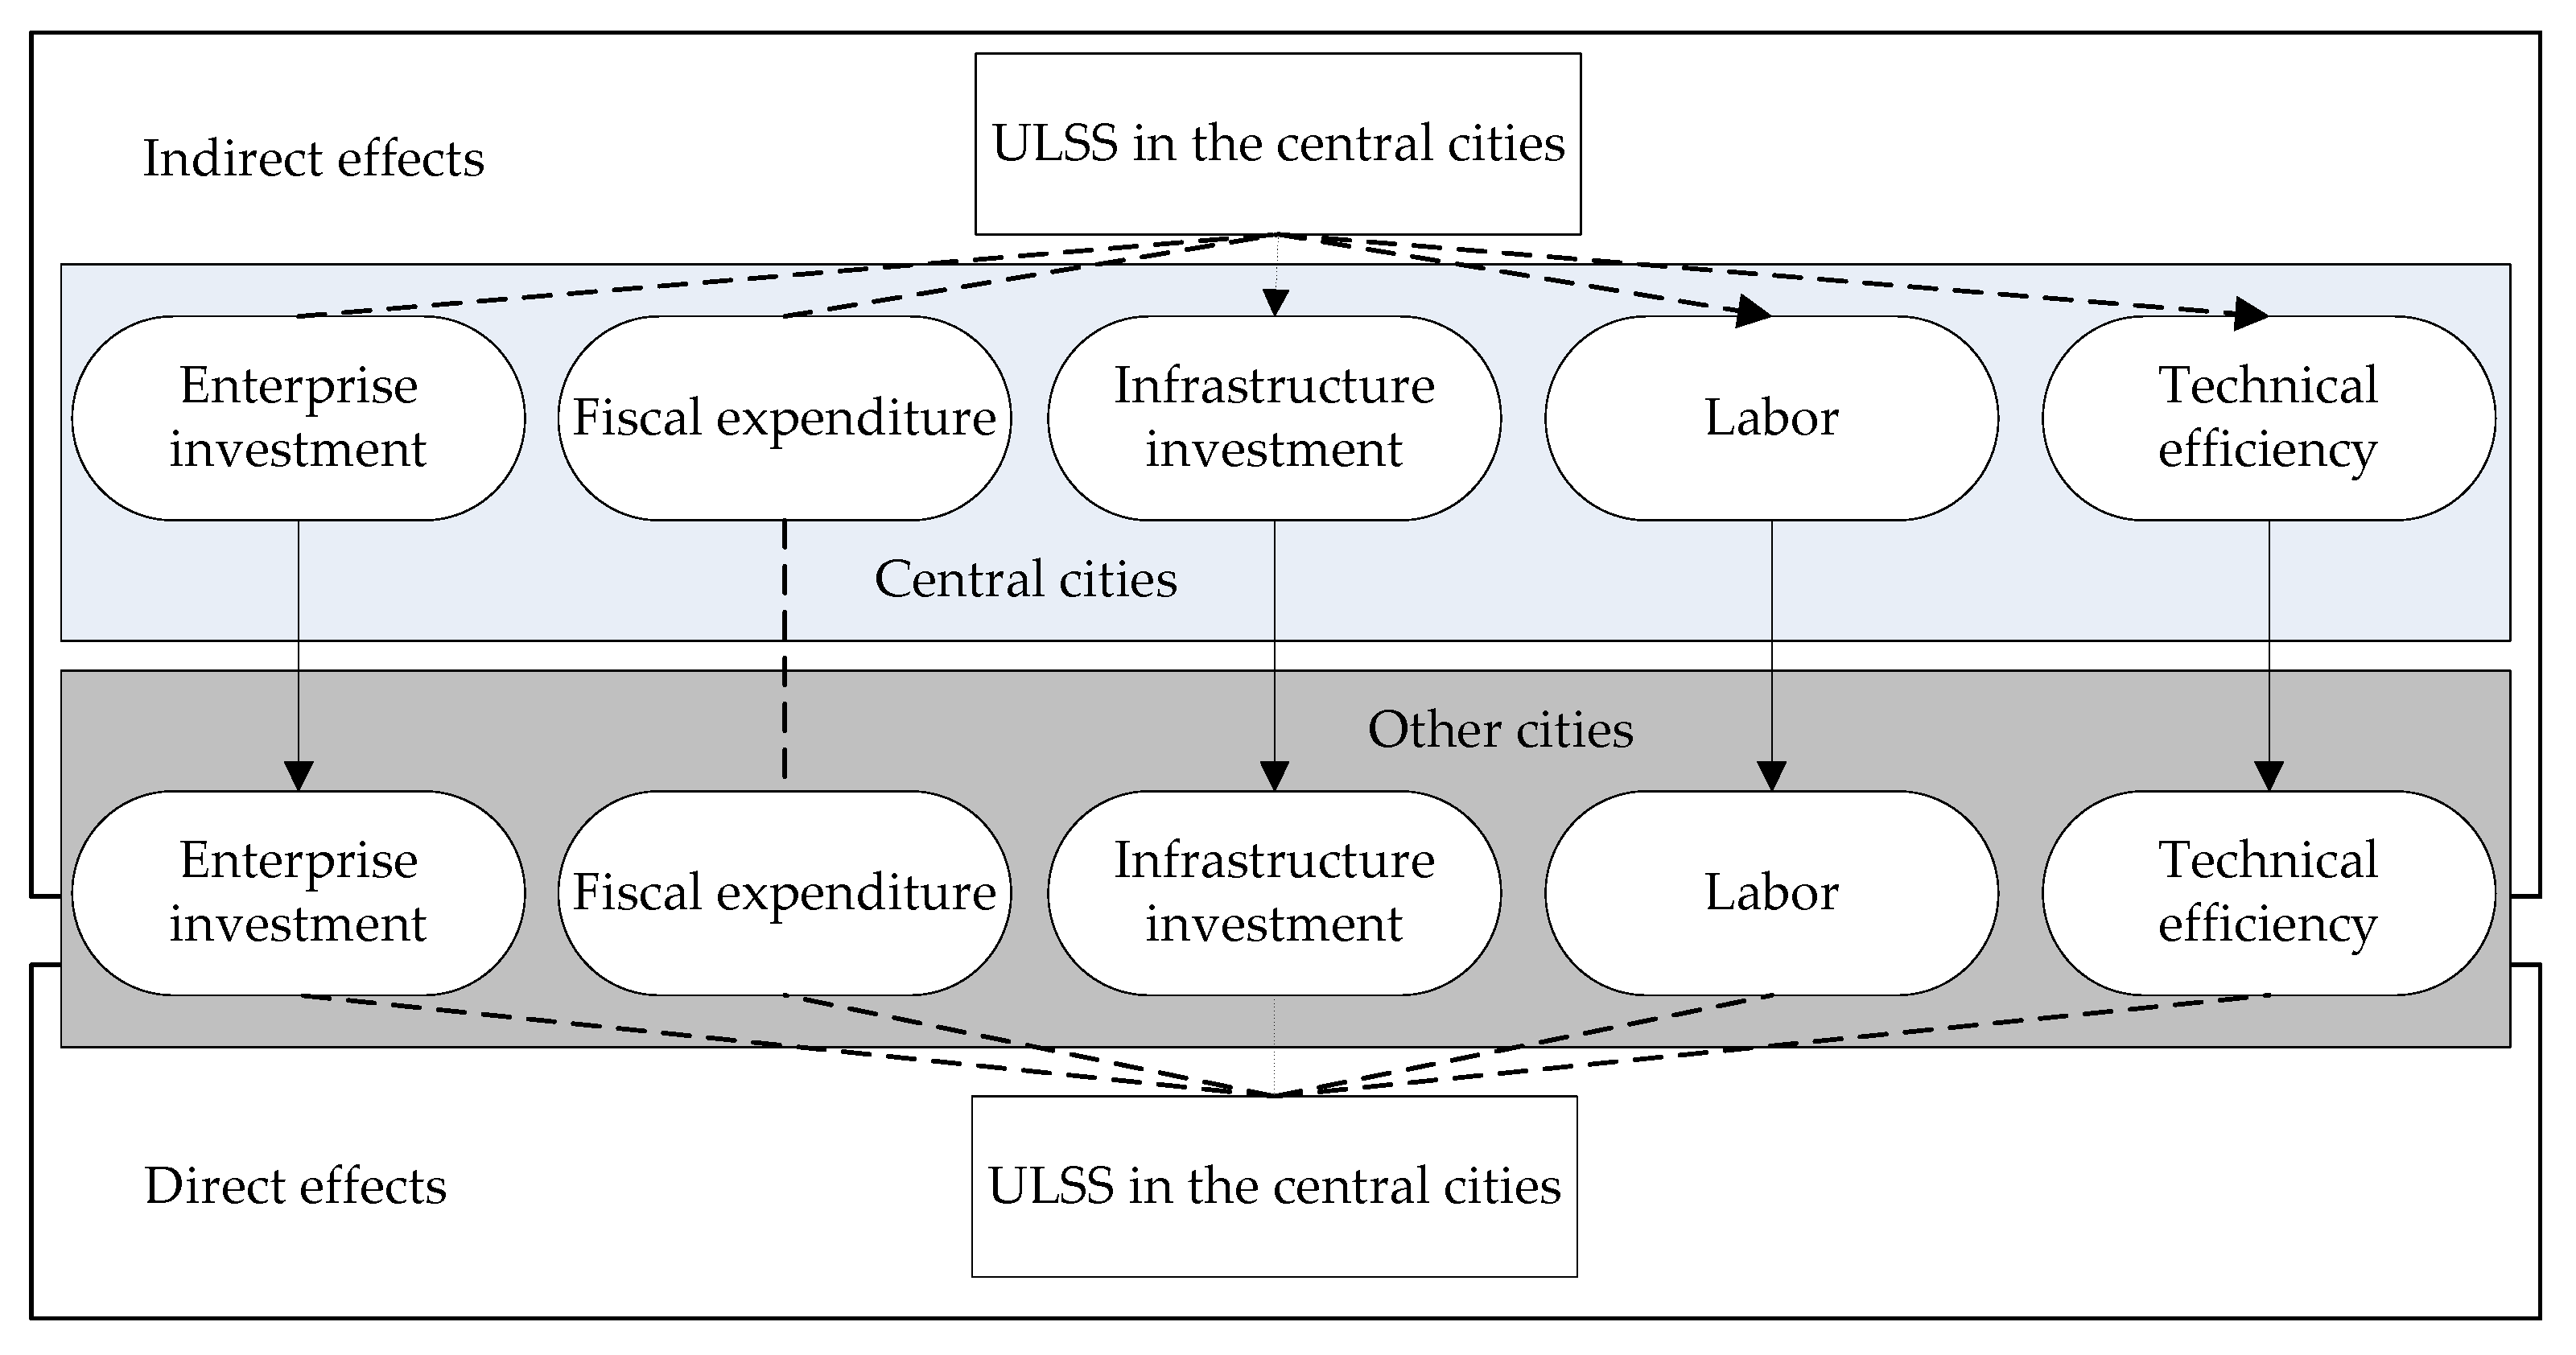
4.3.3. The Influences of the ULSS on the Production Factors and Their Spatial Effects in Urban Agglomerations

Increasing the proportion of industrial land, commercial land, and residential land in leased land in central cities can indirectly squeeze out labor in other cities and also inhibit the improvement of technical efficiency in other cities. An increase in the proportion of commercial land and the proportion of residential land in leased land in central cities can squeeze out labor and indirectly reduce the labor in other cities through the spatial linkage effect of labor. At the same time, an increase in the proportion of industrial land, commercial land, and residential land in leased land in central cities can inhibit the improvement of urban technical efficiency in other cities indirectly (see Table 4 and Figure 6). Therefore, when optimizing the urban spatial structure and reducing the proportion of industrial land in China, the input–output benefit of existing industrial land should be increased and technical efficiency should be improved to mitigate the damage of the reduction in the proportion of industrial land on the improvement of technical efficiency.

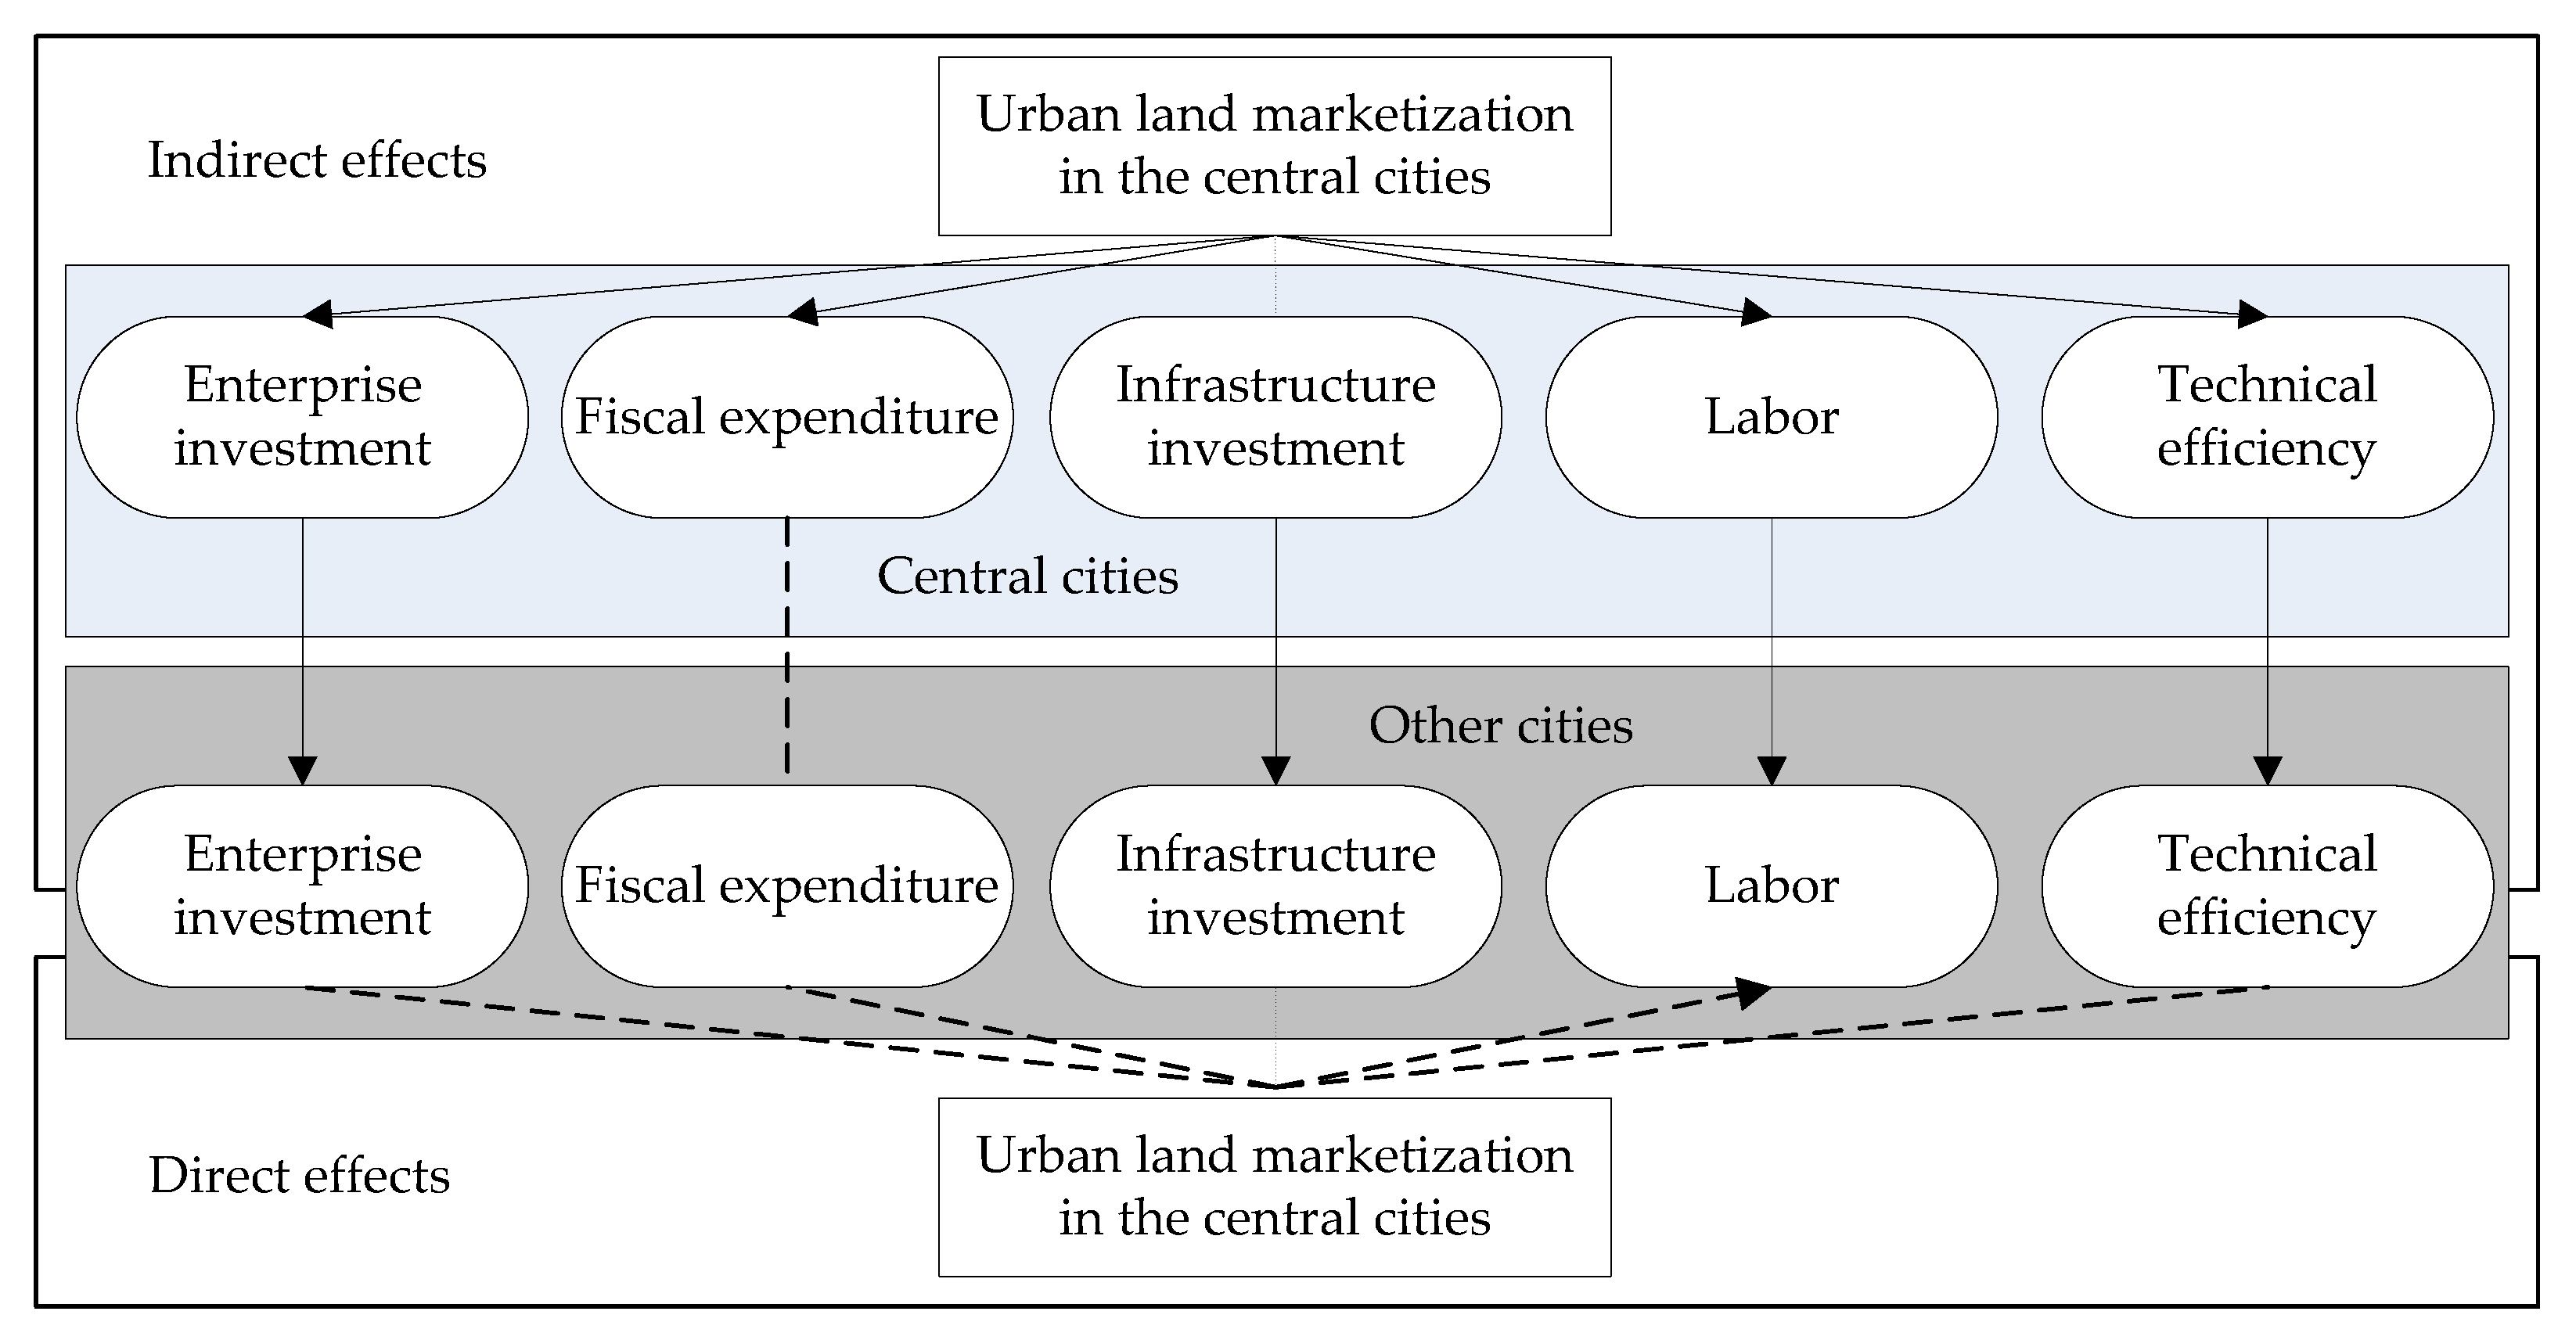
4.3.4. The Influences of the Urban Land Marketization on the Production Factors and Their Spatial Effects in Urban Agglomerations

Urban land marketization indirectly promotes the radiating and leading role of production factors in central cities (see Table 4 and Figure 7). Urban land marketization effectively prevents the introduction of low investment and low-efficiency enterprises, which may be caused by negotiated leasing and the “bottom line” competition among local governments. Additionally, it also effectively promotes the growth of corporate investment, labor, and technical efficiency [73,85], and then drives the increase in these production factors in other cities through their spatial diffusion effect.

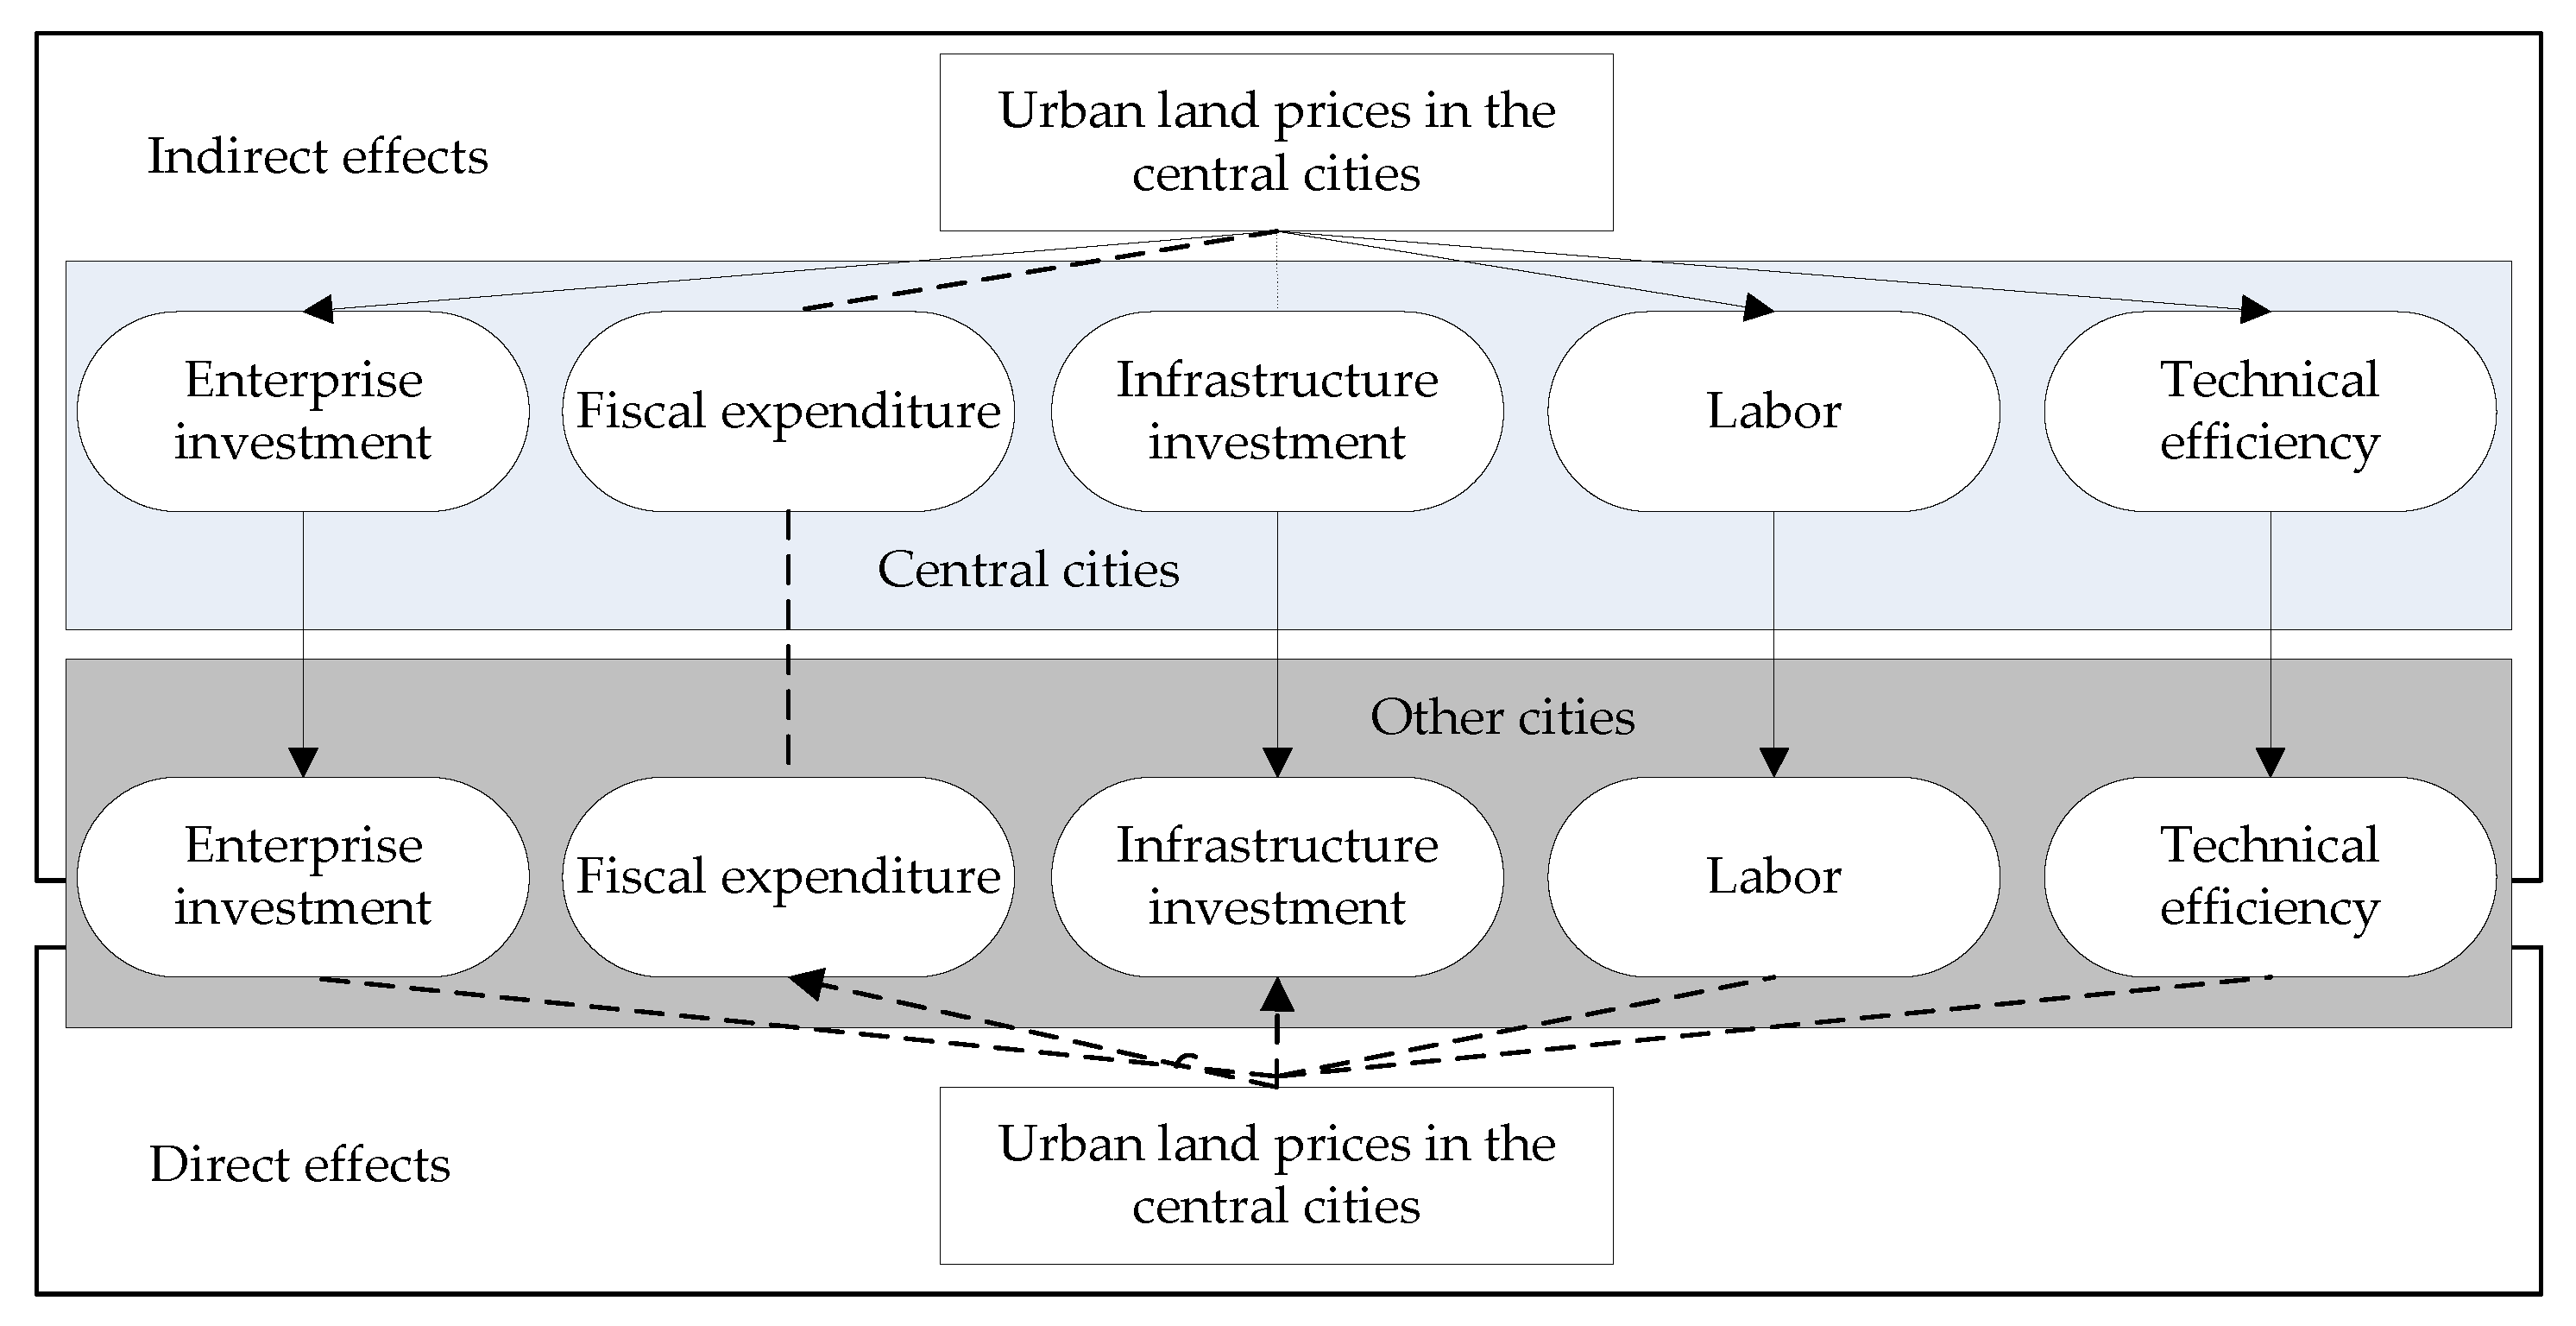
4.3.5. The Influences of the Urban Land Prices on the Production Factors and Their Spatial Effects in Urban Agglomerations

Rising urban land prices in central cities will directly crowd out the fiscal expenditures and infrastructure investment of other cities, but this will indirectly stimulate the growth of corporate investment, labor and technical efficiency in other cities as well (see Table 4 and Figure 8). The estimated results of the impacts of rising urban land prices on corporate investment show that rising urban land prices have not only failed to crowd out corporate investment, labor, and technical efficiency, but they have spurred them instead. The reason is that as the urban land prices continue to rise, companies must increase their investment intensity to obtain higher returns per unit of land [73]. At the same time, the rising land prices also have a screening effect on enterprises. Only companies with higher technical efficiency and better input–output efficiency can earn profits in that environment. Rising urban land prices have also forced technical efficiency improvements.

5. Discussion

5.1. Why Are the Positive Effects of ULUT on the ESSCC Small?

The study finds that in general, China’s ULUT has enhanced the ESSCC, but the positive effects are small. From the estimation results, on the one hand, urban land expansions, the adjustment of ULSS, urban land marketization, and urban land prices have positive but small effects on economic growth; on the other hand, the spatial spillovers of economic growth and production factors in central cities in China’s urban agglomerations are very small.
Regional economic growth and urbanization are important assessment tools for the promotion of local officials in China [87]. Therefore, in China, urban land expansions are often used as a tool in the “local officials promotion tournament” [49]. However, there exists regional “bottom line competition” in the process of attracting investment through urban land expansion, which achieves the purpose of introducing enterprise investment projects by lowering the land leasing price and reducing the quality of enterprise investment [55,80]. After enterprises are introduced, there may be problems relating to land hoarding, low investment intensity, and low profitability that reduce the driving effects of urban land expansions on enterprise investment, fiscal revenue, and economic growth [51]. In view of this, the Chinese government has issued a series of policies to improve urban land use efficiency by assessing land investment intensity and output intensity through bidding, auction, and listing to lease land and optimize the supply structure of urban land [17,84]. This study found that strengthening the intensive use of urban land and promoting urban land marketization in China are indeed effective measures through which to enhance the ESSCC in urban agglomerations.
On the basis of urbanization, the Chinese government has approved many urban agglomerations with a view to enhancing the ESSCC and promoting the coordinated development of urban agglomerations through their development planning [66]. However, there are many problems with urban agglomerations, such as their high industrial homogeneity, weak industrial correlation, prevailing local protectionism, serious market segmentation, and unsmooth circulation of production factors. More resources and factors are directed to central cities, and urban agglomerations lack systematic economic development planning and a perfect regional cooperation mechanism [88]. These problems result in the impact of the ESSCC remaining small, and the ESSCC in some urban agglomerations is not significant or even negative.

5.2. Suggestions for ULUT to Promote the ESSCC

The results suggest that enhancing the ESSCC, strengthening the intensive use of land, and deepening the land marketization reform are important measures to promote the economic radiation of central cities by strengthening the ULUT. Therefore, eliminating local protectionism and barriers to the flow of factors between cities, enhancing collaboration between cities, further strengthening the assessment of land use efficiency, prohibiting extensive expansion of construction land, and local governments using more market-oriented methods to supply land will contribute to the positive effect of ULUT on ESSCC.
It is necessary to establish and improve the coordinated development mechanism among cities in urban agglomerations [66,88]. At present, the spatial spillovers of economic growth and production factors in the central cities in China’s urban agglomerations are relatively small. Establishing and perfecting a coordinated development mechanism between cities in urban agglomerations can effectively enhance the ESSCC, e.g., by establishing relevant mechanisms for inter-citycommunication and coordination, planning docking, technical support, and industrial division and cooperation to promote practical cooperation between cities in infrastructure construction, public utilities development, and industrial division of labor and breaking industry monopolies and regional blockades to promote the free flow and orderly competition of commodities and various elements. For cross-city project construction, industry transfer, and investment activities, etc., joint construction, demutualization operation, and other ways and means should be adopted to share benefits. By standardizing the financial transfer payment system and establishing an inter-city compensation system and a special fund for urban coordinated development, the surrounding cities will be compensated for their loss of interests in the process of coordinated development. The formulation of laws and regulations that promote the coordinated development of cities should also be made quicker.
The intensive use of urban land should also continue to be strengthened, as the ULIU has directly and indirectly significantly enhanced the ESSCC. China needs to further reduce the scale of newly added urban land used for construction in cities, focus on revitalizing the existing land used for construction, strictly enforce the regulations on recovering idle land or collecting idle land fees in accordance with the law, and encourage the redevelopment of inefficient land in cities. Moreover, it should intensify the development of urban land, increase land investment, and overall control the per capita land use index so as to improve the input–output efficiency of urban land and optimize the supply structure of urban land. The coordination and connection between industrial development planning and land space planning should be strengthened to promote the migration of some industries in the central urban areas of megacities to satellite cities to further enhance the positive effect of ULIU on the ESSCC.
The urban land market mechanism needs to be further improved [12,89]. The increase in the marketization level of urban land has indirectly significantly enhanced the ESSCC. It is necessary to further improve the urban land market mechanism, deepen the reform of the system of the paid use of state-owned construction land, expand the scope of paid use of state-owned land, gradually implement the paid use of land for business infrastructure and social undertakings, reduce the scope of land allocation, and improve the secondary market for land lease, transfer, and mortgage to promote the coordinated development of cities in urban agglomerations. It isnecessary to speed up the formation of a sound and healthy price mechanism, improve the implementation policies related to the minimum price standard for industrial land leasing, establish an effective mechanism for adjusting the reasonable price ratio between industrial land and residential land, and constrain extensive land use by leveraging prices to encourage intensive use of urban land.

5.3. Limitations and Future Research

From the perspective of the spatial effects of ULUT, this paper combs the data to estimate their impacts on the ESSCC in urban agglomerations and uncover its intermediate mechanism, to meaningfully supplement the existing research on urban land use and economic growth in China. It also provides a valuable reference for urban land use and resource regulations, territorial space planning, and new urbanization.
However, this article also has limitations. First, due to data availability, this paper only contains a sample of cities above the prefecture level in the urban agglomerations and does not contain cities at the county level. Therefore, the impacts of the ULUT in central cities on the production factors and economic growth of county-level cities, and the impacts of ULUT in prefecture-level cities in urban agglomerations on the production factors and economic growth in county-level cities have not been identified. Second, this paper selects the urban land expansions to describe the explicit transition, and the ULIU, the ULSS, the urban land marketization, and urban land prices to describe the implicit transition. However, the content of urban land use transition is richer than this [58,59,60,61,62,63]. Third, this paper identifies the effect and intermediate mechanism of ULUT on the ESSCC. However, the factors affecting the effects of ULUT on the ESSCC are very complicated, and it is difficult to conduct systematic empirical tests on all of the possible factors in a single paper. In the future, we will focus our quantitative and empirical research on the factors of ULUT affecting corporate investment structure, input–output efficiency, and labor mobility.

6. Conclusions

There have been relevant studies in the context of private land ownership, mainly from the perspective of land as a limited production factor, discussing the impact of land on economic growth [38,39,40,41]; China’s land system is publicly owned, and land is often used by local governments as a tool to achieve economic growth goals. Urban land expansion is used to drive investment and stimulate economic growth [33,34,35]; in the context of the public ownership of land in China, this article accepts land as a tool for economic growth of local governments. Based on the perspective of the flow of production factors, this paper studies the effect of ULUT on the ESSCC. Compared with the existing research results, it is found that in addition to urban land expansion, explicit ULUT will affect production factors and thus, affect economic growth [33,34], and implicit ULUT, such as ULIU, urban land supply structure, and urban land marketization, urban land prices, etc., will also affect production factors and thus, economic growth. Moreover, strengthening the implicit ULUT is more conducive to enhancing the ESSCC. Since 2003, China’s urban land use has undergone rapid transitions that havemanifested in the rapid expansions of urban land, the increase in ULIU, the gradual decline in the proportion of urban industrial land, commercial land, and residential land in leased land, urban land marketization, the substantial increase in land prices, and other implicit transition features. Moreover, there are significantly positive spatial autocorrelations in ULUT.
The ULUT in China has enhanced the ESSCC in urban agglomerations. On the one hand, ULUT indirectly enhances ESSCC through their positive effects on economic growth and the spatial spillovers of economic growth; on the other hand, both the urban land expansions and ULIU in central cities can directly drive the economic growth in other cities in the agglomerations, thus enhancingthe ESSCC. The ULUT in central cities indirectly promotes the growth of enterprise investments, infrastructure investments, labor, and technical efficiencies in other cities in the agglomerations, through its positive effects on these production factors and their spatial diffusion effects. This is the main intermediate mechanism by which the ULUT in central cities enhances the ESSCC. However, the positive effect of ULUT on ESSCC in the agglomerations is small, as its promoting effects on economic growth and the spatial spillovers of economic growth in central cities are small. In addition, there are great differences in the impact and formation mechanisms of ULUT in the central cities of major urban agglomerations on the ESSCC.
China has experienced nearly 40 years of rapid economic growth and urbanization, which has brought about large-scale expansion of urban land. As land resources continue to tighten, China is undergoing ULUT, from the original extensive urban land expansion to implicit ULUT, such as optimizing urban land supply structure, promoting urban land marketization, and strengthening ULIU, etc. A new urbanization plan has been issued to enhance the ESSCC and promote coordinated development between cities. This paper combines ULUT with ESSCC, and the results obtained can provide valuable references for enhancing the ESSCC by optimizing ULUT. Based on the results, continuing to strengthen ULIU and improve the urban land market are conducive to enhancing the ESSCC in urban agglomerations. However, only by establishing the coordination mechanism of the economic development of urban agglomerations can it be more helpful to exert the positive impact of ULUT on the ESSCC.

Author Contributions

Conceptualization, H.L., K.C., Y.C. and Y.Z.; methodology, H.L., K.C. and L.L.; validation, H.L., K.C. and L.Y.; formal analysis, H.L. and L.Y.; data curation, H.L. and L.L.; writing—original draft preparation, H.L., K.C. and L.Y.; writing—review and editing, H.L., K.C., L.Y., Y.Z., L.L. and Y.C.; visualization, K.C., Y.Z. and Y.C.; supervision, K.C.; funding acquisition, H.L. All authors have read and agreed to the published version of the manuscript.

Funding

This study is supported by the National Social Science Foundation of China (No. 18CJY033), National Natural Science Foundation of China (No. 41971216) and the Provincial Social Science Foundation of Hunan (No.18YBQ132).

Institutional Review Board Statement

Not applicable.

Informed Consent Statement

Not applicable.

Data Availability Statement

The data came from the China City Statistical Yearbook, the China Land and Resources Statistical Yearbook, the Statistical Yearbook of Urban Construction in China, and China Land Market Net.

Conflicts of Interest

The authors declare no conflict of interest.

References

  1. Deng, X.; Huang, J.; Rozelle, S.; Uchida, E. Economic Growth and the Expansion of Urban Land in China. Urban Stud. 2009, 47, 813–843. [Google Scholar] [CrossRef]
  2. Ji, Y.; Guo, X.; Zhong, S. Land Financialization, Uncoordinated Development of Population Urbanization and Land Urbanization, and Economic Growth: Evidence from China. Land 2020, 9, 481. [Google Scholar] [CrossRef]
  3. Xiao, J.; Shen, Y.; Ge, J.; Tateishi, R.; Tang, C.; Liang, Y.; Huang, Z. Evaluating urban expansion and land use change in Shijiazhuang, China, by using GIS and remote sensing. Landsc. Urban Plan. 2006, 75, 69–80. [Google Scholar] [CrossRef]
  4. Yu, Y.; Xu, T.; Wang, T. Outmigration Drives Cropland Decline and Woodland Increase in Rural Regions of Southwest China. Land 2020, 9, 443. [Google Scholar] [CrossRef]
  5. Yan, L.; Hong, K.; Chen, K.; Li, H.; Liao, L. Benefit distribution of collectively-owned operating construction land entering the market in rural China: A multiple principal–agent theory-based analysis. Habitat Int. 2021, 109, 102328. [Google Scholar] [CrossRef]
  6. Yan, L.; Hong, K.; Li, H. Transfer of Land Use Rights in Rural China and Farmers’ Utility: How to Select an Optimal Payment Mode of Land Increment Income. Land 2021, 10, 450. [Google Scholar] [CrossRef]
  7. Ning, J.; Liu, J.; Kuang, W.; Xu, X.; Zhang, S.; Yan, C.; Li, R.; Wu, S.; Hu, Y.; Du, G.; et al. Spatiotemporal patterns and characteristics of land-use change in China during 2010–2015. J. Geogr. Sci. 2018, 28, 547–562. [Google Scholar] [CrossRef] [Green Version]
  8. Zhang, X.; Wu, Y.; Shen, L. An evaluation framework for the sustainability of urban land use: A study of capital cities and municipalities in China. Habitat Int. 2011, 35, 141–149. [Google Scholar] [CrossRef]
  9. Long, H.; Li, Y.; Liu, Y.; Woods, M.; Zou, J. Accelerated restructuring in rural China fueled by ‘increasing vs. decreasing balance’ land-use policy for dealing with hollowed villages. Land Use Policy 2012, 29, 11–22. [Google Scholar] [CrossRef]
  10. Yu, J.; Zhou, K.; Yang, S. Land use efficiency and influencing factors of urban agglomerations in China. Land Use Policy 2019, 88. [Google Scholar] [CrossRef]
  11. Lu, X.; Ke, S. Evaluating the effectiveness of sustainable urban land use in China from the perspective of sustainable urbanization. Habitat Int. 2018, 77, 90–98. [Google Scholar] [CrossRef]
  12. Wang, J.; Chen, Y.; Shao, X.; Zhang, Y.; Cao, Y. Land-use changes and policy dimension driving forces in China: Present, trend and future. Land Use Policy 2012, 29, 737–749. [Google Scholar] [CrossRef]
  13. Gong, J.; Chen, W.; Liu, Y.; Wang, J. The intensity change of urban development land: Implications for the city master plan of Guangzhou, China. Land Use Policy 2014, 40, 91–100. [Google Scholar] [CrossRef]
  14. Wei, Y.H.D. Restructuring for growth in urban China: Transitional institutions, urban development, and spatial transformation. Habitat Int. 2012, 36, 396–405. [Google Scholar] [CrossRef]
  15. Liu, T.; Cao, G.; Yan, Y.; Wang, R.Y. Urban land marketization in China: Central policy, local initiative, and market mechanism. Land Use Policy 2016, 57, 265–276. [Google Scholar] [CrossRef]
  16. Gao, J.; Wei, Y.D.; Chen, W.; Chen, J. Economic transition and urban land expansion in Provincial China. Habitat Int. 2014, 44, 461–473. [Google Scholar] [CrossRef]
  17. Long, H. Land use policy in China: Introduction. Land Use Policy 2014, 40, 1–5. [Google Scholar] [CrossRef]
  18. The Ministry of Land and Resources of China. Regulations on the Transfer of State-Owned Construction Land Use Rights by Bidding, Auction and Listing. Available online: http://www.gov.cn/gongbao/content/2008/content_970300.htm (accessed on 28 September 2007).
  19. State Council of China. Outline of National Overall Land Use Planning in China (2006–2020). Available online: http://www.gov.cn/zxft/ft149/content_1144625.htm (accessed on 24 October 2008).
  20. The Ministry of Land and Resources of China. Guiding Opinions of the Ministry of Land and Resources on Promoting Land Conservation and Intensive Utilization. Available online: http://www.gov.cn/xinwen/2014-09/26/content_2756852.htm (accessed on 26 September 2014).
  21. Zhou, Y.; Huang, X.; Chen, Y.; Zhong, T.; Xu, G.; He, J.; Xu, Y.; Meng, H. The effect of land use planning (2006–2020) on construction land growth in China. Cities 2017, 68, 37–47. [Google Scholar] [CrossRef]
  22. Chen, Y.; Chen, Z.; Xu, G.; Tian, Z. Built-up land efficiency in urban China: Insights from the General Land Use Plan (2006–2020). Habitat Int. 2016, 51, 31–38. [Google Scholar] [CrossRef]
  23. Yang, Y.; Bao, W.; Li, Y.; Wang, Y.; Chen, Z. Land Use Transition and Its Eco-Environmental Effects in the Beijing–Tianjin–Hebei Urban Agglomeration: A Production–Living–Ecological Perspective. Land 2020, 9, 285. [Google Scholar] [CrossRef]
  24. Allen, J. Global City-Regions: Trends, Theory, Policy; Oxford University Press: Oxford, UK, 2001. [Google Scholar]
  25. Zhen, F.; Cao, Y.; Qin, X.; Wang, B. Delineation of an urban agglomeration boundary based on SinaWeibo microblog ‘check-in’ data: A case study of the Yangtze River Delta. Cities 2017, 60, 180–191. [Google Scholar] [CrossRef]
  26. The Central Committee of the Communist Party of China, State Council of China. The National New Urbanization Plan (2014–2020). Available online: http://www.gov.cn/zhengce/2014-03/16/content_2640075.htm (accessed on 16 March 2014).
  27. Long, H.; Tang, G.; Li, X.; Heilig, G.K. Socio-economic driving forces of land-use change in Kunshan, the Yangtze River Delta economic area of China. J. Environ. Manag. 2007, 83, 351–364. [Google Scholar] [CrossRef]
  28. Ding, C.; Lichtenberg, E. Land and Urban Economic Growth in China. J. Reg. Sci. 2010, 51, 299–317. [Google Scholar] [CrossRef]
  29. Seto, K.C.; Kaufmann, R.K. Modeling the Drivers of Urban Land Use Change in the Pearl River Delta, China: Integrating Remote Sensing with Socioeconomic Data. Land Econ. 2003, 79, 106–121. [Google Scholar] [CrossRef] [Green Version]
  30. Long, H.; Heilig, G.; Li, X.; Zhang, M. Socio-economic development and land-use change: Analysis of rural housing land transition in the Transect of the Yangtze River, China. Land Use Policy 2007, 24, 141–153. [Google Scholar] [CrossRef]
  31. Wang, J.; He, T.; Lin, Y. Changes in ecological, agricultural, and urban land space in 1984–2012 in China: Land policies and regional social-economical drivers. Habitat Int. 2018, 71, 1–13. [Google Scholar] [CrossRef]
  32. Kuang, W.; Liu, J.; Dong, J.; Chi, W.; Zhang, C. The rapid and massive urban and industrial land expansions in China between 1990 and 2010: A CLUD-based analysis of their trajectories, patterns, and drivers. Landsc. Urban Plan. 2016, 145, 21–33. [Google Scholar] [CrossRef]
  33. Lin, G.; Zhang, A. Emerging spaces of neoliberal urbanism in China: Land commodification, municipal finance and local economic growth in prefecture-level cities. Urban Stud. 2015, 52, 2774–2798. [Google Scholar] [CrossRef]
  34. Lichtenberg, E.; Ding, C. Local officials as land developers: Urban spatial expansion in China. J. Urban Econ. 2009, 66, 57–64. [Google Scholar] [CrossRef] [Green Version]
  35. He, C.; Huang, Z.; Wang, R. Land use change and economic growth in urban China: A structural equation analysis. Urban Stud. 2014, 51, 2880–2898. [Google Scholar] [CrossRef]
  36. Ke, S. Agglomeration, productivity, and spatial spillovers across Chinese cities. Ann. Reg. Sci. 2009, 45, 157–179. [Google Scholar] [CrossRef]
  37. Han, W.; Zhang, X.; Zheng, X. Land use regulation and urban land value: Evidence from China. Land Use Policy 2020, 92, 104432. [Google Scholar] [CrossRef]
  38. Nichols, A. Land and economic growth. Am. Econ. Rev. 1970, 60, 332–340. [Google Scholar]
  39. McCain, A. Land in Fellner’s model of economic growth: Comment. Am. Econ. Rev. 1970, 60, 495–499. [Google Scholar]
  40. Drazen, A.; Eckstein, Z. On the organization of rural markets and the process of economic development. Am. Econ. Rev. 1988, 78, 431–443. [Google Scholar]
  41. Rhee, C. Dynamic Inefficiency in an Economy with Land. Rev. Econ. Stud. 1991, 58, 791–797. [Google Scholar] [CrossRef] [Green Version]
  42. Ihlanfeldt, R. The effect of land use regulation on housing and land prices. J. Urban Econ. 2007, 61, 420–435. [Google Scholar] [CrossRef]
  43. Kok, N.; Monkkonen, P.; Quigley, J.M. Land use regulations and the value of land and housing: An intra-metropolitan analysis. J. Urban Econ. 2014, 81, 136–148. [Google Scholar] [CrossRef] [Green Version]
  44. Irwin, G.; Bockstael, N. The problem of identifying land use spillovers: Measuring the effects of open space on residential property values. Am. J. Agric. Econ. 2001, 83, 698–704. [Google Scholar] [CrossRef]
  45. Hui, E.; Liang, C. Spatial spillover effect of urban landscape views on property price. Appl. Geogr. 2016, 72, 26–35. [Google Scholar] [CrossRef]
  46. Glaeser, E.; Henderson, V. Urban economics for the developing world: An introduction. J. Urban Econ. 2017, 98, 1–5. [Google Scholar] [CrossRef]
  47. Anas, A.; Kim, I. General equilibrium models of polycentric urban land use with endogenous congestion and job agglomeration. J. Urban Econ. 1996, 40, 232–256. [Google Scholar] [CrossRef]
  48. Tian, L.; Ma, W. Government intervention in city development of China: A tool of land supply. Land Use Policy 2009, 26, 599–609. [Google Scholar] [CrossRef]
  49. Liu, M.; Tao, R.; Yuan, F.; Cao, G. Instrumental land use investment-driven growth in China. J. Asia Pac. Econ. 2008, 13, 313–331. [Google Scholar] [CrossRef]
  50. Gao, H. Public land leasing, public productive spending and economic growth in Chinese cities. Land Use Policy 2019, 88, 104076. [Google Scholar] [CrossRef]
  51. Zhu, J. Changing Land Policy and its Impact on Local Growth: The Experience of the Shenzhen Special Economic Zone, China, in the 1980s. Urban Stud. 1994, 31, 1611–1623. [Google Scholar] [CrossRef]
  52. Liu, J.; Guo, Q. A spatial panel statistical analysis on cultivated land conversion and Chinese economic growth: Integrating, monitoring, assessment and management. Ecol. Indic. 2015, 51, 20–24. [Google Scholar] [CrossRef]
  53. Overmars, K.; Koning, G.; Veldkamp, A. Spatial autocorrelation in multi-scale land use models. Ecol. Model. 2003, 164, 257–270. [Google Scholar] [CrossRef]
  54. Wu, Y.; Zhang, X.; Skitmore, M.; Song, Y.; Hui, E.C. Industrial land price and its impact on urban growth: A Chinese case study. Land Use Policy 2014, 36, 199–209. [Google Scholar] [CrossRef] [Green Version]
  55. Huang, Z.; Du, X. Strategic interaction in local governments’ industrial land supply: Evidence from China. Urban Stud. 2017, 54, 1328–1346. [Google Scholar] [CrossRef]
  56. Li, C.; He, J.; Duan, X. Modeling the Collaborative Evolution of Urban Land Considering Urban Interactions under Intermediate Intervention, in the Urban Agglomeration in the Middle Reaches of the Yangtze River in China. Land 2020, 9, 184. [Google Scholar] [CrossRef]
  57. Wei, Y.D.; Li, H.; Yue, W. Urban land expansion and regional inequality in transitional China. Landsc. Urban Plan. 2017, 163, 17–31. [Google Scholar] [CrossRef]
  58. Long, H.; Li, T. The coupling characteristics and mechanism of farmland and rural housing land transition in China. J. Geogr. Sci. 2012, 22, 548–562. [Google Scholar] [CrossRef]
  59. Long, H.; Liu, Y.; Hou, X.; Li, T.; Li, Y. Effects of land use transitions due to rapid urbanization on ecosystem services: Implications for urban planning in the new developing area of China. Habitat Int. 2014, 44, 536–544. [Google Scholar] [CrossRef]
  60. Long, H.; Qu, Y. Land use transitions and land management: A mutual feedback perspective. Land Use Policy 2018, 74, 111–120. [Google Scholar] [CrossRef]
  61. Chen, K.; Long, H.; Liao, L.; Tu, S.; Li, T. Land use transitions and urban-rural integrated development: Theoretical framework and China’s evidence. Land Use Policy 2020, 92, 104465. [Google Scholar] [CrossRef]
  62. Long, H.; Qu, Y.; Tu, S.; Zhang, Y.; Jiang, Y. Development of land use transitions research in China. J. Geogr. Sci. 2020, 30, 1195–1214. [Google Scholar] [CrossRef]
  63. Long, H. Land Use Transitions and Rural Restructuring in China; Springer: Singapore, 2020; pp. 3–29. [Google Scholar]
  64. Ke, S.; Feser, E. Count on the Growth Pole Strategy for Regional Economic Growth? Spread–Backwash Effects in Greater Central China. Reg. Stud. 2009, 44, 1131–1147. [Google Scholar] [CrossRef]
  65. Tao, R.; Su, F.; Liu, M.; Cao, G. Land Leasing and Local Public Finance in China’s Regional Development: Evidence from Prefecture-level Cities. Urban Stud. 2010, 47, 2217–2236. [Google Scholar]
  66. Ye, C.; Zhu, J.; Li, S.; Yang, S.; Chen, M. Assessment and analysis of regional economic collaborative development within an urban agglomeration: Yangtze River Deltaas a case study. Habitat Int. 2019, 83, 20–29. [Google Scholar] [CrossRef]
  67. Yu, N.; Jong, M.; Storm, S.; Mi, J. Spatial spillover effects of transport infrastructure: Evidence from Chinese regions. J. Transp. Geogr. 2013, 28, 56–66. [Google Scholar] [CrossRef]
  68. Hui, E.C.; Wu, Y.; Deng, L.; Zheng, B. Analysis on coupling relationship of urban scale and intensive use of land in China. Cities 2015, 42, 63–69. [Google Scholar] [CrossRef]
  69. Zhang, P.; Yang, D.; Qin, M.; Jing, W. Spatial heterogeneity analysis and driving forces exploring of built-up land development intensity in Chinese prefecture-level cities and implications for future Urban Land intensive use. Land Use Policy 2020, 99, 104958. [Google Scholar] [CrossRef]
  70. Cheng, X.; Shao, H.; Li, Y.; Shen, C.; Liang, P. Urban Land Intensive Use Evaluation Study Based on Nighttime Light—A Case Study of the Yangtze River Economic Belt. Sustainability 2019, 11, 675. [Google Scholar] [CrossRef] [Green Version]
  71. Lai, Y.; Chen, K.; Zhang, J.; Liu, F. Transformation of Industrial Land in Urban Renewal in Shenzhen, China. Land 2020, 9, 371. [Google Scholar] [CrossRef]
  72. Lin, G.C.S.; Yi, F. Urbanization of Capital or Capitalization on Urban Land? Land Development and Local Public Finance in Urbanizing China. Urban Geogr. 2011, 32, 50–79. [Google Scholar] [CrossRef]
  73. Du, J.; Thill, J.-C.; Peiser, R.B. Land pricing and its impact on land use efficiency in post-land-reform China: A case study of Beijing. Cities 2016, 50, 68–74. [Google Scholar] [CrossRef]
  74. Rong, Z.; Wang, W.; Gong, Q. Housing price appreciation, investment opportunity, and firm innovation: Evidence from China. J. Hous. Econ. 2016, 33, 34–58. [Google Scholar] [CrossRef]
  75. Ansenlin, L. Spatial externalities, spatial multipliers, and spatial econometrics. Int. Reg. Sci. Rev. 2003, 26, 153–166. [Google Scholar] [CrossRef]
  76. Anselin, L. Thirty years of spatial econometrics. Pap. Reg. Sci. 2010, 89, 3–25. [Google Scholar] [CrossRef]
  77. Corrado, L.; Fingleton, B. Where is the economics in spatial economics? J. Reg. Sci. 2011, 52, 210–239. [Google Scholar] [CrossRef] [Green Version]
  78. Pinkse, J.; Slade, M.E. The Future of Spatial Econometrics. J. Reg. Sci. 2010, 50, 103–117. [Google Scholar] [CrossRef]
  79. Feng, J.; Lichtenberg, E.; Ding, C. Balancing act: Economic incentives, administrative restrictions, and urban land expansion in China. China Econ. Rev. 2015, 36, 184–197. [Google Scholar] [CrossRef]
  80. Yang, Q.; Zhuo, P.; Yang, J. Industrial land transfer and competition quality bottom line competition: An empirical study based on panel data of prefecture-level cities in China from 2007 to 2011. Manag. World 2014, 11, 24–34. (In Chinese) [Google Scholar]
  81. Ke, S.; Xiang, J. Estimation of the fixed capital stocks in Chinese cities for 1996–2009. Stat. Res. 2012, 29, 19–24. (In Chinese) [Google Scholar]
  82. Battese, G.E.; Coelli, T.J. Frontier production functions, technical efficiency and panel data: With application to paddy farmers in India. J. Prod. Anal. 1992, 3, 153–169. [Google Scholar] [CrossRef]
  83. Battese, G.E.; Coelli, T.J. A model for technical inefficiency effects in a stochastic frontier production function for panel data. Empir. Econ. 1995, 20, 325–332. [Google Scholar] [CrossRef] [Green Version]
  84. Liu, Y.; Li, J.T.; Yang, Y. Strategic adjustment of land use policy under the economic transformation. Land Use Policy 2018, 74, 5–14. [Google Scholar] [CrossRef]
  85. Yuan, F.; Wei, Y.; Xiao, W. Land marketization, fiscal decentralization, and the dynamics of urban land prices in transitional China. Land Use Policy 2019, 89, 104208. [Google Scholar] [CrossRef]
  86. Fan, X.; Qiu, S.; Sun, Y. Land finance dependence and urban land marketization in China: The perspective of strategic choice of local governments on land transfer. Land Use Policy 2020, 99, 105023. [Google Scholar] [CrossRef]
  87. Shu, C.; Xie, H.; Jiang, J.; Chen, Q. Is Urban Land Development Driven by Economic Development or Fiscal Revenue Stimuli in China? Land Use Policy 2018, 77, 107–115. [Google Scholar] [CrossRef]
  88. Li, H.; Liu, Y.; He, Q.; Peng, X.; Yin, C. Simulating Urban Cooperative Expansion in a Single-Core Metropolitan Region Based on Improved CA Model Integrated Information Flow: Case Study of Wuhan Urban Agglomeration in China. J. Urban Plan. Dev. 2018, 144, 05018002. [Google Scholar] [CrossRef]
  89. Li, L.; Bao, H.X.; Robinson, G.M. The return of state control and its impact on land market efficiency in urban China. Land Use Policy 2020, 99, 104878. [Google Scholar] [CrossRef]
Figure 1. The influence mechanism of ULUT on the ESSCC in urban agglomerations.
Land 10 00644 g001
Figure 2. Samples.
Figure 2. Samples.
Land 10 00644 g002
Figure 3. The impacts of ULUT on ESSCC in urban agglomerations.
Land 10 00644 g003
Figure 4. The impacts of urban land expansions on the production factors in urban agglomerations.
Land 10 00644 g004
Figure 5. The impacts of ULIU on the production factors in urban agglomerations.
Land 10 00644 g005
Figure 6. The impacts of ULSS on the production factors in urban agglomerations.
Land 10 00644 g006
Figure 7. The impacts of urban land marketization on the production factors in urban agglomerations.
Land 10 00644 g007
Figure 8. The impacts of urban land prices on the production factors in urban agglomerations.
Land 10 00644 g008
Table 1. Mean value of ULUT.
VariablesYearTotalBeijing–Tianjin–HebeiYangtze River DeltaPearl River DeltaMiddle Reaches of Yangtze RiverCentral PlainGuanzhong PlainChengdu–ChongqingHarbin–Changchun
ule (hm2)2003324.22583.53846.6292.55146.22125.41261.5674.5399.96
2016573.87884.33645.44439.09598.77524.65573.49569.41294.58
uliu (102millionyuan/hm2)2003316.83284.37344.14644.72245.05209.08247.85264.79314.08
2016701.18692.05768.951462.23653.03421.83557.46526.34481.01
pil (%)200332.2841.9437.2824.0940.2225.9723.6326.6235.46
201626.0129.1725.0719.7627.3530.6018.6617.6635.10
psl (%)200316.3120.7916.6921.8811.7014.2726.6019.0814.36
20167.528.807.654.818.108.297.517.118.83
phl (%)200324.4018.9124.3523.0923.2127.7427.5227.2622.07
201617.3823.0816.6913.9316.3420.9614.9320.0513.04
ulm (%)200335.7933.2632.6853.4837.7636.3833.0432.2438.38
201692.5291.8797.4284.5894.8194.4893.9695.5586.58
ulp (10 thousand yuan/hm2)2003256.12297.66300.85233.58243.72228.91178.39277.22188.86
20161386.861657.222299.412417.77789.72618.45522.07953.41476.21
Table 2. Spatial autocorrelation of ULUT.
VariablesTotalBeijing–Tianjin–HebeiYangtze River DeltaPearl River DeltaMiddle Reaches of Yangtze RiverCentral PlainGuanzhong PlainChengdu–ChongqingHarbin–Changchun
ule0.222 ***0.321 ***0.321 ***0.0420.1700.270 ***0.678 ***0.077 *0.12 *
(3.54)(5.55)(9.43)(0.74)(1.00)(8.84)(4.25)(1.94)(1.80)
uliu0.389 ***0.418 ***0.388 ***0.010−0.3270.249 ***0.400 ***0.329 ***−0.023
(6.23)(6.98)(11.54)(0.23)(1.89)(8.06)(2.53)(7.73)(0.20)
pil0.323 ***0.064 0.104 ***0.0940.631 ***0.080 ***0.0220.204 ***0.067
(5.14)(1.14)(3.10)(1.56)(3.69)(2.64)(0.21)(4.84)(1.01)
psl0.002 0.0650.089 ***0.022−0.337 *0.071 ***0.482 ***0.234 ***−0.033
(0.04)(1.22)(2.72)(0.44)(1.97)(2.43)(3.12)(5.79)(0.35)
phl0.036 0.0020.092 ***−0.085−0.0060.0290.1210.113 ***0.044
(0.58)(0.13)(2.77)(1.29)(0.02)(1.02)(0.83)(2.75)(0.72)
ulm0.757 ***0.839 ***0.842 ***0.517 ***0.880 ***0.751 ***0.822 ***0.815 ***0.736 ***
(12.02)(13.85)(24.51)(8.18)(5.13)(24.11)(5.10)(18.89)(10.02)
ulp0.276 ***0.0480.198 ***0.468 ***0.2690.320 ***−0.1160.334 ***0.019
(4.47)(1.07)(6.08)(7.77)(1.60)(10.62)(0.65)(7.85)(0.49)
Note: The values not in brackets areMoran’s I, and the values in brackets are Moran’s I’s z statistics. * and *** respectively indicate that the estimated coefficients are significant at the level of 1% and 10%.
Table 3. Regression estimate results for impacts of ULUT on ESSCC.
VariablesTotalBeijing Tianjin HebeiYangtze River DeltaPearl River DeltaMiddle Reaches of the Yangtze RiverCentral PlainsGuanzhong PlainChengdu ChongqingHarbin Changchun
wclnule3.785 ***42.3275.6325.308 **0.48213.483 **5.721−7.551 *3.461
(3.81)(1.10)(1.56)(2.09)(0.22)(2.28)(0.51)(1.93)(0.06)
wclnuliu7.709 *469.958 ***−21.237−22.800−0.505−166.681 **55.95848.209−1081.976
(1.71)(3.32)(0.56)(1.00)(0.14)(2.26)(1.32)(0.37)(1.52)
wcpil−7.594114.45781.976 *70.497−9.22467.75816.32187.596614.922
(1.50)(0.54)(1.92)(1.24)(1.44)(1.16)(0.28)(0.90)(0.77)
wcpsl−7.533286.438−165.571 *−165.238−16.2255.1−3.311420.252 **119.619
(0.54)(0.83)(1.67)(1.24)(0.88)(0.04)(0.03)(2.34)(0.06)
wcphl−9.386508.635 *90.394*135.784 **−10.862−59.918−66.1299.942−56.784
(1.13)(1.71)(1.69)(2.16)(1.06)(0.64)(0.73)(0.11)(0.07)
wculm0.671−354.712 **137.364 ***6.7829.909150.606 **68.478194.8652659.256 **
(0.13)(2.46)(3.58)(0.15)(1.33)(2.56)(0.97)(1.61)(2.59)
wclnulp−0.47079.048−29.83922.916−6.690−30.321−26.007−62.948543.726
(0.12)(0.99)(1.38)(1.36)(1.31)(0.75)(0.68)(1.54)(1.03)
wclny45.670 *185.56950.29252.938−59.757760.988 ***−81.858 *−992.131 ***723.047
(1.89)(1.06)(0.51)(0.94)(0.51)(4.15)(1.81)(−5.06)(0.45)
lnule0.004 ***0.0030.007 **0.0010.0020.007*0.014 **−0.0020.004
(3.72)(0.19)(2.52)(0.41)(0.76)(1.92)(2.37)(1.07)(0.66)
lnuliu1.028 ***0.230 *−0.029−0.046−0.219 ***0.132−0.0150.345 *−0.032
(3.92)(1.75)(0.84)(0.91)(3.74)(1.30)(0.14)(1.70)(0.17)
pil0.001 ***9 × 10−43 × 10−4−7 × 10⁻⁴−1 × 10−45 × 10−47 × 10−4−6 × 10−40.003 **
(4.11)(1.52)(0.65)(1.09)(0.15)(1.49)(1.02)(1.26)(2.54)
psl2 × 10−48 × 10−4−0.002 ***0.003 **2 × 10−44 × 10−4−0.002−6 × 10⁻⁴−0.002
(0.57)(1.12)(2.81)(2.54)(0.15)(0.70)(1.09)(0.66)(1.03)
phl0.000−2 × 10⁻⁴−6 × 10−48 × 10−4−9 × 10⁻⁴−4 × 10−40.001−0.0010.001
(0.12)(0.25)(1.29)(1.08)(1.41)(0.82)(1.01)(1.46)(0.66)
ulm0.001 ***0.001 **−4 × 10⁻⁴−4 × 10−40.002 ***4 × 10−43 × 10−40.003 ***−6 × 10⁻⁴
(6.23)(2.36)(−0.91)(0.73)(2.69)(0.78)(0.40)(3.93)(0.47)
lnulp0.054 ***0.0300.061 ***−0.0020.149 ***0.098 ***0.016−0.040 *0.069
(6.49)(1.23)(3.10)(0.07)(4.49)(4.20)(0.36)(1.65)(1.54)
id-effectsyesyesyesyesyesyesyesyesyes
contorlsyesyesyesyesyesyesyesyesyes
sargan-p0.110.110.200.130.130.290.130.240.25
Obs212815437822439236470224126
R-squared0.920.950.950.920.910.950.980.970.87
Note: The values not in brackets are coefficients, and the values in brackets are corresponding t-statistics. *, ** and *** respectively indicate that the estimated coefficients are significant at the level of 1%, 5% and 10%.
Table 4. Estimation results for the intermediate mechanism of the ULUT affect the ESSCC in urban agglomerations.
VariablesEnterprise InvestmentFiscal ExpenditureInfrastructure InvestmentLaborTechnical Efficiency
wclnule0.430−1.1681.701−0.090 **−0.009 ***
(0.21)(0.98)(0.34)(2.54)(2.83)
wclnuliu0.941 **−2.42113.986−0.2581 × 10⁻⁴
(2.05)(0.58)(0.96)(0.17)(0.02)
wcpil6.25011.637 *−36.089−5.049−0.004
(0.55)(1.92)(1.40)(1.11)(0.26)
wcpsl37.6115.831−18.192−6.335−0.053
(1.14)(0.28)(0.26)(0.80)(1.15)
wcphl11.47015.214−1.74230.476−0.052*
(0.71)(1.54)(0.04)(1.40)(1.88)
wculm−3.3697.46937.428−65.053 ***0.007
(0.29)(1.05)(1.42)(5.03)(0.43)
wclnulp−8.398−9.814 **−49.653 ***−9.9590.019
(1.21)(2.23)(2.64)(1.20)(1.50)
wcf10.765 **2.3031.093 **12.731 **179.882 ***
(2.29)(0.68)(2.29)(2.03)(4.28)
lnule0.0030.004 ***−0.10639.797 ***0.000
(1.46)(2.77)(0.90)(4.42)(1.22)
lnuliu1.039 ***0.081 **0.014 **2 × 10−41.65 × 10−5 ***
(2.82)(2.45)(2.54)(0.11)(3.14)
pil2 × 10−40.000−0.001−2 × 10⁻⁴−1.49 × 10⁻⁶ **
(0.47)(0.14)(1.36)(0.73)(2.39)
psl−3 × 10⁻⁴−0.001 ***13 × 10−4−0.001 **−3.60 × 10⁻⁶ ***
(0.44)(2.78)(0.82)(−2.13)(3.37)
phl7 × 10−4−3 × 10−43 × 10−4−0.001 ***−4.40 × 10⁻⁶ ***
(1.64)(1.07)(0.25)(2.85)(6.09)
ulm0.001 ***14 × 10−4***14 × 10−40.002 ***7.36 × 10⁻⁶ ***
(3.01)(6.06)(1.48)(6.75)(12.21)
lnulp0.032 **−0.0150.0690.133 ***1 × 10⁻⁴ ***
(1.98)(1.48)(1.63)(9.93)(4.32)
id-effectsyesyesyesyesyes
controlsyesyesyesyesyes
sargan-p0.290.340.190.410.33
Obs19762128212821282128
R-squared0.880.950.310.590.86
Note: The values not in brackets arecoefficients, and the values in brackets are corresponding t-statistics. *, ** and *** respectively indicate that the estimated coefficients are significant at the level of 1%, 5% and 10%.
Publisher’s Note: MDPI stays neutral with regard to jurisdictional claims in published maps and institutional affiliations.

