Article

The Network of Green Infrastructure Based on Ecosystem Services Supply in Central Europe

Department of Physical Geography and Geoecology, Faculty of Science, Charles University, Albertov 6, 128 43 Prague, Czech Republic
*
Author to whom correspondence should be addressed.
Land 2021, 10(6), 592; https://doi.org/10.3390/land10060592
Submission received: 3 May 2021 / Revised: 28 May 2021 / Accepted: 31 May 2021 / Published: 4 June 2021

Abstract

:
Green infrastructure is a strategically planned network that broadens traditional biodiversity conservation methods to also encompass the concept of ecosystem services (ES). This study aims to identify the network of green infrastructure in Central Europe. An analysis of ecological connectivity is based on ES supply quantified for CORINE land cover classes. Corridors between core areas, which are represented by Natura 2000 sites, are based on the capacity of ecosystems to supply maintenance and regulating ES. The delineated network of corridors of green infrastructure covers approximately 15% of the landscape of Central Europe that provides high levels of various ES. Ecological corridors create linkages between Natura 2000 sites and support the migration and dispersal of species. Central Europe is an important transitional region where coordinated improvement of ecological connectivity is fundamental. Moreover, promotion of the green infrastructure network and full implementation of the EU Birds and Habitats Directives are targets of two important documents at the European level, the EU Biodiversity Strategy 2030 and the EU Strategy on Green Infrastructure.

1. Introduction

Continuous biodiversity loss, habitat fragmentation, environmental degradation and climate change [1,2] have become impulses to redesign and broaden the traditional approach to environmental management and spatial conservation planning. Awareness of how much human well-being is dependent on natural processes [3,4] has emphasized the urgent need to decrease negative anthropogenic pressures on the natural environment and to foster more conservation and restoration efforts in the landscape. It has become widely accepted (even though not always agreed, e.g., [5]) that conservation planning is supposed to go beyond an intrinsic value of nature [6,7,8] and this new insight became a priority for many environmental policy agendas in the past decade [9].
One of the key documents targeting environmental issues at the European level was the European Biodiversity Strategy 2020. The Strategy addressed both biodiversity and ecosystem services (ES), which represent the dependency of society on the natural environment. Considering it the most effective, the document called in particular for ensuring no net loss of biodiversity and ES by means of full implementation of the EU Habitats and Birds Directives and promotion of a European green infrastructure (GI) [10] which was later more specified in the individual EU Strategy on Green Infrastructure [11]. The new European Biodiversity Strategy 2030 follows up the indicated trend by targeting protection of ecosystems providing high levels of carbon sequestration, expansion of protected areas, enhancing their coherence, and setting up ecological networks [12].
The concept of GI has recently received growing attention as an instrument for ES enhancement. An overwhelming number of studies focused on GI design were published during the last decade. The GI conceptual framework definitely obtained the greatest attention at a finer, mostly urban and regional scale [13]. However, a number of studies also identified GI at a national and transnational level in Europe [14,15,16,17,18,19]. Depending on the objectives, studies vary greatly in GI definitions as well as in adopted methodologies [20]. Probably the most followed definition is the one of European Commission, which describes GI as a “strategically planned network of natural and near-natural areas with other environmental features designed and managed to deliver a wide range of ecosystem services” ([11], p. 3). In our research, we also follow this definition in the sense of scale, spatial extent, and variety of potential components of GI.
A key feature of GI design is the integrated spatial planning that achieves multiple environmental, economic and social benefits [21]. The most important associated environmental benefit of GI is the enhancement of biodiversity and natural processes [22]. Nonetheless, biodiversity and ES have a multi-layered relationship [23,24]. From the perspective of ES, biodiversity is mostly seen as a regulator of ecosystem processes. It has been shown that measures of biodiversity such as species richness, species abundance, community area, and community structure positively influence provision of various ES, such as biomass production, nutrient cycling, carbon flux, and nitrogen use [25,26]. However, many ES depend rather on the overall state of habitats than on specific populations or communities’ presence [27], and assignment of species to particular habitats is complicated because of changes in habitats in different phases of their life cycles [25,28].
In general, studies report neutral or positive trade-offs (i.e. synergy) between biodiversity and maintenance and regulating ES provision [29,30,31,32]. Areas with the highest potential to supply maintenance and regulating ES are located in rather natural landscapes [33]. More ambivalent trade-offs between biodiversity and provisioning services are caused by monoculture production and the need for external energy inputs [34]. Therefore, in integrated planning for GI, usually only ES with a neutral or positive relationship with biodiversity are considered (e.g., [14,17,19]). Habitats of favourable conservation status have higher potential to supply regulating and cultural ES [35] and management of those ES is also reported to impact protected areas least often [36].
The common European network of protected areas, Natura 2000 (N2k), is a key conservation tool in the EU [37,38]. The N2k network was established to protect Europe’s most valuable and threatened species and habitats listed under the Birds Directive (79/409/EEC, amended as 2009/147/EC) and the Habitats Directive (92/43/EEC). Signatories of the Bern Convention (Convention on the Conservation of European Wildlife and Natural Habitats) outside the EU designate the complementary Emerald network.
Compared to biodiversity as perceived in ES paradigm, traditional conservation efforts that were applied for N2k planning aim at uniqueness and vulnerability of species and communities [23]. Many of the sites, before they were included in the N2k network, already existed as protected areas in member states [37]. They were designed under country-specific conservation approaches rather than systematic conservation planning for the N2k network [39,40], which inevitably led to differences in network character between member states as well as to transboundary gaps [41,42]. It is also generally understood that, at present coverage, the N2k network still omits some valuable taxa, communities, and habitats [38,39,43,44].
Even though the N2k network is designed to meet a specific list of conservation objectives, it delivers a considerable amount of ES of all groups as a by-product [25,36,45]. In contrast to traditionally remotely located protected areas [46], N2k sites are in general more exposed to human activities [47,48] and the provided ES meet people’s demands. N2k is therefore seen as the backbone of European GI [11] and GI is considered a tool of improvement in connectivity between N2k sites.

Approaches to GI Delineation

Published studies on GI design focus on various aspects of its definition and characteristics. In some cases, especially at the international and continental level, GI is understood as a traditional ecological network and authors mostly emphasize the aspect of connectivity (e.g., [49,50]). Others focus on GI as a mean to protect ES supply (e.g., [15,19,51]) or to try to balance all key benefits [14,16,17]. Understanding the multifunctionality of GI is the most addressed topic in GI research [13].
Methods adopted to delineate GI have changed significantly over the last decade [52]. Principally, in methodologies to delineate GI, authors focus either on structural or functional aspects of the definition. The most straightforward way to outline GI is selection of particular land use and land cover (LULC) types which compose the network (e.g., [18,49,53]). Other authors focus on spatial complementarity of areas important for biodiversity and ES provision, adopting a three-step approach based on spatial overlay (e.g., [17,53]). First, multifunctional areas are defined in localities with high potential or actual supply of ES. Selection of specific ES depends on availability of data and their compliance with conservation goals. In the following step, ecological corridors are delineated. On a continental level, it is impossible to plan ecological corridors for each species of interest and, in practice, most studies utilize GI planning for selected large mammals. Such mammals are habitat generalists with the ability of long-distance dispersal and can serve as umbrella species. Some authors work with generic umbrella species [49]. To design wildlife corridors, authors mostly employ several specific GIS tools for connectivity modelling such as the ArcGIS extension Linkage Mapper, Corridor Design [17,54]. These tools usually calculate least cost paths between predefined core areas based on landscape suitability with respect to species of interest. As a last step, GI is outlined as the best performing areas based on spatial overlay of ES supply and ecological corridors.
More recent studies suggest examining quantitative analytical methods allowing strategic decisions [52,55]. Such methods seek to balance multiple objectives in one planning exercise, which increases the effectiveness of spatial planning [56]. Input data in the analysis are species distributions as well as actual or potential ES supply. In contrast to previous works, large scale studies that use quantitative methods incorporate N2k sites into a GI network as a rule (i.e., [14,16,19]). Such studies rely on software tools originally developed for spatial conservation prioritization for biodiversity, namely Marxan and Marxan with Zones [57]. Improvements to incorporate ES were also made in Zonation software [58]. Use of software tools allows making strategic decision under consideration of multiple objectives and dealing with potential conflicts between different interests with the least possible harm.
The aim of this study is to outline the GI network in the research area of Central Europe. Central Europe represents a transitional region between highly altered and fragmented landscapes of Western Europe and less developed regions of Eastern Europe with lower population densities and a considerable extent of relatively pristine natural areas, such as the Carpathian Mountains or Białowieża Forest [59,60]. Surprisingly, the region of Central Europe has not been tackled with special interest in many studies on GI. The only exception is the MaGIC Landscapes project, which concentrates on identification and assessment of GI, as well as on its incorporation into national laws and policies in Central European countries [21].
Our goal is to promote ES in the region of Central Europe and to propose an ecological network that connects key N2k sites by examining the regulating and maintenance services with Linkage Mapping and habitat analysis of environment datasets for all countries in the area of the analysis, which extends beyond the borders of the EU.

2. Materials and Methods

The research area of this study is Central Europe, represented by Austria, Czechia, Germany, Hungary, Poland, and Slovakia (Figure 1). The total area of these countries is 971,000 km2. To secure connectivity of the GI network along the boundaries, we established a 100 km wide buffer zone around the outer borders of the research area. With this buffer, the area of the spatial analysis includes 16 EU member states and 6 countries outside the EU, namely Belarus, Bosnia and Hercegovina, Serbia, Switzerland, Ukraine, and Kaliningrad Oblast. We focused solely on terrestrial ecosystems and all islands were removed. The analysis was performed on a total area more than 1.3 m km2 in a regular grid with a cell size of 1 km2.
First, we quantified an ecosystems’ capacity to supply ES. Coverage of data for such spatial extent is limited, partly because the analyzed area extends beyond the borders of the EU. Therefore, we decided to use an expert-based matrix approach which is easily accessible and adaptable for such cases [62]. We assigned capacity to supply ES to LULC classes based on valuation of Burkhard et al. [63]. In that study [63], experts estimate the capacity of CORINE Land Cover (CLC) classes to actual supply of ES. For each CLC class, capacity to supply ES is expressed on a relative scale from 0 to 5, where 0 is no relevant capacity and 5 is very high relevant capacity. We used summarized tabulated values of indicators of ecological integrity and regulating services capacity [3] that correspond to a class called Regulation and Maintenance services in CICES v5.1 classification [64]. Hereafter, we therefore call maintenance services what Burkhard et al. [63] called ecological integrity. In total, 16 individual indicators and services from this group were considered (Table 1).
For countries outside the EU which are not covered by CLC, we used the GlobCover 2009 layer [67]. This is a global land cover product of the European Space Agency and University of Leuven, based on satellite spectral images and automatic classification with a spatial resolution of 300 m. This global product recognizes 22 classes of land cover.
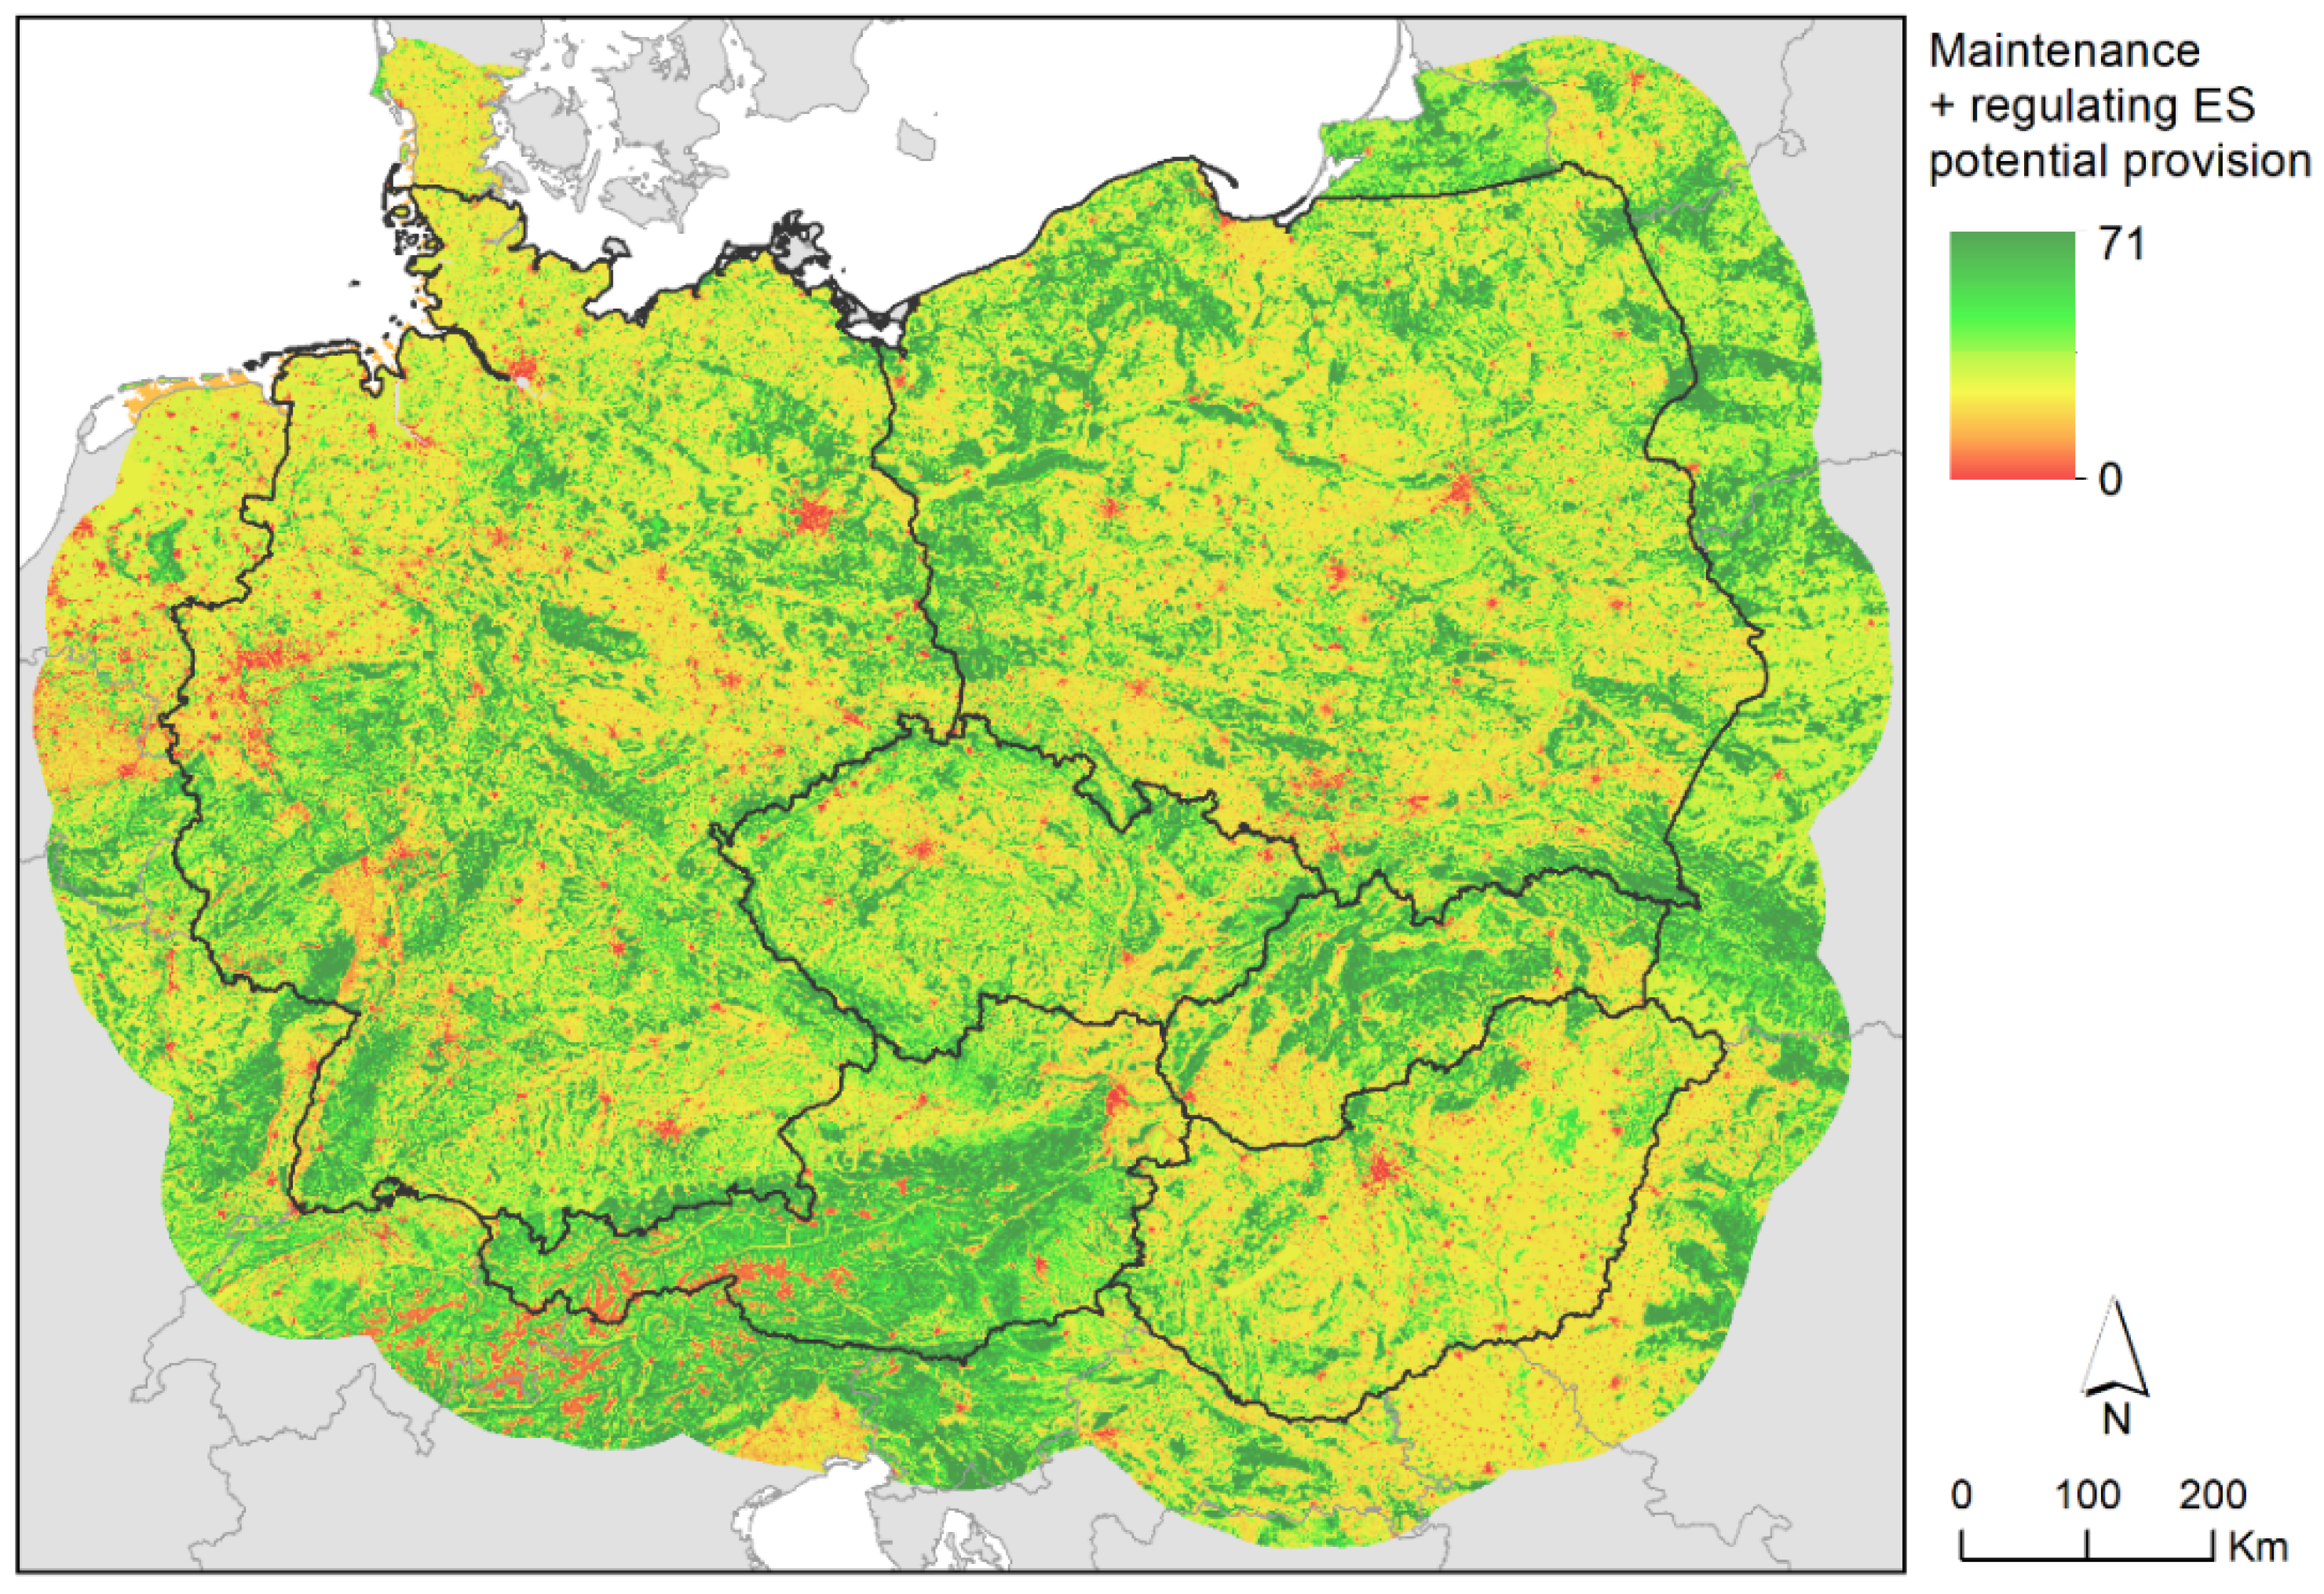
To harmonize the legends, we adopted the translation of individual legends by Herold et al. [68] and we averaged the values of ES supply when more classes of CLC fell into one of GlobCover 2009 classes. For spatial analysis, we recalculated ES supply to a regular grid at a resolution of 1 km2. For each cell of this grid the average capacity was calculated as ES capacity weighted by proportion of area of appropriate land cover class within the cell (Figure 2).
In the second step, we outlined the ecological network via the concept of isolation by resistance [69] and circuit theory [70]. We performed habitat connectivity analysis in the ESRI ArcGIS extension Linkage Mapper v2.0 [71]. This tool connects predefined core areas with least cost paths based on their Euclidean/cost-weighted distance and resistance surface. Resistance surface quantifies the willingness of an organism to move through the landscape [70]. Landscape here is simplified to a cell of the reference grid for which the resistance value is calculated.
Studies of connectivity differ greatly in the way resistance surface is created and a common approach is still missing [72]. We derived the resistance values from capacity of maintenance and regulating ES supply. This assumption is based on reports that the highest supply of these ES is in healthy natural ecosystems. In this sense, capacity of maintenance and regulating ES serves as a surrogate of naturalness of an ecosystem. Briefly, we consider ecosystems with the highest capacity to supply maintenance and regulating ES to be the most permeable environment for organisms. To quantify the resistance surface, we used the natural breaks method and inverted the ES capacity value (scale 0–71) to new resistance values (inverted scale 1–100).
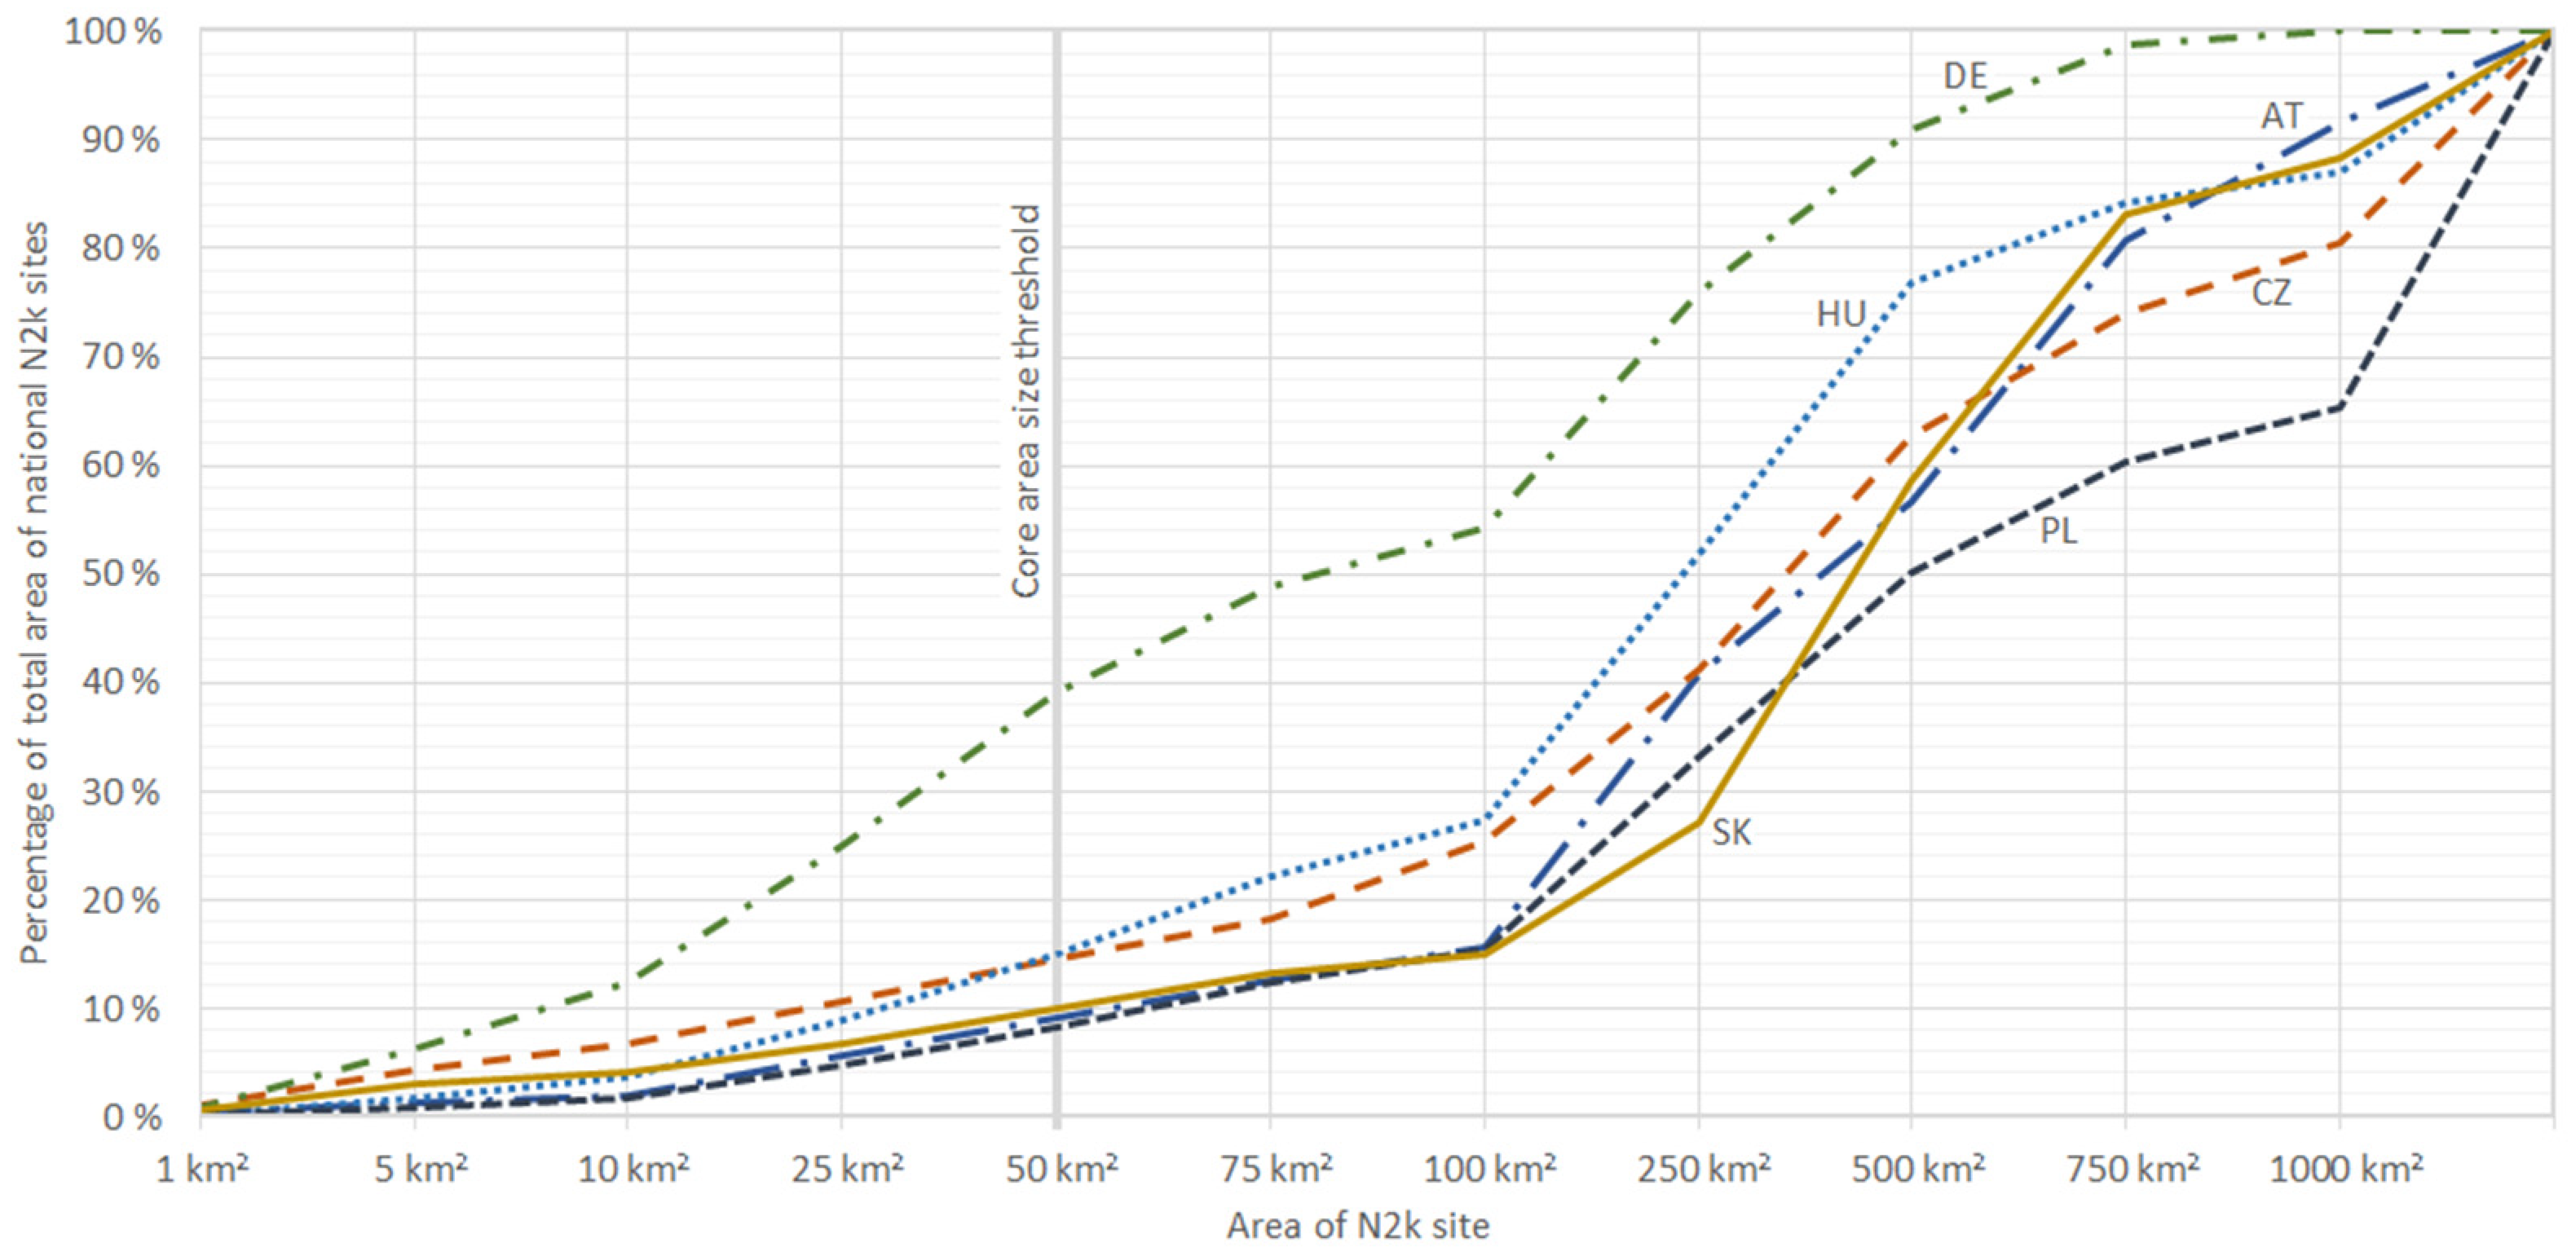
As core areas in connectivity analysis, we selected N2k sites of at least 50 km2. Determination of cores is an arbitrary step, which highly influences the spatial pattern of the result of the analysis. Threshold size was chosen with respect to the total area of interest, spatial scale of the proposed GI network, and the character of the N2k network in individual countries. Since there is a little possibility for considerable spatial extension of terrestrial protected areas in Europe, selected cores represent the most extensive N2k sites with assumably high inner environmental heterogeneity. They are supposed to provide more diverse habitats and resources that support the occurrence of multiple species from various taxonomic groups [73], as well as enough area of interior habitats for species vulnerable to edge effects [74].
For non-EU countries, Emerald sites were used with the same rule for their size. In Serbia and Kaliningrad Oblast, the candidate sites of Emerald network were employed as the best data available. Consideration of core areas in the buffer zone guarantees that ecological corridors also cross the boundaries in meaningful directions within the research area. Some of the sites are designated either under the EU Habitats Directive or the Birds Directive and their areas can overlap. Therefore, all cores were aggregated before following spatial analysis. In total, more than individual 1100 core areas were identified, covering 14% of the area of analysis.
In order to reduce the calculation time of Linkage Mapper 2.0 [71], we subsequently set process steps and additional options. For network adjacency and nearest neighbour measurement, we used the cost-weighted method. We also set the maximum number of nearest neighbours as six. In additional options, we reduced the areas of constitutive computations between each of the two core areas with a minimizing processing time using the bounding circles option (with boundary size 200 km2).
Based on resistance surface and cost-weighted distance, least cost paths between core areas were identified. Ecological corridors were formed as least cost paths (axes of corridors) and their buffer zone. Ecological corridors were arbitrarily delineated as a buffer of 2500 m around least cost path lines. Such corridors covered 8.8% of the least resistant grid cells in the research area and they connected 60% of all N2k sites. When deciding the appropriate corridor width, we wanted to stay below the selection of 10% of the least resistant grid cells in the research area; we also wanted to connect as many N2k sites as possible. Additionally, we evaluated 1000 m buffer (53% of N2k sites; 4.9% of the least resistant grid cells) and 5000 m buffer alternatives (70% of N2k sites; 16.8% of the least resistant grid cells).
Multipurpose corridors at a transnational level are supposed to provide various environments serving as stepping stones for faster passage, as well as more permanent habitats for species movement on annual (or even longer) time scale [75]. Evidence shows that when corridors are wider than 250 m, the edge effects are significantly reduced and such corridors can also support the occurrence of interior species (e.g., [76]). A 2500 m wide buffer was assessed as the most effective one. The final width of ecological corridors is therefore 5 km, which seems appropriate to our spatial scale and minimum area of cores.
To evaluate present connectivity of the N2k network in each country, we quantified the share of sites connected by the proposed GI network. Secondly, to depict what environment the corridors offer, we quantified the area of CLC classes that fell under the GI network. Lastly, we asked what the capacity of the GI network is to supply various ES. In this step, we focused on characteristics of grid cells that were preferentially selected as GI corridors. Therefore, we only assessed cells with the lowest value of landscape resistance in corridors under 5 km wide. Exactly 10% of the best performing cells under the corridors were assessed, which corresponds to the first 8% of least resistant cells in the whole research area (Central Europe). We evaluated not only the capacity of maintenance and regulating ES supply used for GI delineation, but also provisioning and cultural ES expertly quantified in the matrix of Burkhard et al. [63] for each CLC class.
Interpretation of results is related only to our research area—the region of Central Europe formed by six countries: Austria, Czechia, Germany, Hungary, Poland, and Slovakia. On the north-eastern boundary, islands were removed and the shoreline and the borders are simplified with regard to the coverage of CLC layer and the reference grid of the analysis.

3. Results

3.1. General Description of Delineated Network

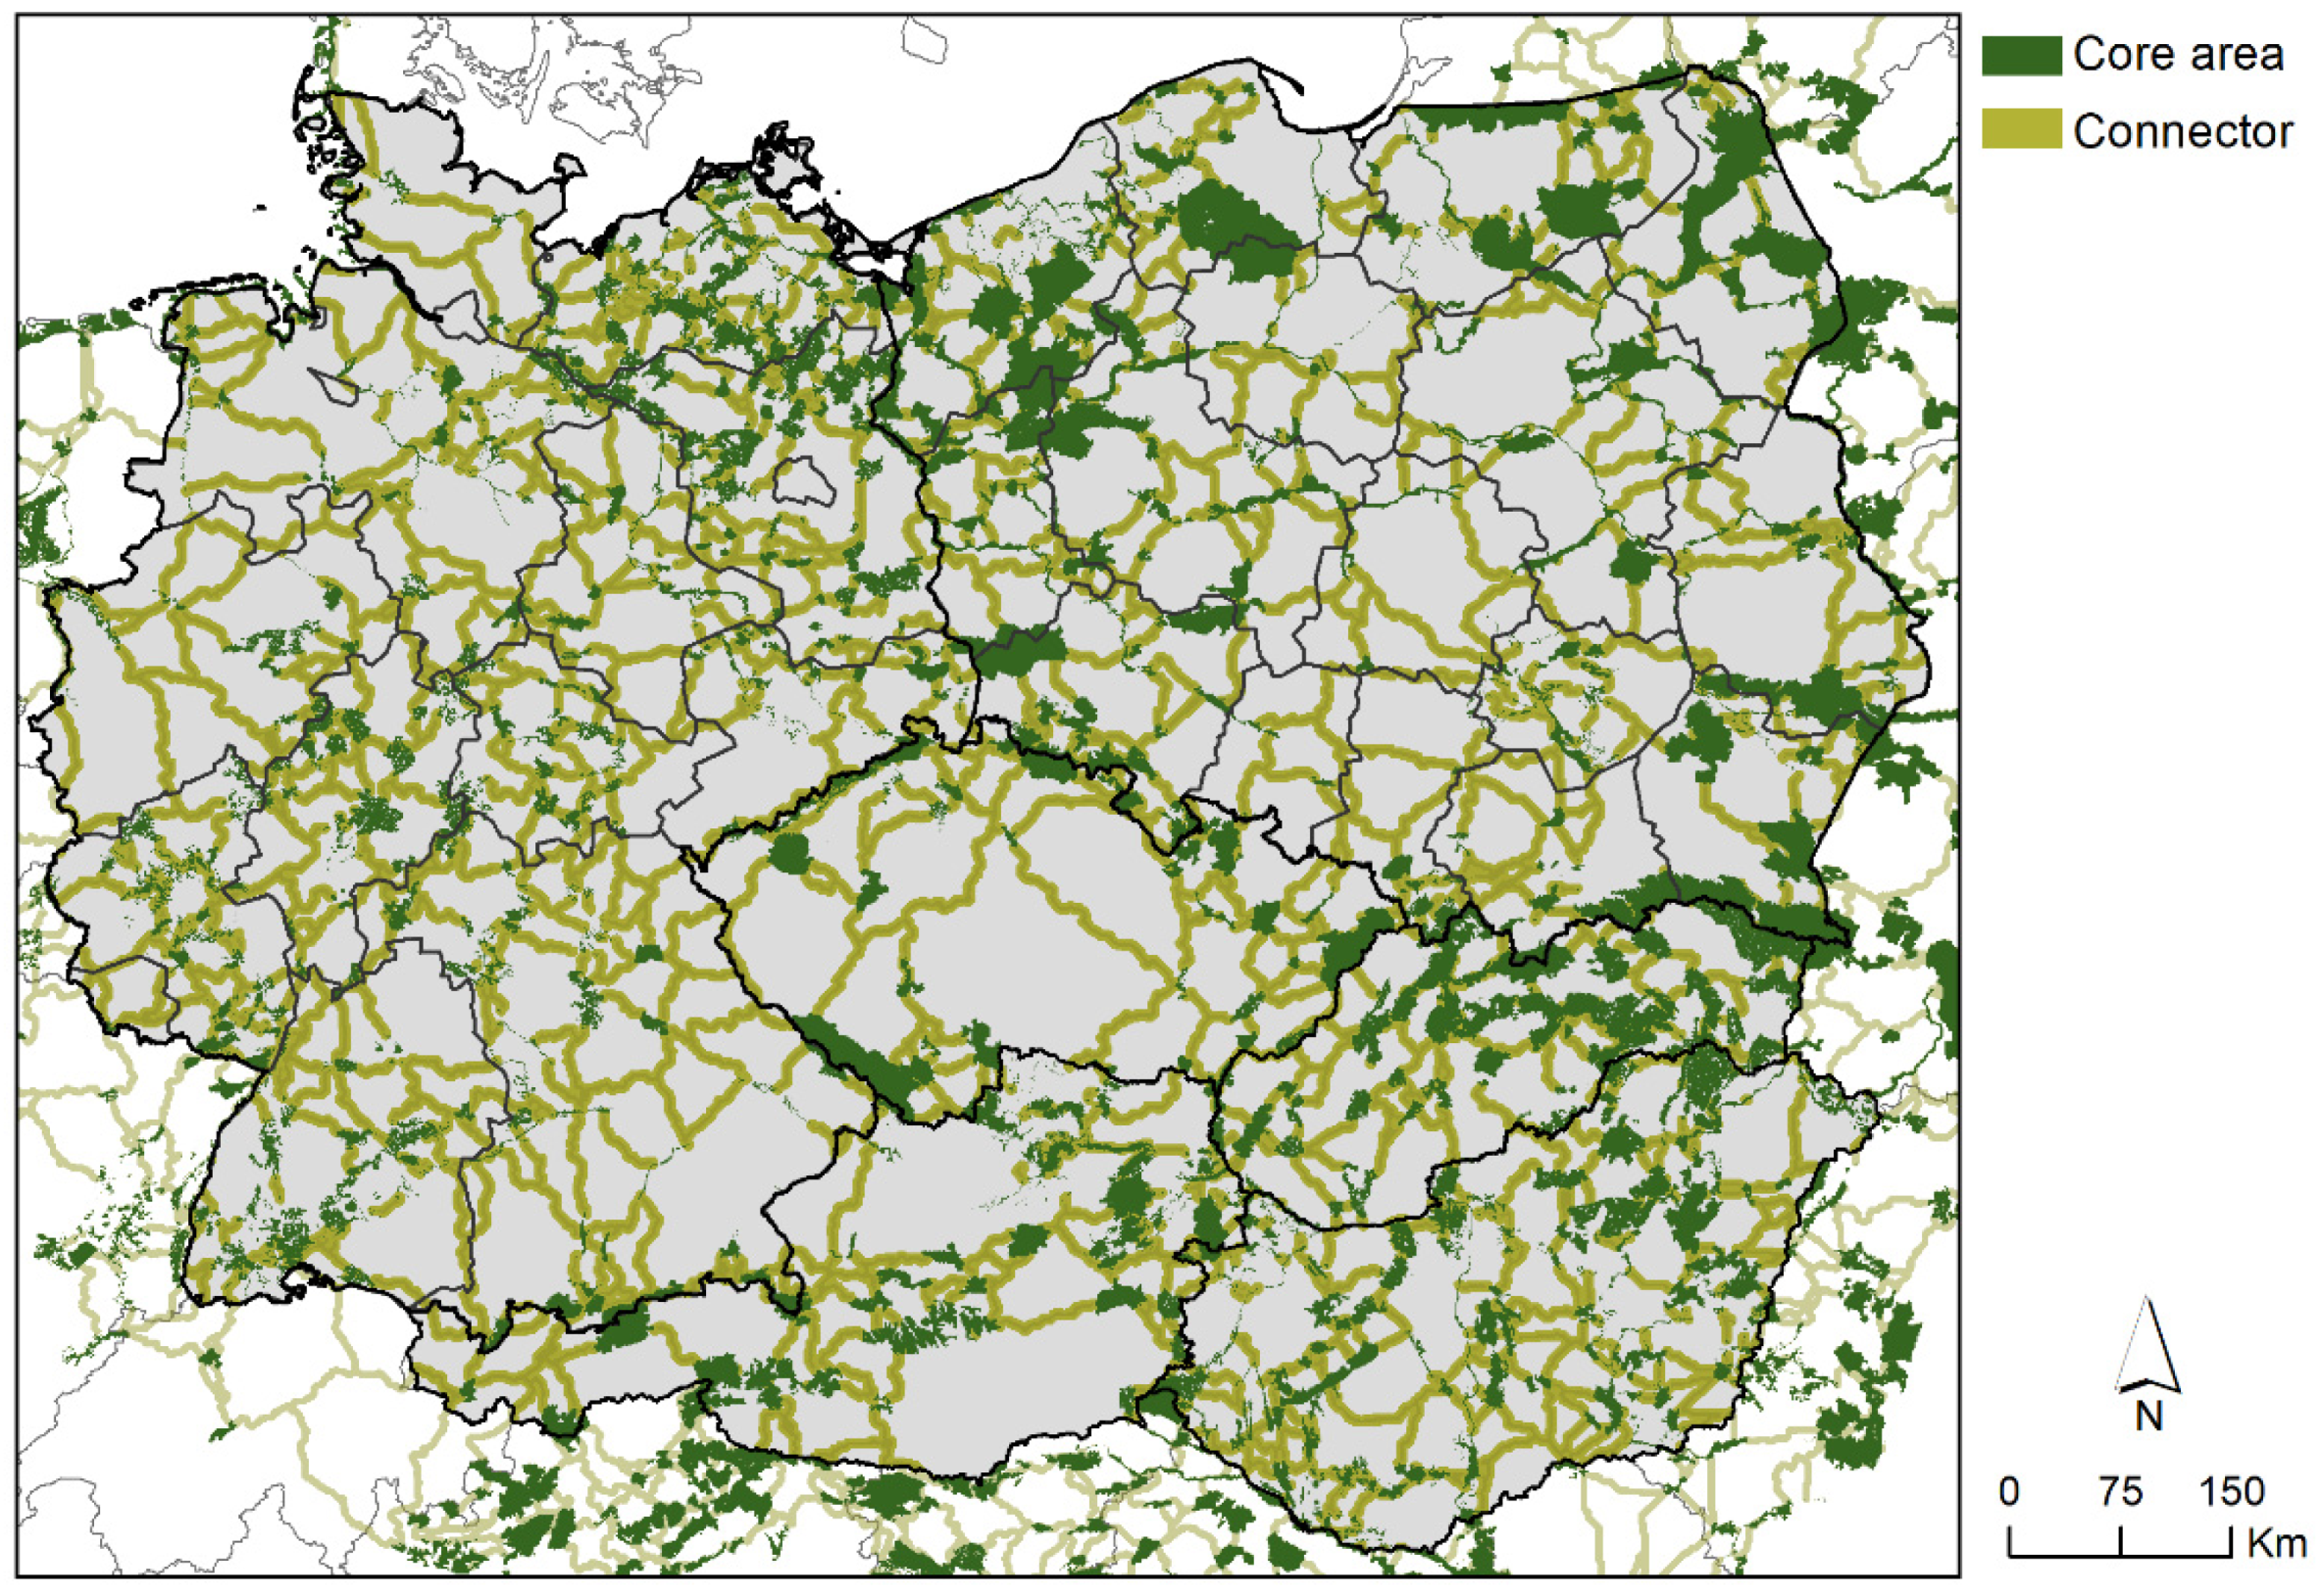
We identified GI as a network of corridors between existing protected areas in six Central European countries (Figure 3). Components of the network are N2k sites of at least 50 km2 (representing the core areas), and 5 km wide ecological corridors linking them. The proposed GI network covers 318,052 km2. This means that our proposal covers almost 33% of the research area. However, almost 18% is already under protection in the N2k network, either inherently as a core area or secondary selected as a part of a GI corridor; therefore, newly identified corridors themselves only represent 15% additional land.
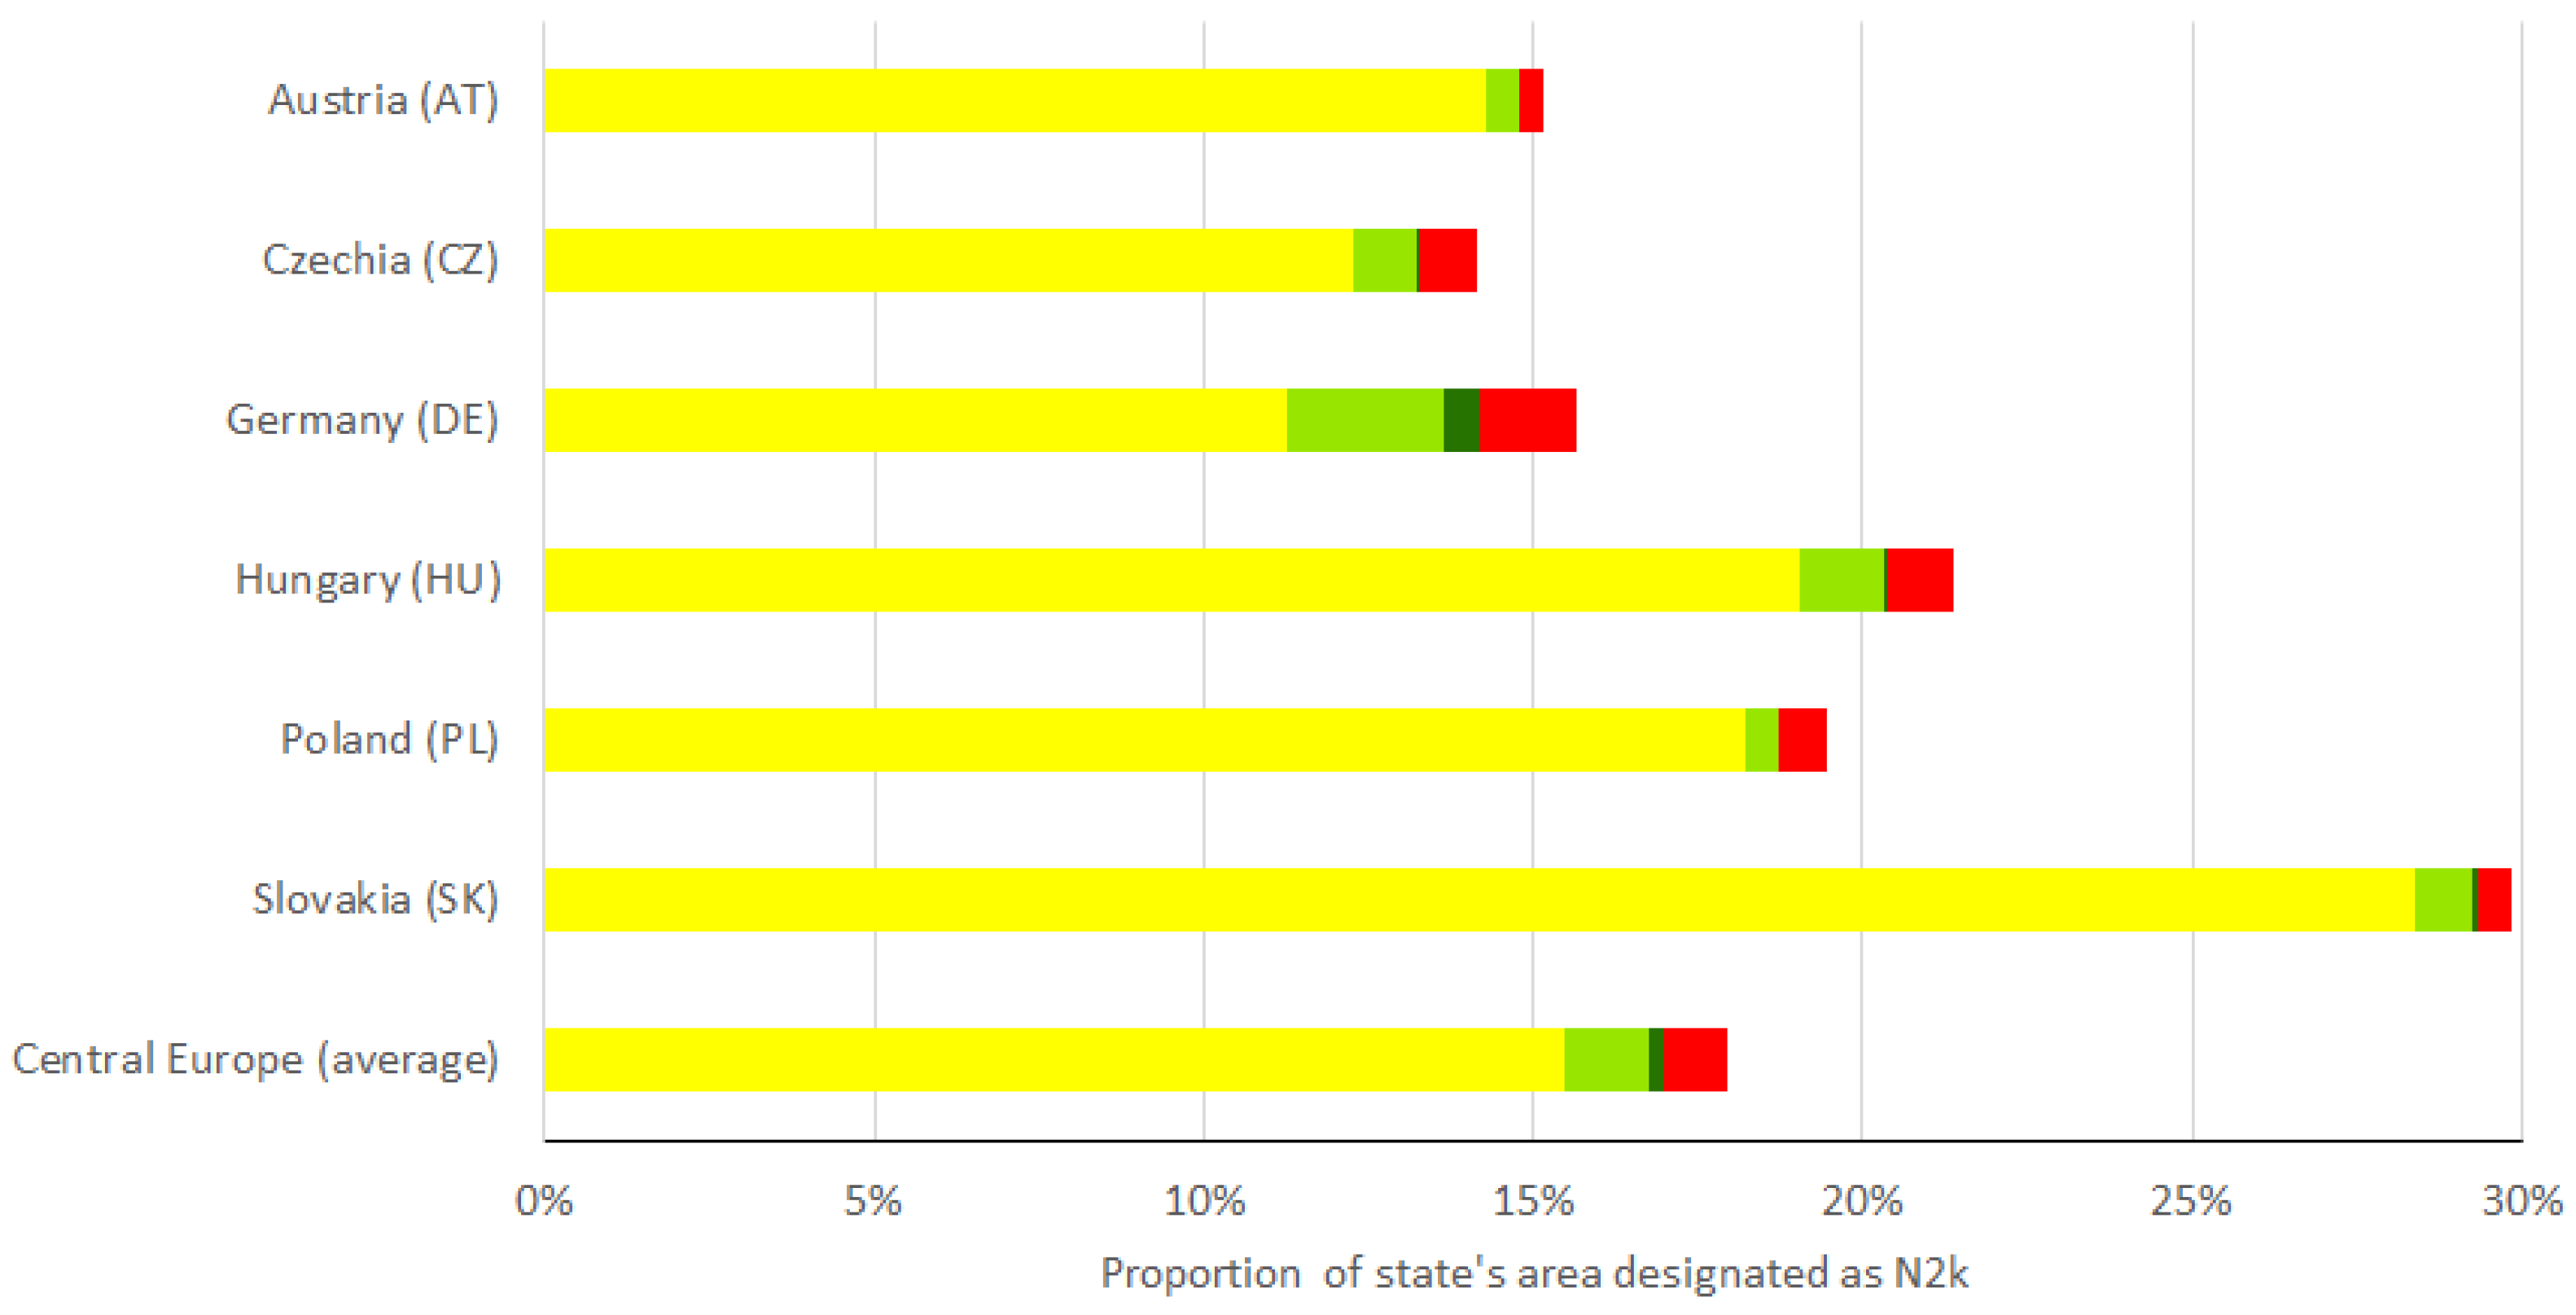
The spatial pattern of GI varies between the countries in the analysis. Distribution and length of corridors is partly determined by size, number, shape, and distribution of core areas (Figure 4). The greatest extent of the GI network is in Slovakia (30%) and Hungary (21%), where the network is evenly distributed. Slovakia also has the highest proportion of area within cores and the greatest average size of core area. The high GI density in Hungary is also due to a large proportion of core areas being smaller in size and larger in amount compared to Slovakia. Therefore, corridors themselves cover a considerably higher proportion of Hungary. In Poland, the GI network covers 19% of the country, and the character of core areas is similar to those in Slovakia. Polish N2k sites are on average the largest; the majority of them became core areas, but as a result the corridors are longer and less dense than in other countries. Such extensive cores are mostly located in the north and are absent in the centre of the country (in voivodeships like Łódź, Holy Cross, Opole, or Silesian). Nevertheless, the distribution of GI corridors is relatively even across the whole country.
The GI network is less evenly distributed in the three remaining countries. Germany, together with Austria and Czechia, show the lowest proportion (around 15%) of their land covered by the GI network. In Germany, the core areas are on average the smallest and the differences in network density are visible between regions. A dense network of corridors occurred in the centre of Germany (Rhineland-Palatinate, Hesse, Thuringia) and in the north-eastern federal states (Mecklenburg-Vorpommern, Brandenburg) where numerous extensive N2k sites are located. In contrast, federal states with an overall lower coverage of N2k network (areal proportion of cores less than 10%) show a lower GI network density (e.g., Lower Saxony, North Rhine-Westphalia, Schleswig-Holstein). In Austria and Czechia the spatial pattern of the network is rather sparse. Despite the fact Czechia has a much higher number of smaller N2k sites than Austria, the number and total area of cores that reached the threshold of 50 km2 is almost identical in both countries. The GI network in these two countries shows visible gaps, namely empty areas without any core surrounded by long-distance corridors. In Austria, such gaps occur in Lower Carinthia, Eastern Styria, and along the Danube River in Upper Austria. A similar gap is also visible in the Alpine Foreland of Bavaria. In Czechia, the corridors literally encircle the Vysočina Region.

3.2. Natura 2000 Network

Beside 847 N2k sites that are an inherent part of the network as core areas, the GI network connected an additional 4393 smaller sites. Corridors themselves connected a total of 2219 sites. Of these, 814 are completely incorporated into corridors in their full extent. The remaining 2174 sites are adjacent either to cores or to N2k sites connected by corridors. It means that, in total, the GI network established a connection between 50% of N2k sites; this equates to more than 94% of the N2k network in Central Europe. Sites remaining outside the GI network are rather small, at 2.88 km2 on average. Nevertheless, these numbers present an overview for the whole area of Central Europe and they differ slightly in each country. The greatest average size of N2k sites remaining outside the GI network is in Poland (6 km2) and the least in Czechia (1 km2).
The number and area of N2k sites captured in the proposed GI network reflects the internal connectivity of the network in individual countries (Figure 5). Some countries protect a lower number of larger N2k sites, whereas others have a higher number of smaller sites, usually at a higher density (Figure 4). Germany has the largest area of sites below the 50 km2 threshold which became part of the GI network (2.4%). In addition, a considerable area of N2k was integrated into the network as adjacent sites (0.5%). It also has the highest total area of smaller sites that remained disconnected (1.4%). In contrast, the remaining countries only have a minor area of N2k that fell into the GI network by adjacency of sites. Hungary (1.3%), Czechia (1%), and Slovakia (0.89%) show relatively high proportions of N2k area connected by corridors. These values are close to the Central European average (1.3%). In Austria and Poland, only a small proportion of N2k area not designated as cores was connected by GI corridors (0.5%). In Slovakia, for example, corridors show the shortest average length in comparison to other countries; this is partly caused by the high proportion of land covered by the N2k network. Many of its N2k sites have an elongated shape, which can shorten the distance to be spanned by corridors. Alongside Austria, Slovakia also had the least absolute area of N2k network remaining outside the GI network.

3.3. CLC Classes and Capacity to Supply ES in Cells under the GI Corridors

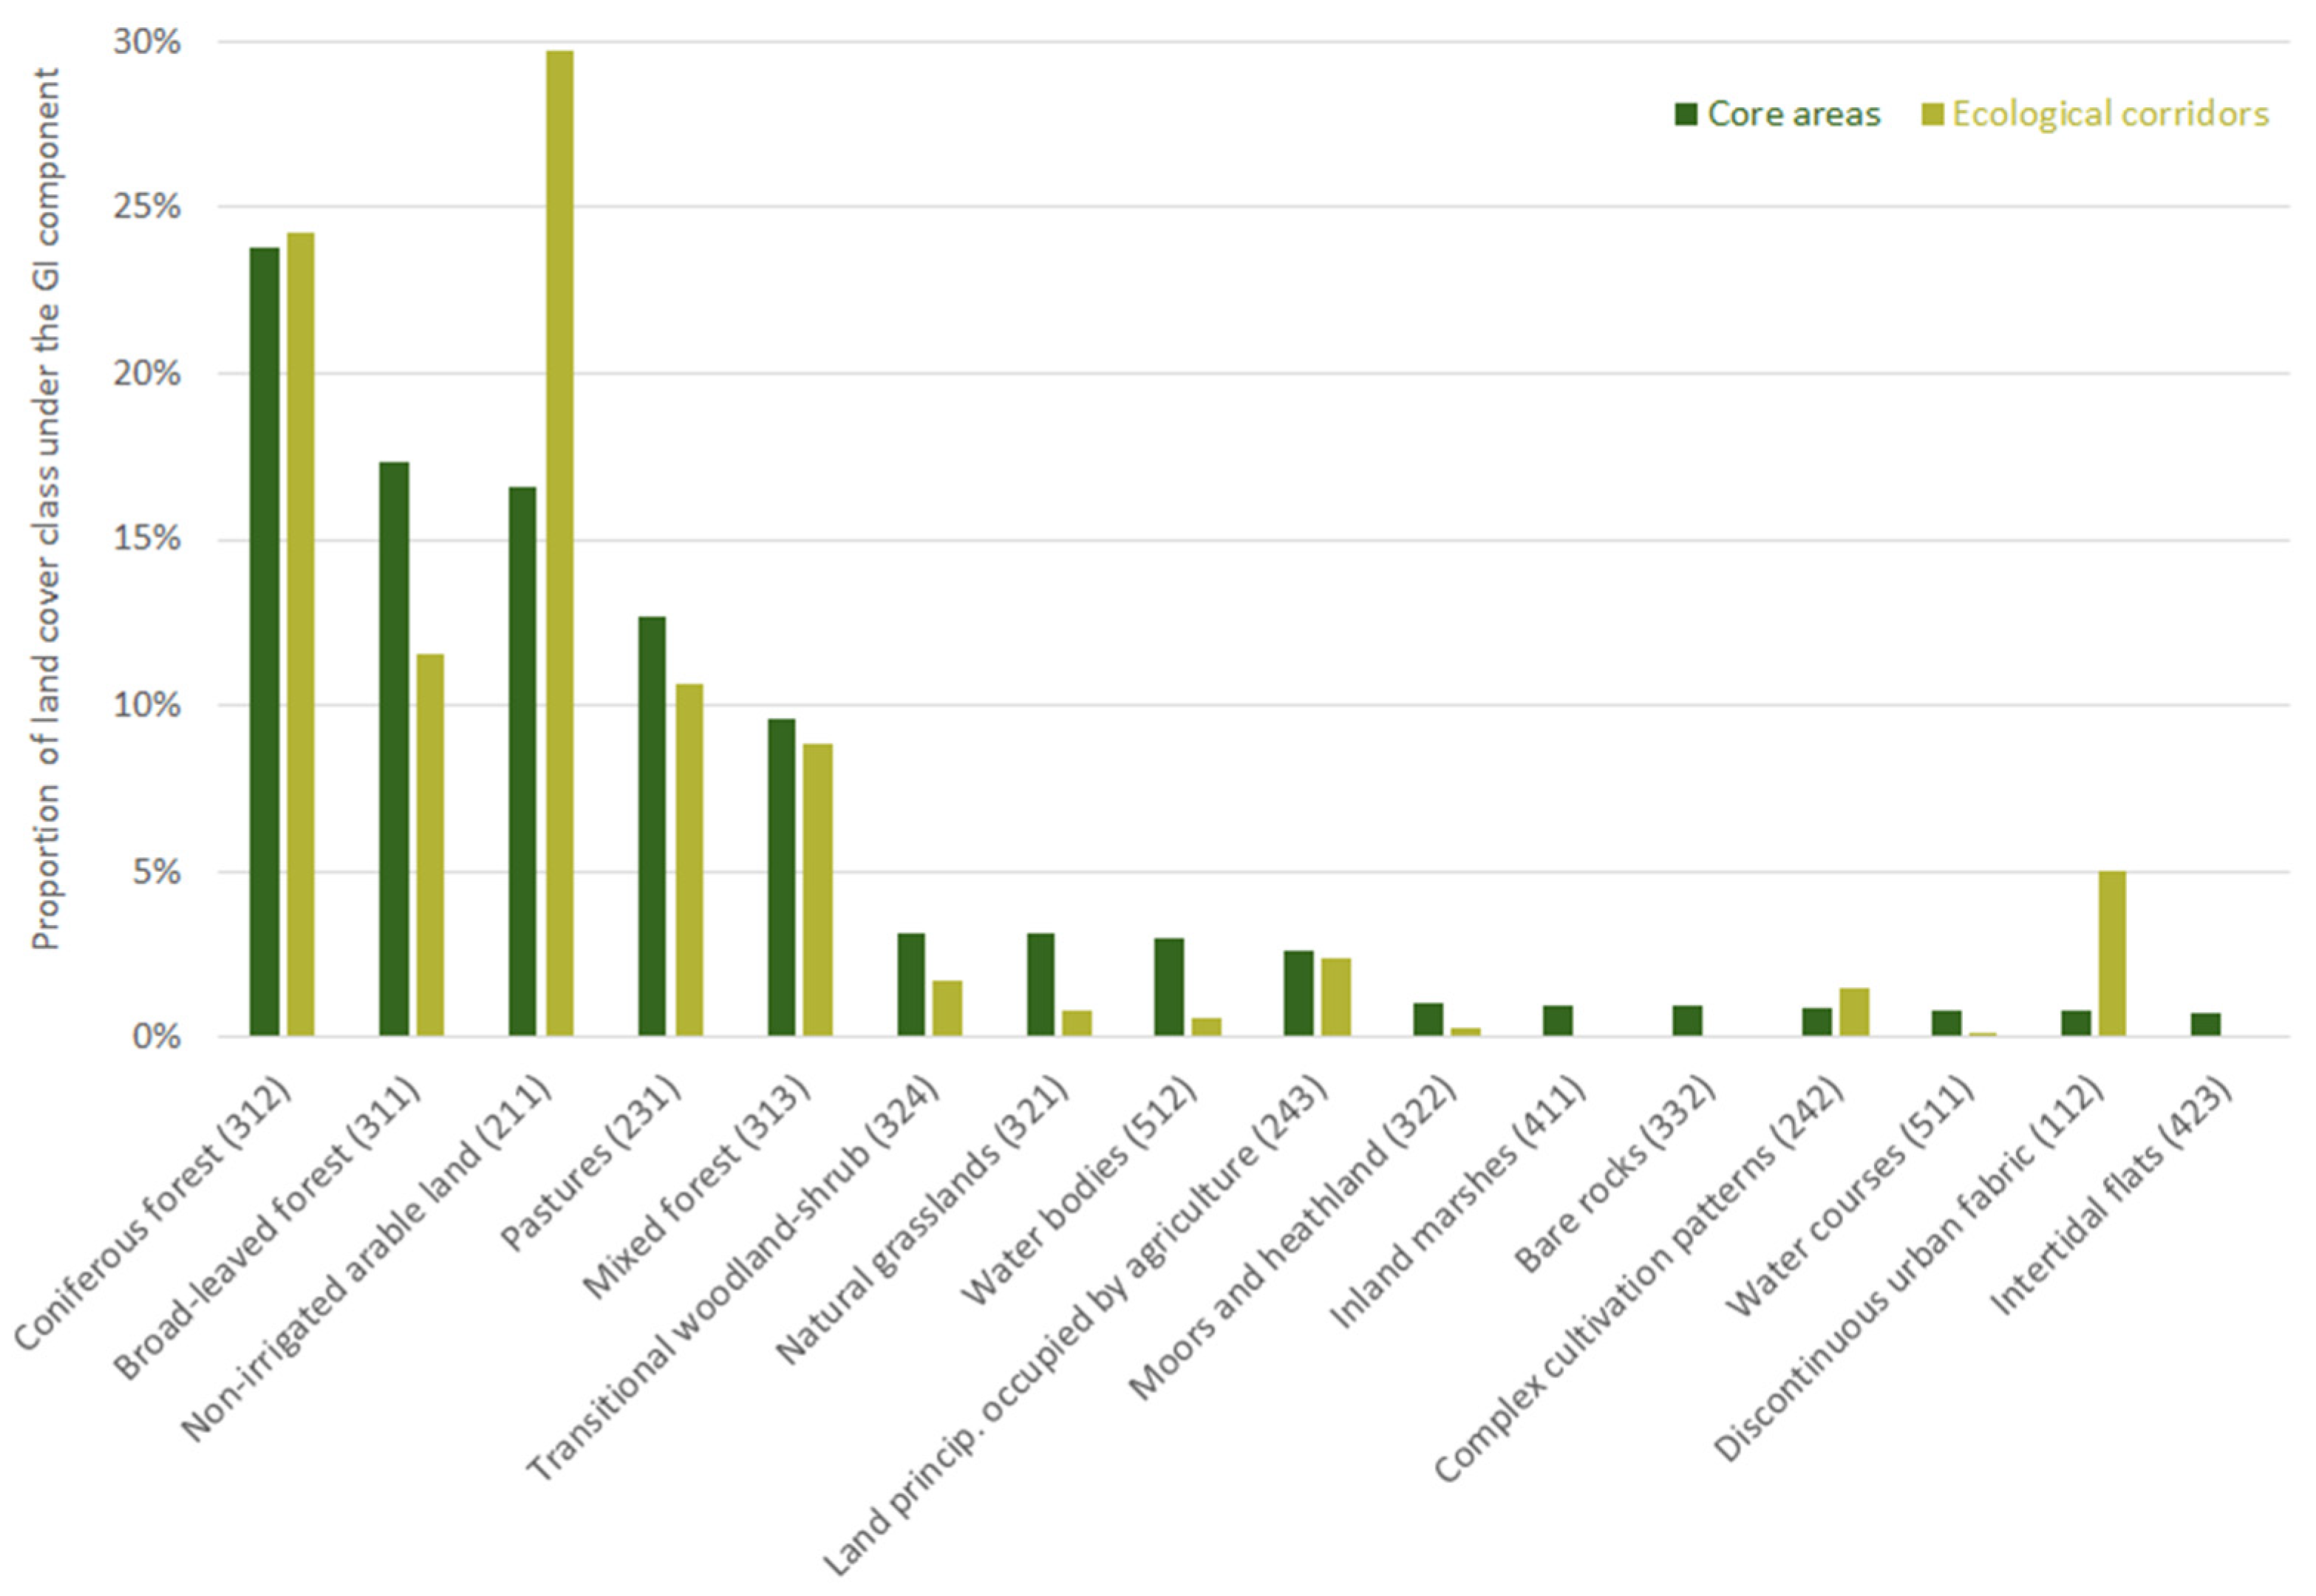
An overview of CLC classes (Figure 6) shows that almost one third of GI is covered by broad-leaved forests (CLC code 311). Then, pastures (CLC code 231), coniferous forests (CLC code 312), non-irrigated arable land (CLC code 211), and mixed forests (CLC code 313) are highly represented. These five categories have the highest coverage for both cores and corridors, although they rank differently. Most of the classes are natural and near-natural ecosystems that can be either extensively or intensively managed. In the case of corridors, two more CLC classes stand out as preferentially selected. The first is land principally occupied by agriculture, with significant areas of natural vegetation (CLC code 243), and the second is discontinuous urban fabric (CLC code 112). These two land covers, as well as non-irrigated arable land, together reach 37% of land under corridors and belong to artificial surfaces and agricultural areas.
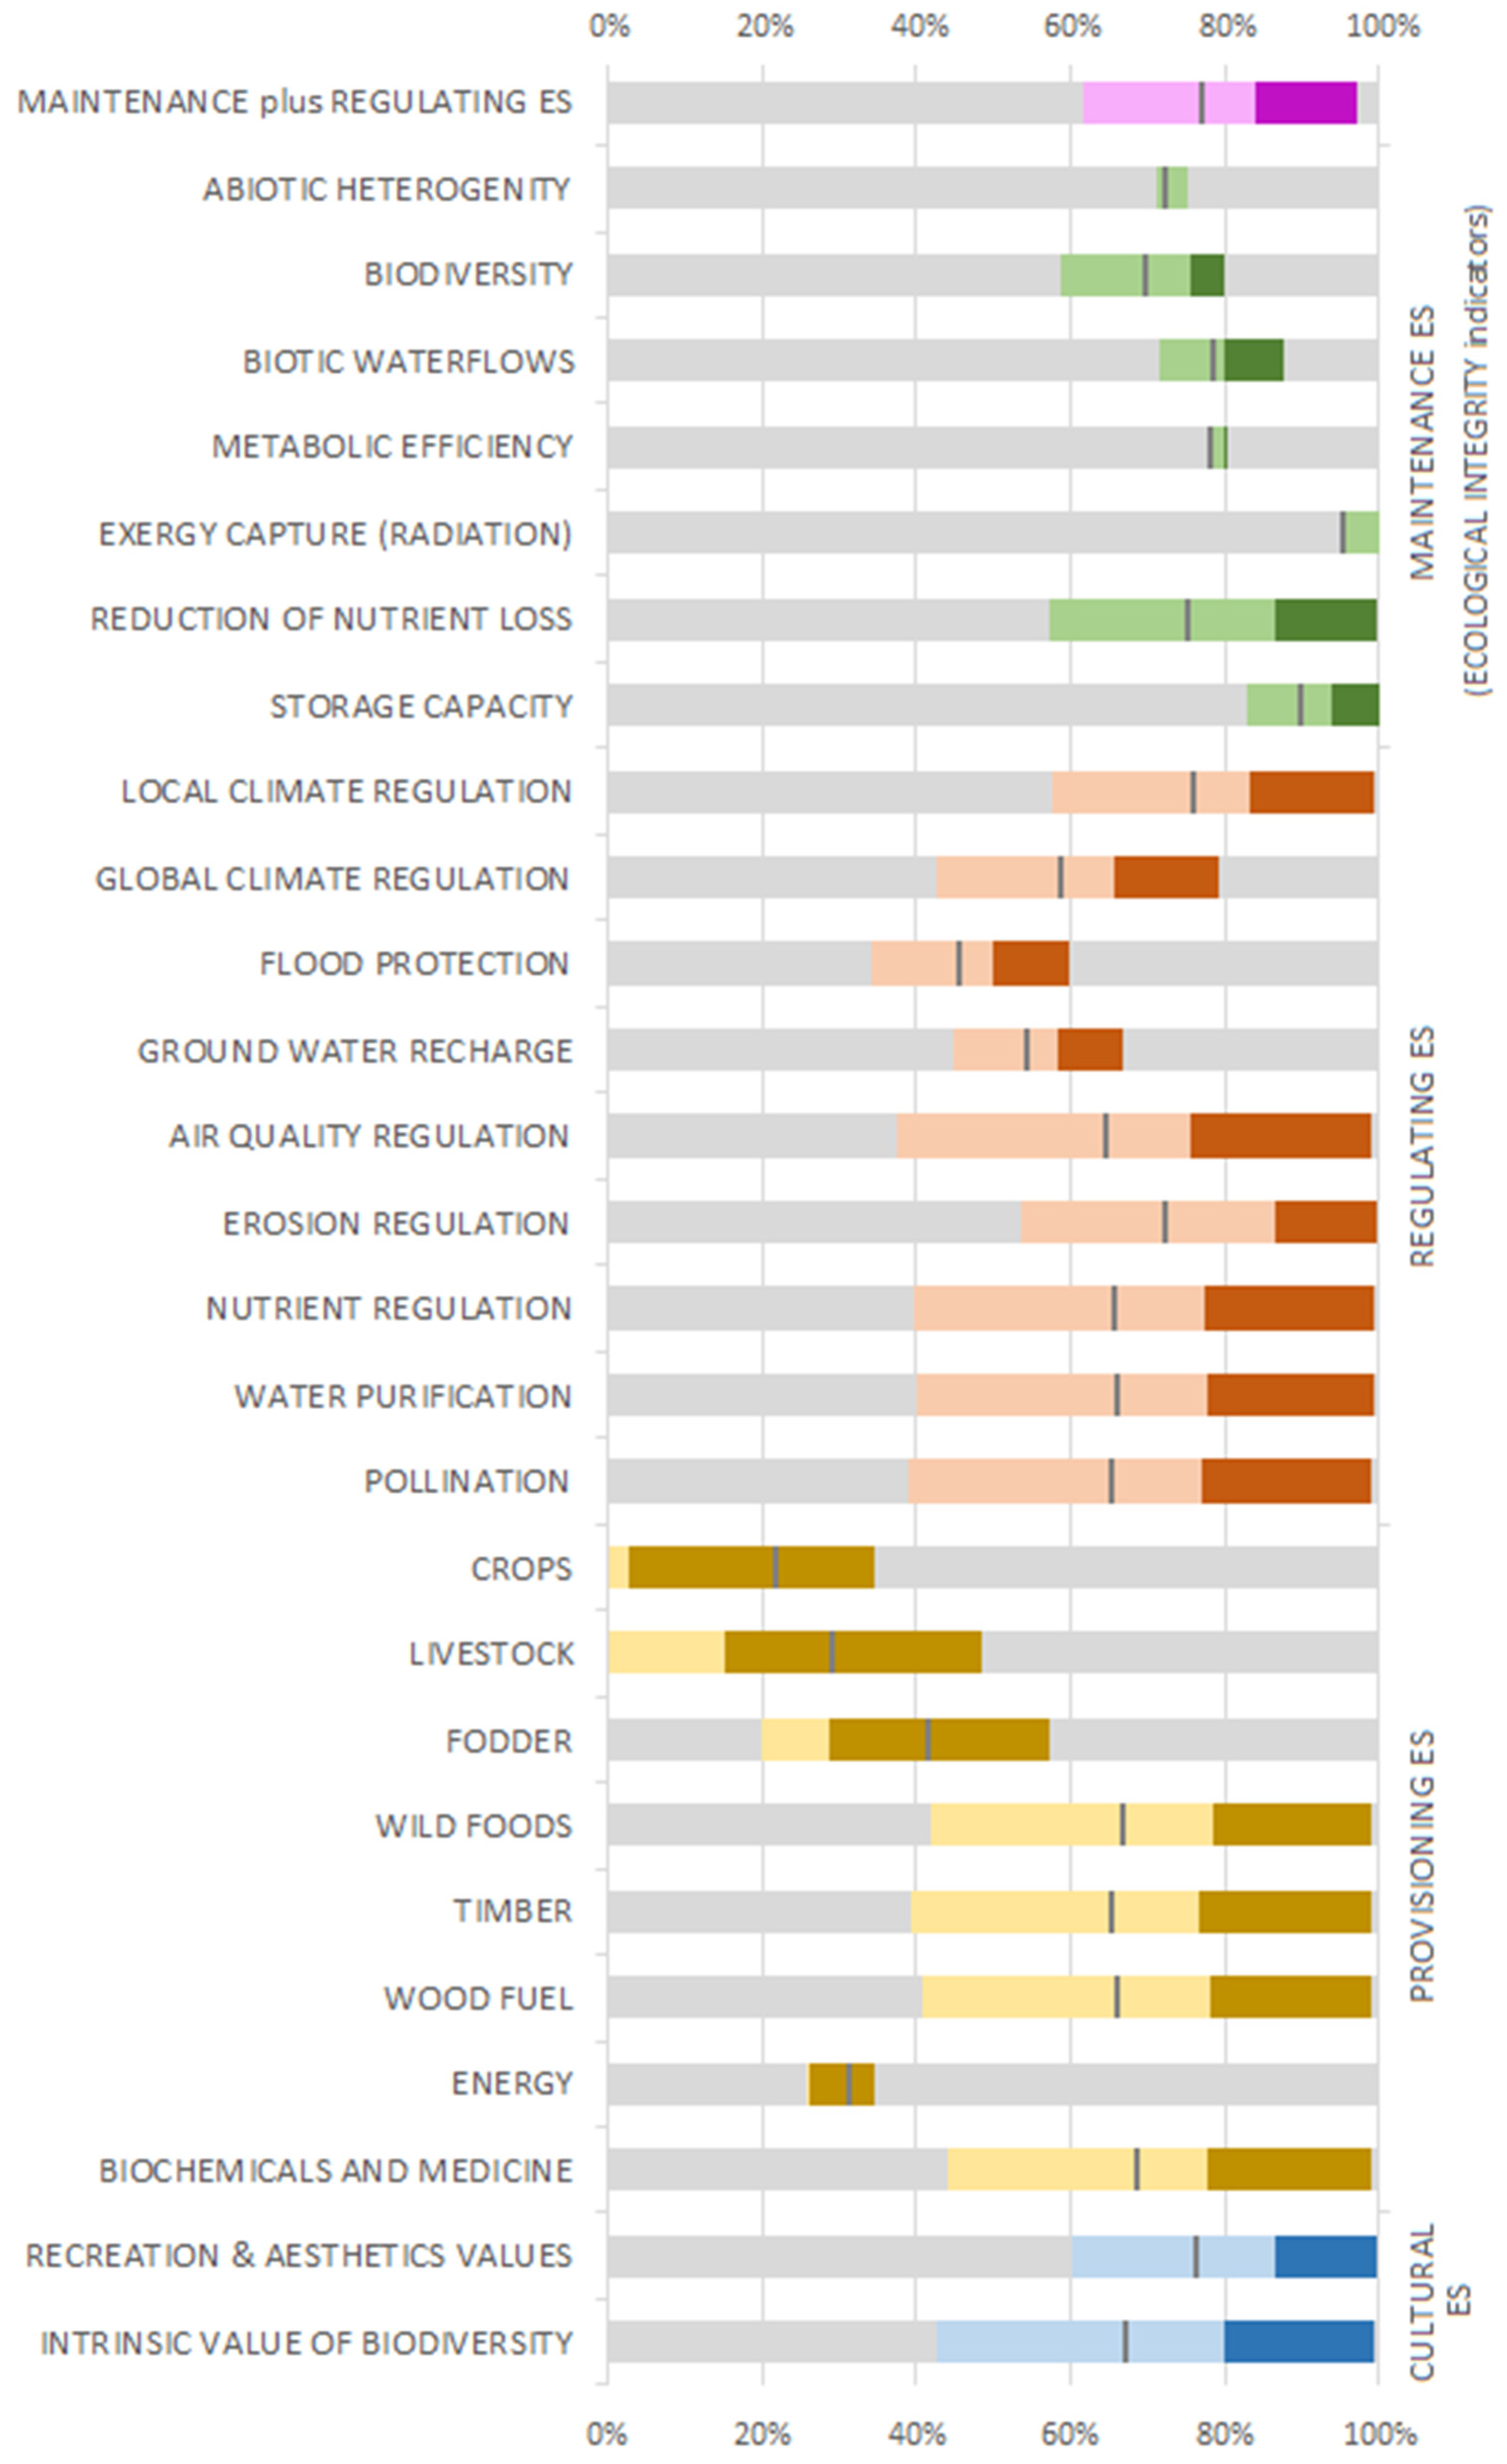
In the case of every ES group, some cells have null or very close to null capacity supply ES, while others reach the maximum supply of the respective group (Figure 7). The maximum value can be reached if the cell is completely covered by a CLC class with maximum capacity to supply ES. In general, the lowest capacity was reached for ES provided by water ecosystems. These include flood protection and ground water recharge (regulating services) that are all very close to zero, as well as capture fisheries, aquacultures, and freshwater provision (provisioning services). These services are provided by rather small patches of specific ecosystems whose high capacity for ES supply diminishes in spatial resolution of our analysis that was conducted upon a regular grid with a cell size of 1 km2.
Overall, the capacity to supply regulating services is very high in cells preferentially selected as suitable for GI network corridors. Mean supply of all respective services is above 50% (i.e., above 2.5 on the relative scale 1–5 of original expert evaluation by Burkhard et al. [63]), with the exception of services provided foremost by freshwater and marine ecosystems (flood protection, ground water recharge, global climate regulation). High values are also reached for the capacity of provisioning services supply, even though this ES group was not the key variable considered for GI delineation. We ascribe this result to the large proportion of forest land cover classes under the GI corridors which have high capacity to supply wild food, timber, wood fuel, biochemicals, and medicines. Provisioning services supplied in intensively managed agricultural ecosystems (crops, livestock, fodder) remain at low capacities. Cultural services (recreation & aesthetics values, intrinsic value of biodiversity) also show generally high supplies; this is because they harmonize with natural and near-natural ecosystems in good environmental condition.
Indicators of ecological integrity that were interpreted as maintenance services have more heterogeneous distributions of capacities in GI corridor cells in the research area. All indicators reach the mean capacity of at least 70%, which corresponds to 3.5 in the original expert evaluation [63]. The lowest average capacity is reached by the indicator of biodiversity.
According to the evaluation matrix, the highest supply of biodiversity belongs to the CLC classes of mixed forest and natural grasslands [63]. Near-natural and human-modified ecosystems that were mostly detected under delineated GI corridors provide lower relative capacity to supply biodiversity. Conversely, the highest average capacity of all indicators appeared for exergy capture which is indicated by primary production [63,66]. In the expert evaluation matrix, the highest values of this indicator are assigned to land cover classes with the greatest share under the GI corridors (forests, pastures and non-irrigated arable land).

4. Discussion

In this study, we examined a simplified approach to GI delineation as an instrument to connect N2k sites, while utilizing ecosystems able to supply high levels of ES in the landscape. In particular, non-irrigated arable land, pastures, and all types of forests are the preferentially selected CLC classes for delineation of corridors. An overview of CLC classes shows that GI is not strictly limited to intact natural ecosystems and remote regions. Non-irrigated arable land, together with discontinuous urban fabric and agricultural land with natural vegetation, represent more than one third of land under the GI corridors. The finding that GI corridors intersect human dominated landscapes corresponds with current demands on the GI network [11] and confirms the suitability of methods selected for GI outline.
The presence of the GI network in accessible locations ensures that ES are supplied in proximity to their beneficiaries. The presented GI provides satisfactory levels of regulating ES supply because their values were key to its delineation. Evaluation of ES supply capacities under the GI network also revealed high supply of some production services, such as wild foods, timber, wood fuel, biochemicals, and medicine. These services are mainly supplied in natural or near-natural ecosystems which are more compatible with biodiversity conservation goals. Such areas cover the remaining two thirds of land under GI corridors. This finding contrasts with the general understanding that provisioning services are mostly in trade-off with conservation efforts [33,34]. Despite the fact that ecosystems under the GI network can potentially provide multiple services, actual ES supply depends on human demands; this in turn influences the management of ecosystems and subsequently intensifies trade-offs and synergies of various ES [65]. Only in adequately managed ecosystems can such provisioning services contribute to economic benefits provided by the GI network without causing any harm to biodiversity.
Biodiversity enhancement is one of tasks of GI planning. The proposed GI network connected 94% of the N2k network in the research area. The requirement of full implementation of the N2k network is related not only to full coverage of species and habitats of interest, but also to structural and functional connectivity of the network. Araújo et al. [77] report that species protected in the N2k network are especially threatened by climate change; this is because the sites are on average smaller and they are often located in accessible flatlands. Overall enhancement of structural connectivity between N2k sites by GI is satisfactory, considering that the average size of disconnected N2k is 2.88 km2. De la Fuente et al. [48] found similar result for connectivity of N2k sites covered with woodland and riparian forests habitats in Spain.
The spatial pattern of the GI network varies across the research area. Variation in distribution of this network stems primarily from the distribution, shape, and size of N2k sites that served as cores. However, listed characteristics of sites reflect not only the environmental and biogeographical qualities, but also decision making in spatial conservation planning. We suggest that a survey of national N2k sites connected with the delineated GI depicts the connectivity aspects of the N2k network in each country. Of all the countries in the research area, Germany stands out in particular considering its present spatial N2k network distribution. Germany has the lowest share of area within cores; however, the highest area of N2k network became connected by the GI network via corridors or by adjacency to connected N2k sites. Connectivity by adjacency of sites was overall insignificant in any other country. We interpret the result of high connectedness in Germany as a sign of high quality implementation of the N2k network.
In our view, the transnational planning of the GI network gives a unique opportunity to utilize long-distance functional ecological connectivity. When we compare delineated GI network to long-distance migration corridors for large mammals [78], both networks show a significant overlay in multiple locations. The similarity can be detected in particular in Poland. However, the country’s national migration corridors are more precise and are usually narrower than the 5 km wide GI corridors. We see delineated GI as an environment that allows species various types of movement through the landscape. In the research area, GI corridors represent 15% of land suitable for conservation-oriented management practices. We see the support of long-distance connectivity as a set of various, high quality patches within the corridors, rather than one extensive, linked habitat. In that sense, corridors might be conserved as working land, as proposed for example by Kremen and Merenlender [79].
Identification of the GI network as done here is an illustrative examination of approach. Transnational studies of GI seem to be more effective in reaching common European goals than individual national designs for the GI network, and they avoid trans-border incoherencies of the proposed networks [14,41]. To safeguard connectivity of the ecological network along the outer borders, spatial analysis was performed on the research area plus a 100 km-wide outer buffer. The necessity to adequately address ecological connectivity on the borders has seldom been considered in national and transnational GI studies carried out with a similar methodological approach.
We had to make some arbitrary decisions, such as selection of core threshold size and the width of ecological corridors. Selection of arbitrary thresholds is an inevitable step in spatial conservation planning based on software tools which rely on the user’s expertise in the field. Limited availability of extensive, good-quality datasets compromise the detail of output, especially when countries outside the EU are incorporated into the analysis. The same conclusion was reached by Neubert and John [53], who evaluated available data for GI assessment in Central Europe. They selected CLC as the most comprehensive and detailed dataset for the region. Skokanová et al. [80] see the best applicability of this LULC layer in studies at a national and transnational scale. Nevertheless, we are aware that use of LULC maps as proxies for ES supply is a rather rough approach [81,82]. Moreover, the relevance of some LULC classes for the supply of key ES is highly dependent on their management. In our case, that is especially applicable for the CLC classes non-irrigated arable land and discontinuous urban fabric; these are significantly represented in our GI corridors. Averaged values of ES provision assigned by experts can hide the occurrence of land cover patches in unsatisfactory environmental conditions. Intensity of management also influences the suitability of ecosystems for ecological connectivity [83].
The requirement to incorporate N2k sites into the GI network without specific demands on the character of the corridors is insufficient for targeted biodiversity enhancement. Connecting N2k sites without respect to the specific demands of species of interest is questionable. This is a general issue in connectivity planning at any spatial scale [84,85,86]. In many cases, the corridors for various species of interest overlap [50], but they can be in complete opposition as well. Regarding functional connectivity, none of the studies that incorporated N2k sites as a rule questioned this issue and tried to overcome it. The majority of GI studies that explicitly model connectivity rely on the environmental demands of large mammals (e.g., [17,87]), and some authors replace them with unspecified umbrella species [49]. GI delineated by the European Environmental Agency [87] reports high spatial overlap of key areas for the provision of regulating services and the habitats of mammals. However, large mammals are habitat generalists who can migrate through a wide range of ecosystems (if they are undisturbed by human activities). Although mammals in general benefit from the N2k network, large mammals are less likely to be associated with the sites because their territories often extend to much larger areas [88].
Our design was also made without any consideration of barriers to species movement, such as road networks, railways, or built-up areas. Ecological corridors in the GI network generally avoid cities because the supply of regulating and maintenance ES there is rather small compared to their surroundings; however, spatial resolution of the analysis is too coarse to depict linear barriers that significantly impede species movement. We are aware that the method proposed here can improve the structural connectivity of N2k sites, but the functionality of the network would have to be validated [89]. At a national level, de la Fuente et al. [50] verified resistance surface with landscape genetic data. To our knowledge, none of the transnational GI studies have validated the effectiveness of functional connectivity of their ecological network with sensitivity analysis, or any other evaluation of functional connectivity.
The presented solution of GI delineation can be helpful in large scale studies where it can bring results comparable to more sophisticated and data intensive approaches. It can be of benefit in detection of areas with high capacity to supply ES, as well as biodiversity enhancement via connecting biodiversity rich cores. The presented input data are accessible for any country covered by CLC, and specific selection of ES can be optimized to the objectives of a study. We believe, for example, that a set of indicators reflecting traditional knowledge, practices, and materials might be useful for GI delineation in diverse regional and cultural contexts. To validate the ecological connectivity of the GI network, verification of the occurrence of umbrella species as well as detection of barriers and bottleneck would be useful.

5. Conclusions

The enhancement of ecological connectivity is crucial for long-term support of biodiversity and ecological processes in fragmented landscapes [90]. Our approach to GI planning combines LULC information with its capacity for ES supply; it can be used to identify a multifunctional ecological network when the availability of other extensive data is limited. Our approach is based on the maximum capacity of ecosystems to supply maintenance and regulating ES and it also detects natural and near-natural areas suitable for delineation of a functional ecological network between protected areas. Our results show that not only maintenance and regulating, but also provisioning and cultural services (e.g., wild foods, timber, wood fuel, or recreation) can be supplied at high levels in the delineated GI network. However, the selection of ES and indicators to their evaluation can be modified to each case study.
We present a GI network which creates linkages between more than 94% of the area of N2k sites. This European network of protected sites is seen as the backbone of the GI network; the differences in the coverage of the GI network can indicate the current state of national implementation of the N2k network. For example, spatial distribution of the GI network shows that N2k sites in Germany are already designed with consideration for structural connectedness of the ecological network. In the remaining countries in the research area, the most common problem is designation of a small amount of large protected areas located far from each other.
Further areal expansion of traditional protected areas in Central Europe is unlikely. We believe that restorative conservation of working land [79] is an appropriate direction to take in the management of such an extensive GI network at a transnational level. Future research of GI should focus not only on ES supply, but also on the location of demands for ES and their flows. Several issues which can be considered as limitations of our study stem from the definition and general conceptual issues of the GI approach in nature protection. Authors often discuss three main issues, namely: (1) unnecessary connecting of areas where connection is pointless or redundant; (2) attempts to reach multifunctionality of landscape where unnecessary; and (3) enhancement of ES provision in locations where it is irrelevant. From the perspective of functional connectivity, barriers and bottlenecks in the GI network would need to be located.

Author Contributions

Conceptualization, D.R. and E.F.; Methodology, D.R. and V.Z.; Formal Analysis, V.Z.; Writing—Original Draft Preparation, E.F.; Visualization, E.F. All authors have read and agreed to the published version of the manuscript.

Funding

This research was supported by the Charles University Grant Agency [GAUK616217].

Institutional Review Board Statement

Not applicable.

Informed Consent Statement

Not applicable.

Data Availability Statement

The data presented in this study are available on request from the corresponding author.

Conflicts of Interest

The authors declare no conflict of interest. The funders had no role in the design of the study; in the collection, analyses, or interpretation of data; in the writing of the manuscript, or in the decision to publish the results.

References

  1. Butchart, S.H.M.; Walpole, M.; Collen, B.; van Strien, A.; Scharlemann, J.P.W.; Almond, R.E.A.; Baillie, J.E.M.; Bomhard, B.; Brown, C.; Bruno, J.; et al. Global biodiversity: Indicators of recent declines. Science 2010, 328, 1164–1168. [Google Scholar] [CrossRef]
  2. Rands, M.R.W.; Adams, W.M.; Bennun, L.; Butchart, S.H.M.; Clements, A.; Coomes, D.; Entwistle, A.; Hodge, I.; Kapos, V.; Scharlemann, J.P.W.; et al. Biodiversity conservation: Challenges beyond 2010. Science 2010, 329, 1298–1303. [Google Scholar] [CrossRef] [Green Version]
  3. Millennium Ecosystem Assessment. Ecosystems and Human Well-Being: Synthesis; Island Press: Washington, DC, USA, 2005. [Google Scholar]
  4. Haines-Young, R.; Potschin, M. The links between biodiversity, ecosystem services and human well-being. In Ecosystem Ecology: A New Synthesis; Raffaeli, D., Frid, C., Eds.; Cambridge University Press: Cambridge, UK, 2010; pp. 110–139. [Google Scholar]
  5. Ridder, B. Questioning the ecosystem services argument for biodiversity conservation. Biodivers. Conserv. 2008, 17, 781–790. [Google Scholar] [CrossRef]
  6. Haslett, J.R.; Berry, P.M.; Bela, G.; Jongman, R.H.G.; Pataki, G.; Samways, M.J.; Zobel, M. Changing conservation strategies in Europe: A framework integrating ecosystem services and dynamics. Biodivers. Conserv. 2010, 19, 2963–2977. [Google Scholar] [CrossRef]
  7. Palomo, I.; Montes, C.; Martín-López, B.; González, J.A.; García-Llorente, M.; Alcorlo, P.; Mora, R.M.G. Incorporating the social–ecological approach in protected areas in the Anthropocene. BioScience 2014, 64, 181–191. [Google Scholar] [CrossRef]
  8. Reyers, B.; Polasky, S.; Tallis, H.; Mooney, H.A.; Larigauderie, A. Finding common ground for biodiversity and ecosystem services. BioScience 2012, 62, 503–507. [Google Scholar] [CrossRef] [Green Version]
  9. Bouwma, I.; Schleyer, C.; Primmer, E.; Winkler, K.J.; Berry, P.; Young, J.; Carmen, E.; Špulerová, J.; Bezák, P.; Preda, E.; et al. Adoption of the ecosystem services concept in EU policies. Ecosyst. Serv. 2018, 29, 213–222. [Google Scholar] [CrossRef]
  10. European Commission. Communication from the Commission to the European Parliament, the Council, the Economic and Social Committee and the Committee of the Regions. Our Life Insurance, Our Natural Capital: An EU Biodiversity Strategy to 2020; COM(2011) 244; European Commission: Brussels, Belgium, 2011; Available online: https://eur-lex.europa.eu/LexUriServ/LexUriServ.do?uri=COM:2011:0244:FIN:EN:PDF (accessed on 1 January 2021).
  11. European Commission. Communication from the Commission to the European Parliament, the Council, the Economic and Social Committee and the Committee of the Regions. Green Infrastructure (GI)—Enhancing Europe’s Natural Capital; COM(2013) 249 final; European Commission: Brussels, Belgium, 2013; Available online: https://eur-lex.europa.eu/resource.html?uri=cellar:d41348f2-01d5-4abe-b817-4c73e6f1b2df.0014.03/DOC_1&format=PDF (accessed on 1 January 2021).
  12. European Commission. Communication from the Commission to the European Parliament, the Council, the Economic and Social Committee and the Committee of the Regions. EU Biodiversity Strategy for 2030 Bringing Nature Back into Our Lives; COM(2020) 380 final; European Commission: Brussels, Belgium, 2020; Available online: https://eur-lex.europa.eu/resource.html?uri=cellar:a3c806a6-9ab3-11ea-9d2d-01aa75ed71a1.0001.02/DOC_1&format=PDF (accessed on 1 January 2021).
  13. Wang, J.; Banzhaf, E. Towards a better understanding of Green Infrastructure: A critical review. Ecol. Indic. 2018, 85, 758–772. [Google Scholar] [CrossRef]
  14. Hermoso, V.; Morán-Ordóñez, A.; Lanzas, M.; Brotons, L. Designing a network of green infrastructure for the EU. Landsc. Urban Plan. 2020, 196, 103732. [Google Scholar] [CrossRef]
  15. Kopperoinen, L.; Itkonen, P.; Niemela, J. Using expert knowledge in combining green infrastructure and ecosystem services in land use planning: An insight into a new place-based methodology. Landsc. Ecol. 2014, 29, 1361–1375. [Google Scholar] [CrossRef]
  16. Lanzas, M.; Hermoso, V.; de-Miguel, S.; Bota, G.; Brotons, L. Designing a network of green infrastructure to enhance the conservation value of protected areas and maintain ecosystem services. Sci. Total Environ. 2019, 651, 541–550. [Google Scholar] [CrossRef]
  17. Liquete, C.; Kleeschulte, S.; Dige, G.; Maes, J.; Grizzetti, B.; Olah, B.; Zulian, G. Mapping green infrastructure based on ecosystem services and ecological networks: A Pan-European case study. Environ. Sci. Policy 2015, 54, 268–280. [Google Scholar] [CrossRef]
  18. Mubareka, S.; Estreguil, C.; Baranzelli, C.; Gomes, C.R.; Lavalle, C.; Hofer, B. A land-use-based modelling chain to assess the impacts of Natural Water Retention Measures on Europe’s Green Infrastructure. Int. J. Geogr. Inf. Sci. 2013, 27, 1740–1763. [Google Scholar] [CrossRef]
  19. Vallecillo, S.; Polce, C.; Barbosa, A.; Castillo, C.P.; Vandecasteele, I.; Rusch, G.M.; Maes, J. Spatial alternatives for Green Infrastructure planning across the EU : An ecosystem service perspective. Landsc. Urban Plan. 2018, 174, 41–54. [Google Scholar] [CrossRef]
  20. Mell, I.C. Green infrastructure: Concepts and planning. FORUM Ejournal 2008, 8, 69–80. [Google Scholar]
  21. John, H.; Marrs, C.; Neubert, M. (Eds.) Green Infrastructure Handbook—Conceptual and Theoretical Background, Terms and Definitions; Interreg Central Europe Project MaGIC Landscapes; Output O.T1.1. Technische Universität Dresden: Dresden, Germany, 2019. Available online: https://www.interregcentral.eu/Content.Node/MaGICLandscapes-Green-Infrastructure-Handbook.pdf (accessed on 1 January 2021).
  22. European Commission. The Multifunctionality of Green Infrastructure (In-Depth Report); DG Environment News Alert Service—Science for Environment Policy; European Commission: Brussels, Belgium, 2012; Available online: http://ec.europa.eu/environment/nature/ecosystems/docs/Green_Infrastructure.pdf (accessed on 1 January 2021).
  23. Jax, K.; Heink, U. Searching for the place of biodiversity in the ecosystem services discourse. Biol. Conserv. 2015, 191, 198–205. [Google Scholar] [CrossRef]
  24. Mace, G.M.; Norris, K.; Fitter, A.H. Biodiversity and ecosystem services: A multilayered relationship. Trends Ecol. Evol. 2012, 27, 19–26. [Google Scholar] [CrossRef] [PubMed]
  25. Bastian, O. The role of biodiversity in supporting ecosystem services in Natura 2000 sites. Ecol. Indic. 2013, 24, 12–22. [Google Scholar] [CrossRef]
  26. Harrison, P.A.; Berry, P.M.; Simpson, G.; Haslett, J.R.; Blicharska, M.; Bucur, M.; Dunford, R.; Egoh, B.; Garcia-Llorente, M.; Geamănă, N.; et al. Linkages between biodiversity attributes and ecosystem services: A systematic review. Ecosyst. Serv. 2014, 9, 191–203. [Google Scholar] [CrossRef] [Green Version]
  27. Urbis, A.; Povilanskas, R.; Newton, A. Valuation of aesthetic ecosystem services of protected coastal dunes and forests. Ocean Coast. Manag. 2019, 179, 104832. [Google Scholar] [CrossRef]
  28. Luck, G.W.; Harrington, R.; Harrison, P.A.; Kremen, C.; Berry, P.M.; Bugter, R.; Dawson, T.P.; de Bello, F.; Díaz, S.; Feld, C.K.; et al. Quantifying the Contribution of Organisms to the Provision of Ecosystem Services. BioScience 2009, 59, 223–235. [Google Scholar] [CrossRef]
  29. Balvanera, P.; Siddique, I.; Dee, L.; Paquette, A.; Isbell, F.; Gonzalez, A.; Byrnes, J.; O’Connor, M.I.; Hungate, B.A.; Griffin, J.N. Linking biodiversity and ecosystem services: Current uncertainties and the necessary next steps. BioScience 2014, 64, 49–57. [Google Scholar] [CrossRef]
  30. Chan, K.M.A.; Shaw, M.R.; Cameron, D.R.; Underwood, E.C.; Daily, G.C. Conservation planning for ecosystem services. PLoS Biol. 2006, 4, 2139–2152. [Google Scholar] [CrossRef] [Green Version]
  31. Maiorano, L.; Falcucci, A.; Garton, E.O.; Boitani, L. Contribution of the Natura 2000 Network to Biodiversity Conservation in Italy. Conserv. Biol. 2007, 21, 1433–1444. [Google Scholar] [CrossRef]
  32. Rodrigues, A.S.L.; Andelman, S.L.; Bakarr, M.I.; Boitani, L.; Brooks, T.M.; Cowling, R.M.; Fishpool, L.D.C.; da Fonseca, G.A.B.; Gaston, K.J.; Pilgrim, J.; et al. Effectiveness of the global protected area network in representing species diversity. Nature 2004, 428, 640–643. [Google Scholar] [CrossRef]
  33. Cimon-Morin, J.; Darveau, M.; Poulin, M. Fostering synergies between ecosystem services and biodiversity in conservation planning: A review. Biol. Conserv. 2013, 166, 144–154. [Google Scholar] [CrossRef]
  34. Raudsepp-Hearne, C.; Peterson, G.D.; Bennett, E.M. Ecosystem service bundles for analyzing tradeoffs in diverse landscapes. Proc. Natl. Acad. Sci. USA 2010, 107, 5242–5247. [Google Scholar] [CrossRef] [Green Version]
  35. Maes, J.; Paracchini, M.L.; Zulian, G.; Dunbar, M.B.; Alkemade, R. Synergies and trade-offs between ecosystem service supply, biodiversity, and habitat conservation status in Europe. Biol. Conserv. 2012, 155, 1–12. [Google Scholar] [CrossRef]
  36. Ziv, G.; Hassall, C.; Bartkowski, B.; Cord, A.F.; Kaim, A.; Kalamandeen, M.; Landaverde-González, P.; Melo, J.L.B.; Seppelt, R.; Shannon, C.; et al. A bird’s eye view over ecosystem services in Natura 2000 sites across Europe. Ecosyst. Serv. 2017, 30, 287–298. [Google Scholar] [CrossRef] [Green Version]
  37. Evans, D. Building the European Union’s Natura 2000 network. Nat. Conserv. 2012, 1, 11–26. [Google Scholar] [CrossRef]
  38. Orlikowska, E.H.; Roberge, J.M.; Blicharska, M.; Mikusiński, G. Gaps in ecological research on the world’s largest internationally coordinated network of protected areas: A review of Natura 2000. Biol. Conserv. 2016, 200, 216–227. [Google Scholar] [CrossRef]
  39. Kukkala, A.S.; Arponen, A.; Maiorano, L.; Moilanen, A.; Thuiller, W.; Toivonen, T.; Zupan, L.; Brotons, L.; Cabeza, M. Matches and mismatches between national and EU-wide priorities: Examining the Natura 2000 network in vertebrate species conservation. Biol. Conserv. 2016, 198, 193–201. [Google Scholar] [CrossRef]
  40. Margules, C.R.; Pressey, R.L. Systematic conservation planning. Nature 2000, 405, 243–253. [Google Scholar] [CrossRef] [PubMed]
  41. Opermanis, O.; MacSharry, B.; Aunins, A.; Sipkova, Z. Connectedness and connectivity of the Natura 2000 network of protected areas across country borders in the European Union. Biol. Conserv. 2012, 153, 227–238. [Google Scholar] [CrossRef]
  42. Opermanis, O.; MacSharry, B.; Evans, D.; Sipkova, Z. Is the connectivity of the Natura 2000 network better across internal or external administrative borders? Biol. Conserv. 2013, 166, 170–174. [Google Scholar] [CrossRef]
  43. Maiorano, L.; Amori, G.; Montemaggiori, A.; Rondinini, C.; Santini, L.; Saura, S.; Boitani, L. On how much biodiversity is covered in Europe by national protected areas and by the Natura 2000 network: Insights from terrestrial vertebrates. Conserv. Biol. 2015, 29, 986–995. [Google Scholar] [CrossRef]
  44. Müller, A.; Schneider, U.A.; Jantke, K. Is large good enough? Evaluating and improving representation of ecoregions and habitat types in the European Union’s protected area network Natura 2000. Biol. Conserv. 2018, 227, 292–300. [Google Scholar] [CrossRef]
  45. European Commission. The Economic Benefits of the Natura 2000 Network (Synthesis Report); Publications Office of the European Union: Luxembourg, 2013; Available online: https://ec.europa.eu/environment/nature/natura2000/financing/docs/ENV-12-018_LR_Final1.pdf (accessed on 1 January 2021).
  46. Joppa, L.N.; Pfaff, A. High and far: Biases in the location of protected areas. PLoS ONE 2009, 4, 8273. [Google Scholar] [CrossRef]
  47. Halada, L.; Evans, D.; Romão, C.; Petersen, J.E. Which habitats of European importance depend on agricultural practices? Biodivers. Conserv. 2011, 20, 2365–2378. [Google Scholar] [CrossRef]
  48. Tsiafouli, M.A.; Apostolopoulou, E.; Mazaris, A.D.; Kallimanis, A.S.; Drakou, E.G.; Pantis, J.D. Human activities in Natura 2000 sites: A highly diversified conservation network. Environ. Manag. 2013, 51, 1025–1033. [Google Scholar] [CrossRef]
  49. Angelstam, P.; Khaulyak, O.; Yamelynets, T.; Mozgeris, G.; Naumov, V.; Chmielewski, T.J.; Elbakidze, M.; Manton, M.; Prots, B.; Valasiuk, S. Green infrastructure development at European Union’s eastern border: Effects of road infrastructure and forest habitat loss. J. Environ. Manag. 2017, 193, 300–311. [Google Scholar] [CrossRef] [PubMed]
  50. de la Fuente, B.; Mateo-Sánchez, M.C.; Rodríguez, G.; Gastón, A.; Pérez de Ayala, R.; Colomina-Pérez, D.; Melero, M.; Saura, S. Natura 2000 sites, public forests and riparian corridors : The connectivity backbone of forest green infrastructure. Land Use Policy 2018, 75, 429–441. [Google Scholar] [CrossRef]
  51. Arcidiacono, A.; Ronchi, S.; Salata, S. Managing Multiple Ecosystem Services for Landscape Conservation: A Green Infrastructure in Lombardy Region. Procedia Eng. 2016, 161, 2297–2303. [Google Scholar] [CrossRef] [Green Version]
  52. Snäll, T.; Lehtomäki, J.; Arponen, A.; Elith, J.; Moilanen, A. Green Infrastructure Design Based on Spatial Conservation Prioritization and Modeling of Biodiversity Features and Ecosystem Services. Environ. Manag. 2016, 57, 251–256. [Google Scholar] [CrossRef] [PubMed] [Green Version]
  53. Neubert, M.; John, H. (Eds.) Manual of Transnational Green Infrastructure Assessment—Decision Support Tool; Interreg Central Europe Project MaGIC Landscapes; Output O.T1.2; Technische Universität Dresden: Dresden, Germany, 2019; Available online: https://www.interreg-central.eu/Content.Node/MaGICLandscapes-Manual-of-Transnational-GI-Assessment.pdf (accessed on 1 January 2021).
  54. Cannas, I.; Lai, S.; Leone, F.; Zoppi, C. Green infrastructure and ecological corridors: A regional study Concerning Sardinia. Sustainability 2018, 10, 1265. [Google Scholar] [CrossRef] [Green Version]
  55. Garmendia, E.; Apostolopoulou, E.; Adams, W.M.; Bormpoudakis, D. Biodiversity and Green Infrastructure in Europe: Boundary object or ecological trap? Land Use Policy 2016, 56, 315–319. [Google Scholar] [CrossRef] [Green Version]
  56. Cimon-Morin, J.; Darveau, M.; Poulin, M. Site complementarity between biodiversity and ecosystem services in conservation planning of sparsely-populated regions. Environ. Conserv. 2016, 43, 56–68. [Google Scholar] [CrossRef]
  57. Watts, M.E.; Ball, I.R.; Stewart, R.S.; Klein, C.J.; Wilson, K.; Steinback, C.; Lourival, R.; Kircher, L.; Possingham, H.P. Marxan with Zones: Software for optimal conservation based land-and sea-use zoning. Environ. Model. Softw. 2009, 24, 1513–1521. [Google Scholar] [CrossRef] [Green Version]
  58. Kukkala, A.S.; Moilanen, A. Ecosystem services and connectivity in spatial conservation prioritization. Landsc. Ecol. 2017, 32, 5–14. [Google Scholar] [CrossRef] [Green Version]
  59. European Commission. Natura 2000 in the Continental Region; Office for Official Publications of the European Communities: Luxembourg, 2009; Available online: https://ec.europa.eu/environment/nature/info/pubs/docs/biogeos/Continental.pdf (accessed on 1 April 2021).
  60. European Commission. Natura 2000 in the Continental Region; Office for Official Publications of the European Communities: Luxembourg, 2005; Available online: https://ec.europa.eu/environment/nature/info/pubs/docs/brochures/nat2000_alpine.pdf (accessed on 1 April 2021).
  61. European Environment Agency. The Biogeographical Regions of Europe 2015. Available online: http://www.eea.europa.eu/data-and-maps/data/biogeographical-regions-europe-2 (accessed on 1 April 2021).
  62. Jacobs, S.; Burkhard, B.; Van Daele, T.; Staes, J.; Schneiders, A. “The Matrix Reloaded”: A review of expert knowledge use for mapping ecosystem services. Ecol. Model. 2015, 296, 21–30. [Google Scholar] [CrossRef]
  63. Burkhard, B.; Kroll, F.; Nedkov, S.; Müller, F. Mapping ecosystem service supply, demand and budgets. Ecol. Indic. 2012, 21, 17–29. [Google Scholar] [CrossRef]
  64. Haines-Young, R.; Potschin, M. Common International Classification of Ecosystem Services (CICES) V5.1 and Guidance on the Application of the Revised Structure; Fabis Consulting Ltd.: Nottingham, UK, 2017; Available online: https://cices.eu/content/uploads/sites/8/2018/01/Guidance-V51-01012018.pdf (accessed on 1 January 2021).
  65. Burkhard, B.; Kroll, F.; Müller, F.; Windhorst, W. Landscapes’ Capacities to Provide Ecosystem Services—A Concept for Land-Cover Based Assessments. Landsc. Online 2009, 15, 1–22. [Google Scholar] [CrossRef]
  66. Müller, F. Indicating ecosystem and landscape organisation. Ecol. Indic. 2005, 5, 280–294. [Google Scholar] [CrossRef]
  67. Bontemps, S.; Defourny, P.; Van Bogaert, E.; Arino, O.; Kalogirou, V.; Ramos Perez, J.J. GLOBCOVER 2009 (Products Description and Validation Report, v.2.2); Université Catholique de Louvain: Ottignies-Louvain-la-Neuve, Belgium; European Space Agency: Paris, France, 2011; Available online: https://epic.awi.de/id/eprint/31014/16/GLOBCOVER2009_Validation_Report_2-2.pdf (accessed on 1 January 2021).
  68. Herold, M.; Hubald, R.; Di Gregorio, A. Translating and Evaluating Land Cover Legends Using the UN Land Cover Classification System (LCCS) (GOFC–GOLD Report Series Num. 43); Workshop Report at FAO; Land Cover Project Office: Jena, Germany, 2009; Available online: https://gofcgold.umd.edu/sites/default/files/docs/ReportSeries/GOLD_43.pdf (accessed on 1 January 2021).
  69. McRae, B.H. Isolation by resistance. Evolution 2006, 60, 1551–1561. [Google Scholar] [CrossRef]
  70. McRae, B.H.; Dickson, B.G.; Keitt, T.H.; Shah, V.B. Using circuit theory to model connectivity in ecology and conservation. Ecology 2008, 89, 2712–2724. [Google Scholar] [CrossRef]
  71. McRae, B.H.; Kavanagh, D.M. Linkage Mapper Connectivity Analysis Software; The Nature Conservancy: Seattle, WA, USA, 2011; Available online: http://www.circuitscape.org/linkagemapper (accessed on 1 January 2021).
  72. Zeller, K.A.; McGarigal, K.; Whiteley, A.R. Estimating landscape resistance to movement: A review. Landsc. Ecol. 2012, 27, 777–797. [Google Scholar] [CrossRef]
  73. Connor, E.F.; Courtney, A.C.; Yoder, J.M. Individuals–area relationships: The relationship between animal population density and area. Ecology 2000, 81, 734–748. [Google Scholar]
  74. Yamaura, Y.; Kawahara, T.; Iida, S.; Ozaki, K. Relative importance of the area and shape of patches to the diversity of multiple taxa. Conserv. Biol. 2008, 22, 1513–1522. [Google Scholar] [CrossRef]
  75. Hess, G.R.; Fischer, R.A. Communicating clearly about conservation corridors. Landsc. Urban Plan. 2001, 55, 195–208. [Google Scholar] [CrossRef]
  76. Samways, M.J.; Pryke, J.S. Large-scale ecological networks do work in an ecologically complex biodiversity hotspot. Ambio 2016, 45, 161–172. [Google Scholar] [CrossRef] [Green Version]
  77. Araújo, M.B.; Alagador, D.; Cabeza, M.; Nogués-Bravo, D.; Thuiller, W. Climate change threatens European conservation areas. Ecol. Lett. 2011, 14, 484–492. [Google Scholar] [CrossRef] [PubMed] [Green Version]
  78. Anděl, P.; Mináriková, T.; Andreas, M. (Eds). Ochrana Průchodnosti Krajiny pro Velké Savce; EVERNIA: Liberec, Czech Republic, 2010. [Google Scholar]
  79. Kremen, C.; Merenlender, A.M. Landscapes that work for biodiversity and people. Science 2018, 362, 6412. [Google Scholar] [CrossRef] [Green Version]
  80. Skokanová, H.; González, I.L.; Slach, T. Mapping Green Infrastructure Elements Based on Available Data, A Case Study of the Czech Republic. J. Landsc. Ecol. 2020, 13, 85–103. [Google Scholar] [CrossRef]
  81. Rieb, J.T.; Chaplin-Kramer, R.; Daily, G.C.; Armsworth, P.R.; Böhning-Gaese, K.; Bonn, A.; Cumming, G.S.; Eigenbrod, F.; Grimm, V.; Jackson, B.M.; et al. When, Where, and How Nature Matters for Ecosystem Services: Challenges for the Next Generation of Ecosystem Service Models. BioScience 2017, 67, 820–833. [Google Scholar] [CrossRef]
  82. Schulp, C.J.E.; Burkhard, B.; Maes, J.; Van Vliet, J.; Verburg, P.H. Uncertainties in ecosystem service maps: A comparison on the European scale. PLoS ONE 2014, 9, e109643. [Google Scholar] [CrossRef] [Green Version]
  83. Baguette, M.; Van Dyck, H. Landscape connectivity and animal behavior: Functional grain as a key determinant for dispersal. Landsc. Ecol. 2007, 22, 1117–1129. [Google Scholar] [CrossRef]
  84. Alagador, D.; Triviño, M.; Cerdeira, J.O.; Brás, R.; Cabeza, M.; Araújo, M.B. Linking like with like: Optimising connectivity between environmentally-similar habitats. Landsc. Ecol. 2012, 27, 291–301. [Google Scholar] [CrossRef] [Green Version]
  85. Beier, P.; Spencer, W.; Baldwin, R.F.; McRae, B.H. Toward Best Practices for Developing Regional Connectivity Maps. Conserv. Biol. 2011, 25, 879–892. [Google Scholar] [CrossRef]
  86. Brás, R.; Cerdeira, J.O.; Alagador, D.; Araújo, M.B. Linking habitats for multiple species. Environ. Model. Softw. 2013, 40, 336–339. [Google Scholar] [CrossRef]
  87. European Environmental Agency. Spatial Analysis of Green Infrastructure in Europe (EEA Technical Report No 2/2014); European Environment Agency: København, Denmark, 2014; Available online: https://www.eea.europa.eu/publications/spatial-analysis-of-green-infrastructure (accessed on 1 January 2021).
  88. Jones-Walters, L.; Gillings, S.; Groen, T.; Hennekens, S.; Noble, D.; Santini, L.; Sierdsema, H.; van Kleunen, A.; van Swaay, C.; van der Sluis, T. The “Umbrella Effect” of the Natura 2000 Network: An Assessment of Species Inside and Outside the European Natura 2000 Protected Area Network (Executive Summary No. 273A); Alterra: Wageningen-UR, The Netherlands, 2016. [Google Scholar]
  89. Bolliger, J.; Silbernagel, J. Contribution of connectivity assessments to green infrastructure (GI). ISPRS Int. J. Geo-Inf. 2020, 9, 212. [Google Scholar] [CrossRef] [Green Version]
  90. Luque, S.; Saura, S.; Fortin, M.J. Landscape connectivity analysis for conservation: Insights from combining new methods with ecological and genetic data. Landsc. Ecol. 2012, 27, 153–157. [Google Scholar] [CrossRef]
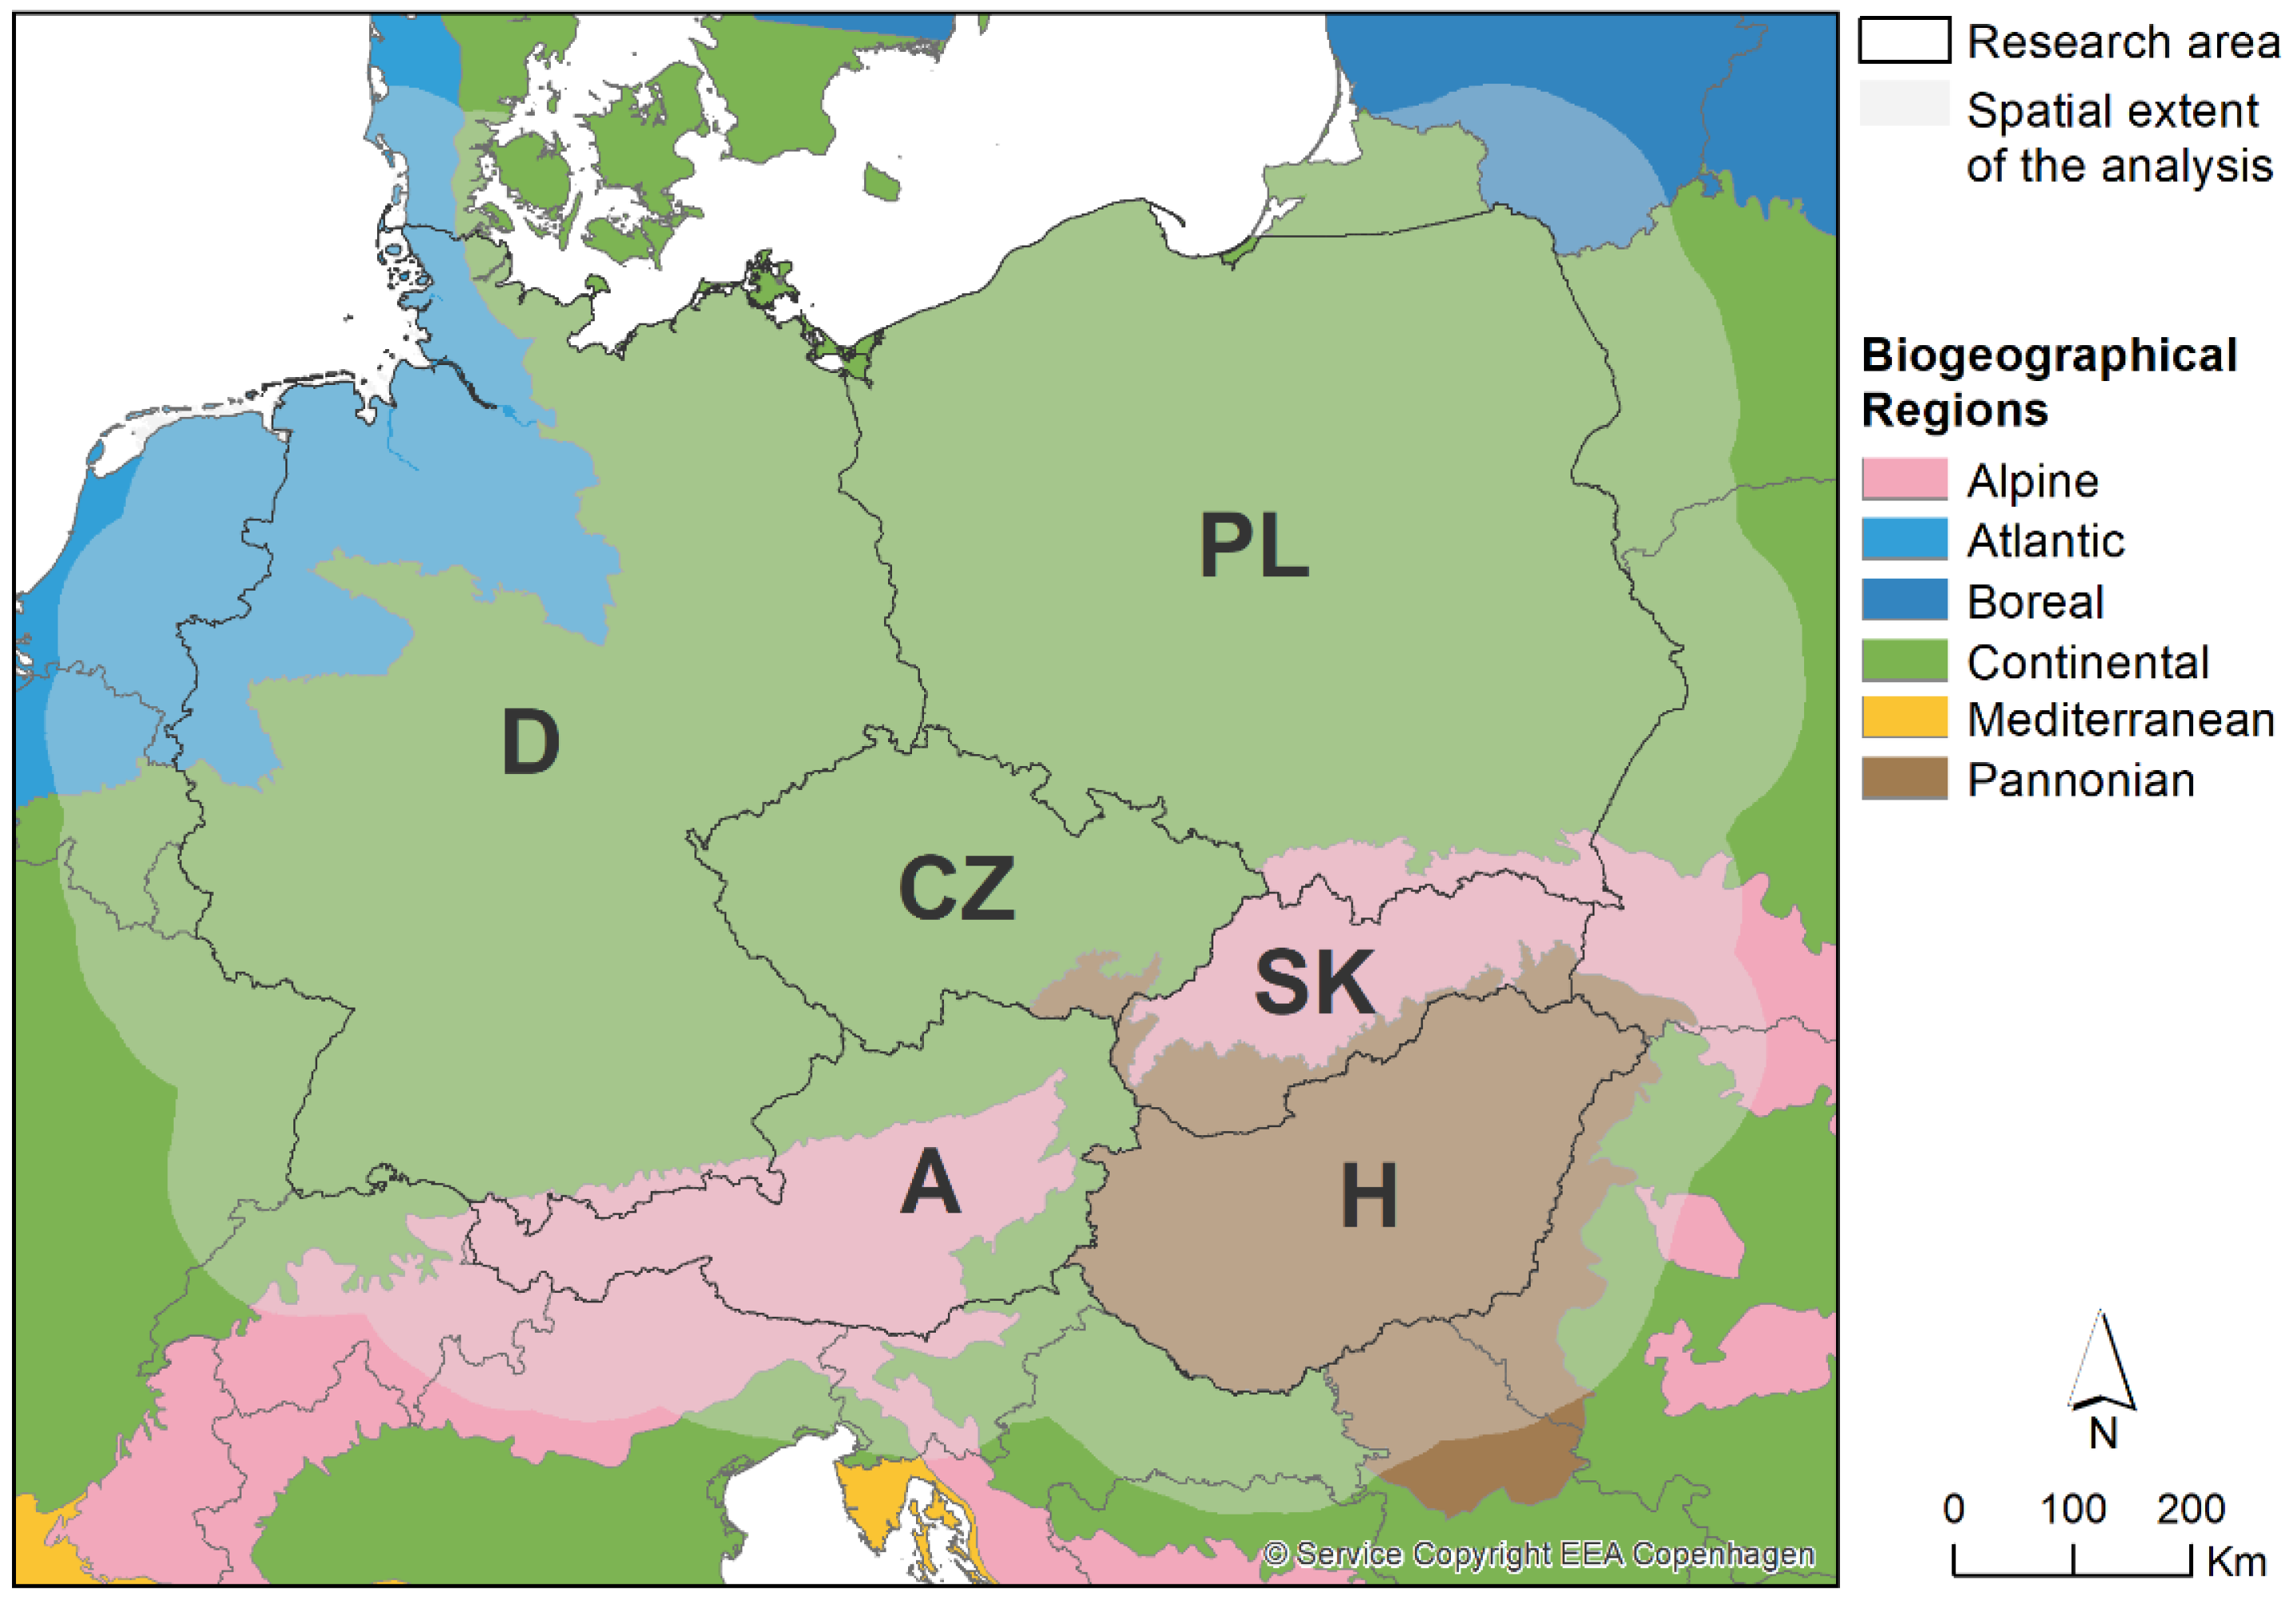
Figure 1. Research area and spatial extent of analysis (light colours). Source of Biogeographical Regions layer: ArcGIS Map Service, © Service Copyright EEA Copenhagen [61].
Land 10 00592 g001
Figure 2. Weighted capacity to supply maintenance and regulating ES in regular grid with cell size 1 km2.
Land 10 00592 g002
Figure 3. Proposed green infrastructure network, delineated as a set of corridors between core areas (N2k sites).
Land 10 00592 g003
Figure 4. Cumulative area of N2k network in countries with respect to area of individual N2k sites.
Land 10 00592 g004
Figure 5. Proportion of national N2k network area that (i) was predefined core areas and their adjacent sites (yellow); (ii) was connected as preferentially selected land under corridors (light green); (iii) was adjacent to sites connected by the corridors (dark green); (iv) remained disconnected by GI (red).
Land 10 00592 g005
Figure 6. Proportion of the 16 most represented CLC classes under components of the GI network. Core areas are dark colour and ecological corridors light colour.
Land 10 00592 g006
Figure 7. Distributions of capacity to supply ES in 10% of least resistant cells under the GI corridors in the research area. Bars divided to quartiles indicate the distribution of supplies of respective ES in cells, where the minimum value is 0% and maximum is 100%. The thin grey line indicates the mean value. The relative scale allows comparison of distribution of values of each ES with summarized supplies for indicators of maintenance and regulating ES.
Land 10 00592 g007
Table 1. Overview of indicators and services summarized as capacity of ecosystems to supply regulating and maintenance ES. See source studies of Burkhard et al. [63,65] for more detailed explanation of the services and Müller [66] for derivation of indicators of ecological integrity.
Maintenance Services
(Ecological Integrity)
Regulating Services
abiotic heterogeneitylocal climate regulation
biodiversityglobal climate regulation
biotic waterflowsflood protection
metabolic efficiencyground water recharge
exergy capture (radiation)air quality regulation
reduction of nutrient losserosion regulation
storage capacitynutrient regulation
water purification
pollination
Publisher’s Note: MDPI stays neutral with regard to jurisdictional claims in published maps and institutional affiliations.