
Spatiotemporal Differentiation of Territorial Space Development Intensity and Its Habitat Quality Response in Northeast China


Abstract
1. Introduction
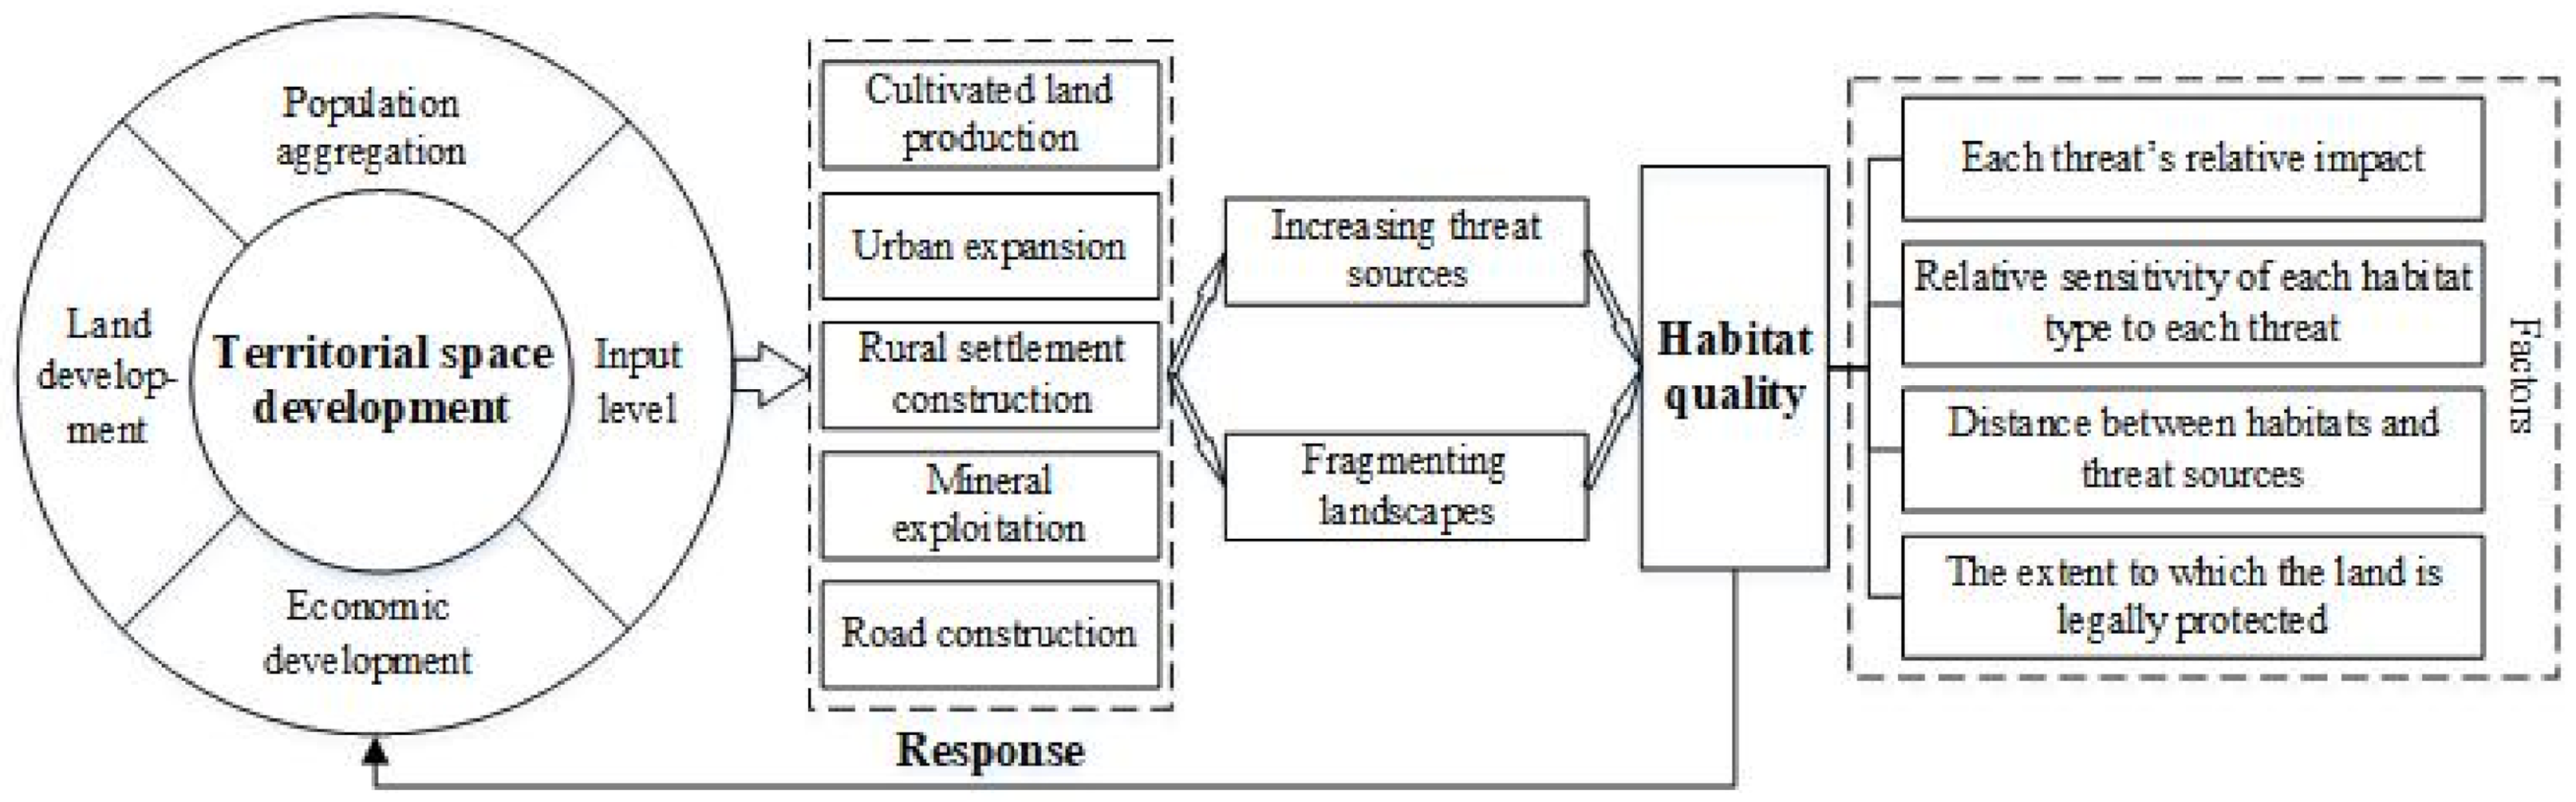
2. Background and Theoretical Framework
3. Materials and Methods
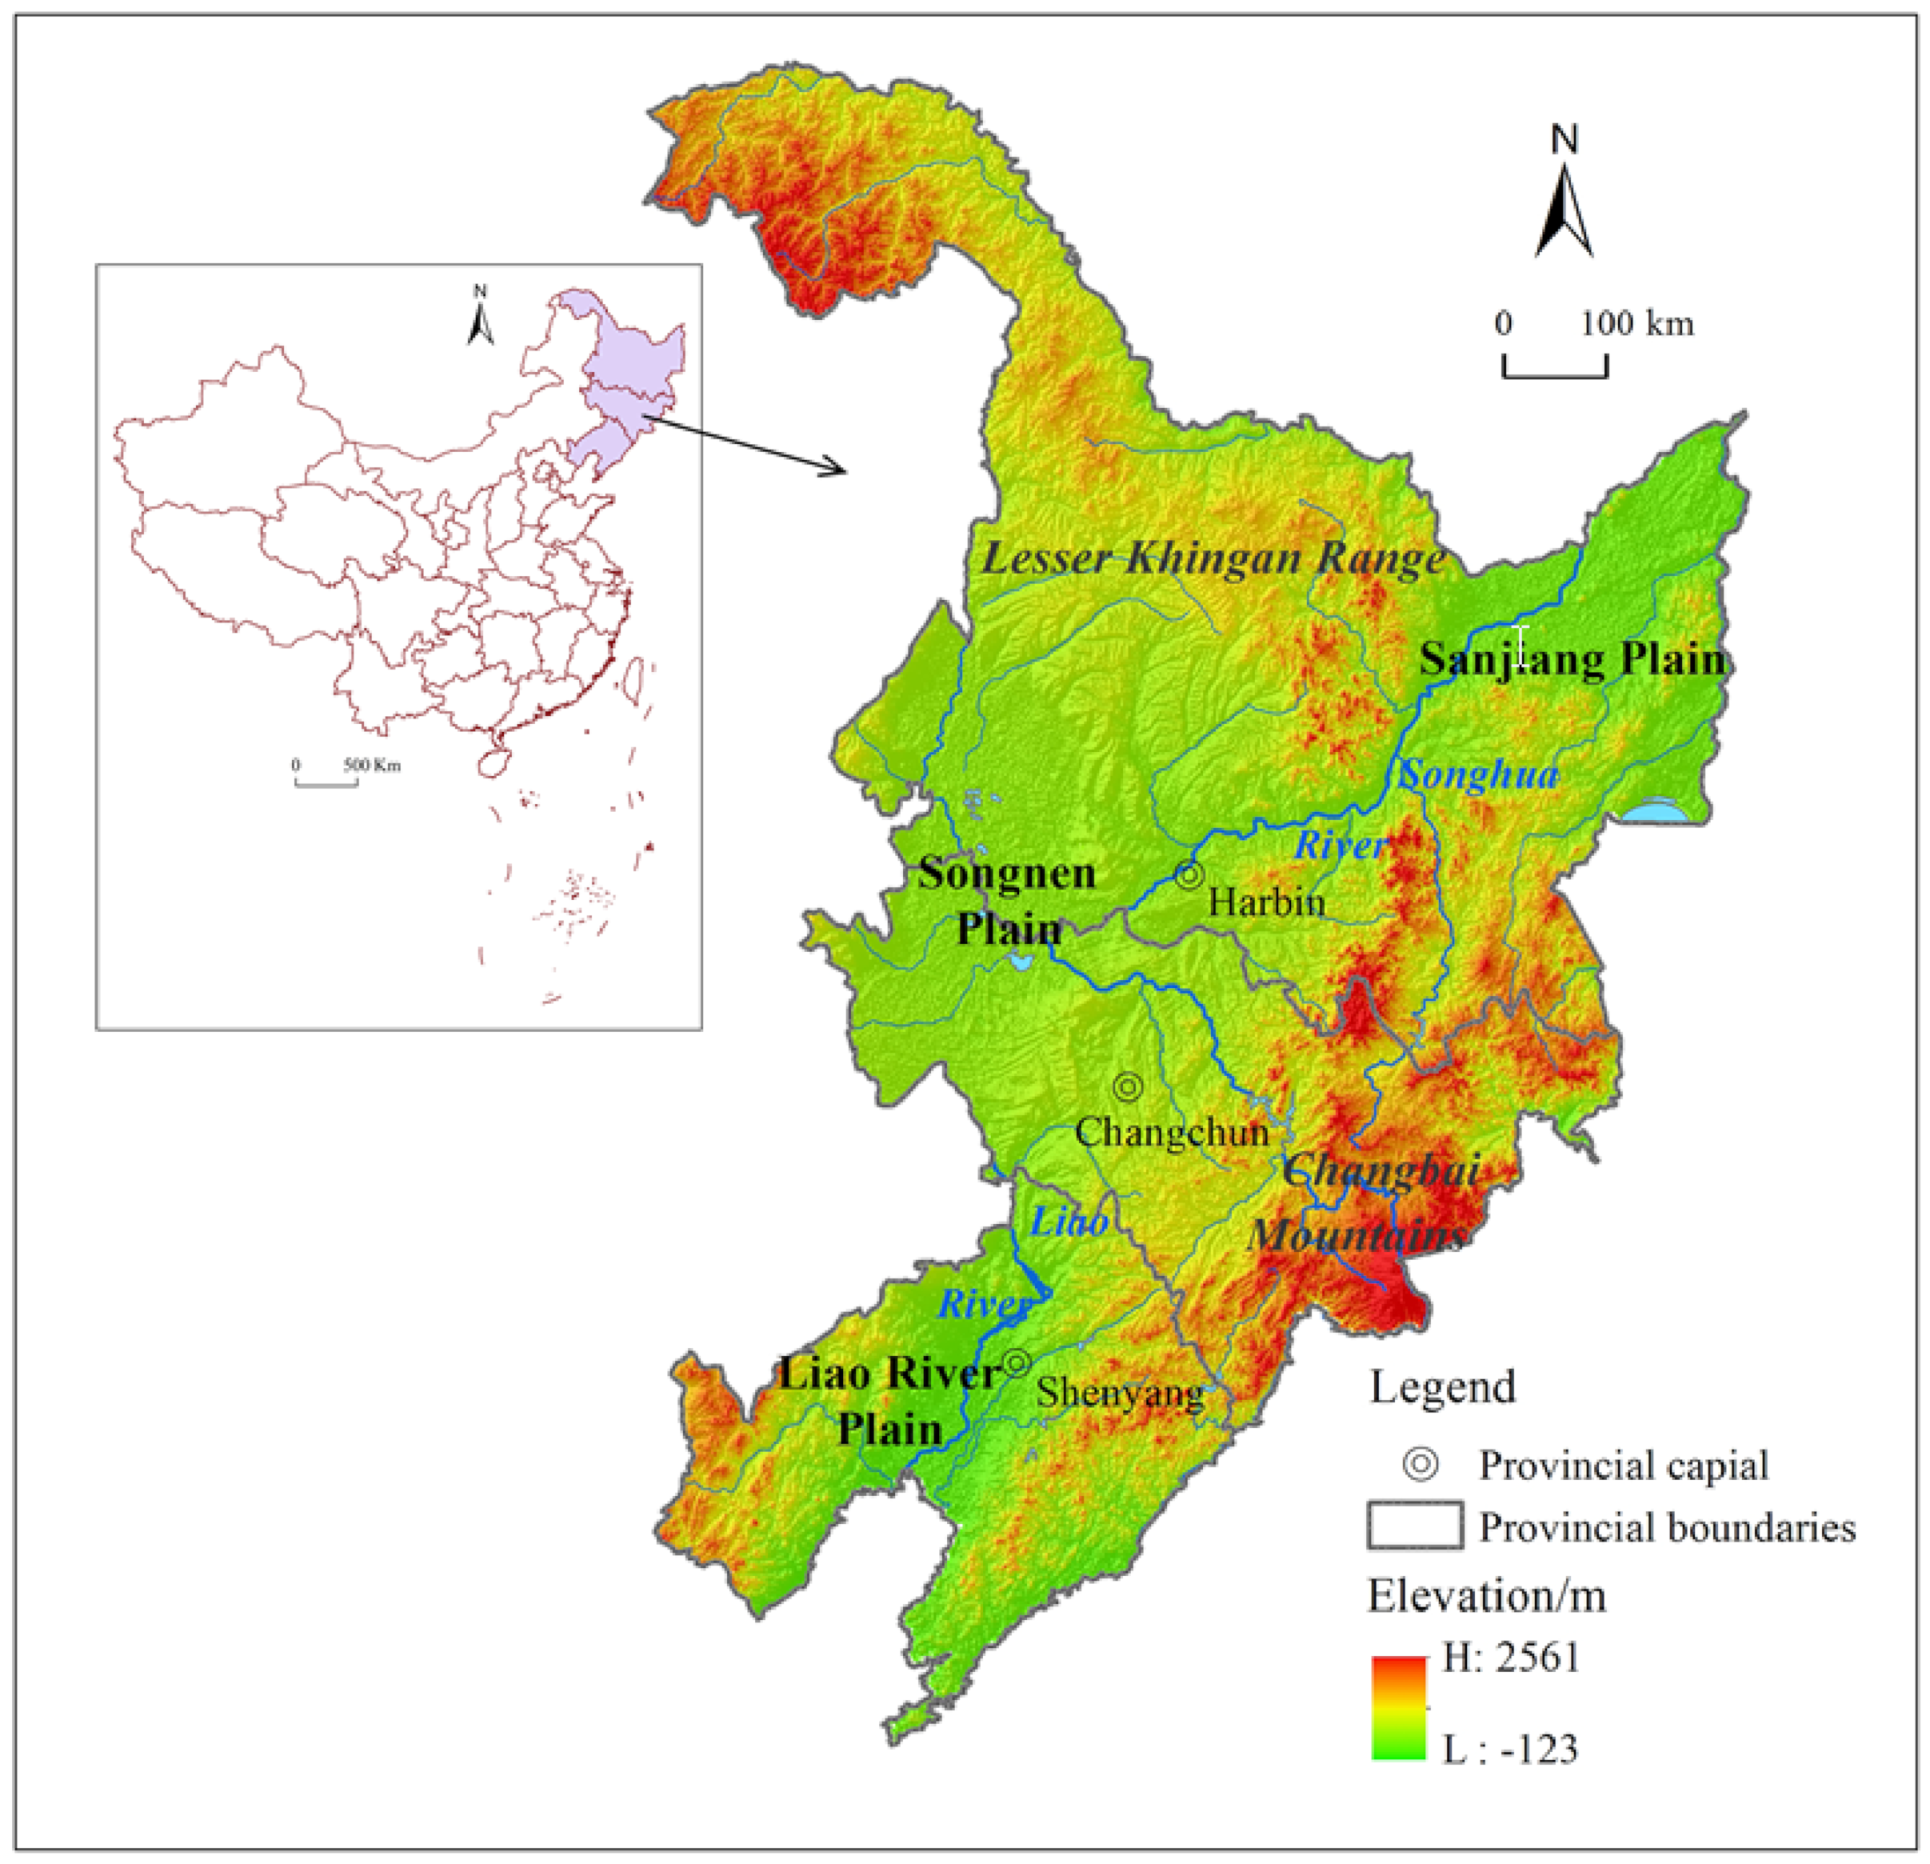
3.1. Area of Study
3.2. Data Sources and Processing
3.3. Methods
3.3.1. TSDI Evaluation
3.3.2. HQ Assessment
3.3.3. Local Hot Spot Analysis
3.3.4. Bivariate Spatial Autocorrelation Analysis
4. Results
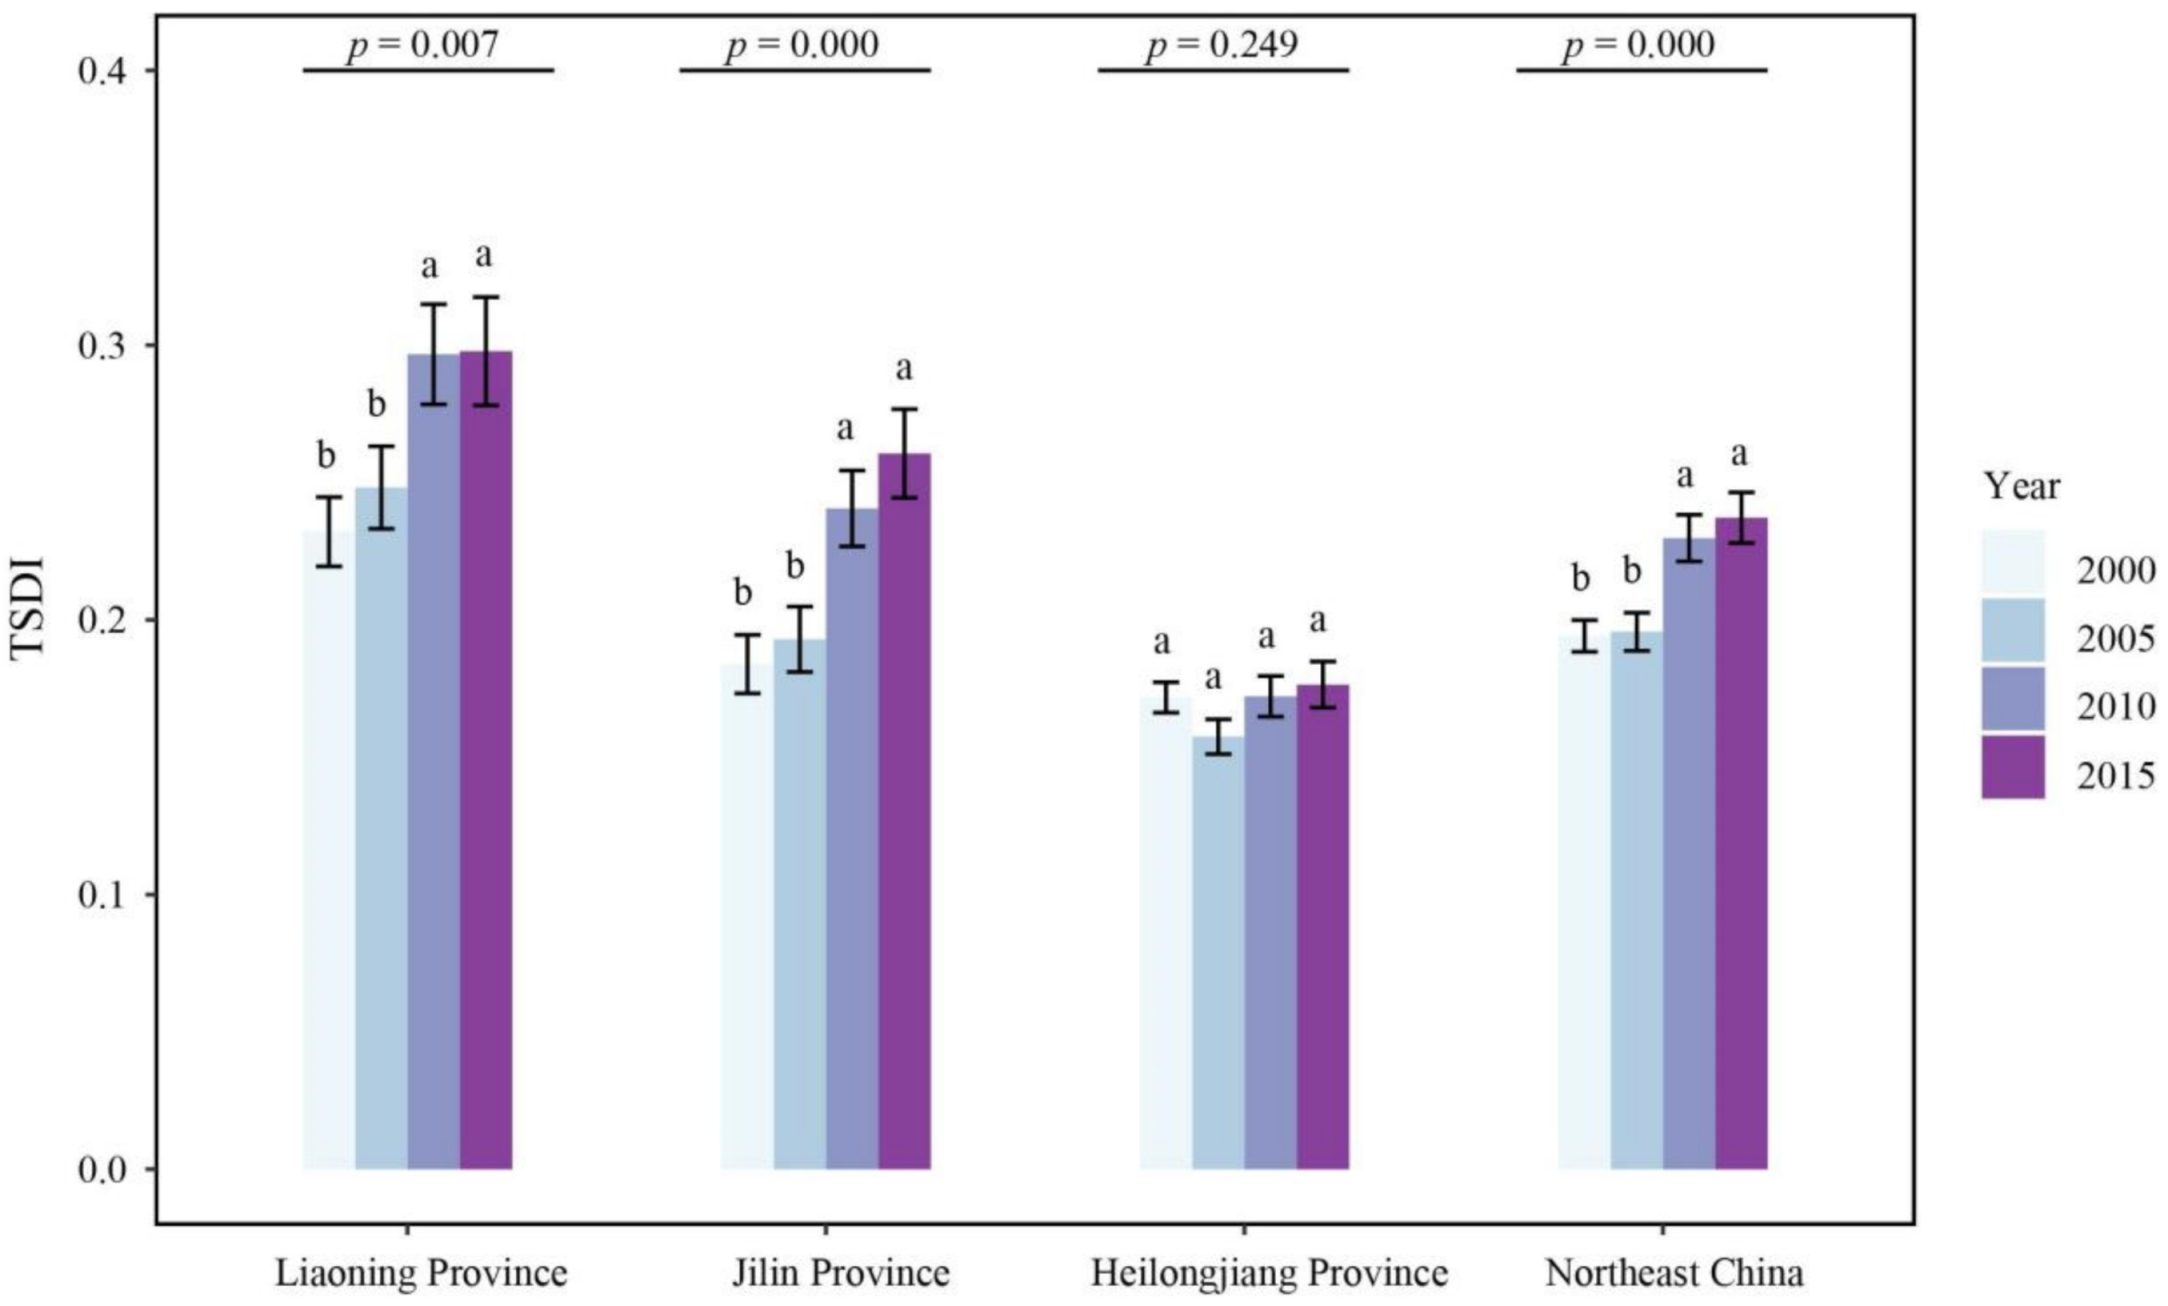
4.1. TSDI
4.2. HQ
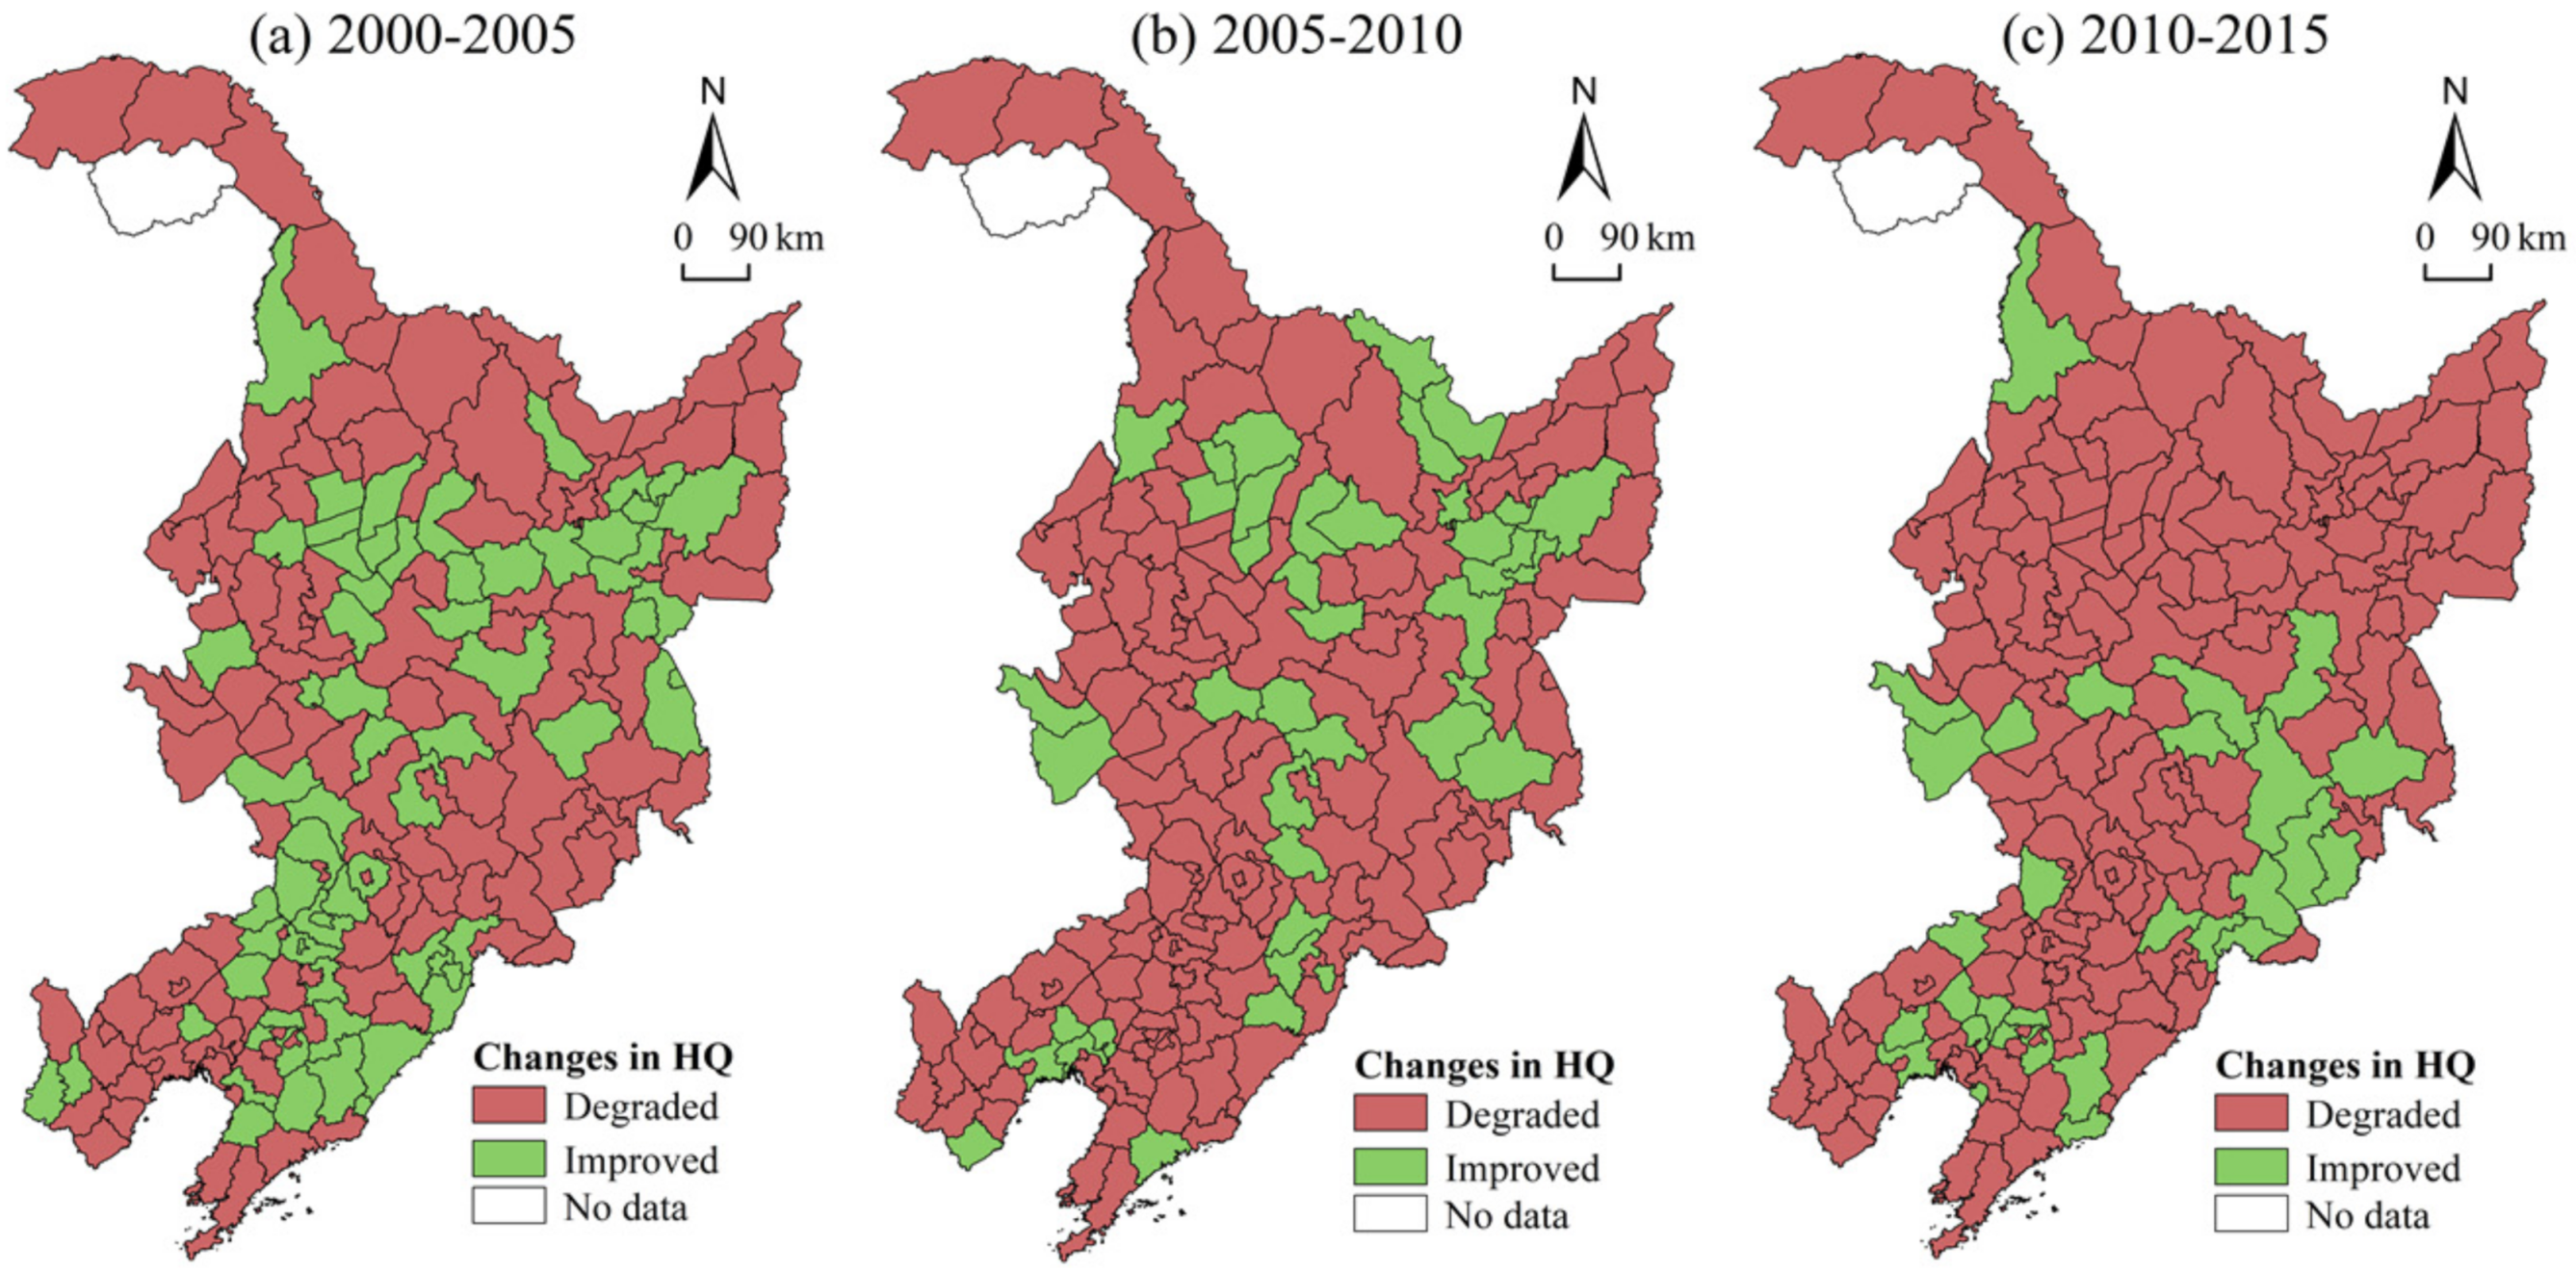
4.3. HQ Responses to TSDI
5. Discussion
5.1. Territorial Space Development Is Closely Combined with Ecology, with Implications for the Spatiotemporal Heterogeneity of the HQ Response
5.2. Policy Implications for Territorial Space Development in Northeast China
5.3. Limitations and Prospects for Further Study
6. Conclusions
Author Contributions
Funding
Institutional Review Board Statement
Informed Consent Statement
Data Availability Statement
Acknowledgments
Conflicts of Interest
References
- You, H.; Yang, X. Urban expansion in 30 megacities of China: Categorizing the driving force profiles to inform the urbanization policy. Land Use Policy 2017, 68, 531–551. [Google Scholar] [CrossRef]
- Xiong, N.; Wong, S.W.; Ren, Y.; Shen, L. Regional Disparity in Urbanizing China: Empirical Study of Unbalanced Development Phenomenon of Towns in Southwest China. J. Urban Plan. Dev. 2020, 146, 05020013. [Google Scholar] [CrossRef]
- Fan, J.; Wang, Y.; Wang, C.; Chen, T.; Jin, F.; Zhang, W.; Li, L.; Xu, Y.; Dai, E.; Tao, A.; et al. Reshaping the Sustainable Geographical Pattern: A Major Function Zoning Model and Its Applications in China. Earths Future 2019, 7, 25–42. [Google Scholar] [CrossRef]
- Liu, Y.; Li, J.; Yang, Y. Strategic adjustment of land use policy under the economic transformation. Land Use Policy 2018, 74, 5–14. [Google Scholar] [CrossRef]
- Kong, X.; Jiang, X.; Liu, Y.; Jin, Z. Spatiotemporal Coupling Between Territorial Space Development Intensity and Resource Environmental Carrying Capacity and Its Planning Implications: A Case Study of Jiangsu Province. China Land Sci. 2020, 34, 10–17. [Google Scholar]
- Dadashpoor, H.; Azizi, P.; Moghadasi, M. Land use change, urbanization, and change in landscape pattern in a metropolitan area. Sci. Total Environ. 2019, 655, 707–719. [Google Scholar] [CrossRef]
- Sallustio, L.; De Toni, A.; Strollo, A.; Di Febbraro, M.; Gissi, E.; Casella, L.; Geneletti, D.; Munafo, M.; Vizzarri, M.; Marchetti, M. Assessing habitat quality in relation to the spatial distribution of protected areas in Italy. J. Environ. Manag. 2017, 201, 129–137. [Google Scholar] [CrossRef]
- Bai, L.; Xiu, C.; Feng, X.; Liu, D. Influence of urbanization on regional habitat quality:a case study of Changchun City. Habitat Int. 2019, 93, 102042. [Google Scholar] [CrossRef]
- Huang, X.; Huang, X.; Liu, M.; Wang, B.; Zhao, Y. Spatial-temporal Dynamics and Driving Forces of Land Development Intensity in the Western China from 2000 to 2015. Chin. Geogr. Sci. 2020, 30, 16–29. [Google Scholar] [CrossRef]
- Wellmann, T.; Haase, D.; Knapp, S.; Salbach, C.; Selsam, P.; Lausch, A. Urban land use intensity assessment: The potential of spatio-temporal spectral traits with remote sensing. Ecol. Indic. 2018, 85, 190–203. [Google Scholar] [CrossRef]
- Zhou, K.; Fan, J.; Sheng, K. Research on methods and approaches of spatial governances. Geogr. Res. 2019, 38, 2527–2540. [Google Scholar]
- Erb, K.H.; Haberl, H.; Jepsen, M.R.; Kuemmerle, T.; Lindner, M.; Muller, D.; Verburg, P.H.; Reenberg, A. A conceptual framework for analysing and measuring land-use intensity. Curr. Opin. Environ. Sustain. 2013, 5, 464–470. [Google Scholar] [CrossRef]
- Felipe-Lucia, M.R.; Soliveres, S.; Penone, C.; Fischer, M.; Ammer, C.; Boch, S.; Boeddinghaus, R.S.; Bonkowski, M.; Buscot, F.; Fiore-Donno, A.M.; et al. Land-use intensity alters networks between biodiversity, ecosystem functions, and services. Proc. Natl. Acad. Sci. USA 2020, 117, 28140–28149. [Google Scholar] [CrossRef]
- Xu, F.; Wang, Z.; Chi, G.; Zhang, Z. The impacts of population and agglomeration development on land use intensity: New evidence behind urbanization in China. Land Use Policy 2020, 95, 104639. [Google Scholar] [CrossRef]
- Gong, J.; Chen, W.; Liu, Y.; Wang, J. The intensity change of urban development land: Implications for the city master plan of Guangzhou, China. Land Use Policy 2014, 40, 91–100. [Google Scholar] [CrossRef]
- Di, X.; Hou, X.; Wang, Y.; Wu, L. Spatial-temporal Characteristics of Land Use Intensity of Coastal Zone in China During 2000–2010. Chin. Geogr. Sci. 2015, 25, 51–61. [Google Scholar] [CrossRef]
- Ruth, D.; Frédéric, A.; Sandra, B.; Martin, H. Earth observations for estimating greenhouse gas emissions from deforestation in developing countries. Environ. Sci. Policy 2007, 10, 385–394. [Google Scholar]
- Zurqani, H.A.; Post, C.J.; Mikhailova, E.A.; Allen, J.S. Mapping Urbanization Trends in a Forested Landscape Using Google Earth Engine. Remote Sens. Earth Syst. Sci. 2019, 2, 173–182. [Google Scholar] [CrossRef]
- Ferdous, N.; Bhat, C.R. A spatial panel ordered-response model with application to the analysis of urban land-use development intensity patterns. J. Geogr. Syst. 2013, 15, 1–29. [Google Scholar] [CrossRef]
- Wang, X.; Wang, S.; Song, Y.; Hu, H. Space Recognition and Influence Mechanism of Urban Construction Land Evolution of Changchun City. Sci. Geogr. Sin. 2015, 35, 873–881. [Google Scholar]
- Azhdari, A.; Sasani, M.A.; Soltani, A. Exploring the relationship between spatial driving forces of urban expansion and socioeconomic segregation: The case of Shiraz. Habitat Int. 2018, 81, 33–44. [Google Scholar] [CrossRef]
- Liu, Y.; Yu, H.; Liu, D.; Zhu, L. Spatial differentiation mechanisms of the pattern evolution of construction land development intensity in Northeast China. Acta Geogr. Sin. 2018, 73, 818–831. [Google Scholar]
- Brown, K.; Turner, R.K.; Hameed, H.; Bateman, I. Environmental carrying capacity and tourism development in the Maldives and Nepal. Environ. Conserv. 1997, 24, 316–325. [Google Scholar] [CrossRef]
- Xie, X.T.; Li, X.S.; He, W.K. A Land Space Development Zoning Method Based on Resource-Environmental Carrying Capacity: A Case Study of Henan, China. Int. J. Environ. Res. Public Health 2020, 17, 900. [Google Scholar] [CrossRef]
- Yan, H.; Liu, F.; Liu, J.; Xiao, X.; Qin, Y. Status of land use intensity in China and its impacts on land carrying capacity. J. Geogr. Sci. 2017, 27, 387–402. [Google Scholar] [CrossRef]
- van Diggelen, R.; Sijtsma, F.J.; Strijker, D.; van den Burg, J. Relating land-use intensity and biodiversity at the regional scale. Basic Appl. Ecol. 2005, 6, 145–159. [Google Scholar] [CrossRef]
- Van Meerbeek, K.; Helsen, K.; Hermy, M. Impact of land-use intensity on the conservation of functional and phylogenetic diversity in temperate semi-natural plant communities. Biodivers. Conserv. 2014, 23, 2259–2272. [Google Scholar] [CrossRef]
- Xu, Y.; Tang, H.; Wang, B.; Chen, J. Effects of land-use intensity on ecosystem services and human well-being: A case study in Huailai County, China. Environ. Earth Sci. 2016, 75, 416. [Google Scholar] [CrossRef]
- Lopes, L.F.G.; Bento, J.; Cristovao, A.; Baptista, F.O. Exploring the effect of land use on ecosystem services: The distributive issues. Land Use Policy 2015, 45, 141–149. [Google Scholar] [CrossRef]
- Lyu, R.; Zhang, J.; Xu, M.; Li, J. Impacts of urbanization on ecosystem services and their temporal relations: A case study in Northern Ningxia, China. Land Use Policy 2018, 77, 163–173. [Google Scholar] [CrossRef]
- Moreira, M.; Fonseca, C.; Vergilio, M.; Calado, H.; Gil, A. Spatial assessment assessment of habitat conservation status in a Macaronesian island based on the InVEST model: A case study of Pico Island (Azores, Portugal). Land Use Policy 2018, 78, 637–649. [Google Scholar] [CrossRef]
- Upadhaya, S.; Dwivedi, P. Conversion of of forestlands to blueberries: Assessing implications for habitat quality in Alabaha river watershed in Southeastern Georgia, United States. Land Use Policy 2019, 89, 104229. [Google Scholar] [CrossRef]
- Zhu, C.; Zhang, X.; Zhou, M.; He, S.; Gan, M.; Yang, L.; Wang, K. Impacts of urbanization and landscape pattern on habitat quality using OLS and GWR models in Hangzhou, China. Ecol. Indic. 2020, 117, 106654. [Google Scholar] [CrossRef]
- Sharma, R.; Nehren, U.; Rahman, S.A.; Meyer, M.; Rimal, B.; Seta, G.A.; Baral, H. Modeling Land Use and Land Cover Changes and Their Effects on Biodiversity in Central Kalimantan, Indonesia. Land 2018, 7, 57. [Google Scholar] [CrossRef]
- Dai, Y.; Li, J.; Yang, J. Spatiotemporal responses of habitat quality to urban sprawl in the Changsha metropolitan area. Prog. Geogr. 2018, 37, 1340–1351. [Google Scholar]
- Zhou, X.; Xiao, L.; Lu, X.; Sun, D. Impact of road transportation development on habitat quality in economically developed areas: A case study of Jiangsu Province, China. Growth Chang. 2020, 51, 852–871. [Google Scholar] [CrossRef]
- Whittington, J.; Low, P.; Hunt, B. Temporal road closures improve habitat quality for wildlife. Sci. Rep. 2019, 9, 3772. [Google Scholar] [CrossRef]
- Kija, H.K.; Ogutu, J.O.; Mangewa, L.J.; Bukombe, J.; Verones, F.; Graae, B.J.; Kideghesho, J.R.; Said, M.Y.; Nzunda, E.F. Spatio-Temporal Changes in Wildlife Habitat Quality in the Greater Serengeti Ecosystem. Sustainability 2020, 12, 2440. [Google Scholar] [CrossRef]
- Deng, Y.; Qi, W.; Fu, B.; Wang, K. Geographical transformations of urban sprawl: Exploring the spatial heterogeneity across cities in China 1992–2015. Cities 2020, 105, 102415. [Google Scholar] [CrossRef]
- Wang, J.; Du, D. The Evolution of Economic Development Level in Northeast China and Its Spatial Differentiation Mode Scince 2003. Sci. Geogr. Sin. 2016, 36, 1320–1328. [Google Scholar]
- Wang, J.; He, T.; Lin, Y. Changes in ecological, agricultural, and urban land space in 1984-2012 in China: Land policies and regional social-economical drivers. Habitat Int. 2018, 71, 1–13. [Google Scholar] [CrossRef]
- Xia, H.; Zhang, W.; Wang, H.; Peng, H.; Zhang, Z.; Ke, Q.; Bu, S. Spatial -temporal patterns and characteristics of ecological function between 2009 and 2015 in China. Ecol. Indic. 2020, 116, 106478. [Google Scholar] [CrossRef]
- Liu, Y.; Zhou, Y. Territory spatial planning and national governance system in China. Land Use Policy 2021, 102, 105288. [Google Scholar] [CrossRef]
- Hu, R. Planning for growth: Urban and regional planning in China. Plan. Perspect. 2016, 31, 152–155. [Google Scholar] [CrossRef]
- Hu, Y.; Roo, G.D.; Lu, B. ‘Communicative turn’ in Chinese spatial planning? Exploring possibilities in Chinese contexts. Cities 2013, 35, 42–50. [Google Scholar] [CrossRef]
- Kong, W.; Liu, H.; Fan, J. The Features and Causes of Spatial Planning Conflicts in China: Taking Urban Planning and Land-Use Planning as Examples. Chin. J. Urban Environ. Stud. 2019, 7, 18. [Google Scholar] [CrossRef]
- Fan, J.; Sun, W.; Zhou, K.; Chen, D. Major Function Oriented Zone: New method of spatial regulation for reshaping regional development pattern in China. Chin. Geogr. Sci. 2012, 22, 196–209. [Google Scholar] [CrossRef]
- Twisa, S.; Buchroithner, M.F. Land-Use and Land-Cover (LULC) Change Detection in Wami River Basin, Tanzania. Land 2019, 8, 136. [Google Scholar] [CrossRef]
- Wang, Z. Land Spatial Development Based on Carrying Capacity, Land Development Potential, and Efficiency of Urban Agglomerations in China. Sustainability 2018, 10, 4701. [Google Scholar] [CrossRef]
- Wu, C.F.; Lin, Y.P.; Chiang, L.C.; Huang, T. Assessing highway’s impacts on landscape patterns and ecosystem services: A case study in Puli Township, Taiwan. Landsc. Urban Plan. 2014, 128, 60–71. [Google Scholar] [CrossRef]
- Xu, L.; Chen, S.S.; Xu, Y.; Li, G.; Su, W. Impacts of Land-Use Change on Habitat Quality during 1985–2015 in the Taihu Lake Basin. Sustainability 2019, 11, 3513. [Google Scholar] [CrossRef]
- Yi, H.; Guneralp, B.; Kreuter, U.P.; Guneralp, I.; Filippi, A.M. Spatial and temporal changes in biodiversity and ecosystem services in the San Antonio River Basin, Texas, from 1984 to 2010. Sci. Total Environ. 2018, 619, 1259–1271. [Google Scholar] [CrossRef]
- Tian, J.; Wang, B.; Zhang, C.; Li, W.; Wang, S. Mechanism of regional land use transition in underdeveloped areas of China: A case study of northeast China. Land Use Policy 2020, 94, 104538. [Google Scholar] [CrossRef]
- Nan, L.; Zhao, J.; Lyu, M. Exploration of Land Development Intensity Index of Port Container Logistics Park Based on Quantitative Algorithm and Pent Analysis Method. Pol. Marit. Res. 2018, 25, 61–67. [Google Scholar]
- Tang, C.; Sun, W. Comprehensive Evaluation of Land Spatial Development Suitability of the Yangtze River Basin. Acta Geogr. Sin. 2012, 67, 1587–1598. [Google Scholar]
- Zhang, R.; Jiang, G.; Zhang, Q. Does urbanization always lead to rural hollowing? Assessing the spatio-temporal variations in this relationship at the county level in China 2000–2015. J. Clean. Prod. 2019, 220, 9–22. [Google Scholar] [CrossRef]
- Koschke, L.; Fuerst, C.; Frank, S.; Makeschin, F. A multi-criteria approach for an integrated land-cover-based assessment of ecosystem services provision to support landscape planning. Ecol. Indic. 2012, 21, 54–66. [Google Scholar] [CrossRef]
- Walters, D.; Kotze, D.C.; Rebelo, A.; Pretorius, L.; Job, N.; Lagesse, J.V.; Riddell, E.; Cowden, C. Validation of a rapid wetland ecosystem services assessment technique using the Delphi method. Ecolo. Indic. 2021, 125, 107511. [Google Scholar]
- Ludovisi, A. Effectiveness of entropy-based functions in the analysis of ecosystem state and development. Ecol. Indic. 2014, 36, 617–623. [Google Scholar] [CrossRef]
- Zhang, M.H.; Xu, Q.S.; Massart, D.L. Averaged and weighted average partial least squares. Anal. Chim. Acta 2004, 504, 279–289. [Google Scholar] [CrossRef]
- Terrado, M.; Sabater, S.; Chaplin-Kramer, B.; Mandle, L.; Ziv, G.; Acuna, V. Model development for the assessment of terrestrial and aquatic habitat quality in conservation planning. Sci. Total Environ. 2016, 540, 63–70. [Google Scholar] [CrossRef] [PubMed]
- Trisurat, Y.; Shirakawa, H.; Johnston, J.M. Land-Use/Land-Cover Change from Socio-Economic Drivers and Their Impact on Biodiversity in Nan Province, Thailand. Sustainability 2019, 11, 649. [Google Scholar] [CrossRef] [PubMed]
- Ureta, J.C.; Clay, L.; Motallebi, M.; Ureta, J. Quantifying the Landscape’s Ecological Benefits-An Analysis of the Effect of Land Cover Change on Ecosystem Services. Land 2021, 10, 21. [Google Scholar] [CrossRef]
- Aneseyee, A.B.; Noszczyk, T.; Soromessa, T.; Elias, E. The InVEST Habitat Quality Model Associated with Land Use/Cover Changes: A Qualitative Case Study of the Winike Watershed in the Omo-Gibe Basin, Southwest Ethiopia. Remote Sens. 2020, 12, 1103. [Google Scholar] [CrossRef]
- Nelson, E.; Mendoza, G.; Regetz, J.; Polasky, S.; Tallis, H.; Cameron, D.R.; Chan, K.M.A.; Daily, G.C.; Goldstein, J.; Kareiva, P.M.; et al. Modeling multiple ecosystem services, biodiversity conservation, commodity production, and tradeoffs at landscape scales. Front. Ecol. Environ. 2009, 7, 4–11. [Google Scholar] [CrossRef]
- Yohannes, H.; Soromessa, T.; Argaw, M.; Dewan, A. Spatio-temporal changes in habitat quality and linkage with landscape characteristics in the Beressa watershed, Blue Nile basin of Ethiopian highlands. J. Environ. Manag. 2021, 281, 111885. [Google Scholar] [CrossRef]
- Zhang, X.; Zhou, J.; Li, G.; Chen, C.; Li, M.; Luo, J. Spatial pattern reconstruction of regional habitat quality based on the simulation of land use changes from 1975 to 2010. J. Geogr. Sci. 2020, 30, 601–620. [Google Scholar] [CrossRef]
- Hou, Y.; Li, B.; Mueller, F.; Chen, W. Ecosystem services of human-dominated watersheds and land use influences: A case study from the Dianchi Lake watershed in China. Environ. Monit. Assess. 2016, 188, 652. [Google Scholar] [CrossRef]
- Getis, A.; Ord, J.K. The Analysis of Spatial Association by Use of Distance Statistics. Geogr. Anal. 1992, 24, 189–206. [Google Scholar] [CrossRef]
- Ord, J.K.; Getis, A. Local spatial autocorrelation statistics: Distributional issues and an application. Geogr. Anal. 1995, 27, 286–306. [Google Scholar] [CrossRef]
- Shaker, R.R.; Altman, Y.; Deng, C.; Vaz, E.; Forsythe, K.W. Investigating urban heat island through spatial analysis of New York City streetscapes. J. Clean. Prod. 2019, 233, 972–992. [Google Scholar] [CrossRef]
- Lorilla, R.S.; Kalogirou, S.; Poirazidis, K.; Kefalas, G. Identifying spatial mismatches between the supply and demand of ecosystem services to achieve a sustainable management regime in the Ionian Islands (Western Greece). Land Use Policy 2019, 88, 104171. [Google Scholar] [CrossRef]
- Tran, D.X.; Pla, F.; Latorre-Carmona, P.; Myint, S.W.; Gaetano, M.; Kieu, H.V. Characterizing the relationship between land use land cover change and land surface temperature. Isprs-J. Photogramm. Remote Sens. 2017, 124, 119–132. [Google Scholar] [CrossRef]
- Boori, M.S.; Choudhary, K.; Paringer, R.; Kupriyanov, A. Spatiotemporal ecological vulnerability analysis with statistical correlation based on satellite remote sensing in Samara, Russia. J. Environ. Manag. 2021, 285, 112138. [Google Scholar] [CrossRef]
- Choi, H.S.; Sohn, S.Y.; Yeom, H.J. Technological composition of US metropolitan statistical areas with high-impact patents. Technol. Forecast. Soc. Chang. 2018, 134, 72–83. [Google Scholar] [CrossRef]
- Aguiar, L.L.; Manzato, G.G.; Rodrigues da Silv, A.N. Combining travel and population data through a bivariate spatial analysis to define Functional Urban Regions. J. Transp. Geogr. 2020, 82, 102565. [Google Scholar] [CrossRef]
- Anselin, L. Local indicators of spatial association—LISA. Geogr. Anal. 1995, 27, 93–115. [Google Scholar] [CrossRef]
- Di Giacinto, V.; Pagnini, M. Local and global agglomeration patterns: Two econometrics-based indicators. Reg. Sci. Urban Econ. 2011, 41, 266–280. [Google Scholar] [CrossRef]
- Chen, L.; Wei, Q.; Fu, Q.; Feng, D. Spatiotemporal Evolution Analysis of Habitat Quality under High-Speed Urbanization: A Case Study of Urban Core Area of China Lin-Gang Free Trade Zone (2002–2019). Land 2021, 10, 167. [Google Scholar] [CrossRef]
- Gaither, C.J.; Poudyal, N.C.; Goodrick, S.; Bowker, J.M.; Malone, S.; Gan, J. Wildland fire risk and social vulnerability in the Southeastern United States: An exploratory spatial data analysis approach. For. Policy Econ. 2011, 13, 24–36. [Google Scholar] [CrossRef]
- Chen, B.; Wu, C.; Huang, X.; Yang, X. Examining the Relationship between Urban Land Expansion and Economic Linkage Using Coupling Analysis: A Case Study of the Yangtze River Economic Belt, China. Sustainability 2020, 12, 1227. [Google Scholar] [CrossRef]
- Zhang, J.; Zhang, K.; Zhao, F. Research on the regional spatial effects of green development and environmental governance in China based on a spatial autocorrelation model. Struct. Chang. Econ. Dyn. 2020, 55, 1–11. [Google Scholar] [CrossRef]
- Chen, L.; Ren, C.; Zhang, B.; Wang, Z.; Liu, M. Quantifying Urban Land Sprawl and its Driving Forces in Northeast China from 1990 to 2015. Sustainability 2018, 10, 188. [Google Scholar] [CrossRef]
- Guo, Y.; Tong, L.; Mei, L. The effect of industrial agglomeration on green development efficiency in Northeast China since the revitalization. J. Clean. Prod. 2020, 258, 120584. [Google Scholar] [CrossRef]
- Tian, J.; Wang, B.; Wang, S. Urban Land Use Efficiency and Its Coupling Relationship in the Three Provinces of Northeast China. Sci. Geogr. Sin. 2019, 39, 305–315. [Google Scholar]
- Baral, H.; Keenan, R.J.; Sharma, S.K.; Stork, N.E.; Kasel, S. Spatial assessment and mapping of biodiversity and conservation priorities in a heavily modified and fragmented production landscape in north-central Victoria, Australia. Ecol. Indic. 2014, 36, 552–562. [Google Scholar] [CrossRef]
- Kim, D.; Seo, S.; Min, S.; Simoni, Z.; Kim, S.; Kim, M. A Closer Look at the Bivariate Association between Ambient Air Pollution and Allergic Diseases: The Role of Spatial Analysis. Int. J. Environ. Res. Public Health 2018, 15, 1625. [Google Scholar] [CrossRef]
- Chica-Olmo, J.; Sari-Hassoun, S.; Moya-Fernandez, P. Spatial relationship between economic growth and renewable energy consumption in 26 European countries. Energy Econ. 2020, 92, 104962. [Google Scholar] [CrossRef]
- Mao, D.; He, X.; Wang, Z.; Tian, Y.; Xiang, H.; Yu, H.; Man, W.; Jia, M.; Ren, C.; Zheng, H. Diverse policies leading to contrasting impacts on land cover and ecosystem services in Northeast China. J. Clean. Prod. 2019, 240, 117961. [Google Scholar] [CrossRef]
- Zhang, Y.; Liu, Y.; Zhang, Y.; Liu, Y.; Zhang, G.; Chen, Y. On the spatial relationship between ecosystem services and urbanization: A case study in Wuhan, China. Sci. Total Environ. 2018, 637, 780–790. [Google Scholar] [CrossRef] [PubMed]
- Zhang, L.; Hou, G.; Li, F. Dynamics of landscape pattern and connectivity of wetlands in western Jilin Province, China. Environ. Dev. Sustain. 2020, 22, 2517–2528. [Google Scholar] [CrossRef]


| Target Layer | Standard Layer | Index Layer | Calculation of the Index | Weight |
|---|---|---|---|---|
| TSDI | Population aggregation | Population density (person/km2) | Total population/total area | 0.1594 |
| Land development | Construction land ratio (%) | Construction land area/total area | 0.1753 | |
| Cultivated land ratio (%) | Cultivated land area/total area | 0.1432 | ||
| Economic development | GDP per area (10 thousand yuan/km2) | Total GDP/total area | 0.1334 | |
| Industry non-agricultural rate (%) | Total output value of secondary and tertiary industries/total GDP | 0.1345 | ||
| Input level | Investment in fixed assets per area (10 thousand yuan/km2) | Total investment in fixed assets/construction land area | 0.1383 | |
| Government financial expenditure per area (10 thousand yuan/km2) | Total government financial expenditure/total area | 0.1159 |
| Habitat Types | Habitat Suitability | Sensitivity of Habitat Types to Each Threat | ||||
|---|---|---|---|---|---|---|
| Cultivated Land | Urban Land | Rural Settlements | Industrial and Mining Land | Main Traffic Roads | ||
| Paddy field | 0.4 | 0.3 | 0.5 | 0.4 | 0.1 | 0.1 |
| Dryland | 0.6 | 0.3 | 0.5 | 0.4 | 0.1 | 0.1 |
| Forestland | 1.0 | 0.8 | 0.9 | 0.8 | 0.6 | 0.6 |
| Bush forestland | 1.0 | 0.4 | 0.6 | 0.5 | 0.2 | 0.2 |
| Open forestland | 1.0 | 0.9 | 1.0 | 0.9 | 0.7 | 0.7 |
| Other forestland | 1.0 | 0.9 | 1.0 | 0.9 | 0.7 | 0.7 |
| High-cover grassland | 0.8 | 0.4 | 0.6 | 0.5 | 0.2 | 0.3 |
| Medium-cover grassland | 0.7 | 0.5 | 0.7 | 0.5 | 0.3 | 0.5 |
| Low-cover grassland | 0.6 | 0.5 | 0.6 | 0.5 | 0.4 | 0.5 |
| River canal | 0.7 | 0.7 | 0.9 | 0.8 | 0.5 | 0.5 |
| Lake | 0.8 | 0.7 | 0.9 | 0.8 | 0.5 | 0.5 |
| Reservoir pit | 0.7 | 0.7 | 0.9 | 0.8 | 0.6 | 0.5 |
| Mudflat | 0.6 | 0.7 | 0.9 | 0.8 | 0.6 | 0.6 |
| Flood land | 0.6 | 0.7 | 0.8 | 0.7 | 0.6 | 0.6 |
| Saline and alkaline land | 0.4 | 0.5 | 0.6 | 0.5 | 0.5 | 0.7 |
| Marsh | 0.5 | 0.5 | 0.4 | 0.2 | 0.3 | 0.7 |
| Parameters | 2000 | 2005 | 2010 | 2015 |
|---|---|---|---|---|
| Moran’s I | −0.3301 | −0.2946 | −0.2420 | −0.2289 |
| z-value | −7.9722 | −7.1254 | −6.0427 | −5.7390 |
| p-value | 0.0010 | 0.0010 | 0.0010 | 0.0010 |
Publisher’s Note: MDPI stays neutral with regard to jurisdictional claims in published maps and institutional affiliations. |
© 2021 by the authors. Licensee MDPI, Basel, Switzerland. This article is an open access article distributed under the terms and conditions of the Creative Commons Attribution (CC BY) license (https://creativecommons.org/licenses/by/4.0/).
Share and Cite
Yang, Z.; Wang, S.; Guo, M.; Tian, J.; Zhang, Y. Spatiotemporal Differentiation of Territorial Space Development Intensity and Its Habitat Quality Response in Northeast China. Land 2021, 10, 573. https://doi.org/10.3390/land10060573
Yang Z, Wang S, Guo M, Tian J, Zhang Y. Spatiotemporal Differentiation of Territorial Space Development Intensity and Its Habitat Quality Response in Northeast China. Land. 2021; 10(6):573. https://doi.org/10.3390/land10060573
Chicago/Turabian StyleYang, Zhipeng, Shijun Wang, Meng Guo, Junfeng Tian, and Yingjie Zhang. 2021. "Spatiotemporal Differentiation of Territorial Space Development Intensity and Its Habitat Quality Response in Northeast China" Land 10, no. 6: 573. https://doi.org/10.3390/land10060573
APA StyleYang, Z., Wang, S., Guo, M., Tian, J., & Zhang, Y. (2021). Spatiotemporal Differentiation of Territorial Space Development Intensity and Its Habitat Quality Response in Northeast China. Land, 10(6), 573. https://doi.org/10.3390/land10060573