Article

Ecosystem Services Changes on Farmland in Response to Urbanization in the Guangdong–Hong Kong–Macao Greater Bay Area of China

1
School of Geography and Ocean Sciences, Nanjing University, Nanjing 210023, China
2
State Key Laboratory of Resources and Environmental Information System, Institute of Geographic Sciences and Natural Resources Research, Chinese Academy of Sciences, Beijing 100101, China
3
Collaborative Innovation Center for the South China Sea Studies, Nanjing University, Nanjing 210023, China
4
Department of Geography, Ghent University, 9000 Ghent, Belgium
5
Innovation Academy of South China Sea Ecology and Environmental Engineering, Chinese Academy of Sciences, Guangzhou 510301, China
6
Department of Plants and Crops, Ghent University, 9000 Ghent, Belgium
7
Faculty of Geomatics, Lanzhou Jiaotong University, Lanzhou 730070, China
*
Author to whom correspondence should be addressed.
Land 2021, 10(5), 501; https://doi.org/10.3390/land10050501
Submission received: 22 March 2021 / Revised: 23 April 2021 / Accepted: 4 May 2021 / Published: 8 May 2021
(This article belongs to the Special Issue Urban Ecosystem Services II: Toward a Sustainable Future)

Abstract

:
Extensive urbanization around the world has caused a great loss of farmland, which significantly impacts the ecosystem services provided by farmland. This study investigated the farmland loss due to urbanization in the Guangdong–Hong Kong–Macao Greater Bay Area (GBA) of China from 1980 to 2018 based on multiperiod datasets from the Land Use and Land Cover of China databases. Then, we calculated ecosystem service values (ESVs) of farmland using valuation methods to estimate the ecosystem service variations caused by urbanization in the study area. The results showed that 3711.3 km2 of farmland disappeared because of urbanization, and paddy fields suffered much higher losses than dry farmland. Most of the farmland was converted to urban residential land from 1980 to 2018. In the past 38 years, the ESV of farmland decreased by 5036.7 million yuan due to urbanization, with the highest loss of 2177.5 million yuan from 2000–2010. The hydrological regulation, food production and gas regulation of farmland decreased the most due to urbanization. The top five cities that had the largest total ESV loss of farmland caused by urbanization were Guangzhou, Dongguan, Foshan, Shenzhen and Huizhou. This study revealed that urbanization has increasingly become the dominant reason for farmland loss in the GBA. Our study suggests that governments should increase the construction of ecological cities and attractive countryside to protect farmland and improve the regional ESV.

1. Introduction

Unprecedented urbanization has been occurring worldwide, which has caused the urban population to currently account for more than half of the world′s population; this proportion is expected to increase to nearly three-quarters by 2050 [1]. Considerable urban expansion has mostly taken place in developed countries in the past, but it will mainly occur in developing countries in the coming decades. It is estimated that the urban area in developing countries will increase to 1.2 million km2 by 2050, which is four times the urban area in 2000 [2]. As the largest developing country in the world, China has been experiencing unprecedented urban expansion after the implementation of the reform and opening up policy in 1978, with the increase of the urban population from 17.92% in 1978 to 58.5% in 2017, and a projected rise to 70% by 2030 [3,4]. Urban agglomerations in China are hotspots of urban expansion because of intensive anthropogenic activities and rapid economic growth, such as the Jing-Jin-Ji urban agglomerations, the Yangtze River Delta urban agglomerations, and the Pearl River Delta urban agglomerations [3,5,6].
Extensive urbanization has substantially encroached on farmland, wetlands and forestland, which has further led to decreases in the food supply, the loss of natural habitat, and the dramatic degradation of ecosystem services (ESs) [7,8,9,10,11]. Previous studies proved that urban expansion mainly originates from the conversion of farmland, and has also become the main source of farmland loss around the world [4,12,13,14]. In China, 74% of the lost farmland was converted into 85% of the newly increased urban land in the past decades [15]. Farmland preservation and urban expansion has become a hot topic. Urbanization has not only encroached substantially on farmland, but also impacted farmland quality and the intensity of agricultural activities [10,15,16]. Continued urban expansion will accelerate agricultural land expansion, putting high pressure on the natural ecosystems [10]. Moreover, urbanization has negative impacts on the ESs supported by farmland; e.g., food production ES, cultural heritage, wildlife habitat and open space [17,18,19,20]. Narduccia et al. showed that urban areas have more negative impacts on ESs than farmland [12]. The massive farmland loss due to urbanization is increasingly threatening farmland preservation and relative ESs [10,21,22,23]. Previous studies put more attention on the spatial and temporal relationship between urbanization and farmland, but they rarely explored the additional influences of urbanization on ESs and ecosystem functions supported by farmland. Therefore, it is necessary to explore the impacts of urbanization on farmland and associated ESs.
Estimate ESs are significant and alert decision makers and the public to the importance of these services. In 1997, Costanza et al. introduced the principle, methods and results of estimating the global ecosystem service value (ESV) by synthesizing previous studies based on a wide variety of methods, and they found that the global gross domestic product is much lower than the ESV [24]. In 2007, Xie et al. improved the valuation methods of Costanza et al. and developed a unit value adapted to China, which can be applied to assess ESs in specific land use areas [25]. In 2015, Xie et al. modified their original approach, developing a method for evaluating the value equivalent factor in the per unit area, and proposed an integrated method for the dynamic evaluation of the Chinese terrestrial ESV [26]. Xie et al.’s equivalent value per unit area method for the Chinese ESV has been widely adopted, but if it is directly applied to the regional scope, then the results will be biased. Xu et al. proposed a regional revision method, which entails revising the average ES equivalent values of the entire country to that of the study area based on the data of food products per unit area [27]. Xu et al.’s method has been widely implemented in different regions and has increased the accuracy of change detection [8,9,28].
The Guangdong–Hong Kong–Macao Greater Bay Area (GBA) is one of the most urbanized, industrialized and populous areas in China. However, the GBA used to be a predominantly agricultural region before 1980, was dominated by farms and rural villages and was highly suitable for agricultural development [29,30]. Extensive urbanization in the GBA has led to a large area of farmland loss, but few studies have examined the farmland loss in the GBA due to urbanization over recent decades. In previous studies, urbanization mostly refers to the expansion of urban land or urban areas, but it also includes the expansion of residential, road and industrial land [11,12,31,32]. To achieve a comprehensive understanding of urbanization, this study defines urbanization as construction land sprawl; namely, the expansion of residential areas, industrial areas, mining areas, transportation land and other construction land. Therefore, the changes in farmland and its ESV because of urbanization were examined in the GBA from 1980 to 2018 in this study. The objectives include the following: (1) to analyze the spatial and temporal changes in construction land in 1980, 1990, 2000, 2010 and 2018; (2) to examine the characteristics of farmland changes due to urbanization during the past 38 years; and (3) to evaluate the ESV of farmland loss under the effects of urbanization over the past four decades.

2. Materials and Methods
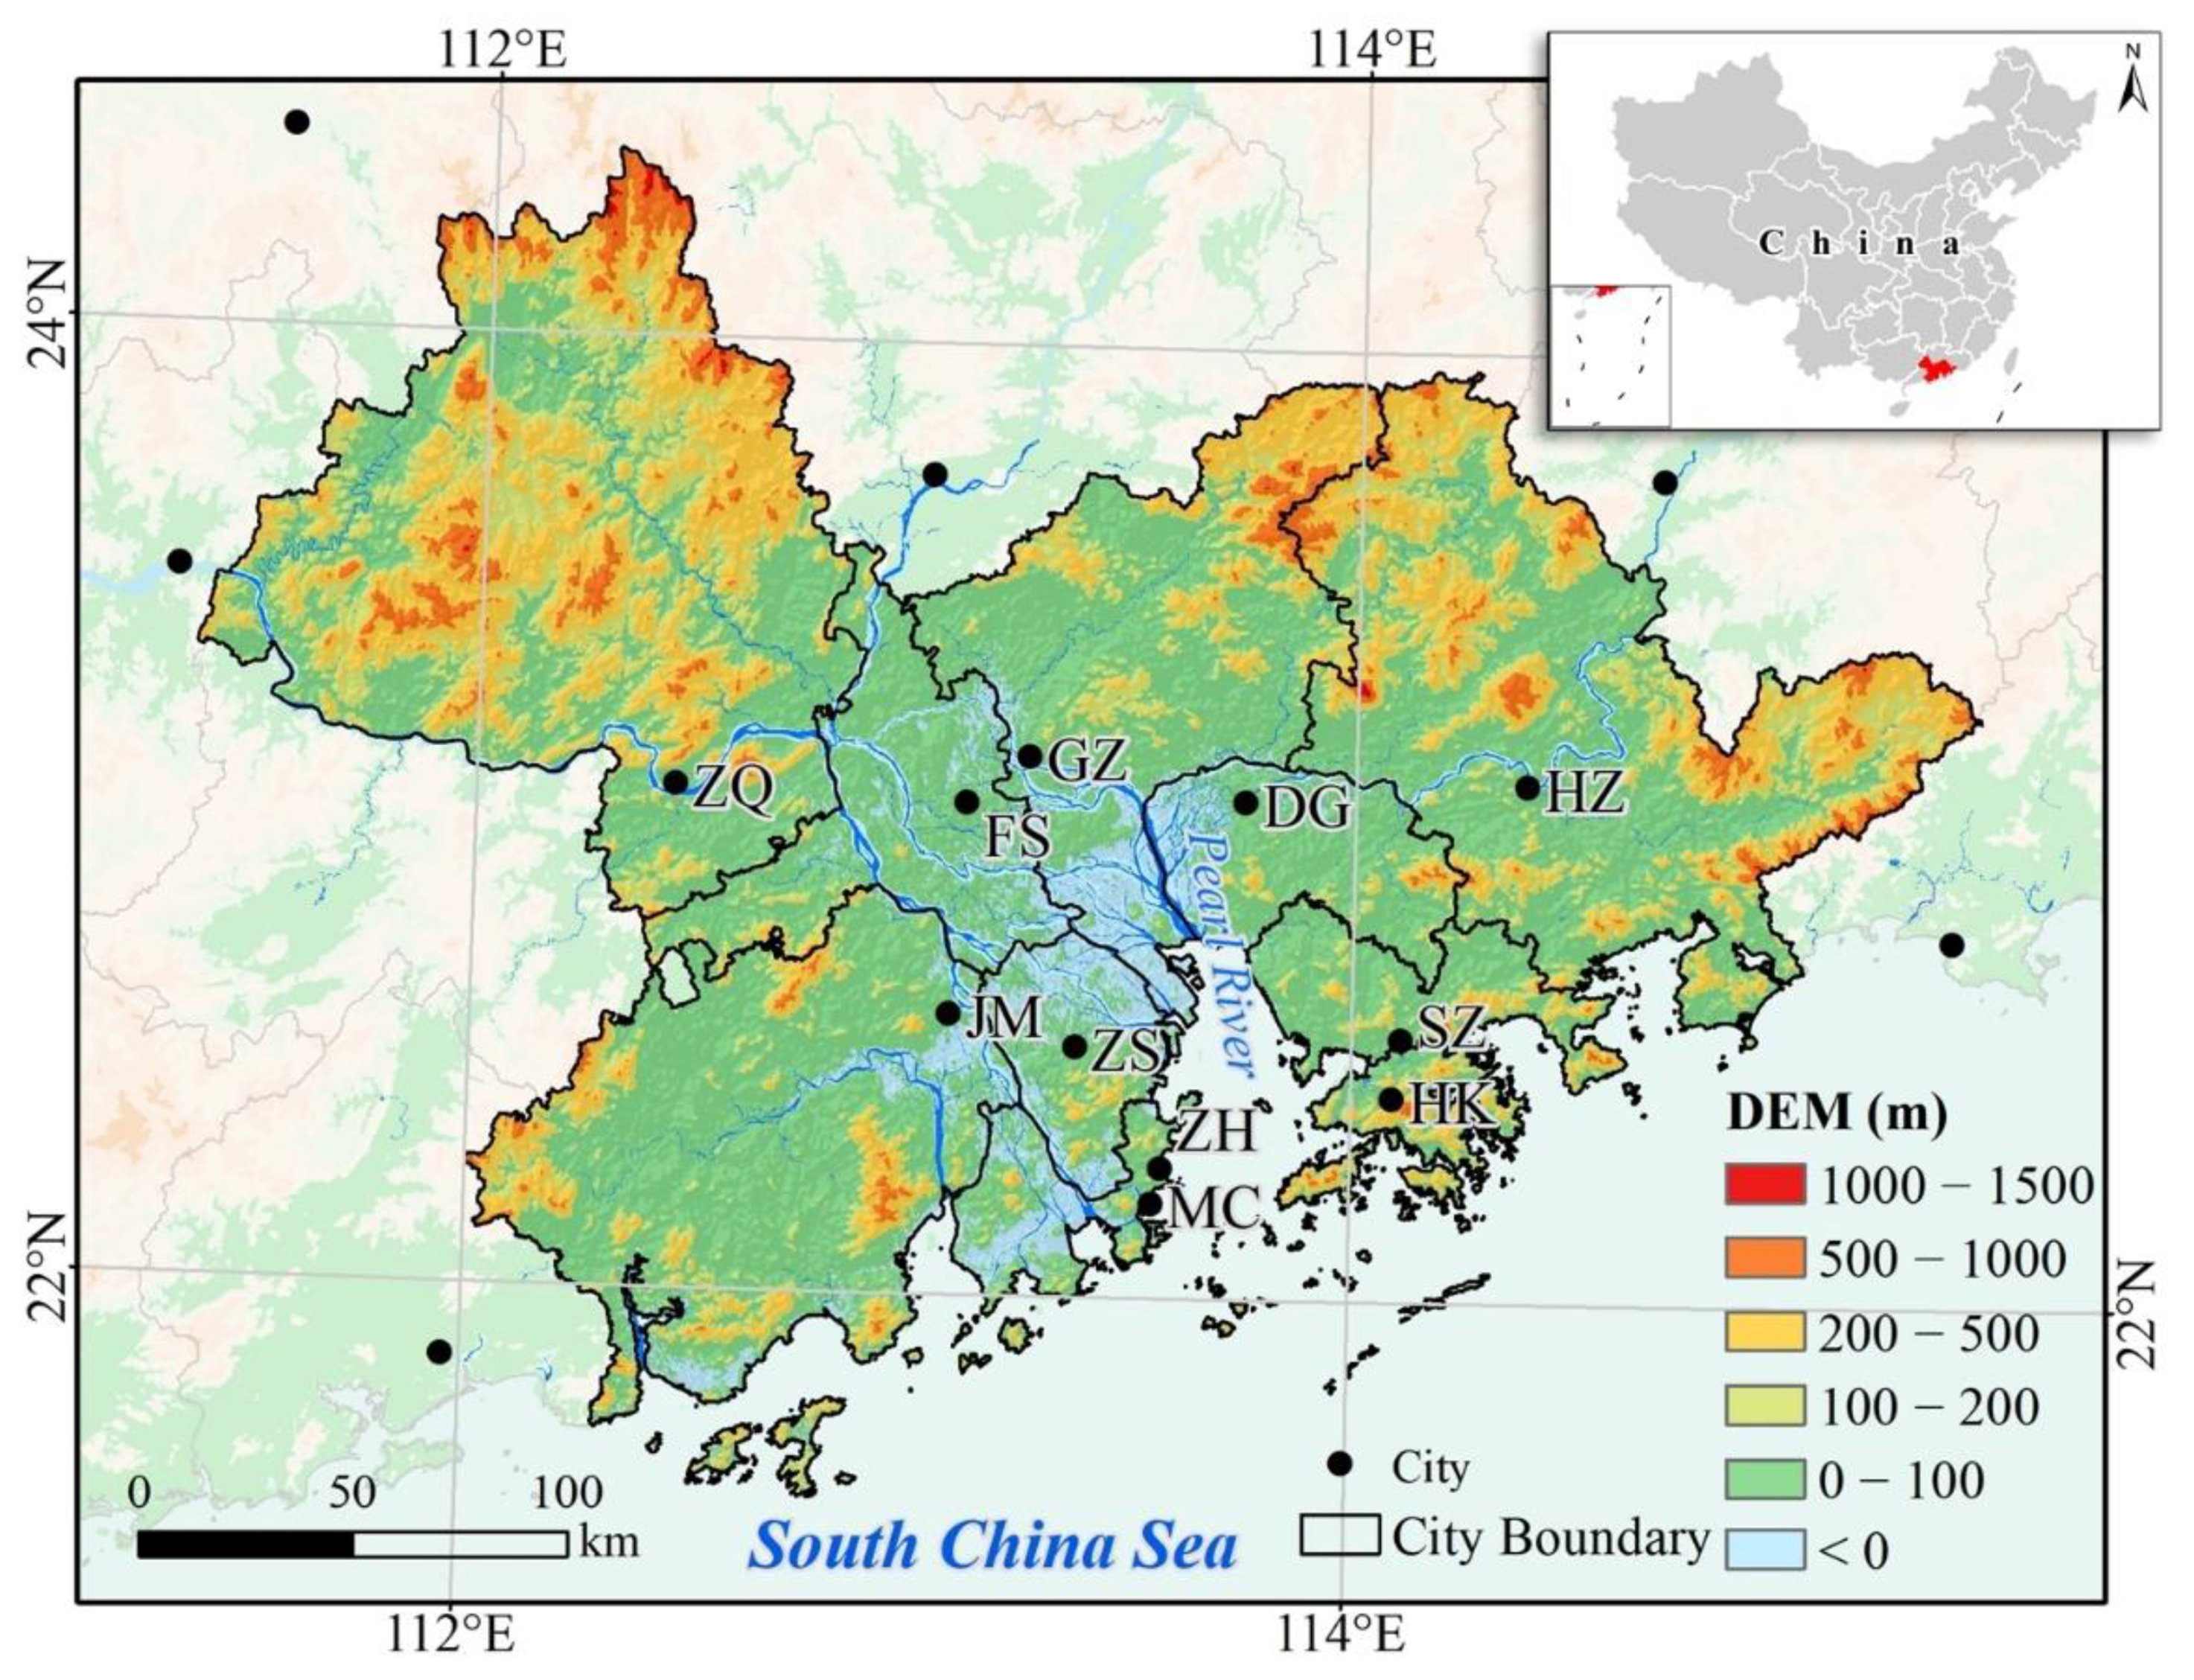
2.1. Study Area

The GBA is located in the south of China, covering a total area of approximately 55,000 km2, with a population of approximately 45 million people in 2018 (Figure 1). The study area consists of 11 cities; specifically, Guangzhou, Shenzhen, Zhuhai, Foshan, Dongguan, Zhongshan, Jiangmen, Huizhou, Zhaoqing, Hong Kong and Macao. It has several typical geomorphic types, including mountains, hills, terraces and plains. The study area is located in a subtropical climate zone with an average annual temperature of 22.3 °C and an average annual rainfall of 1832 mm, and 83% of the rainfall occurs in the rainy season [33]. The study area has transformed from a predominantly agricultural region into one of the most developed urban agglomerations in the world since China’s reform and opening-up policy [30,34]. As one of the regions in China with the highest degree of openness and a notable economic vitality, the GBA occupies an important strategic position in the overall national development situation.

2.2. Data Source

The land use datasets of the farmland and construction land in this study related to 1980, 1990, 2000, 2010 and 2018 were extracted from the Land Use and Land Cover of China (CNLUCC) database [35]. The CNLUCC includes the land use and land cover (LULC) datasets for 1980, 1990, 1995, 2000, 2005, 2010, 2015 and 2018. These datasets were mainly produced by visual interpretation on the basis of a series of multitemporal Landsat images, including Thematic Mapper (TM), Enhanced Thematic Mapper (ETM) and Operational Land Imager (OLI) images. As one of the most accurate remote sensing monitoring data products in China, CNLUCC has played an important role in the investigation and research of national land resources, hydrology and ecology. In this study, the classification system included two primary classes and five subclasses, and the detailed information is listed in Table 1. The two primary classes are farmland and construction land, and both were divided into several subclasses. Farmland is classified into two subclasses, namely paddy fields and dry farmland. Construction land includes three subclasses: urban residential land, rural residential land and other construction land. In addition, specific social statistical data, including the yield and area of the main grains in Guangdong Province and China, were obtained from the Statistical Yearbook of Guangdong Province and China of 1980, 1990, 2000, 2010 and 2018 and were downloaded from the China National Knowledge Infrastructure (CNKI) database (http://data.cnki.net/Yearbook/Navi?type=type&code=A (accessed on 20 May 2020)).

2.3. Methods

2.3.1. Analysis of the Changes in Land Use Types

To analyze the degree of changes in land use types, the annual change area (ACA, km2/year) was calculated as follows:
ACA = A 2 A 1 t
where A1 and A2 are the area of farmland or construction land at the start and end dates, respectively, and t is the time span of the study period.

2.3.2. Assessment of the Ecosystem Service Value of Farmland

The ESV was divided into four classes and eleven subclasses based on previous research [24,26,36]. The four classes were provision services, regulation services, support services and cultural services. Provision services include food production, primary production and water supply. Regulation services comprise gas regulation, climate regulation, environmental purification and hydrological regulation. Support services consist of soil conservation, nutrient cycling and biodiversity conservation. Cultural services include recreational and aesthetic values. Based on the research of Costanza et al. and Xie et al. [24,26,37], the ESV of farmland in the GBA from 1980 to 2018 was quantitatively estimated with the ecosystem service value coefficient method as follows:
ESV =   ( A k × V c k )
where ESV denotes the total annual value of the ESs, and Ak and Vck are the area and value coefficient, respectively, for land use type k. In this study, the ESV of paddy fields and dry farmland were calculated first, then they were summed up to get the ESV of farmland.
To better reflect the ESV changes in the different study periods, the main grain yield in the GBA compared to that in all of China was used to revise the ecosystem services equivalent value [27]. The correction coefficient βt was calculated as follows:
βt = yt/Yt
where yt and Yt are the grain yields in Guangdong Province and China at time t, respectively. Because the data of grain yield in the GBA in the early study periods was not easy to acquire, the grain yield in the GBA was replaced by that of Guangdong Province in this study. Thus, β1980, β1990, β2000, β2010 and β2018 were 1.34, 1.24, 1.38, 1.05 and 0.99, respectively.
The economic value of the ecosystem services equivalent value per unit area (Ea) was calculated as follows [8,28]:
Ea = 1/7 × (P × Y)/A
where Y and A are the total yield and area of the main grains in Guangdong Province in 2018, respectively; P is the average price of the main grains. In order to eliminate the impacts of changing values of the currency (yuan), P was given the value of 3.77 yuan/kg, which is the average price of the main grains in 2018, obtained from the Grain Net of South China (https://gdgrain.com/#!/list?params=%7B%22type%22:8%7D (accessed on 15 May 2020)).

3. Results

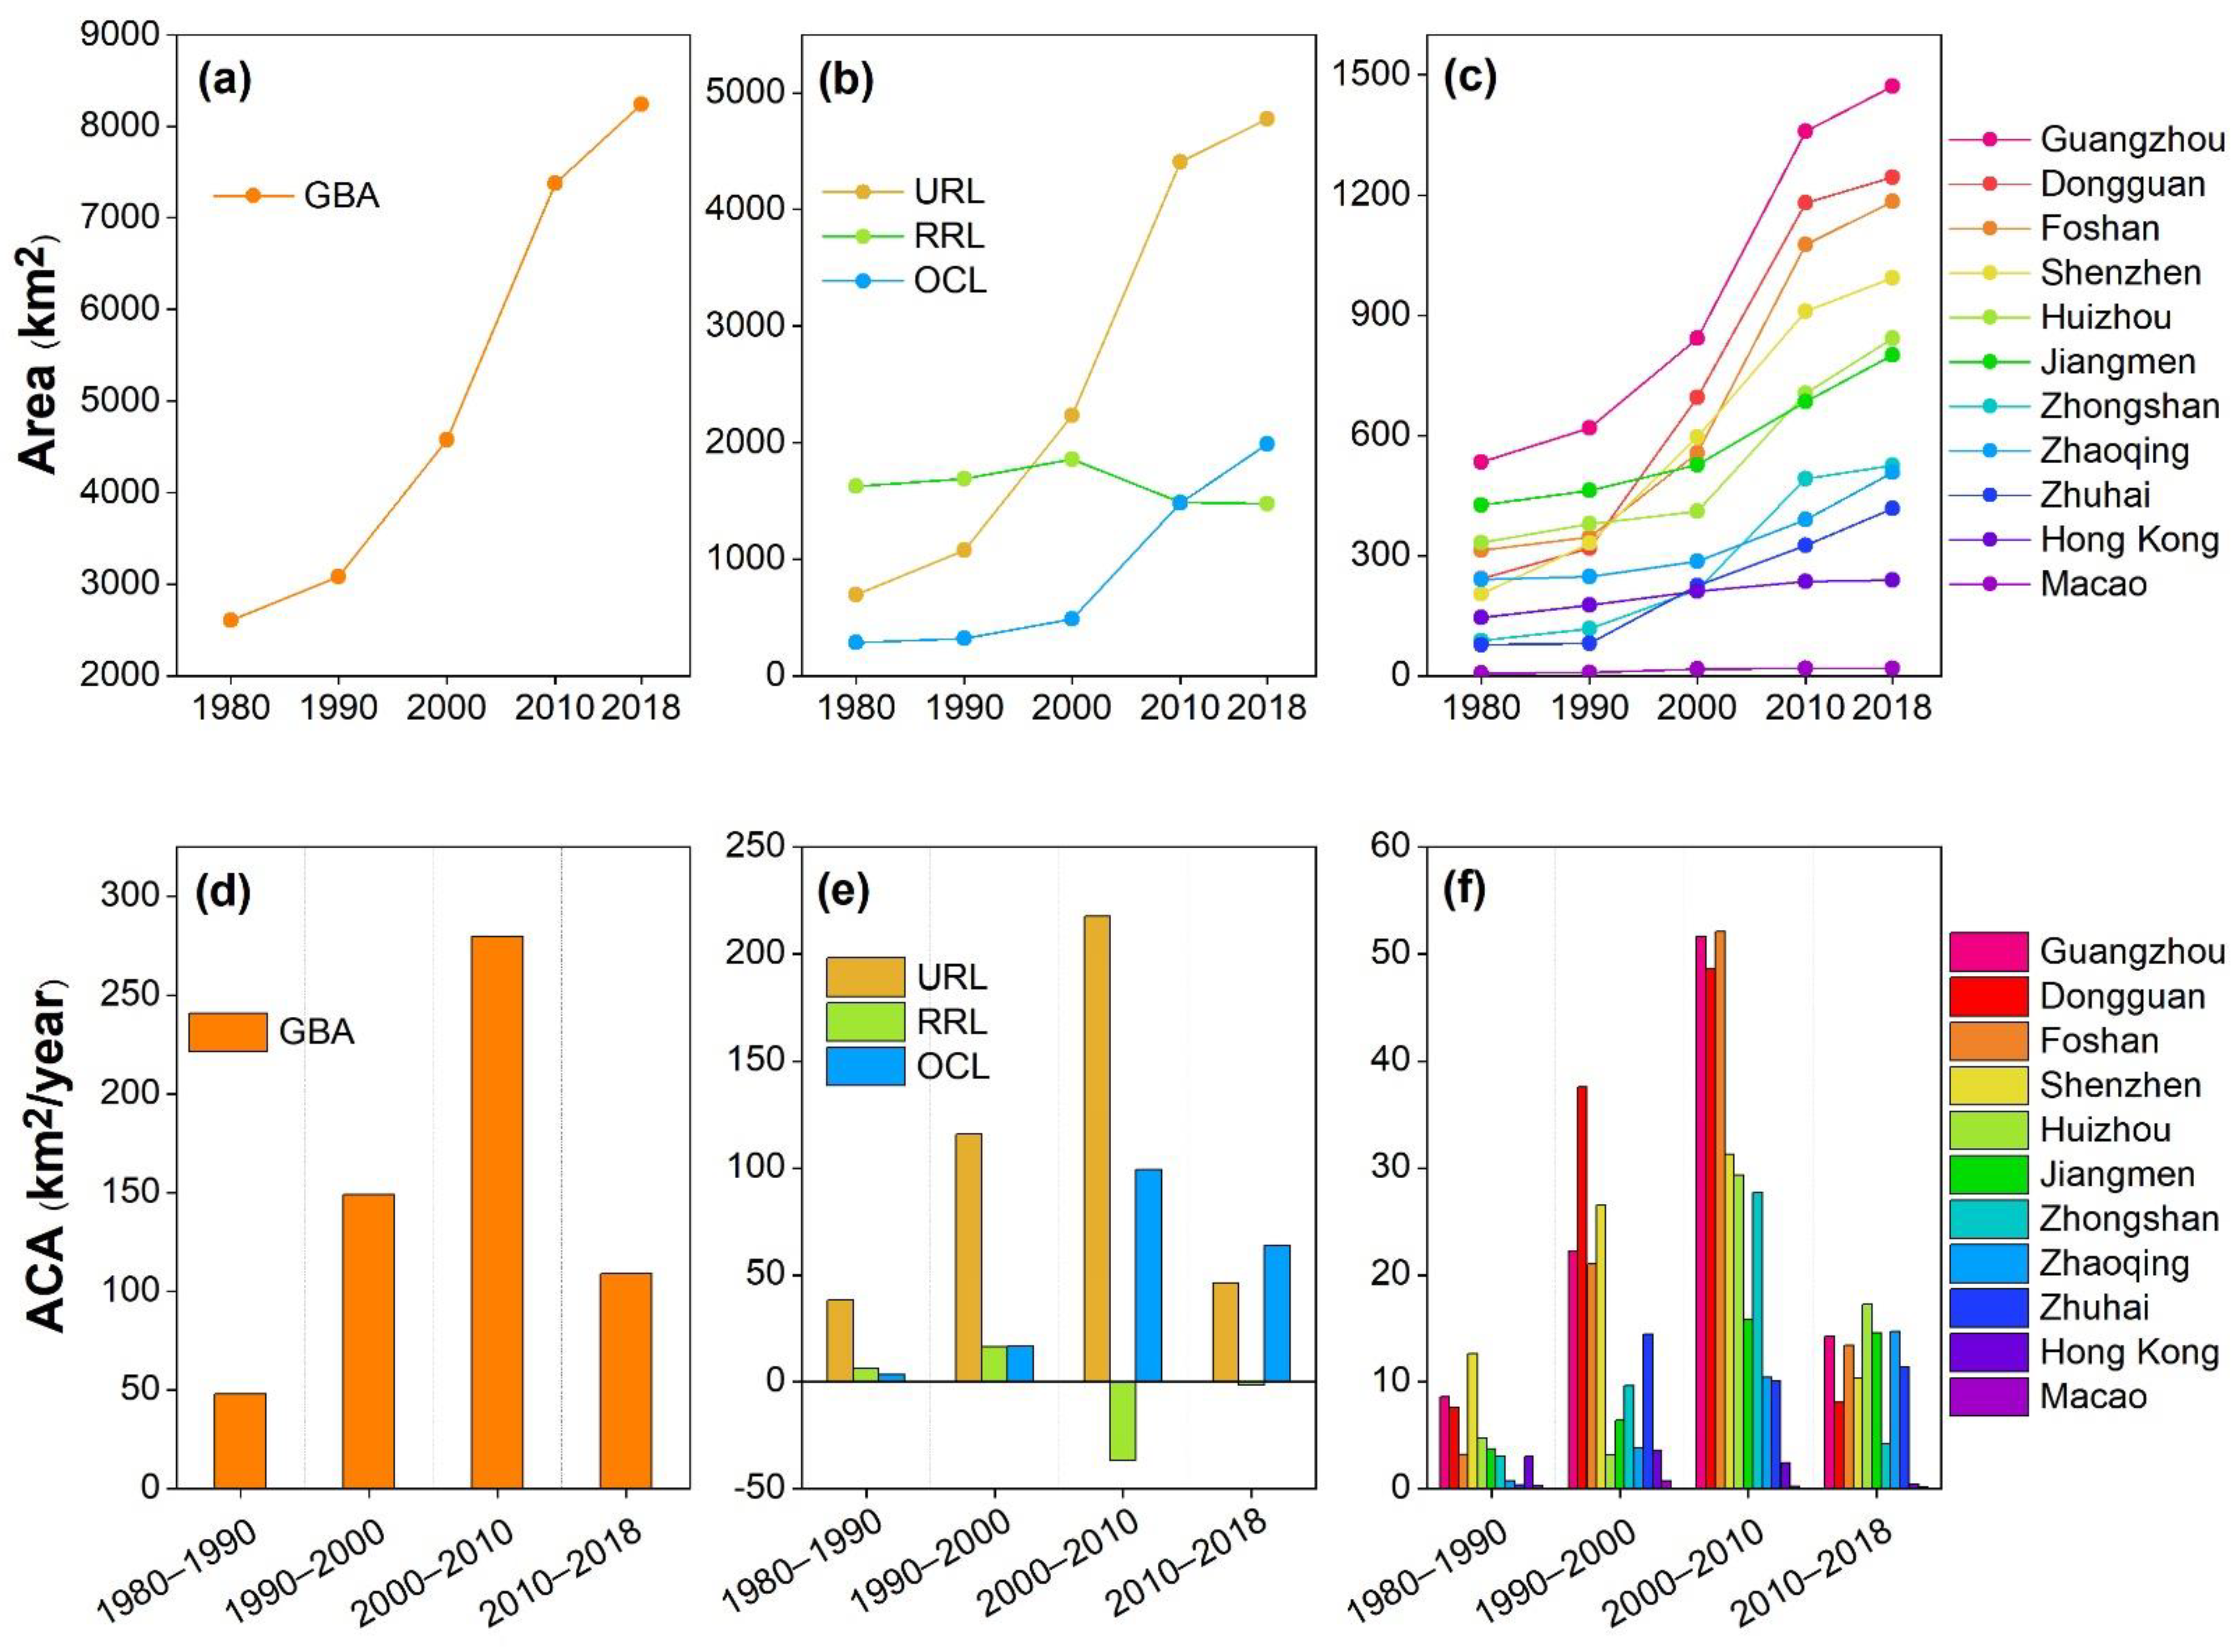
3.1. Urbanization in the GBA from 1980 to 2018

From 1980 to 2018, the area of construction land in the GBA showed a discernible growth trend, increasing from 2607.4 km2 to 8243.5 km2, a more than twofold increase (Figure 2a). A similar trend was observed in urban residential land and other construction land, which increased nearly sixfold (from 694.7 km2 to 4778.5 km2 and from 285.7 km2 to 1991.2 km2, respectively) (Figure 2b). The area of rural residential land peaked in 2000 with 1855.9 km2 and then declined. By 2018, urban residential land occupied a dominant position among construction land (58.0%), followed by other construction land (24.2%) and rural residential land (17.9%). Regionally, construction land expanded rapidly in the 11 cities of the GBA in the past 40 years (Figure 2c). Among the 11 cities, only one had an area of construction land over 500 km2 in 1980 (Guangzhou), but there were 8 cities by 2018. Among the four different periods, the highest ACA of construction land in the GBA was 279.7 km2/year from 2000–2010, followed by 149.1 km2/year from 1990–2000 and 108.7 km2/year from 2010–2018 (Figure 2d). A similar trend also appeared in urban residential land and other construction land (Figure 2e). The ACA of rural residential land was negative in the final two study periods. The highest ACA of most cities was observed from 2000–2010 (Figure 2f). Lastly, although the urbanization and development degree of Hong Kong and Macao were much higher than that of the other cities in the GBA, their construction land expansion area and rate seemed much smaller than those of the other cities because their own administrative area was relatively small.

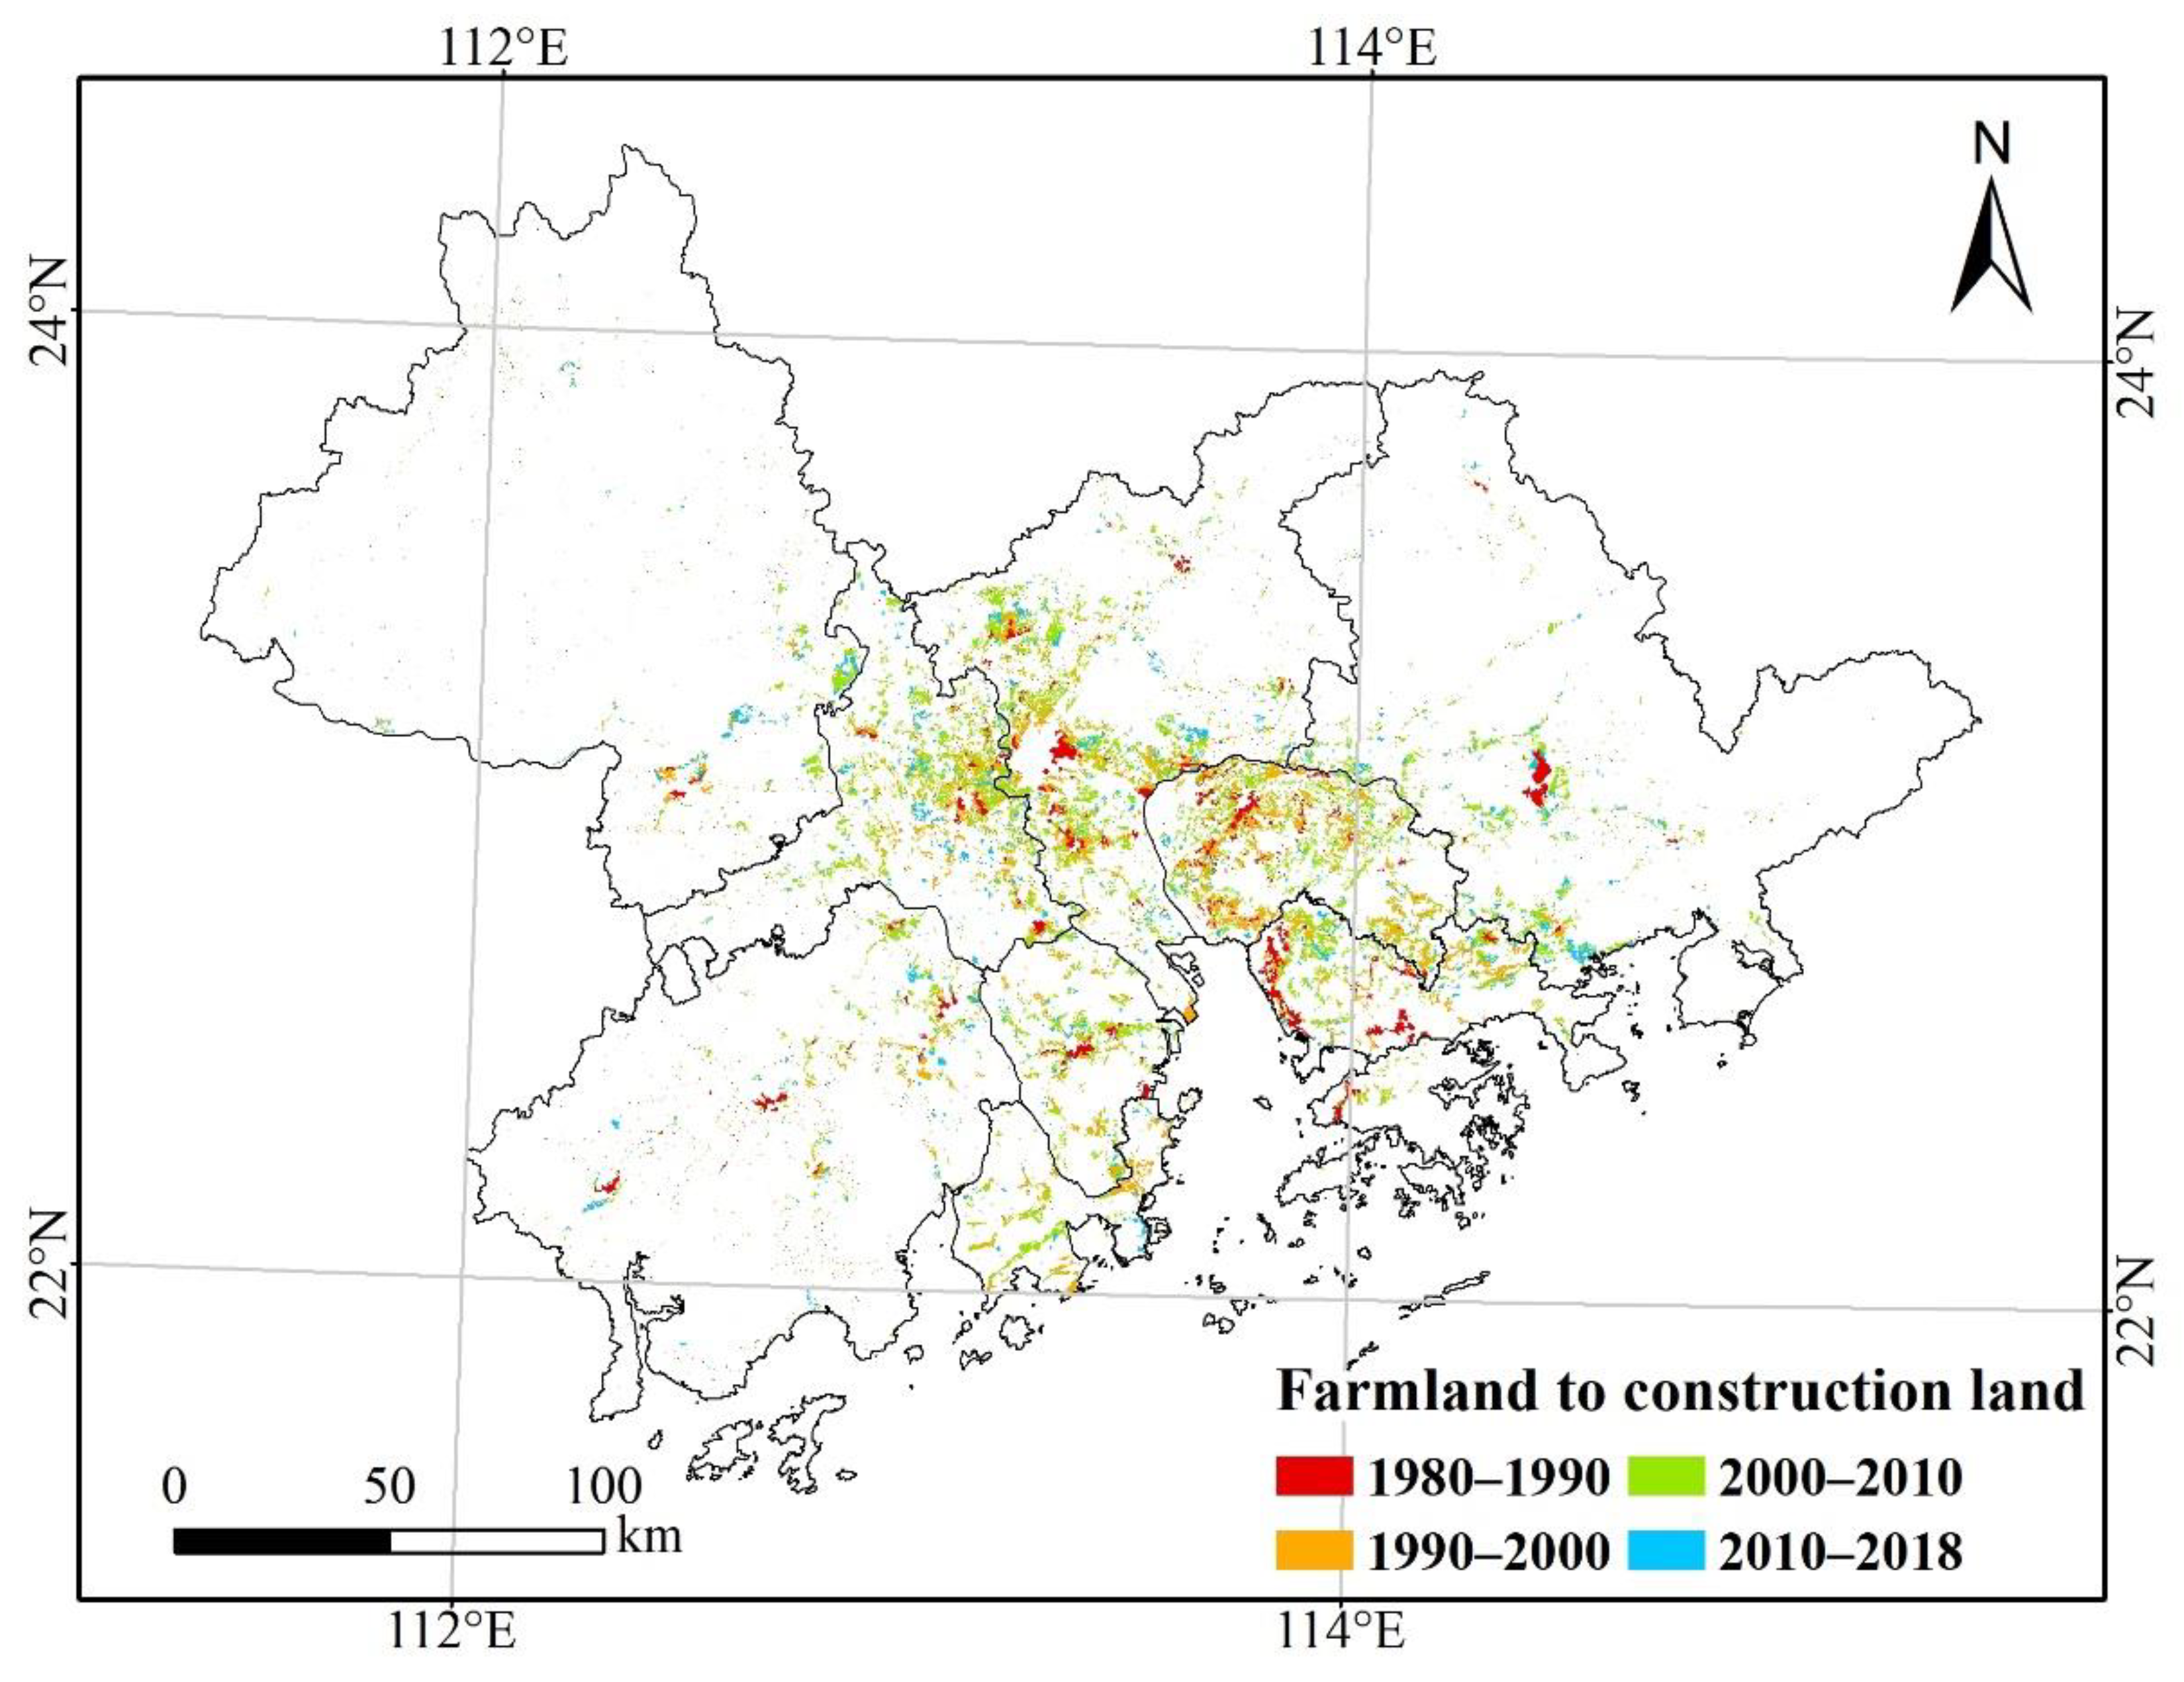
3.2. Changes in Farmland in the GBA from 1980 to 2018

Over the past 38 years, the total area of the farmland in the GBA varied from 16,640.1 km2 to 12,417.4 km2, and more than a quarter of the total farmland area of 1980 had been lost (Figure 3a). An overall decreasing trend was also observed in the different categories of farmland and 11 cities (Figure 3b,c). The area of paddy fields was far larger than the area of dry farmland in the GBA; correspondingly, the paddy field loss (3086.3 km2) was much greater than the dry farmland loss (1136.4 km2) (Figure 3b). From 1980 to 2018, the top five farmland losses were in Guangzhou (−827.2 km2), Dongguan (−744.7 km2), Jiangmen (−452.9 km2), Foshan (−428.2 km2) and Shenzhen (−414.1 km2) (Figure 3c). The highest ACA of farmland was −174.1 km2/year from 2000–2010, followed by −158.0 km2/year from 1990–2000, while the lowest ACA was −27.3 km2/year from 2010–2018 (Figure 3d). The ACA of paddy fields, dry farmland and the farmland in 11 cites was also higher from 1990–2000 and 2000–2010 (Figure 3e,f).
From 1980 to 2018, the conversion from farmland to construction land was mainly distributed at the center of the GBA; e.g., Guangzhou, Dongguan, Shenzhen, Foshan and Zhongshan (Figure 4). Over the past 38 years, 3711.3 km2 of farmland was converted into construction land. Among the four adjacent periods, the farmland loss due to urbanization increased drastically from the first study period (479.5 km2) to the third study period (1772.4 km2) but then dropped sharply in the last study period (439.2 km2) (Figure 5a). However, the percentage of farmland loss due to urbanization in the total farmland loss exhibited a growth trend, increasing from 39.3% to 96.6% from the first study period to the last study period (Figure 5b), which demonstrates that urbanization increasingly became the dominant reason for farmland loss. From 1980 to 2018, the urbanization-triggered losses of paddy fields and dry farmland were 2599.4 km2 and 1038.7 km2, respectively (Figure 5c). The paddy field area lost due to urban sprawl was much more considerable than that of dry farmland over the past four decades. From 2000–2010, the losses of paddy fields and dry farmland due to construction land expansion were the highest, with areas of 1183.1 km2 and 589.3 km2, respectively. Over the past 38 years, 2086.7 km2, 708.0 km2 and 916.5 km2 of farmland disappeared because of the expansion of urban residential land, rural residential land and other construction land, respectively (Figure 5d). The largest farmland loss due to urban residential land expansion was 1000.5 km2 from 2000–2010, followed by 603.8 km2 from 1990–2000 and 305.6 km2 from 1980–1990. Farmland being converted to rural residential land mainly occurred from 1990–2000 with an area of 305.6 km2, then from 2000–2010 (249.7 km2) and from 1980–1990 (132.6 km2). The largest farmland loss caused by other construction land was 522.2 km2 from 2000–2010, followed by 242.4 km2 from 2010–2018. In the past four decades, the top five cities that experienced farmland loss because of urbanization were Guangzhou (824.42 km2), Dongguan (653.34 km2), Foshan (591.03 km2), Shenzhen (371.35 km2) and Huizhou (362.22 km2) (Figure 5e). In most areas, this conversion was concentrated between 1990 and 2010.

3.3. The Impact of Urbanization on the Ecosystem Service Value of Farmland

An unprecedented expansion of construction land has led to a great loss of farmland, which has further impacted the ESs and functions of farmland in the GBA. In the past four decades, the ESV of farmland decreased by 5036.7 million yuan due to construction land encroachment, accounting for 43.1% of the total ESV loss of farmland (Table S1). The highest ESV loss of farmland because of urbanization was 2177.5 million yuan from 2000–2010, followed by 1655.1 million yuan from 1990–2000 (Figure 6a). For paddy fields and dry farmland, the ESV losses caused by urbanization were 3442.1 million yuan and 1594.7 million yuan, respectively (Figure 6b). The largest ESV losses of both paddy fields and dry farmland appeared from 2000–2010 (1438.8 million yuan and 738.7 million yuan, respectively), and the second-largest ESV losses were from 1990–2000 (1040.0 million yuan and 615.1 million yuan, respectively). Because of urbanization, the most affected ecosystem service function was hydrological regulation with a loss of 2514.2 million yuan, followed by food production and gas regulation with losses of 1541.4 million yuan and 1248.6 million yuan, respectively (Figure 6c). Specifically, the ESV of the water supply of farmland was positive under the effects of urbanization, because paddy fields need a large amount water for the growth of aquatic plants. To some degree, the loss of paddy fields is a benefit for the water supply. Regionally, the total ESV loss of farmland caused by urbanization in Guangzhou was the largest (1110.85 million yuan), followed by that in Dongguan (921.8 million yuan), Foshan (791.6 million yuan), Shenzhen (518.1 million yuan) and Huizhou (460.4 million yuan). The largest ESV loss of most cites in most areas was also concentrated from 2000–2010 (Figure 6d). In addition, Figure 7 shows the temporal and spatial changes of ESV of farmland caused by urbanization in 11 cities. From 1980–1990 and 2010–2018, the ESV losses of farmland because of urbanization in 11 cities were mostly less than 100 million yuan (green and dark green). However, from 1990–2000 and 2000–2010, the ESV losses of farmland because of urbanization in Guangzhou, Foshan and Dongguan were larger, especially in Guanghzou from 2000–2010, showed with red color. Overall, the ESV losses of farmland due to urbanization in Zhaoqing, Zhuhai, Macao and Hong Kong were relatively less than in other areas.

4. Discussion

4.1. Farmland Changes Caused by Urbanization

The results of this study demonstrate that construction land in the GBA experienced dramatic changes in the overall extent, different types and regional extent, especially after 1990. Farmland is the land use type that contributed most to the expansion of construction land over the past four decades (Figure S1). Because of urbanization, 3711.3 km2 of farmland disappeared in the GBA from 1980 to 2018. The highest farmland loss caused by urbanization was observed from 2000–2010 (1772.4 km2), followed by that in the period from 1990–2000 (1020.1 km2), but it was small from 1980–1990 (479.5 km2) and from 2010–2018 (439.2 km2). Our results are different from others showing the global conversion of farmland to other land use types; globally, farmland was mainly converted to grasslands and woodlands, which accounted for 57% and 36%, respectively [38]. These changes were strongly influenced by the social development background in China and local governments’ behavior [39,40]. From 1980–1990, the first ten years after the implementation of the reform and opening-up policy in 1978, social and economic development was in the initial stage, production technologies lagged behind and infrastructure was relatively imperfect. All of these reasons contributed to a slower process of urbanization, which resulted in less farmland being converted to construction land. However, after ten years of development, the economy expanded to a certain extent, and the process of urbanization and industrialization also gradually accelerated, which led to farmland being intensively encroached on by construction land. Subsequently, China entered the World Trade Organization in 2001, which indicated that China’s reform and opening up had entered a new stage in history. Rapid economic and scientific technology development impelled extensive urbanization, which caused the area of farmland loss to construction land to reach a peak from 2000–2010. As construction land expansion produced a great loss of farmland, a series of environmental problems appeared which threatened farmland preservation, food security, production capacity and social stability [41,42]. In addition, farmland conversion to construction land could also lead to intensification of farming, and abandonment and degradation of farmland [43,44]. Governments try their best to maintain a balance between urbanization development and farmland preservation by implementing much stricter policies for farmland conversion and ecological urbanization and construction [10,14]. As early as 2005, the central land policy for the preservation of 1.8 billion mu (1.2 million km2) farmland was established, which is a key environmental policy to cope with China’s land transformation crisis since the 1990s [45]. In addition, to improve the urbanization quality and to strengthen the protection of farmland and natural ecosystems, the National Plan on New Urbanization and the Opinions on Accelerating the Construction of Ecological Civilization were promulgated in 2014 and 2015, respectively [39]. Under these policies, farmland loss due to urbanization sharply declined after 2010. In addition, local governments’ behavior has vital impacts on the conversion of farmland to construction land [14,46,47]. Driven by particular interests, local governments converted farmland to urban land at a low compensation and leased to developers at a much higher price [48], which significantly affected farmland change under rapid urbanization [14]. To preserve agricultural land and food security, a centralized fiscal reform in 1994 induced local governments’ land financing behavior to significantly influence farmland conversion [14]. Although the central government limits the total construction land quotas that local governments can lease to developers, local governments still have sufficient autonomy to determine which parcel of land to lease out [14], and they resorted to land leasing to gain extra revenue to finance urban construction and balance fiscal expenditures [49]. This extra local revenue from land leasing was approximately 33.7% of the local revenues from 2007 to 2012, which mainly came from farmland conversion [50,51]. Lastly, the urbanization in Guangzhou, Dongguan, Foshan, Shenzhen and Huizhou was faster than in other cities over the past four decades (Figure 2); correspondingly, the area of farmland conversion to construction land was greater in these cities than in the other cities (Figure 5). The same is observed in other developing counties, like India, where farmland conversion to construction land predominantly occurred in the districts with high rates of economic growth and higher agricultural land suitability [22].

4.2. Ecosystem Service Value Changes due to Urbanization

Extensive urbanization has resulted in the degradation of farmland, which poses a great threat to food provision security, ecological environmental protection, ESs and regional sustainability [52,53,54,55]. In the past four decades, the ESV loss of farmland caused by urbanization was 5036.7 million yuan in the GBA, and the highest loss was 2177.5 million yuan from 2000–2010, followed by 1655.1 million yuan from 1990–2000. The change trend of the ESV loss of farmland is similar to the change trend of farmland lost because of urbanization, which is because the calculation of the ESV is based on area. In addition, our results indicate that ESs such as hydrological regulation, food production and gas regulation are particularly vulnerable to urbanization impacts (Figure 6c). As construction land expands, a large area of farmland is converted to impermeable surfaces, which causes rain and runoff to not penetrate the ground in time and participate in the natural water cycle, which further heavily affects hydrological regulation [56]. For food production, urbanization has multiple effects. Rapid urbanization in the GBA has led to an increase in the agricultural land use intensity, cropping frequency and chemical fertilizer use, a decline in the per capita availability of food grains, and soil and water pollution [10,22,57,58]. In this complex context, both food production and security are seriously influenced. The process of urbanization and industrialization inevitably causes environmental problems such as air pollution [59], which predominantly originates from industry, transport, power generation and construction [60]. Air pollution could lead to air quality deterioration and thus influence regional gas regulation [59,60].

4.3. Farmland Conservation and Ecosystem Services Protection

Governments have been striving to maintain a balance between urbanization development and farmland preservation [10,14], and the results of this study show that farmland loss due to urbanization sharply declined after 2010, but the results also indicate that construction land expansion has increasingly become the dominant reason for the loss of farmland in the GBA over the past 40 years. Therefore, it is still vital for governments to take more effective steps to regulate construction land expansion and to develop trade-offs and synergies among urban development, agricultural production and ecosystem preservation [14,39]. Based on the results of this study, we provide several recommendations for farmland preservation. First, to protect farmland and improve regional ESs, central and local governments should strictly control the area of new construction land and strengthen the construction of ecological cities and beautify countryside. In urban areas, the government could protect, plan and establish natural parks or green belts, including forests, grasses and wetlands. In rural areas, the government should promote reasonable planning for farmland use or exploitation. Governments can also ‘green’ abandoned industrial and mining land with forests, grasses or water bodies to improve ESs. Second, governments must strictly protect the red line of high-quality farmland and prohibit exploitation without rational reasons. Third, local governments should maintain the requisition–compensation balance of farmland, including the quantity, quality and ecological balance. For example, if the quality of compensatory farmland is lower than the quality of requisitioned farmland, then governments should invest more money to improve the quality of medium- and low-yield farmland or exploit new farmland rather than invest in urban construction [41]. Fourth, local governments should take measures to prevent environmental pollution, such as educating farmers to strictly control the use of agrochemicals and other soil additives to prevent soil pollution, and strictly prohibit the direct discharge of domestic sewage and industrial wastewater into rivers without treatment. Finally, the public should respond to government policies and protect the environment. For example, to protect the water and soil environment of farmland, enterprises and factories near farmland should strictly treat sewage according to regulations, and discharge the sewage only after it reaches the required standard. Farmers could reduce the use of pesticides and other chemicals to reduce the pollution of the farmland environment.

4.4. Limitations and Future Works

Estimates of ESV regionally and globally in monetary units play a critical role in heightening awareness and estimating the overall level of importance of ESs relative to and in combination with other contributors to sustainable human well-being [37]. Therefore, it is better for decision-makers and the public to consider the ESs as public goods or natural resources, and take these values into account when scenarios and policies are changed. However, this valuation method could not be used to examine the spatial changes in ESV. In addition, the ESV of construction land in this study was considered as zero, which is not appropriate in some degree and probably led to errors in the results. In our future work, we would like to combine the valuation methods and other evaluation methods to acquire more accurate results.
Farmland conservation and ecosystem services protection require cooperation in many aspects, including from governments, experts and the public. Therefore, it is necessary to build a system integrating geographic information system (GIS), spatial multicriteria evaluation (SME) and participatory GIS (PGIS) approaches, where decision-makers, experts and the public can participate and identify a range of ecosystem services [61,62,63,64]. Decision maker can easily collect and manage the results, which is useful for land use planning. That would be conducted in our future work.

5. Conclusions

This study explored the impacts of urbanization on farmland in the GBA from 1980 to 2018 based on multiple temporal land use datasets of the CNLUCC database. The ESV of farmland was also estimated by the valuation methods to study the ecosystem service changes caused by urbanization. Our results showed that the total area of farmland loss caused by urbanization was 3711.3 km2 over the past 38 years, leading to a direct decline in total ESVs by 5036.7 million yuan. Paddy fields suffered much more losses than dry farmland because of urbanization. The expansion of construction land increasingly became the dominant reason for farmland loss in the GBA with the influence increasing from 39.3% to 96.6%. The value of hydrological regulation, food production and gas regulation showed much more decline. Guangzhou, Dongguan, Foshan, Shenzhen and Huizhou had the greatest total ESV loss of farmland caused by urbanization. The social development background in China and local governments’ behavior played a vital role in the farmland conversion to construction land. To protect farmland and improve regional ESs, the central and local governments should strengthen the construction of ecological cities and beautify countryside by increasing capital investment, strengthening supervision, and raising public awareness of environmental protection, and the public should respond to land use policies and protect the environment.

Supplementary Materials

The following are available online at https://www.mdpi.com/article/10.3390/land10050501/s1, Figure S1: Conversion percentages of the different land use types into construction land in the GBA from 1980 to 2018, Table S1: ESV changes of the farmland in the GBA from 1980 to 2018 (million yuan).

Author Contributions

Conceptualization, X.W., F.Y. and F.S.; methodology, X.W. and F.Y.; formal analysis, X.W., M.C., B.H. and L.K.; writing—original draft preparation, X.W., Y.Z. and M.C.; writing—review and editing, X.W., F.Y., Y.Z. and F.S.; funding acquisition, X.W. and F.S. All authors have read and agreed to the published version of the manuscript.

Funding

This research was supported by the National Natural Science Foundation of China (41890854), the Program B for Outstanding Ph.D. Candidate of Nanjing University (No. 202002B087), and the China Scholarship Council (CSC) (No. 201906190120).

Institutional Review Board Statement

Not applicable.

Informed Consent Statement

Not applicable.

Data Availability Statement

Not applicable.

Acknowledgments

We appreciate critical and constructive comments and suggestions from the reviewers that helped improve the quality of this manuscript.

Conflicts of Interest

The authors declare no conflict of interest.

References

  1. Desa, U.N. World Urbanization Prospects: The 2014 Revision; United Nations Department of Economics and Social Affairs, Population Division: New York, NY, USA, 2015. [Google Scholar]
  2. Angel, S.; Parent, J.; Civco, D.L.; Blei, A.; Potere, D. The dimensions of global urban expansion: Estimates and projections for all countries, 2000–2050. Prog. Plan. 2011, 75, 53–107. [Google Scholar] [CrossRef]
  3. Lin, M.; Lin, T.; Sun, C.; Jones, L.; Sui, J.; Zhao, Y.; Liu, J.; Xing, L.; Ye, H.; Zhang, G.; et al. Using the Eco-Erosion Index to assess regional ecological stress due to urbanization—A case study in the Yangtze River Delta urban agglomeration. Ecol. Indic. 2020, 111, 106028. [Google Scholar] [CrossRef]
  4. Bai, X.; Shi, P.; Liu, Y. Society: Realizing China’s urban dream. Nature 2014, 509, 158–160. [Google Scholar] [CrossRef] [PubMed] [Green Version]
  5. Sun, Y.; Zhao, S. Spatiotemporal dynamics of urban expansion in 13 cities across the Jing-Jin-Ji Urban Agglomeration from 1978 to 2015. Ecol. Indic. 2018, 87, 302–313. [Google Scholar] [CrossRef]
  6. Yang, C.; Li, Q.; Zhao, T.; Liu, H.; Gao, W.; Shi, T.; Guan, M.; Wu, G. Detecting Spatiotemporal Features and Rationalities of Urban Expansions within the Guangdong–Hong Kong–Macau Greater Bay Area of China from 1987 to 2017 Using Time-Series Landsat Images and Socioeconomic Data. Remote Sens. 2019, 11, 2215. [Google Scholar] [CrossRef] [Green Version]
  7. Yang, X.J. China’s Rapid Urbanization. Science 2013, 342, 310. [Google Scholar] [CrossRef] [PubMed]
  8. Xiao, R.; Lin, M.; Fei, X.; Li, Y.; Zhang, Z.; Meng, Q. Exploring the interactive coercing relationship between urbanization and ecosystem service value in the Shanghai-Hangzhou Bay Metropolitan Region. J. Clean. Prod. 2020, 253, 119803. [Google Scholar] [CrossRef]
  9. Wang, X.; Yan, F.; Su, F. Impacts of Urbanization on the Ecosystem Services in the Guangdong-Hong Kong-Macao Greater Bay Area, China. Remote Sens. 2020, 12, 3269. [Google Scholar] [CrossRef]
  10. Jiang, L.; Deng, X.; Seto, K.C. The impact of urban expansion on agricultural land use intensity in China. Land Use Policy 2013, 35, 33–39. [Google Scholar] [CrossRef]
  11. Mao, D.; Wang, Z.; Wu, J.; Wu, B.; Zeng, Y.; Song, K.; Yi, K.; Luo, L. China’s wetlands loss to urban expansion. Land Degrad. Dev. 2018, 29, 2644–2657. [Google Scholar] [CrossRef]
  12. Narducci, J.; Quintas-Soriano, C.; Castro, A.; Som-Castellano, R.; Brandt, J.S. Implications of urban growth and farmland loss for ecosystem services in the western United States. Land Use Policy 2019, 86, 1–11. [Google Scholar] [CrossRef]
  13. Jones, N.; de Graaff, J.; Duarte, F.; Rodrigo, I.; Poortinga, A. Farming systems in two less favoured areas in Portugal: Their development from 1989 to 2009 and the implications for sustainable land management. Land Degrad. Dev. 2014, 25, 29–44. [Google Scholar] [CrossRef]
  14. Huang, Z.; Du, X.; Castillo, C.S.Z. How does urbanization affect farmland protection? Evidence from China. Resour. Conserv. Recycl. 2019, 145, 139–147. [Google Scholar] [CrossRef] [Green Version]
  15. Tu, Y.; Chen, B.; Yu, L.; Xin, Q.; Gong, P.; Xu, B. How does urban expansion interact with cropland loss? A comparison of 14 Chinese cities from 1980 to 2015. Landsc. Ecol. 2020. [Google Scholar] [CrossRef]
  16. Song, W.; Pijanowski, B.C.; Tayyebi, A. Urban expansion and its consumption of high-quality farmland in Beijing, China. Ecol. Indic. 2015, 54, 60–70. [Google Scholar] [CrossRef]
  17. Chapin Iii, F.S.; Zavaleta, E.S.; Eviner, V.T.; Naylor, R.L.; Vitousek, P.M.; Reynolds, H.L.; Hooper, D.U.; Lavorel, S.; Sala, O.E.; Hobbie, S.E.; et al. Consequences of changing biodiversity. Nature 2000, 405, 234–242. [Google Scholar] [CrossRef]
  18. Butler, S.J.; Vickery, J.A.; Norris, K. Farmland Biodiversity and the Footprint of Agriculture. Science 2007, 315, 381. [Google Scholar] [CrossRef]
  19. Tilman, D.; Fargione, J.; Wolff, B.; Antonio, C.; Dobson, A.; Howarth, R.; Schindler, D.; Schlesinger, W.H.; Simberloff, D.; Swackhamer, D. Forecasting Agriculturally Driven Global Environmental Change. Science 2001, 292, 281. [Google Scholar] [CrossRef] [PubMed] [Green Version]
  20. Gren, Å.; Andersson, E. Being efficient and green by rethinking the urban-rural divide—Combining urban expansion and food production by integrating an ecosystem service perspective into urban planning. Sustain. Cities Soc. 2018, 40, 75–82. [Google Scholar] [CrossRef]
  21. Zhang, W.; Wang, W.; Li, X.; Ye, F. Economic development and farmland protection: An assessment of rewarded land conversion quotas trading in Zhejiang, China. Land Use Policy 2014, 38, 467–476. [Google Scholar] [CrossRef]
  22. Pandey, B.; Seto, K.C. Urbanization and agricultural land loss in India: Comparing satellite estimates with census data. J. Environ. Manag. 2015, 148, 53–66. [Google Scholar] [CrossRef] [PubMed]
  23. Sutton, M.A.; Oenema, O.; Erisman, J.W.; Leip, A.; van Grinsven, H.; Winiwarter, W. Too much of a good thing. Nature 2011, 472, 159–161. [Google Scholar] [CrossRef] [Green Version]
  24. Costanza, R.; d’Arge, R.; de Groot, R.; Farber, S.; Grasso, M.; Hannon, B.; Limburg, K.; Naeem, S.; O’Neill, R.V.; Paruelo, J.; et al. The value of the world’s ecosystem services and natural capital. Nature 1997, 387, 253–260. [Google Scholar] [CrossRef]
  25. Xie, G.; Zhen, L.; Lu, C.; Xiao, Y.; Chen, C. Expert Knowledge Based Valua tion Method of Ecosystem Services in China. J. Nat. Resour. 2008, 23, 911–919. [Google Scholar] [CrossRef]
  26. Xie, G.; Zhang, C.; Zhang, L.; Chen, W.; Li, S. Improvement of the Evaluation Method for Ecosystem Service Value Based on Per Unit Area. J. Nat. Resour. 2015, 30, 1243–1254. [Google Scholar] [CrossRef]
  27. Xu, L.; Xu, X.; Luo, T.; Zhu, G.; Ma, Z. Services based on land use: A case study of Bohai Rim. Geogr. Res. 2012, 31, 1775–1784. [Google Scholar]
  28. Xiao, H.; Li, H.; Wang, L.; Chen, J.; Han, Y. Changes of Land Use and Ecosystem Service Value in the Guangdong-Hong Kong-Macao Greater Bay Area-A Case Study of Guangdong-Foshan-Zhaoqing. Res. Soil. Water. Conserv. 2020, 27, 290–297. [Google Scholar] [CrossRef]
  29. Kang, L.; Ma, L.; Liu, Y. Evaluation of farmland losses from sea level rise and storm surges in the Pearl River Delta region under global climate change. J. Geog. Sci. 2016, 26, 439–456. [Google Scholar] [CrossRef] [Green Version]
  30. Deuskar, C.; Baker, J.L.; Mason, D. East Asia’s Changing Urban Landscape: Measuring a Decade of Spatial Growth; World Bank Publications: Washington, DC, USA, 2015. [Google Scholar]
  31. Seto, K.C.; Güneralp, B.; Hutyra, L.R. Global forecasts of urban expansion to 2030 and direct impacts on biodiversity and carbon pools. Proc. Natl. Acad. Sci. USA 2012, 109, 16083. [Google Scholar] [CrossRef] [Green Version]
  32. Wu, W.; Zhao, S.; Zhu, C.; Jiang, J. A comparative study of urban expansion in Beijing, Tianjin and Shijiazhuang over the past three decades. Landsc. Urban Plan. 2015, 134, 93–106. [Google Scholar] [CrossRef]
  33. Zhang, J.; Li, H.; Zhou, Y.; Dou, L.; Cai, L.; Mo, L.; You, J. Bioavailability and soil-to-crop transfer of heavy metals in farmland soils: A case study in the Pearl River Delta, South China. Environ. Pollut. 2018, 235, 710–719. [Google Scholar] [CrossRef] [PubMed]
  34. Yang, C.; Li, Q.; Hu, Z.; Chen, J.; Shi, T.; Ding, K.; Wu, G. Spatiotemporal evolution of urban agglomerations in four major bay areas of US, China and Japan from 1987 to 2017: Evidence from remote sensing images. Sci. Total Environ. 2019, 671, 232–247. [Google Scholar] [CrossRef] [PubMed]
  35. Xu, X.; Liu, J.; Zhang, S.; Li, R.; Yan, C.; Wu, S. China’s Multi-Period Land Use Land Cover Remote Sensing Monitoring Data Set (CNLUCC); Resource and Environment Data Science and Data Center, Institute of Geographic Sciences and Natural Resources Research, Chinese Academy of Sciences: Beijing, China, 2018. [Google Scholar] [CrossRef]
  36. Xie, G.; Li, W.; Xiao, Y.; Zhang, B.; Lu, C.; An, K.; Wang, J.; Xu, K.; Wang, J. Forest ecosystem services and their values in Beijing. Chin. Geogr. Sci. 2010, 20, 51–58. [Google Scholar] [CrossRef]
  37. Costanza, R.; de Groot, R.; Sutton, P.; van der Ploeg, S.; Anderson, S.J.; Kubiszewski, I.; Farber, S.; Turner, R.K. Changes in the global value of ecosystem services. Glob. Environ. Chang. 2014, 26, 152–158. [Google Scholar] [CrossRef]
  38. Yao, Z.; Zhang, L.; Tang, S.; Li, X.; Hao, T. The basic characteristics and spatial patterns of global cultivated land change since the 1980s. J. Geog. Sci. 2017, 27, 771–785. [Google Scholar] [CrossRef] [Green Version]
  39. Wang, J.; Lin, Y.; Glendinning, A.; Xu, Y. Land-use changes and land policies evolution in China’s urbanization processes. Land Use Policy 2018, 75, 375–387. [Google Scholar] [CrossRef]
  40. Zhou, C.; Wang, Y.; Xu, Q.; Li, S. The new process of urbanization in the Pearl River Delta. Geogr. Res. 2019, 38, 45–63. [Google Scholar]
  41. Liu, L.; Liu, Z.; Gong, J.; Wang, L.; Hu, Y. Quantifying the amount, heterogeneity, and pattern of farmland: Implications for China’s requisition-compensation balance of farmland policy. Land Use Policy 2019, 81, 256–266. [Google Scholar] [CrossRef]
  42. Cheng, L.; Jiang, P.; Chen, W.; Li, M.; Wang, L.; Gong, Y.; Pian, Y.; Xia, N.; Duan, Y.; Huang, Q. Farmland protection policies and rapid urbanization in China: A case study for Changzhou City. Land Use Policy 2015, 48, 552–566. [Google Scholar] [CrossRef]
  43. Mishra, V. Population growth and intensification of land use in India. Int. J. Popul. Geogr. 2002, 8, 365–383. [Google Scholar] [CrossRef]
  44. Reddy, V.R.; Reddy, B.S. Land alienation and local communities: Case studies in Hyderabad- Secunderabad. Econ. Political Wkly. 2007, 42, 3233–3240. [Google Scholar]
  45. Chien, S. Local farmland loss and preservation in China—A perspective of quota territorialization. Land Use Policy 2015, 49, 65–74. [Google Scholar] [CrossRef]
  46. Tian, L. Land use dynamics driven by rural industrialization and land finance in the peri-urban areas of China: “The examples of Jiangyin and Shunde”. Land Use Policy 2015, 45, 117–127. [Google Scholar] [CrossRef]
  47. Huang, Z.; Cao, J. Ergodicity and bifurcations for stochastic logistic equation with non-Gaussian Lévy noise. Appl. Math. Comput. 2018, 330, 1–10. [Google Scholar] [CrossRef]
  48. Huang, Z.; Du, X. Government intervention and land misallocation: Evidence from China. Cities 2017, 60, 323–332. [Google Scholar] [CrossRef]
  49. Cao, G.; Feng, C.; Tao, R. Local “Land Finance” in China’s Urban Expansion: Challenges and Solutions. China World Econ. 2008, 16, 19–30. [Google Scholar] [CrossRef]
  50. Cheng, X.; Zheng, H.; Duan, W.; Hao, X.; Duan, W. Fault restoration based on the path analysis for distribution grid. In Proceedings of the 2015 IEEE International Conference on Information and Automation, Beijing, China, 8–10 August 2015; pp. 552–556. [Google Scholar]
  51. Tao, R.; Su, F.; Liu, M.; Cao, G. Land leasing and local public finance in China’s regional development: Evidence from prefecture-level cities. Urban Stud. 2010, 47, 2217–2236. [Google Scholar] [CrossRef]
  52. Jiang, L.; Deng, X.; Seto, K.C. Multi-level modeling of urban expansion and cultivated land conversion for urban hotspot counties in China. Landsc. Urban Plan. 2012, 108, 131–139. [Google Scholar] [CrossRef]
  53. Musinguzi, P.; Ebanyat, P.; Tenywa, J.; Basamba, T.; Tenywa, M.; Mubiru, D. Precision of farmerbased fertility ratings and soil organic carbon for crop production on a Ferralsol. Solid Earth 2015, 6, 1063–1073. [Google Scholar] [CrossRef] [Green Version]
  54. Kong, X. China must protect high-quality arable land. Nature 2014, 506, 7. [Google Scholar] [CrossRef]
  55. Su, S.; Jiang, Z.; Zhang, Q.; Zhang, Y. Transformation of agricultural landscapes under rapid urbanization: A threat to sustainability in Hang-Jia-Hu region, China. Appl. Geogr. 2011, 31, 439–449. [Google Scholar] [CrossRef]
  56. Bai, X.; McPhearson, T.; Cleugh, H.; Nagendra, H.; Tong, X.; Zhu, T.; Zhu, Y.-G. Linking Urbanization and the Environment: Conceptual and Empirical Advances. Annu. Rev. Environ. Resour. 2017, 42, 215–240. [Google Scholar] [CrossRef] [Green Version]
  57. Boserup, E. The Conditions of Agricultural Growth the Economics of Agrarian Change under Population Pressure; Routledge: London, UK, 1965. [Google Scholar]
  58. Hu, Y.; Liu, X.; Bai, J.; Shih, K.; Zeng, E.Y.; Cheng, H. Assessing heavy metal pollution in the surface soils of a region that had undergone three decades of intense industrialization and urbanization. Environ. Sci. Pollut. Res. 2013, 20, 6150–6159. [Google Scholar] [CrossRef] [PubMed]
  59. Deshpande, A.; Mishra, P. Urbanization, air pollution and human health. J. Environ. Res. Dev 2007, 1, 13. [Google Scholar]
  60. Xu, G.; Jiao, L.; Zhao, S.; Yuan, M.; Li, X.; Han, Y.; Zhang, B.; Dong, T. Examining the impacts of land use on air quality from a spatio-temporal perspective in Wuhan, China. Atmosphere 2016, 7, 62. [Google Scholar] [CrossRef] [Green Version]
  61. Modica, G.; Zoccali, P.; Di Fazio, S. The e-Participation in Tranquillity Areas Identification as a Key Factor for Sustainable Landscape Planning. In Computational Science and Its Applications—ICCSA 2013; Springer: Berlin, Germany, 27 June 2013; pp. 550–565. [Google Scholar] [CrossRef]
  62. Modica, G.; Pollino, M.; La Porta, L.; Di Fazio, S. Proposal of a Web-Based Multi-criteria Spatial Decision Support System (MC-SDSS) for Agriculture. In Innovative Biosystems Engineering for Sustainable Agriculture, Forestry and Food Production; Springer Nature: Cham, Switzerland, 2020; pp. 333–341. [Google Scholar] [CrossRef]
  63. Jelokhani-Niaraki, M. Collaborative spatial multicriteria evaluation: A review and directions for future research. Int. J. Geog. Inf. Sci. 2020, 35, 9–42. [Google Scholar] [CrossRef]
  64. Brown, G.; Fagerholm, N. Empirical PPGIS/PGIS mapping of ecosystem services: A review and evaluation. Ecosyst. Serv. 2015, 13, 119–133. [Google Scholar] [CrossRef]
Figure 1. Location of the Greater Bay Area (GBA): from top to bottom, from left to right, cities are Hezhou (HZ), Wuzhou (WZ), Yangjiang (YJ), Zhaoqing (ZQ), Qingyuan (QY), Guangzhou (GZ), Foshan (FS), Jiangmen (JM), Zhongshan (ZS), Zhuhai (ZH), Macao (MC), Dongguan (DG), Shenzhen (SZ), Hong Kong (HK), Huizhou (HZ), Heyuan (HY), Shanwei (SW).
Land 10 00501 g001
Figure 2. Construction land evolution of the GBA from 1980 to 2018: (ac) are the growth of construction land for the total GBA, different types of construction land and 11 cities, respectively; (df) present the annual change area (ACA) of the construction land of the total GBA, different types and 11 cities, respectively. URL: urban residential land; RRL: rural residential land; OCL: other construction land.
Land 10 00501 g002
Figure 3. Farmland evolution of the GBA from 1980 to 2018: (ac) are the change of farmland for the total GBA, different types and 11 cities, respectively; (df) present the ACA of farmland of the total GBA, different types and 11 cities, respectively.
Land 10 00501 g003
Figure 4. Spatial and temporal distribution of farmland loss due to urbanization in the GBA from 1980 to 2018.
Land 10 00501 g004
Figure 5. Farmland loss due to urbanization in the GBA during the four study periods: (a) is the area of farmland converted to construction land in the GBA during the four study periods; (b) presents the percentage of the area of farmland converted to construction land in the total area of farmland loss in the GBA during the four study periods; (c) shows the variation among the losses of different farmland categories due to urbanization in the GBA during the four study periods; (d) is the variations in the area of farmland converted into different categories of construction land in the GBA during the four study periods; and (e) shows the area of farmland converted to construction land in the 11 cities during the four study periods. URL: urban residential land; RRL: rural residential land; OCL: other construction land.
Land 10 00501 g005
Figure 6. The ecosystem service value (ESV) loss of farmland encroached by urbanization in the GBA during the four study periods: (a) is the ESV loss of farmland converted to construction land in the GBA during the four study periods; (b) is the ESV loss of different farmland types converted to construction land in the GBA during the four study periods; (c) shows the variation of ecosystem service losses of farmland due to urbanization in the GBA during the four study periods; and (d) is the ESV loss of farmland converted to construction land in the 11 cities during the four study periods.
Land 10 00501 g006
Figure 7. Spatial and temporal distribution of ESV loss of farmland because of urbanization in 11 cities in the four study periods.
Land 10 00501 g007
Table 1. Classification of farmland and construction land in this study.
Primary ClassesSubclassesImplications
Farmland This refers to land for planting crops, including cultivated land, newly opened wasteland, leisure land, rotation rest land, grassland rotation cropland, land for fruits such as mulberry, agriculture and forest areas mainly for planting crops, and beach and sea land areas cultivated for longer than three years.
Paddy fieldsThis refers to cultivated land with guaranteed water sources and irrigation facilities, which are commonly irrigated in normal years and used to grow aquatic crops such as rice and lotus root, including cultivated land under rotation of rice and dry farmland crops.
Dry farmlandThis refers to cultivated land for dry crops without irrigation water sources and facilities, cultivated land for dry crops that contain water sources and irrigation facilities, which are commonly irrigated in normal years, the cultivated land used mainly for planting vegetables, and the leisure land and rotation land under normal rotation.
Construction land This refers to urban and rural residential areas and industrial, mining, transportation and other land areas.
Urban residential landThis refers to land for large, medium and small cities and built-up areas larger than counties and towns.
Rural residential landThis refers to rural residential areas independent from construction land.
Other construction landThis refers to land for factories, mines, large industrial areas, oil fields, salt fields, quarries, etc., and roads, airports and special land.
Publisher’s Note: MDPI stays neutral with regard to jurisdictional claims in published maps and institutional affiliations.

