Article

Examining the Coupling Coordinated Relationship between Urban Industrial Co-Agglomeration and Intensive Land Use

1
Business School, Sichuan University, Chengdu 610065, China
2
The Economy and Enterprise Development Institute, Sichuan University, Chengdu 610065, China
*
Author to whom correspondence should be addressed.
Land 2021, 10(5), 499; https://doi.org/10.3390/land10050499
Submission received: 23 March 2021 / Revised: 22 April 2021 / Accepted: 6 May 2021 / Published: 8 May 2021
(This article belongs to the Special Issue Integrated Approach to Land Use Change Assessment)

Abstract

:
Exploring the dynamic relationship and coupling coordination between urban industrial co-agglomeration and intensive land use is vital to ensure high-quality urban development. Based on an industrial co-agglomeration model, a revised intensive land use model, and a coupling coordination model, this paper comprehensively measured the urban industrial co-agglomeration and intensive land use coupling coordination in eight cities in the Chengdu metropolitan area from 2004 to 2018. It was found that despite the structural adjustment of the secondary and tertiary industries during the study period, the industrial co-agglomeration in the Chengdu metropolitan area fluctuated, the intensive urban land use had spatial characteristics that were decreasing from the center to the periphery, and while the general coupling coordination level was increasing, the increase rate in each city was different. The coupling coordination between the urban industry co-agglomeration and the intensive land use was found to have “low-high-low” spatial characteristics from the southwest to the northeast of the Chengdu metropolitan area, which revealed the core position of Chengdu. Suggestions are provided to improve the industrial co-agglomeration and intensive urban land use coupling coordination.

1. Introduction

Over the past 30 years, China has rapidly urbanized, with the urbanization rate reaching 59.58% in 2018 [1]. Consequently, as a result of increased urban interactions and connectivity, metropolitan areas have been increasing [2] and there have been significant industrial agglomeration and intensive urban land use changes. Therefore, when analyzing the urban development problems in China, it is not only necessary to examine the urban space scale expansions and urban population agglomerations, but also to comprehensively consider upgrading urban industries and transforming economic growth patterns. As cities encompass both residential requirements and industry, it is necessary to carefully plan the use of urban land. The continual need for land for urban residential and industrial construction has resulted in problems such as a scarcity of urban land resources and a lack of underground land use efficiency [3,4,5]. The urbanization of the Chengdu metropolitan area has been accelerating since 2005, which has significantly affected its sustainable development. Therefore, there has been an increased focus on coordinated land use development and functional optimization in Chengdu’s current and future development planning [6].
Previous studies have examined the relationships between industry co-aggregation, and intensive land use. For example, the collaborative industry agglomeration proposed by Ellison and Glaeser was focused on the geographical proximity of heterogeneous industries that had input-output linkages [7]. Early stage industrial agglomeration research has often revolved around a single industry, with later stage collaborative industry agglomeration examining the relationships between heterogeneous industries, such as the co-agglomeration of producer services and manufacturing [8,9]. Industrial synergistic agglomeration, however, determines the complementary synergies between industries to ensure a rational allocation of factors between the various industries, with the basic theoretical bases being externality theory, “center-periphery” theory, and heterogeneity theory [10]. Externality theory has industry co-aggregation as its foundation, “center-periphery” theoretical models are focused on spatial factors, and vertical correlation models are focused on industry heterogeneity [11,12]. Based on these theories and models, in-depth studies have been conducted on the connotations and measurements for industry co-aggregations, for which the Ellsion–Glaeser (EG) index [13], the Duranton–Overman (DO) index [14], the spatial Gini Coefficients [15] and the location entropy index [16] have been widely used [16,17]. With the deepening of research, the focus of scholars extends from the measurement of industrial agglomeration to the impact of industrial agglomeration [18,19]. For example, Wang et al. examined the impact of industrial agglomeration on environmental performance in China, and found that it is a U-shape relationship between industrial agglomeration and environmental efficiency [20] Chu et al. believe that industrial agglomeration can promote land intensive use [21]. Related research on intensive land use has focused on three main aspects: (1) connotation and theoretical research on intensive land use, which mainly elaborates on the urban land use structure, intensity, benefit, etc. [22]; (2) the measurement of intensive land use levels, which is mainly based on the connotation and theory of the intensive use of urban land to construct an index system for evaluation, and then use the comprehensive evaluation method [23,24]; and (3) analyses of the impact mechanism for intensive land use. Then based on the analysis, the improvement path of urban land intensive use is proposed [25]. Research on cooperative industry agglomeration and intensive land use, however, has the following shortcomings. First, intensive land use research has tended to consider the input-output benefits and paid less attention to sustainable land use. Second, research has mostly focused on a single instance of industrial agglomeration or intensive land use, with little research focus on coordinated development. Third, the study area is less involved than metropolitan areas, there has been little systematic research on the coordinated development of urban industrial clusters and intensive land use in metropolitan areas.
To promote inter-regional coordinated urban development, metropolitan space organization is important [26]. In the “new normal” Chinese economy context, urban industrial upgrading and supply side structural reforms have shown the need for industrial co-agglomeration because of the scarcity of supply and the demand for certain elements, with supply speed, size, and stability often being influenced by the spatial agglomeration [27]. However, metropolitan area urban industrial co-aggregation has both intensive land use challenges and opportunities. Because of scarce land resources, urban industry co-aggregation is necessary to promote industrial agglomeration, improve the supply efficiency of other elements, and increase urban economic factor productivity and resource allocation efficiency [28]. As land resources are an important factor in realizing urban industry agglomeration, to ensure high-quality urban developments, industry co-aggregation and intensive land use need to be coordinated, which requires: (1) an understanding of current industrial co-concentration and intensive land use in the Chengdu metropolitan area; and (2) determining the suitable coordinated development level to ensure sustainable development in the Chengdu metropolitan area.
To address these two main concerns, this paper used an industrial co-agglomeration model to calculate the industrial co-agglomeration levels in eight cities in the Chengdu metropolitan area from 2004 to 2018. Then, a modified three-dimensional urban intensive land use model was developed to comprehensively measure the intensive urban land use. Finally, a coupling urban industrial co-agglomeration and intensive land use coordination model was constructed to conduct a comprehensive analysis of the coupling and coordination degree of the urban industrial co-aggregation and intensive land use in Chengdu. The results are a valuable reference for the implementation of associated policies in China.

2. Materials and Methods

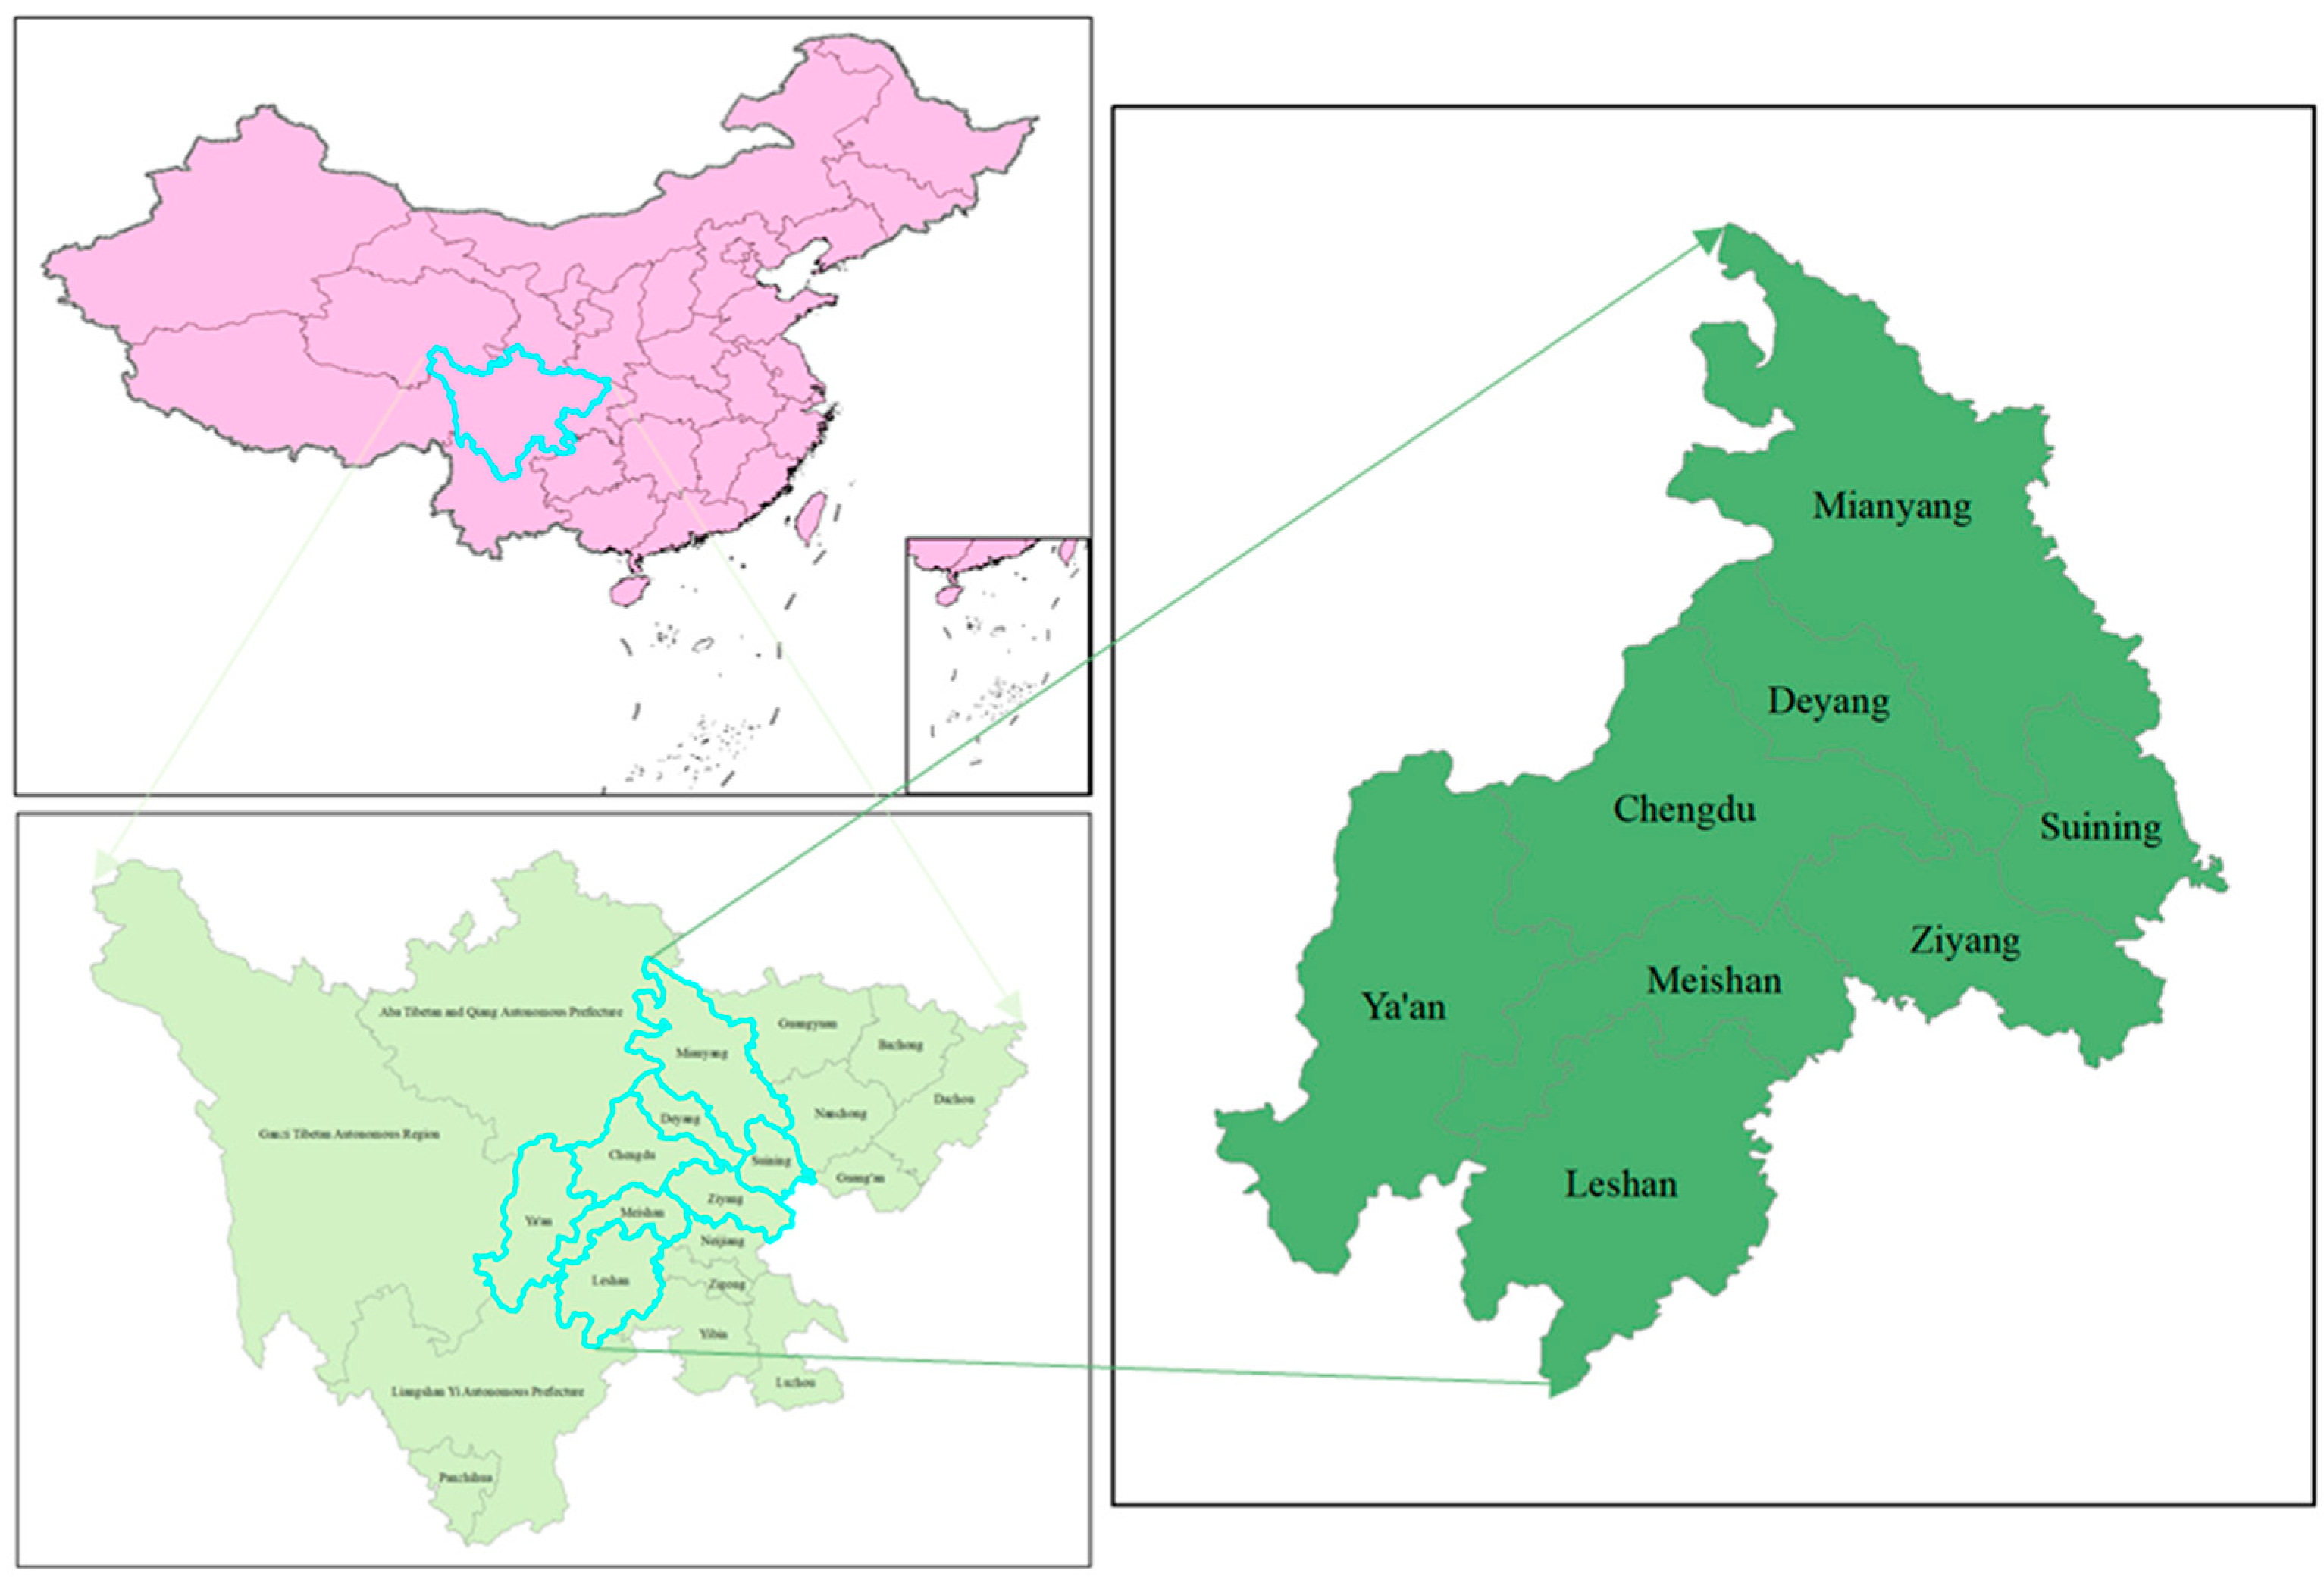
2.1. Study Area and Data Resources

Located in the upper reaches of the Yangtze River, the Chengdu metropolitan area is one of the most densely populated areas in southwest China and is an important western regional development hub, as shown in Figure 1. The Chengdu metropolitan area, the Wuhan metropolitan area, and the Yangtze River Delta metropolitan area are the three most important industrial agglomeration centers in the Yangtze River basin. This paper consulted the 2003 Chengdu Urban Key Research Project “Chengdu Metropolitan Area Battle Road Planning Study” to select eight cities in the Chengdu Metropolitan Area; Chengdu, Ya’an, Leshan, Meishan, Ziyang, Suining, Mianyang and Deyang; for the research.
Data on the urban construction land proportion in the urban areas were extracted from the China City Statistical Yearbooks (2005–2019), the data for the inputs; fixed assets, employees, fiscal revenue, population, and the total administrative regional land areas; were extracted from the Sichuan Statistical Yearbooks (2005–2019), and the data for the fixed assets and the number of employee inputs in Chengdu were extracted from the Chengdu Statistical Yearbooks (2005–2019).

2.2. Urban Industrial Co-Aggregation

Industrial agglomeration is a measure of urban industrial concentration, with the most commonly used assessment methods being the Herfindahl index, the spatial Gini coefficient, and the location entropy index. As the location entropy index can eliminate any regional scale differences and truly reflect the spatial distribution of the geographic elements, the location entropy index was chosen to characterize the urban industrial agglomeration [29]. First, the agglomeration levels of the secondary and tertiary industries were calculated based on the location entropy index.
A g g l o s e c / t h i r = E i j / E i E k j / E k
where, A g g l o s e c and A g g l o t h i r respectively represented the agglomeration level of the city’s secondary and tertiary industries, E i j was the output value of industry j in city i, E i was the GDP of city i, E k j was the output value of industry j in province k where the city is located, and E k was the GDP in province k. Eight cities in the Chengdu metropolitan area of Sichuan Province were selected; Chengdu, Ya’an, Leshan, Meishan, Ziyang, Suining, Deyang, and Mianyang.
Drawing lessons from Yang [30], the urban industry co-agglomeration was calculated;
C o A g g l o = 1 | A g g l o s e c A g g l o t h i r | | A g g l o s e c + A g g l o t h i r |
where C o A g g l o indicated the urban industrial co-aggregation level.

2.3. Urban Land Use

The focus for this intensive urban land use research was on the production efficiencies and economic benefits needed to realize the sustainable use of land resources [31]. The uncoordinated development of urban land input, output, and the carrying subsystems can seriously affect the sustainable development of cities [32]; therefore, based on the traditional intensive urban land use model [33], an intensive urban land use model was developed and a three-dimensional intensive urban spatial land use model was constructed, as shown in Figure 2. In Figure 2, the X-axis represents the urban land input, the Y-axis represents the urban land output, and the Z-axis represents the urban land carrying capacity. The best intensive urban land use is shown with the vector O P , and the actual intensive urban land use development direction is shown with the vector O A . The ratio of the modulus of the intensive urban land use level vector (OA’) to vector O P modulus, O A is the projection of the vector O A towards the most ideal situation.
U i j = x i j 2 + y i j 2 + z i j 2 3 × c o s α i j
where, U i j indicates the intensive urban land use level; and xij, yij, zij, respectively, indicate the urban land input index, the urban land output index, and urban land carrying index. As in previous studies [34,35,36], the land input index in this paper was calculated based on the average fixed asset land input and the number of employees per square kilometer input, the land output index was based on the average land output value and the average land fiscal revenue, and the land carrying index was based on population density and the urban construction land proportion in the urban area. The index calculations used the extreme value method and the mean value method, in which α i j represented the angle between the actual development direction and the ideal intensive urban land use.

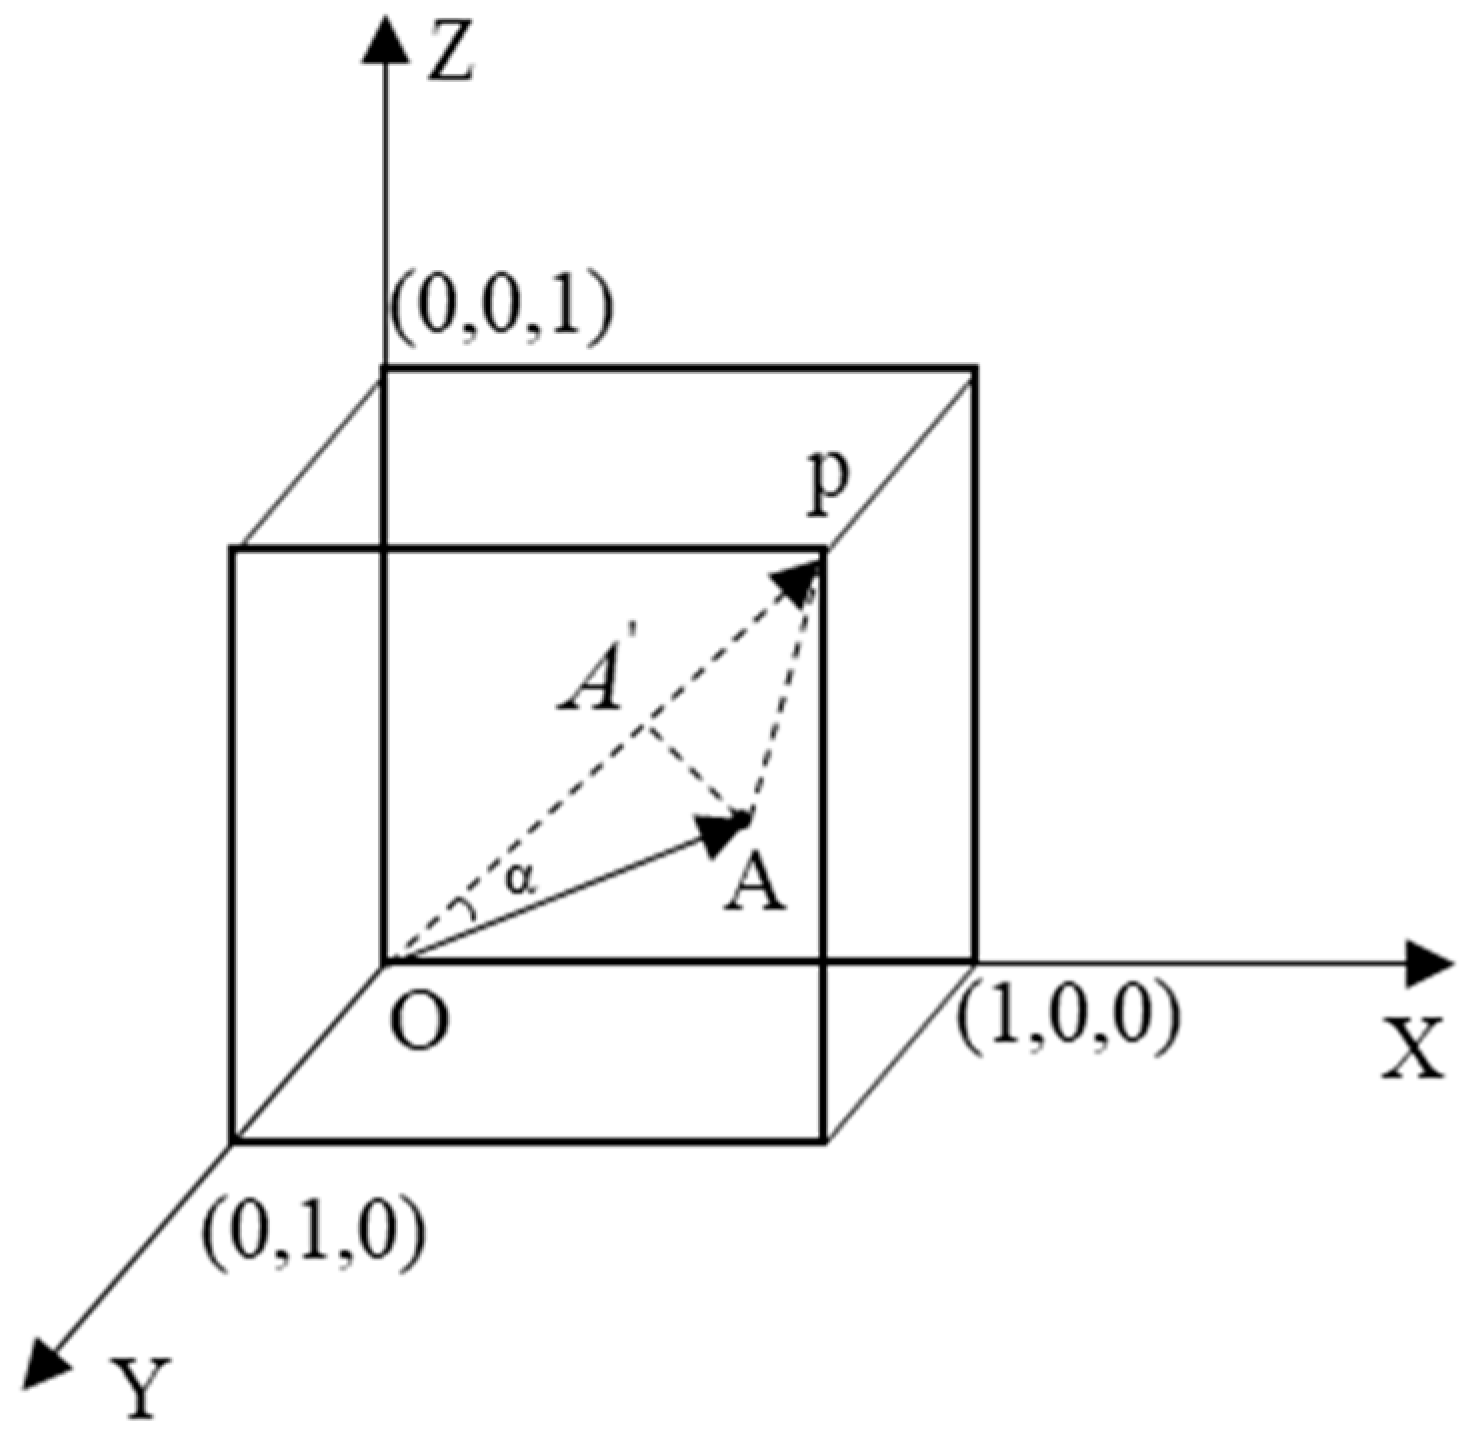
2.4. Coupling Coordination Model

After determining the urban industrial co-aggregation and intensive urban land use, as in previous research, the physics capacity coupling concept and the capacity coordination coefficient model were consulted to construct an urban industrial co-aggregation and intensive urban land use coupling degree model [37].
C i j = [ U i j × C o A g g l o i j ( U i j + C o A g g l o i j 2 ) 2 ] 1 2
where C i j was the intensive land use and industrial co-agglomeration coupling degree in the jth year in city i, C [ 0 , 1 ] . The more C tended to 0, the worse the coupling state, with C = 0 indicating the worst coupling state. The more C tended to 1, the more effective the coupling state of the two, and when C = 1, the collaborative agglomeration of urban industry and the intensive land use were in the best coupling state.
Based on the above coupling degree function, the coupling state of the intensive urban land use and industrial co-agglomeration was calculated. However, when the coupling degree model was used alone, there was a pseudo coordination problem, which meant that the industrial co-agglomeration and intensive urban land use coordination were not truly represented. Therefore, the coupling coordination degree model was further developed [38].
D i j = ( C i j × T i j ) k
T i j = α U i j + β C o A g g l o i j
where, D i j was the coupling coordination degree between the collaborative industry agglomeration and the intensive land use in the jth year in city i, T i j was the reconciliation index for the coordinated industrial agglomeration and intensive land use in the jth year in city i, and α, β, k were the undetermined coefficients with the general values, k = 0.5, and α = β = 0.5.
Based on D i j , the coordination types between the urban industrial co-agglomeration and intensive land use were divided into ten classes, as shown in Table 1 [39,40].

3. Results and Analysis

3.1. Urban Industrial Co-Agglomeration Analysis

Based on Formulas (1) and (2), the industrial urban co-agglomeration levels in each Chengdu metropolitan area city were calculated, the results of which are shown in Figure 3. In most cities, the urban industrial co-agglomeration level had risen, which indicated that the differences between the secondary and tertiary industry agglomeration levels in these cities had decreased. The industrial urban co-agglomeration levels in Ziyang, Suining, and Mianyang dropped significantly, from 0.9444, 0.9330, and 0.9645 to 0.6677, 0.6818, and 0.8813, respectively, indicating that the agglomeration between the secondary and tertiary industries had increased. However, Meishan, Deyang, and Ya’an had relatively minor changes in their industrial urban co-agglomeration levels.

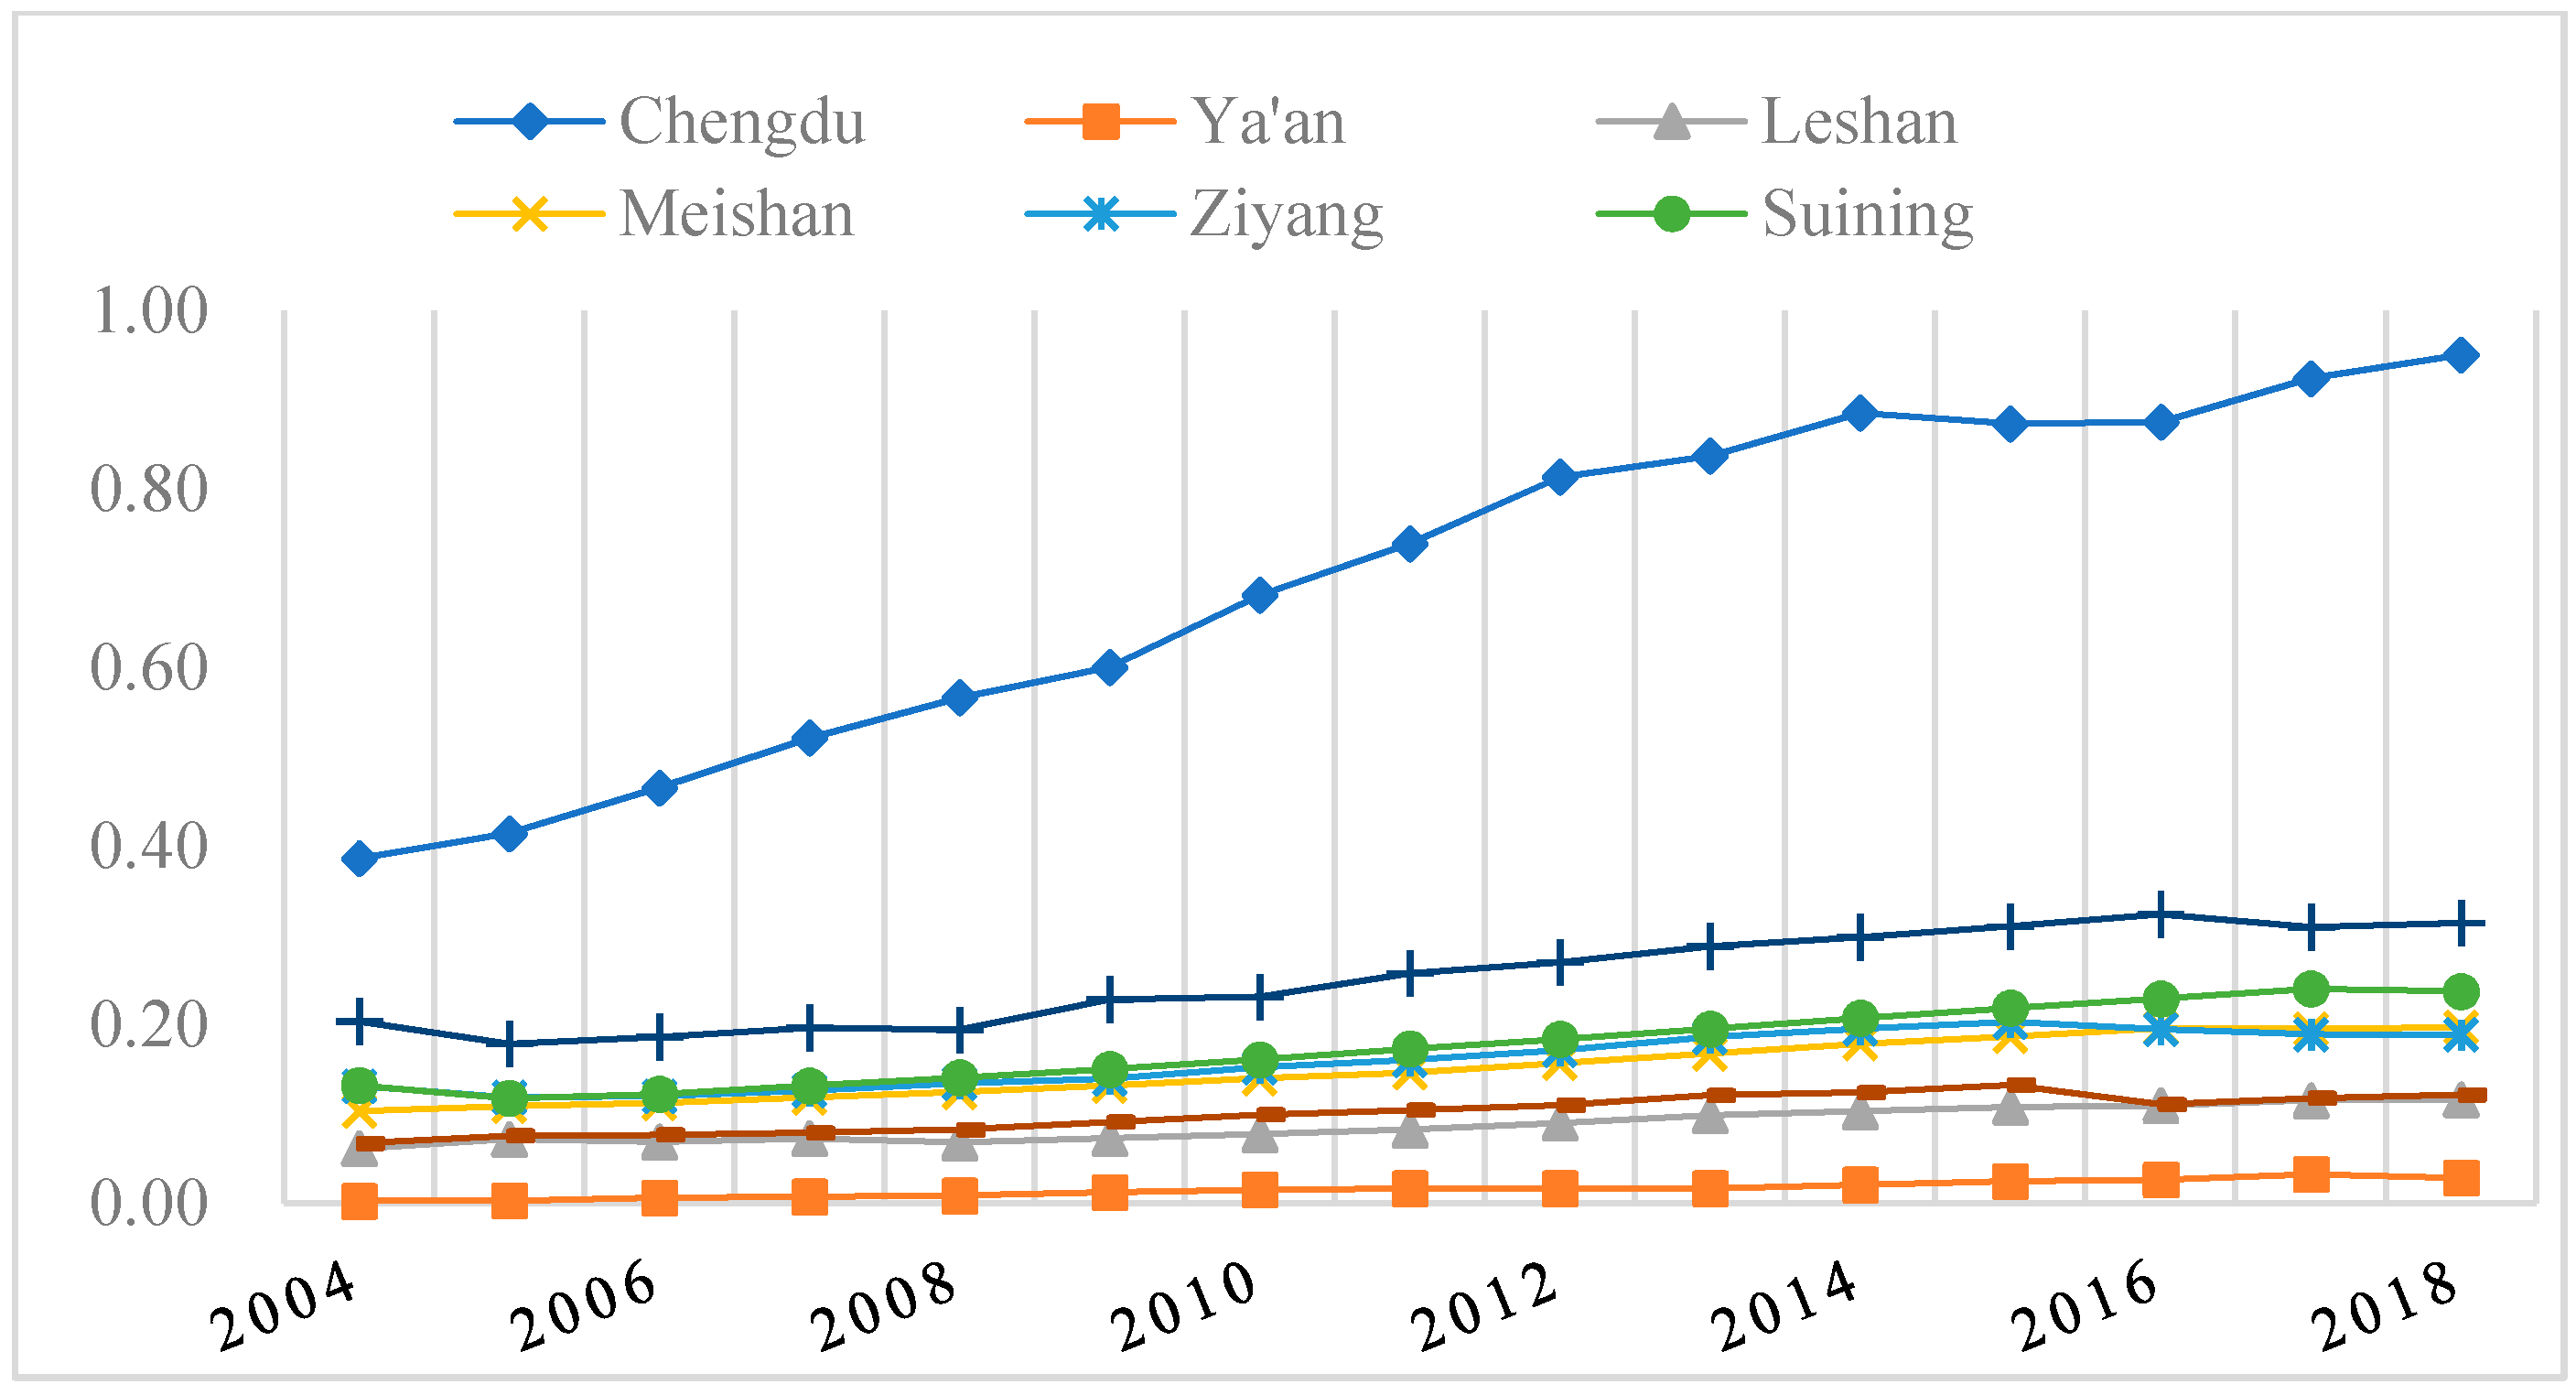
3.2. Intensive Urban Land Use Analysis

Based on the three-dimensional intensive spatial urban land use model, the intensive land use levels in the eight cities were calculated, the results for which are shown in Figure 4. As shown in Figure 4, while the intensive land use level in the Chengdu metropolitan area had an upward trend year on year, the growth rate varied. The intensive land use level in Chengdu was far ahead of the other cities, rising from 0.3862 in 2004 to 0.9501, an increase of 0.5639; however, the growth rate gradually slowed in later years. The other seven cities had relatively low growth rates, with the highest of these being in Deyang, which increased by 0.1102 to 0.3138, and the lowest of which being in Ya’an, which increased by 0.0259 to 0.0282.
The intensive urban land use level in the Chengdu metropolitan area had a circle-layered spatial structure that was characteristic of a decreasing center-periphery, as shown in Figure 5. Chengdu, in the center of the urban circle, had the highest intensive land use level at 0.9501 in 2018 and an average value of 0.7019, followed by Deyang and Suining, which, respectively, rose to 0.3138 and 0.2371 in 2018, and had respective averages of 0.2525 and 0.1605. Ya’an had the lowest intensive land use level and an average of 0.0156, which increased to 0.0282 in 2018; however, there was still a sizeable gap compared to Chengdu.

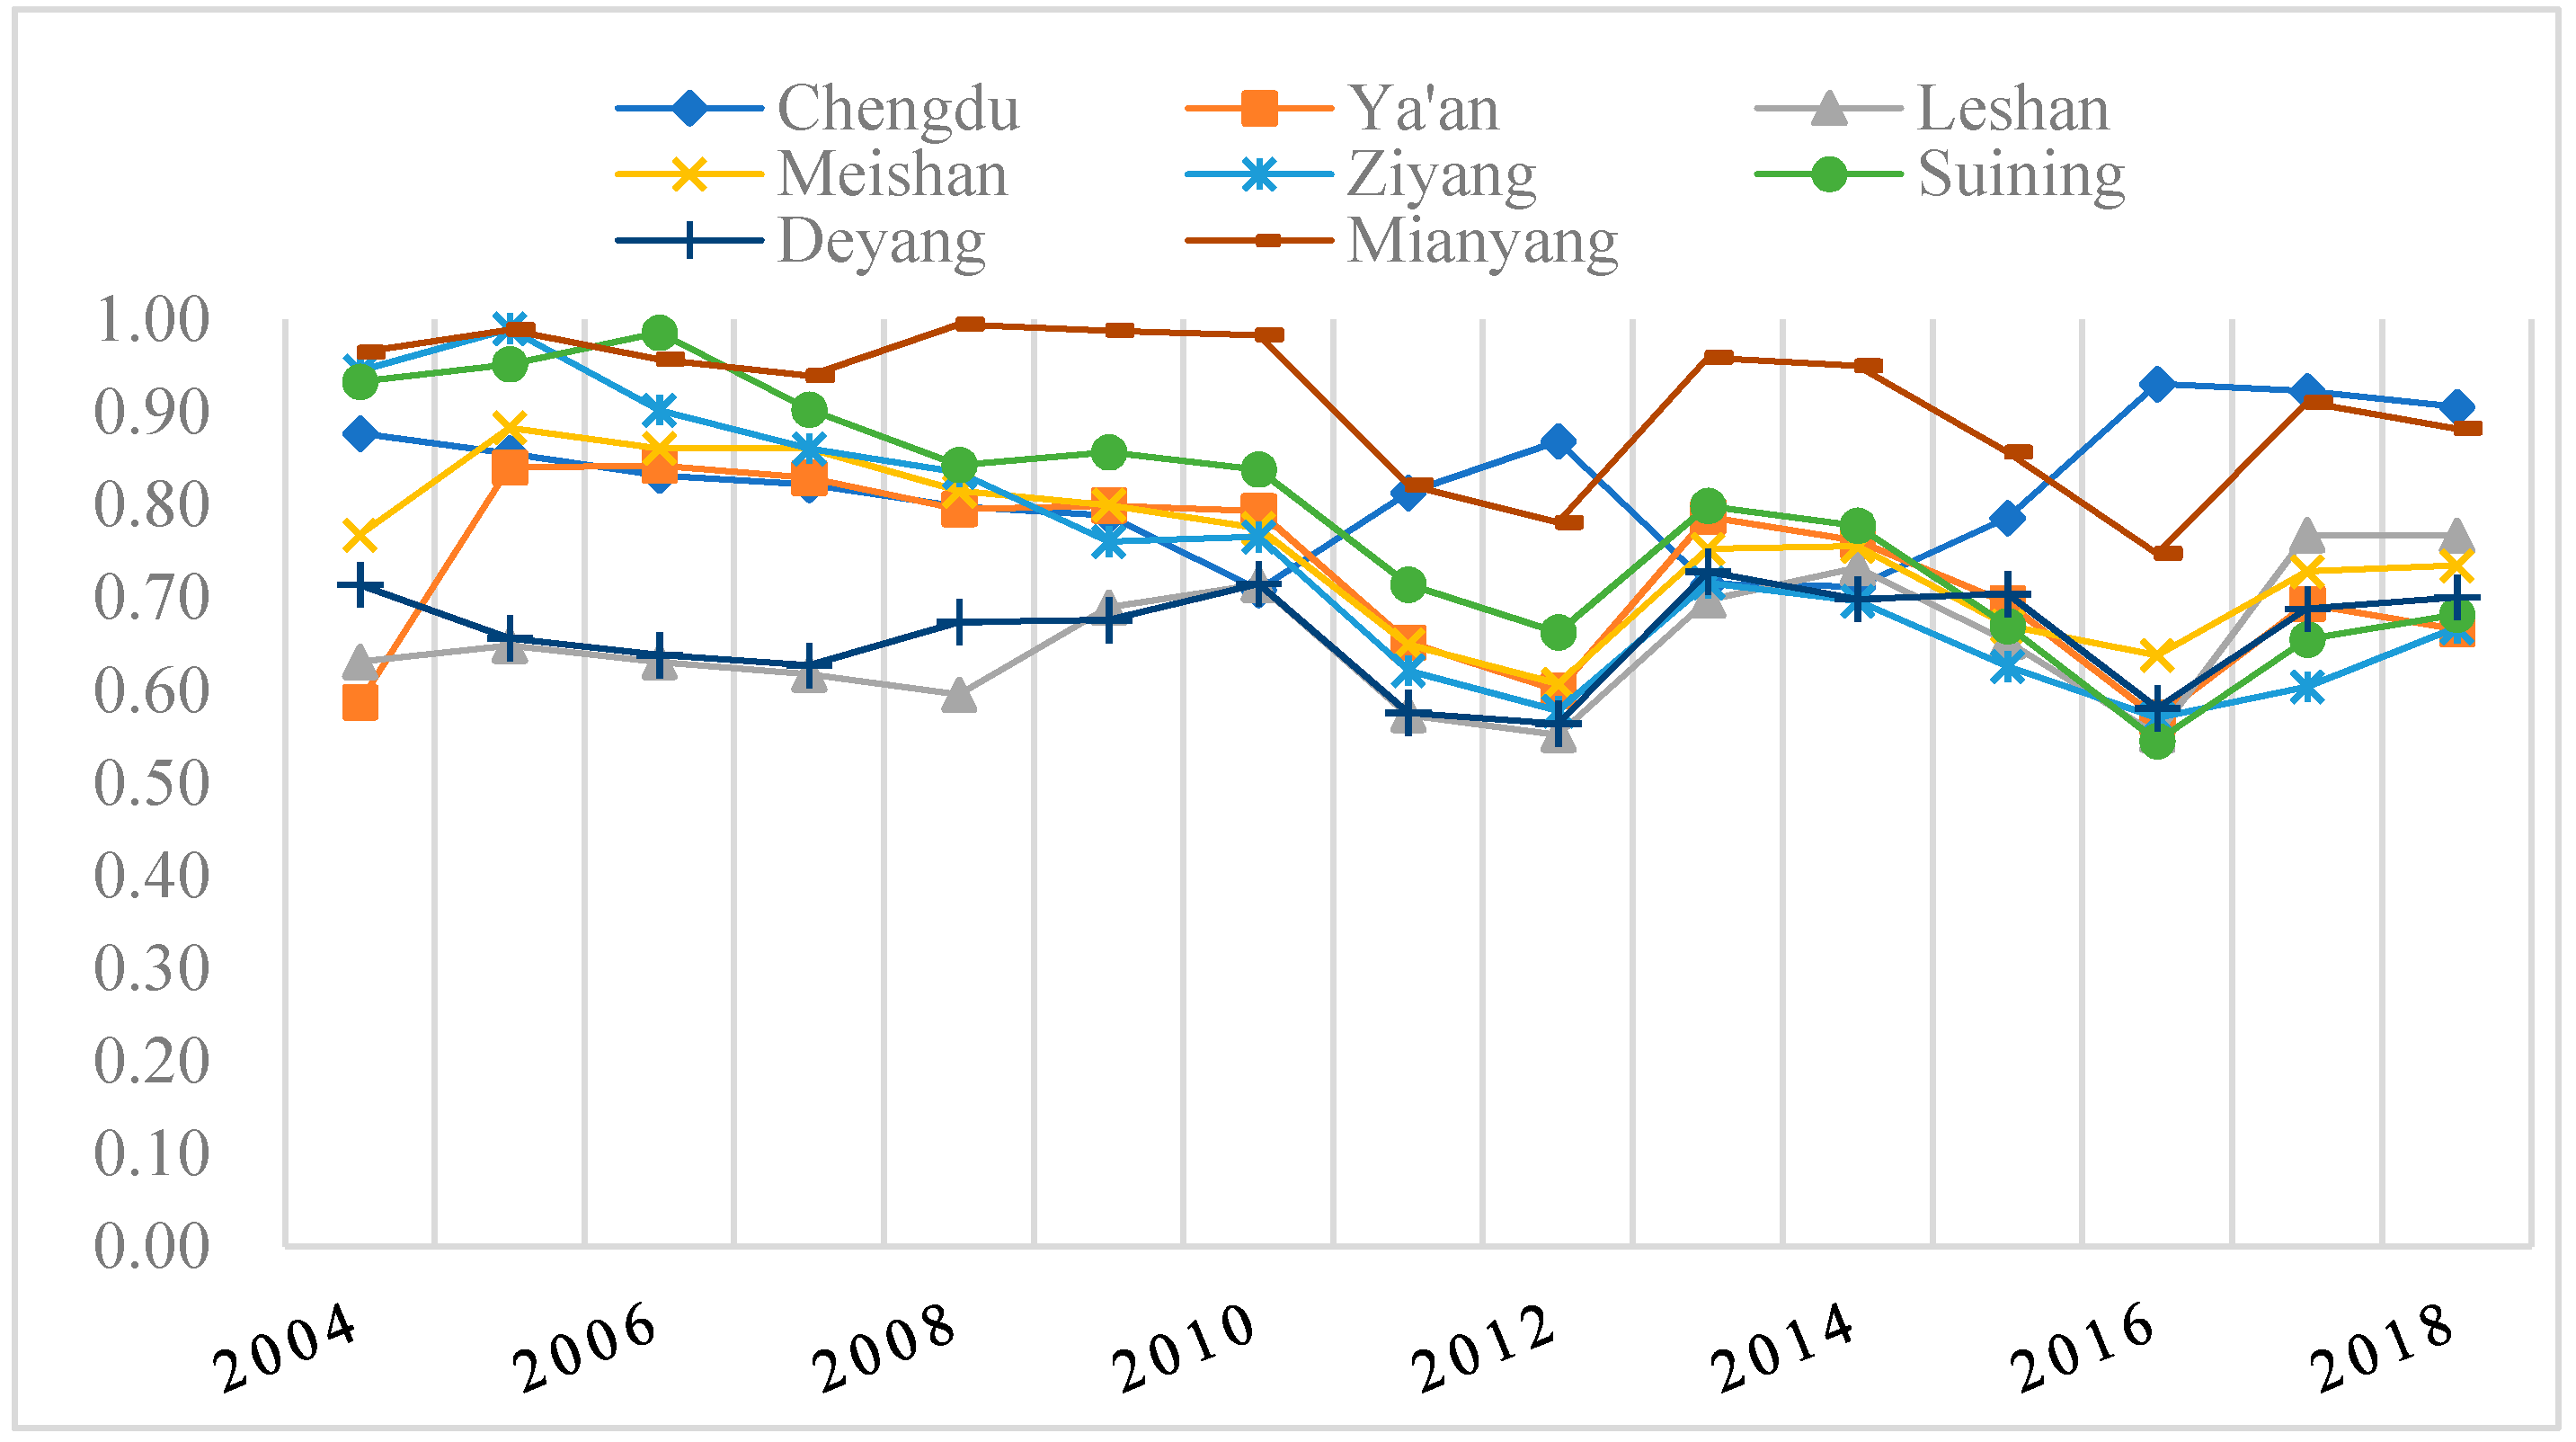
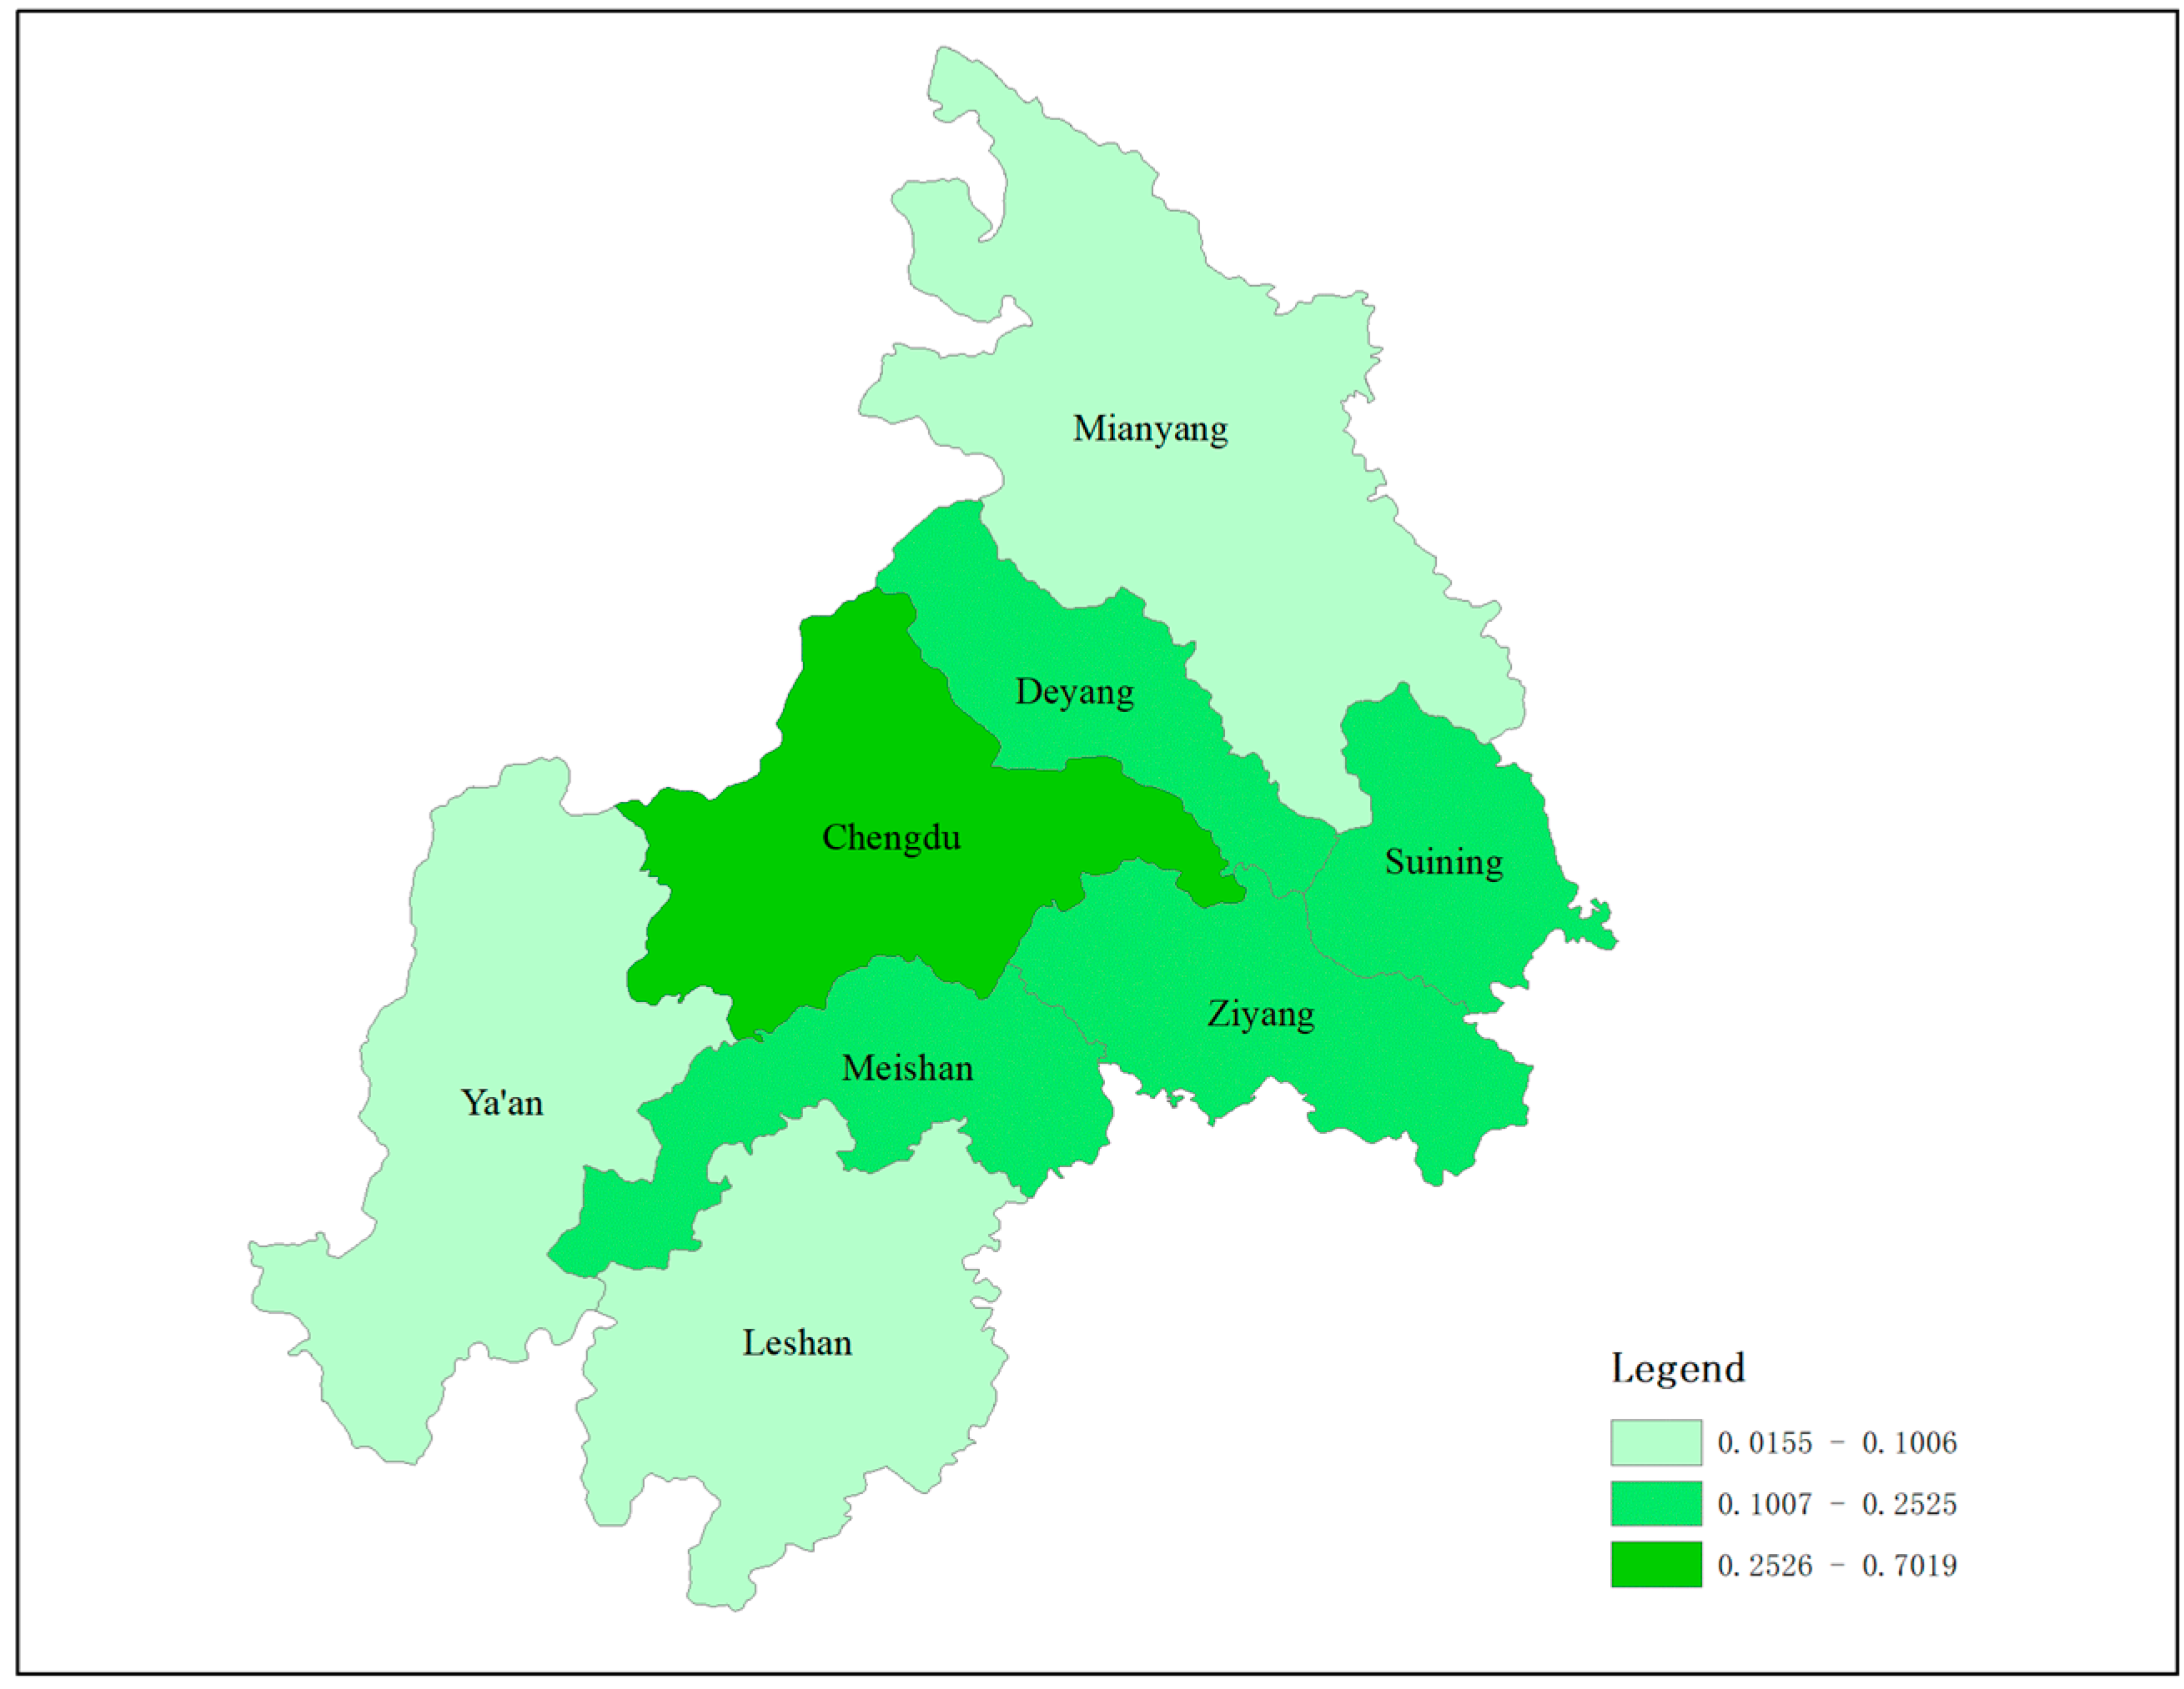
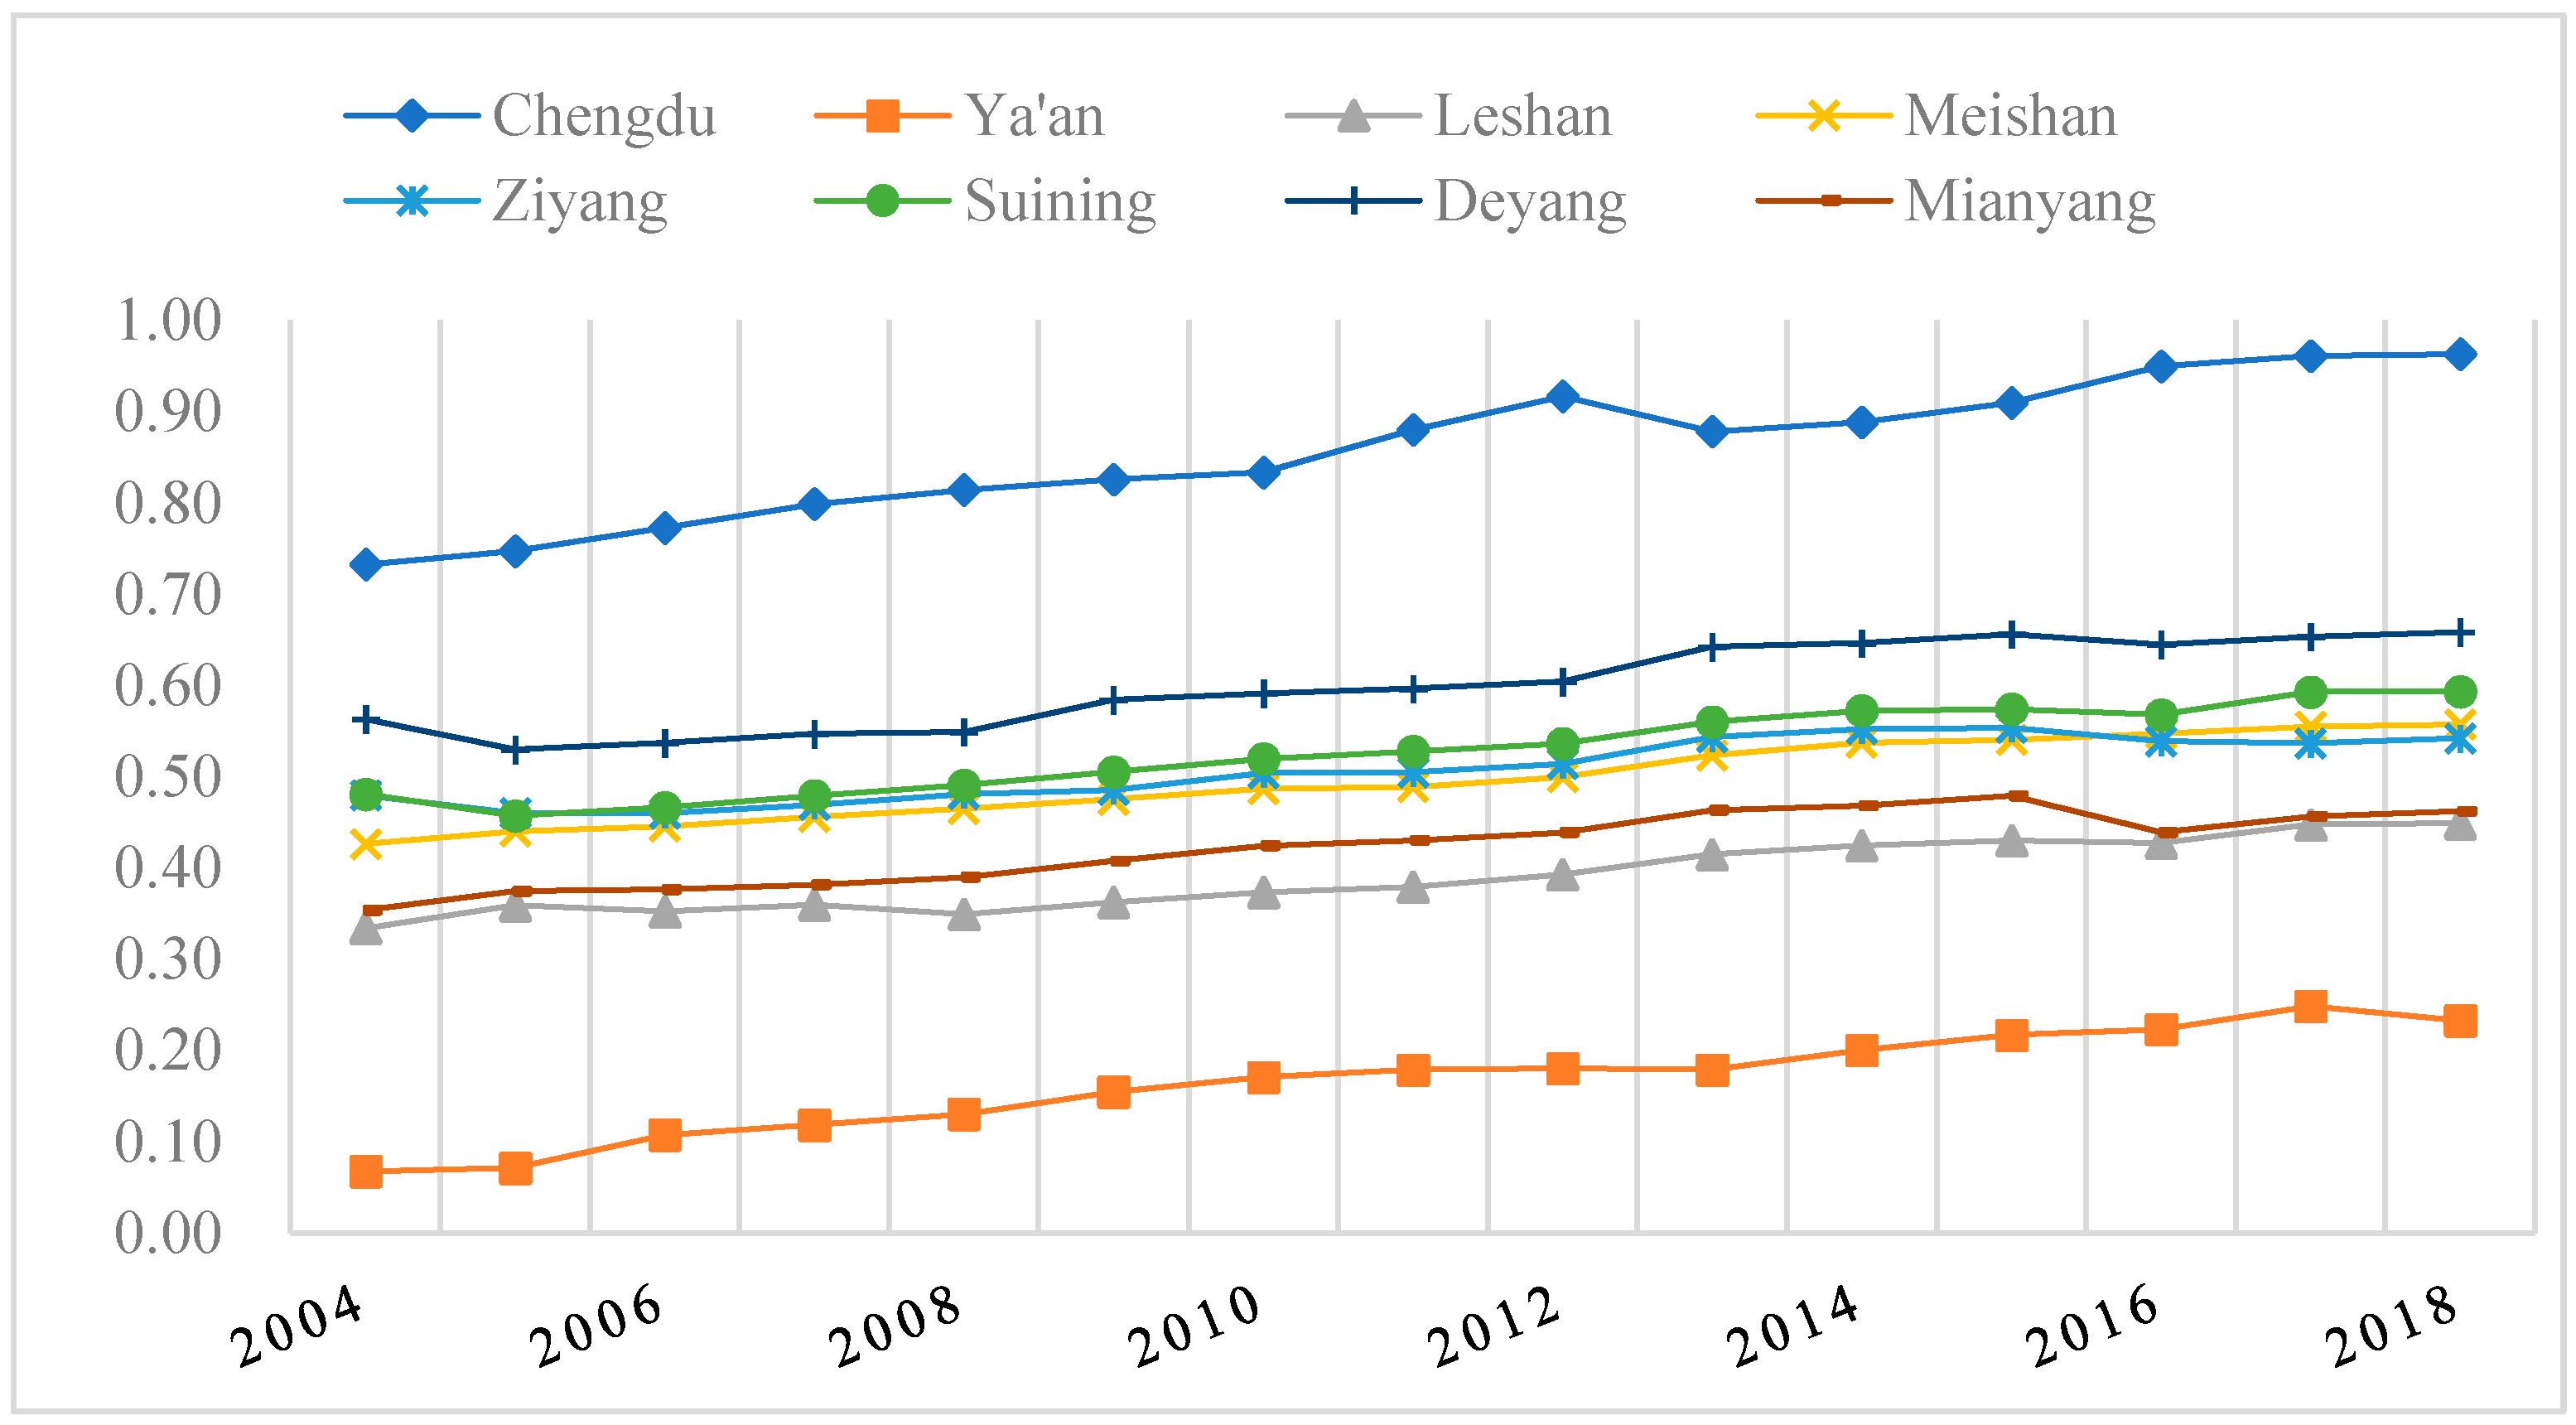
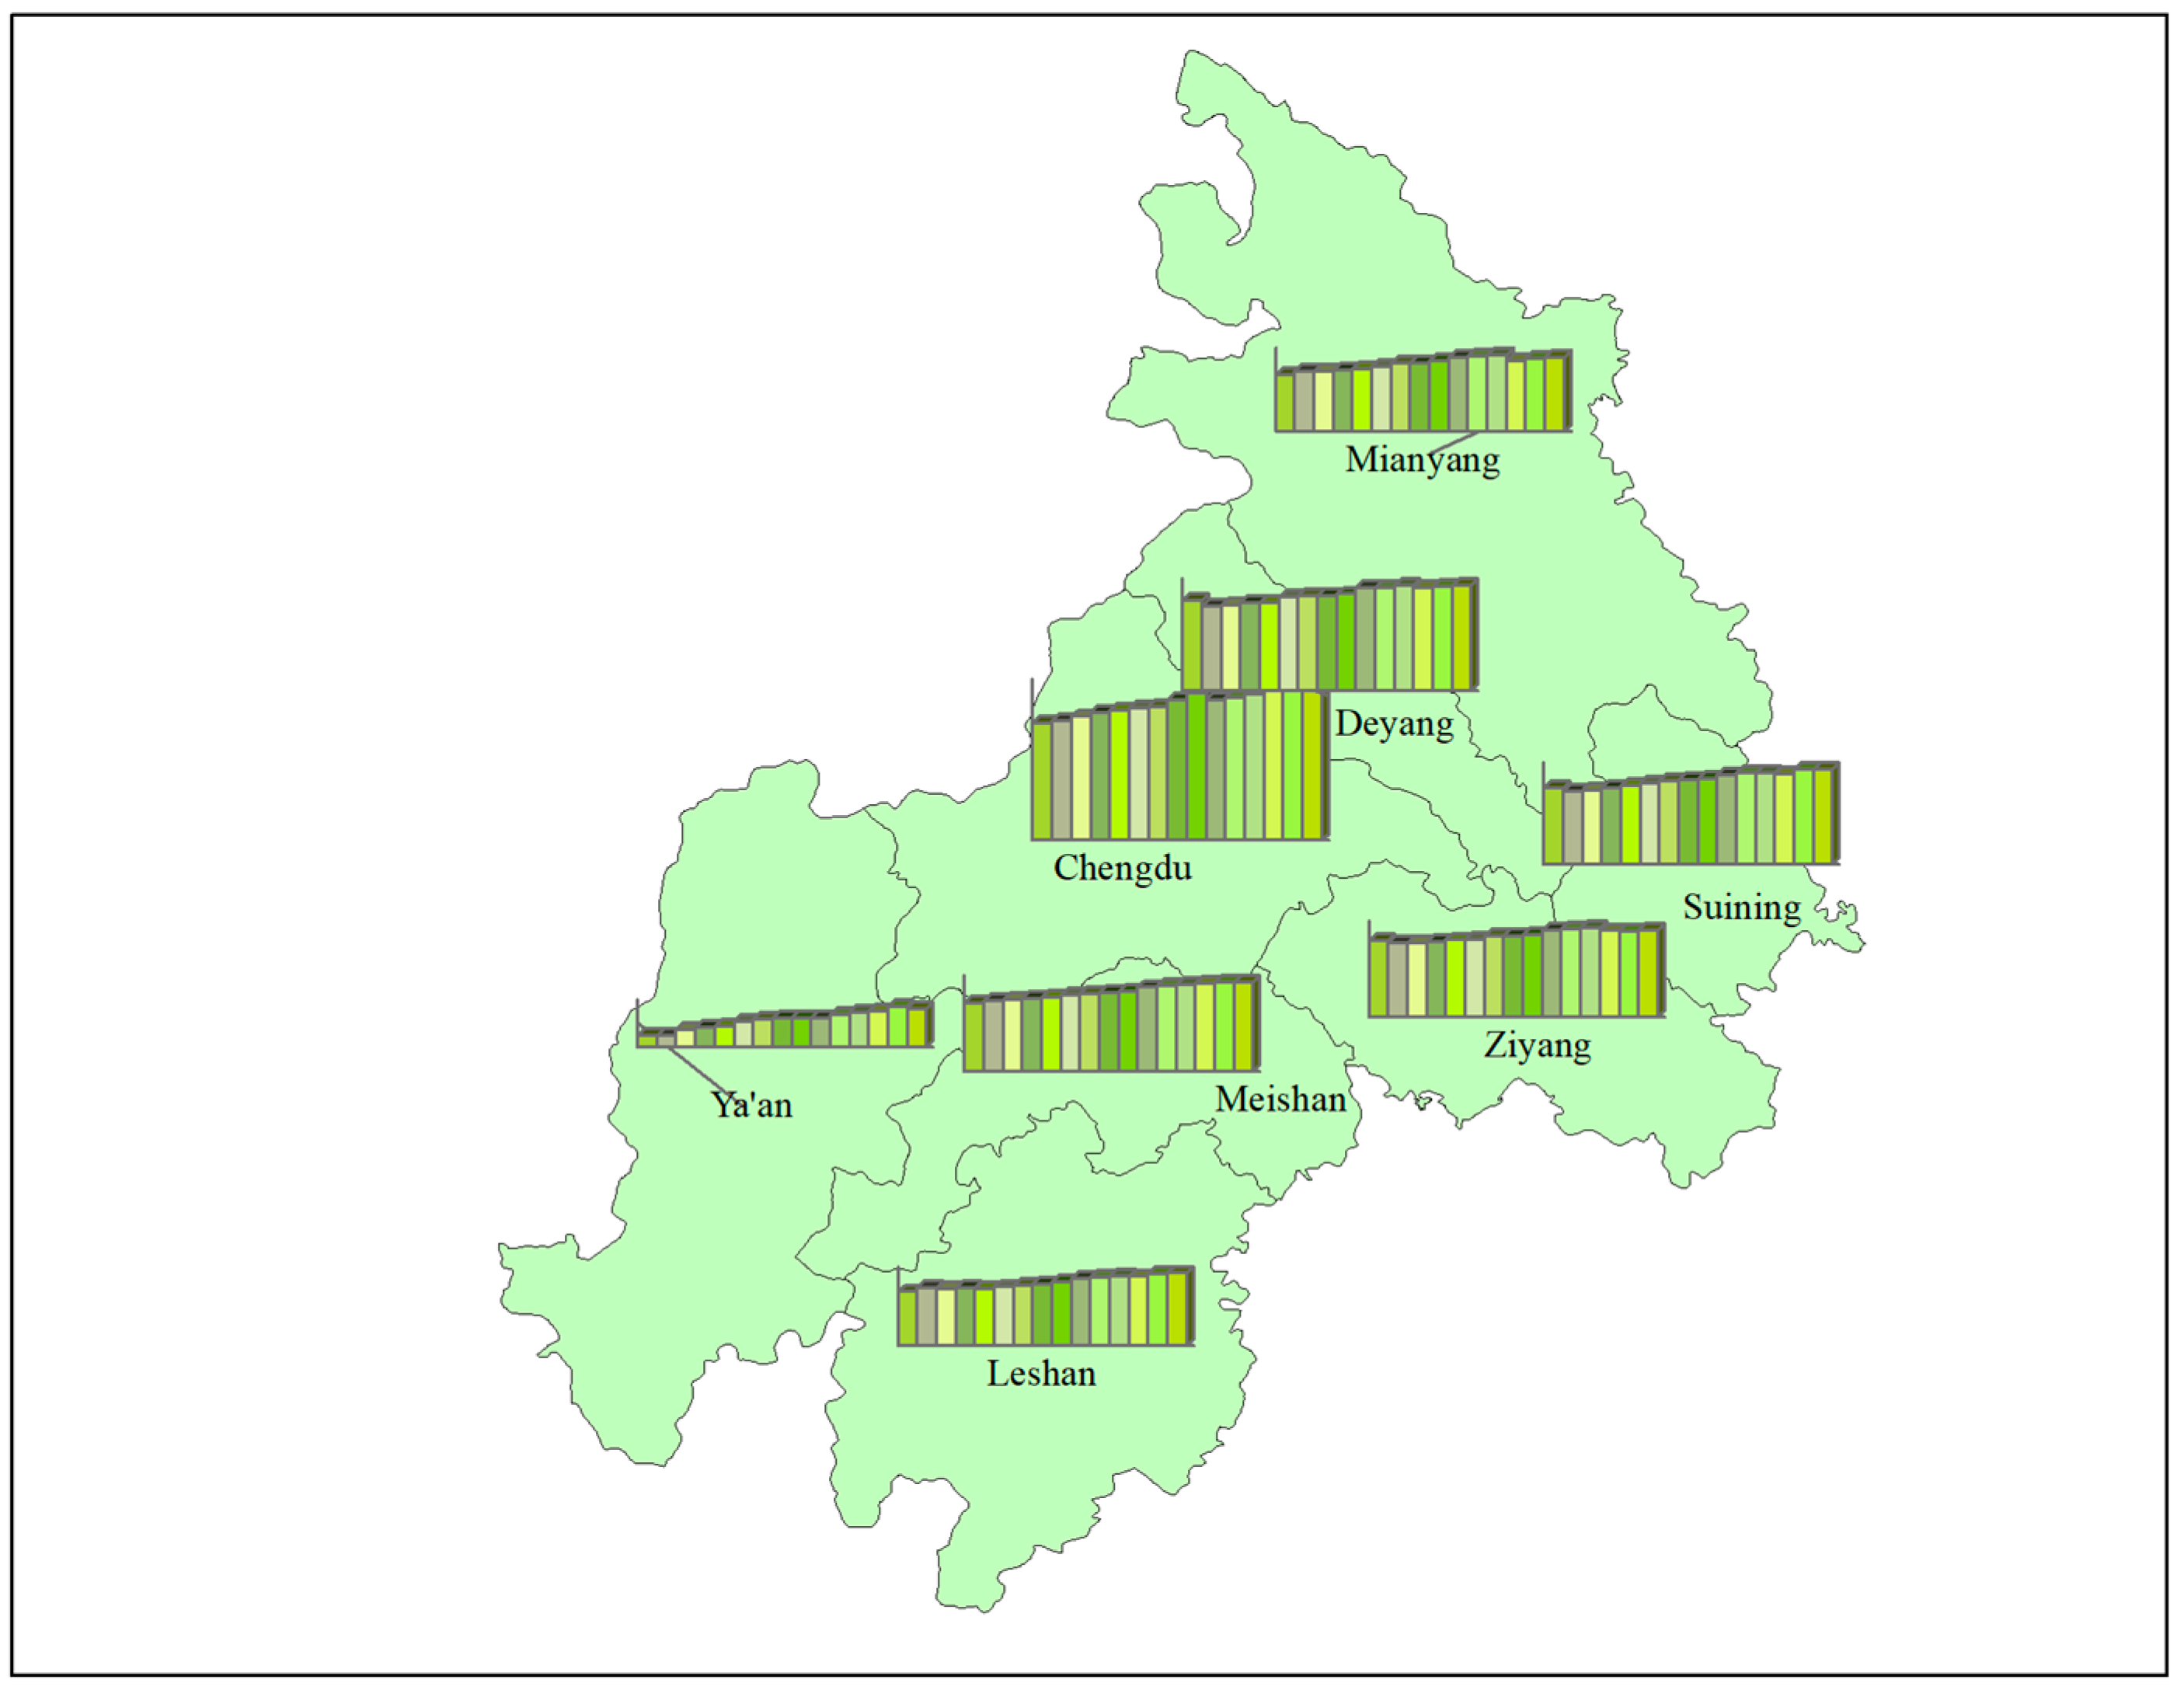
3.3. Coordinated Coupling Relationship Analysis

Using Formulas (4)–(6), a comprehensive measurement of the coupling coordination level between the industrial urban co-agglomeration and intensive land use was carried out, the results for which are shown in Figure 6. From 2004 to 2018, the coupling coordination degree between the industrial co-agglomeration and intensive land use in the eight Chengdu metropolitan area cities continued to increase, indicating continual improvements in the coordination; however, the growth rates varied from city to city.
Over time, the industrial co-agglomeration and intensive land use coupling coordination in the Chengdu metropolitan area had an upward trend. In 2004, Chengdu had average coordination and Deyang had poor coordination, in 2009, Suining also had poor coordination and Chengdu had good coordination, in 2010, Ziyang had poor coordination but from 2013 to 2018, Chengdu, Deyang, Suining, Ziyang, and Meishan had improved coordination, with Deyang reaching primary coordination in 2012. Chengdu attained high coordination in 2012, which dropped to good coordination in 2013 and 2014, and attained high coordination again after 2015.
The spatial dimension analysis estimated the industrial co-agglomeration and intensive land use coupling coordination levels in the Chengdu metropolitan area, which was found to have “high in the center and low in the periphery” characteristics (Figure 7). The industrial co-agglomeration and intensive land use coupling coordination in the Chengdu metropolitan area could be divided into three: central Chengdu city, surrounding cities, and fringe cities. The central Chengdu city’s coupling coordination level was always in the leading position and had a growing trend from 0.7323 in 2004 to 0.9630 in 2018, that is, from average coordination to high coordination. The surrounding cities were Deyang, Suining, Ziyang, Meishan, Mianyang, and Leshan, in which the coupling coordination was relatively low in 2004. By 2018, they had gradually developed to poor coordination and primary coordination. However, due to its poor foundations, the fringe city of Ya’an only developed from extreme disorder recession to moderate disorder recession during the research period, and was, therefore, quite far from transitional development.

4. Discussion

Industry co-agglomeration is the main industrial development objective for many cities [27,41]. Studies have shown that secondary industry agglomeration generally occurs before tertiary industry agglomeration [10]. The results of the industrial co-agglomeration model showed that as the Chengdu metropolitan area developed, the industrial co-agglomeration level increased. Based on their positions in the metropolitan area, each city optimized its industrial layout and adjusted its industrial structure, and as the secondary and the tertiary industry agglomeration levels changed, the overall industrial co-agglomeration changed. It was found that Ziyang and Suining continued to their deepen “Industrial Strong City” development strategies, which were centered on characteristic industries and modern industrial systems that coordinated both light and heavy industry [42]. The secondary industry agglomeration level rose, the agglomeration level of the tertiary industry decreased, and the industrial co-agglomeration decreased during the study.
During the study period, the intensive urban land use in the Chengdu metropolitan area gradually increased, and there was a positive relationship between the intensive land use and urban economic development [6]. As Chengdu, the central city, had a high economic development level, complete infrastructure, and a good investment environment, its intensive land use improved significantly and was found to have high sustainability [43]. As land is an indicator of social and economic development, intensive urban land use can promote input-output land use efficiency, which in turn benefits economic development [44]. Deyang, Suining, Ziyang, and Meishan were found to have a relatively high gross output, high fiscal revenue per square kilometer, a high population density, and a relatively high intensive land use level. Although Mianyang had relatively good economic conditions, its topography, urban GDP per square kilometer, and fiscal revenue per square kilometer affected its intensive land use; therefore, Mianyang needs to increase its GDP per square kilometer [31]. The low level of intensive land use in Leshan and Ya’an was mainly due to their complex topographies and poor economic levels. Therefore, overall, the intensive urban land use in the Chengdu metropolitan area had a low-high-low change from southwest to northeast, which was primarily because of the high, low, middle and relatively flat terrain characteristics [45].
The coupling coordination level between the urban industrial co-agglomeration and intensive land use in the Chengdu metropolitan area gradually increased over the study period, with the number of cities having a greater than poor coordination level increasing from two to five, all of which indicated that the industrial development was being better coordinated in all cities, that is, they each had an efficient division of labor, and had developed complementary advantages and benign interactive coordinated industrial development [42]. However, there were three distinct industrial co-agglomeration and intensive land use coupling coordination divisions in the Chengdu metropolitan area cities. Chengdu was in the first division as it had the highest coordination, and Deyang, Meishan, Ziyang, Suining, Mianyang, and Leshan were in the second division as they had fairly high coordination. After the Chengmei intra-city development construction and the “Three-Year Action Plan for the Development of Chengmei and the Construction of the Chengdu Metropolitan Area (2020–2022)” (Guiding Opinions on Promoting the Development of Chengmei Capital in the Same City) were successively issued, there were significant intra-city developments, which improved the industrial co-agglomeration and intensive land use coupling coordination [46]. The third division was for Ya’an because even though the industrial co-agglomeration and intensive land use coupling coordination rose, due to Ya’an’s poor foundation, complex topography, and lower economic level, the coupling coordination only attained a moderate disorder recession level in 2018, which meant that there was a gap between the average coordination in the Chengdu metropolitan area and Ya’an.

5. Conclusions

The continuing pace of urbanization in China has expanded the urban agglomeration and the industrial co-agglomeration; however, land resource scarcity is becoming a serious problem. During its urban industrial co-agglomeration process, higher requirements have been placed on intensive urban land use in the Chengdu metropolitan area. Therefore, this study sought to determine the industrial co-agglomeration and intensive land use coupling coordination in this city to assess the progress toward sustainable development. Based on an industrial co-agglomeration model, a three-dimensional intensive land use model, and a coupling coordination model, the urban industrial co-agglomeration and intensive land use coupling coordination in the eight cities in the Chengdu metropolitan area from 2004 to 2018 was determined.
Due to an adjustment in the urban industrial configuration from changes in the secondary and tertiary industry proportions, it was found that the urban industrial co-agglomeration in the Chengdu metropolitan area had fluctuated. However, as the industrial structure and industrial upgrading was gradually adjusted, the industrial synergy agglomeration gradually stabilized. The intensive urban land use in the Chengdu metropolitan area had an overall upward trend from southwest to northeast in terms of space and had low-high-low changes, with the central city of Chengdu having a much higher urban industrial co-agglomeration and intensive use land coupling coordination than the other seven cities.
However, during the study period, the coupling coordination level in all cities improved, but there were significant spatial differences: the first echelon city was Chengdu; the second echelon cities were Deyang, Ziyang, Suining, Meishan, Mianyang, and Leshan; and the third echelon city was Ya’an. The coupling coordination in Chengdu rose from average to high, most cities in the second tier were in transitional development, with four being above a poor coordination level in 2018, and Ya’an in the third echelon improved from being in an imbalanced development stage to a moderate disorder recession state in 2018.
Based on the research results, the following development suggestions are given.
(1) Development strategies need to be based on each city’s industrial structure and development level. For example, in accordance with the metropolitan development and the modern industry labor division, Deyang, Meishan, and Ziyang have collaborated in co-city developments to take advantage of their urban industries. As the central city, Chengdu’s role should be strengthened to take advantage of the characteristics and location advantages of each city and improve the regional cooperation and interconnections.
(2) Urban land resource management and intensive land use mechanisms need to be improved. First, it is necessary to improve the land resource allocation mechanism, actively revitalize existing urban construction land, conduct intensive land use benefit evaluations, and speed up intensive land use development. Second, land replacement needs to be strengthened to gradually eliminate high-energy-consuming, low-efficiency industries, actively integrate high-tech industries, and improve the comprehensive land utilization efficiency. In addition, the government needs to give full play to its regulatory role by improving the laws and regulations that restrict access to high-pollution, high-energy, low-efficiency industries, establish reasonable and effective pollution prevention mechanisms, and reduce pollution and land resource waste.
(3) The development of urban industry co-agglomeration and intensive land use needs to be promoted. The government needs to recognize the objective needs of co-agglomeration in the transformation and upgrading of urban industries, build links between the industrial distribution and spatial layout of the Chengdu metropolitan area, optimize the supporting industrial infrastructure, and coordinate the industrial agglomeration and intensive use of land resource coupling coordination.

Author Contributions

This research and was conducted and written by Q.G. in collaboration with all co-authors. Data was collected by Q.G. and S.L. The first and final drafts were written by Q.G. and G.G. The draft defects were critiqued by Q.G. The results were analyzed by X.L. and S.L. The research and key elements of models were reviewed by X.L. The writing work of corresponding parts and the major revisions of this paper were completed by Q.G. and G.G. The revised part of the article was all completed by Q.G. and X.L. All authors have read and agreed to the published version of the manuscript.

Funding

This paper was supported by the Department of Science and Technology of Sichuan Province Fund (2021JDRC0002).

Institutional Review Board Statement

Not applicable.

Informed Consent Statement

Not applicable.

Data Availability Statement

The datasets used or analyzed during the current study are available from the corresponding author on reasonable request.

Conflicts of Interest

The authors declare that they have no known competing financial interests or personal relationships that could have appeared to influence the work reported in this paper.

References

  1. Xie, X.; Fang, B.; Xu, H.; He, S.; Li, X. Study on the coordinated relationship between Urban Land use efficiency and ecosystem health in China. Land Use Policy 2021, 102, 105235. [Google Scholar] [CrossRef]
  2. Yu, J.; Zhou, K.; Yang, S. Land use efficiency and influencing factors of urban agglomerations in China. Land Use Policy 2019, 88, 104143. [Google Scholar] [CrossRef]
  3. Fu, Y.; Zhou, T.; Yao, Y.; Qiu, A.; Wei, F.; Liu, J.; Liu, T. Evaluating efficiency and order of urban land use structure: An empirical study of cities in Jiangsu, China. J. Clean. Prod. 2021, 283, 124638. [Google Scholar] [CrossRef]
  4. Sun, Y.; Zhao, S. Spatiotemporal dynamics of urban expansion in 13 cities across the Jing-Jin-Ji Urban Agglomeration from 1978 to 2015. Ecol. Indic. 2018, 87, 302–313. [Google Scholar] [CrossRef]
  5. Zhang, L.; Zhang, L.; Xu, Y.; Zhou, P.; Yeh, C.H. Evaluating urban land use efficiency with interacting criteria: An empirical study of cities in Jiangsu China. Land Use Policy 2020, 90, 104292. [Google Scholar] [CrossRef]
  6. Chen, Z.; Lei, Z. Research on the Effect of Industry Co-Agglomeration on Regional Economy. Reg. Econ. Rev. 2018, 3, 50–58. [Google Scholar]
  7. Ellison, G.; Glaeser, E.L. Geographic Concentration in U.S. Manufacturing Industries: A Dartboard Approach. J. Political Econ. 1997, 105, 889–927. [Google Scholar] [CrossRef] [Green Version]
  8. Chen, J.; Liu, Y.; Zou, M. The Improvement of City Productivity Based on Synergy and Co-agglomeration of Industries:Under the Background of Integrated Innovation and Conversion of Driving Force for Economic Development in China. J. Zhejiang Univ. (Humanit. Soc. Sci.) 2016, 46, 150–163. [Google Scholar]
  9. Hu, Y.; Zhu, W. Study on the Effect of the Co-agglomeration of Producer Services. Ind. Econ. Rev. 2015, 6, 5–14. [Google Scholar]
  10. Miao, J.; Xu, S. Study on the Influence of Industrial Co-agglomeration on Urban Land Intensive Use from the Perspective of Space. J. Ind. Technol. Econ. 2019, 38, 96–102. [Google Scholar]
  11. Krugman, P. Increasing returns and economic geography. J. Political Econ. 1991, 99, 483–499. [Google Scholar] [CrossRef]
  12. Hartman, D.A. Equilibrium Location of Vertically Linked Industries under Free Trade: Case Studies of Orange Juice and Tomato Paste in the Western Hemisphere. Ph.D. Thesis, The Ohio State University, Columbus, OH, USA, 1998. [Google Scholar]
  13. Ellison, G.; Glaeser, E.L.; Kerr, W.R. What causes industry agglomeration? Evidence from coagglomeration patterns. Am. Econ. Rev. 2010, 100, 1195–1213. [Google Scholar] [CrossRef] [Green Version]
  14. Duranton, G.; Overman, H.G. Exploring the detailed location patterns of UK manufacturing industries using microgeographic data. J. Reg. Sci. 2008, 48, 213–243. [Google Scholar] [CrossRef] [Green Version]
  15. Alonso-Villar, O.; Chamorro-Rivas, J.-M.; González-Cerdeira, X. Agglomeration economies in manufacturing industries: The case of Spain. Appl. Econ. 2004, 36, 2103–2116. [Google Scholar] [CrossRef] [Green Version]
  16. Chen, K.; Zhang, X.J.; Han, Q. The Measure and Characteristics of the Geographical Concentration of Chinese Industries. Shanghai J. Econ. 2018, 30–42. [Google Scholar]
  17. Xing, X. Measurement Methods of Industrial Agglomeration Degree and Their Application in Tourism Industry—A Research Review. Jiangsu Commer. Forum 2013, 37–40. [Google Scholar] [CrossRef]
  18. Guo, Y.; Tong, L.; Mei, L. The effect of industrial agglomeration on green development efficiency in Northeast China since the revitalization. J. Clean. Prod. 2020, 258, 120584. [Google Scholar] [CrossRef]
  19. Yang, R.; Li, N. The Impact of Industrial Agglomeration on the High-Guality Development of the Yangtze River Economic Belt. Reg. Econ. Rev. 2019, 71–79. [Google Scholar] [CrossRef]
  20. Wang, Y.; Wang, J. Does industrial agglomeration facilitate environmental performance: New evidence from urban China? J. Environ. Manag. 2019, 248, 109244. [Google Scholar] [CrossRef]
  21. Chu, M. Cluster of Producer Services and Land Intensive Use of Cities. Tax. Econ. 2013, 4, 13–16. [Google Scholar]
  22. Shuai, W.; Du, X. A Research on the Connotation and Mechanism of Land Economical and Intensive Utilization. Ecol. Econ. 2013, 4, 52–57. [Google Scholar]
  23. Fu, L. Evaluation of Intensive Land Use in Development Zones Based on TOPSIS: A Case Study of Development Zones in Xuzhou City, Jiangsu Province. Sci. Technol. Manag. Land Resour. 2011, 28, 57–61. [Google Scholar]
  24. Hui, E.C.M.; Wu, Y.; Deng, L.; Zheng, B. Analysis on coupling relationship of urban scale and intensive use of land in China. Cities 2015, 42, 63–69. [Google Scholar] [CrossRef]
  25. Ma, X.; Zhou, L.; Zhao, A. Sustainable Urban Land Intensive Use Evaluation and Its Impacting Factors: A Modifi cation of Traditional Land Intensive Use. China Land Sci. 2014, 28, 32–38. [Google Scholar]
  26. Song, J.B.; Chun-You, W.U. The Study on Evaluation of Coordinated Development between Urbanization and Ecological Environment among City Cluster in the Yangtze River Delta. China Soft Silenc. Mag. 2010, 78–87. [Google Scholar]
  27. Zhang, W.; Wu, Q.; Wang, B.; Huang, J. Multidimensional study of specialized agglomeration and diversified agglomeration on urban land use efficiency. China Popul. Resour. Environ. 2019, 29, 100–110. [Google Scholar]
  28. Lu, Y.; Geng, Y.; Qian, Y.; Han, W.; McDowall, W.; Bleischwitz, R. Changes of human time and land use pattern in one mega city’s urban metabolism: A multi-scale integrated analysis of Shanghai. J. Clean. Prod. 2016, 133, 391–401. [Google Scholar] [CrossRef] [Green Version]
  29. Xu, Q.; Fang, S. Empirical Research on Logistics Industy Cluster’s Economic Spillover Effects and Spatial Heterogeneity—Based on Spatial Econometric Analysis on Provincial Panel Data. J. Ind. Technol. Econ. 2018, 37, 58–65. [Google Scholar]
  30. Yang, R. Industrial GlomeraForeign Direct Investment and Environmental Pollution. Econ. Manag. 2015, 37, 11–19. [Google Scholar]
  31. Chen, Y.; Xie, Y. Spatio-Temporal Features Of Intensive Land Use And Diagnosis Of Its Obstacle Factors In Wuhan City. Resour. Environ. Yangtze Basin 2015, 24, 8–15. [Google Scholar]
  32. Wang, J.T.; Zhao, L. The Research of Resource Intensive Efficiency and Influencing Factors of Cities in China. China Popul. Resour. Environ. 2009, 19, 45–52. [Google Scholar]
  33. Lu, C.; Zhang, L.; Xue, B.; Zhang, Z.; Li, H.; Lu, C. Space-Time Synthetic Measurement of Regional Sustainable Development in Liaoning Province. Econ. Geogr. 2015, 26–32. [Google Scholar] [CrossRef]
  34. Xiao-Qing, L.I.; Jiang, B.O.; Chu, N.C. Analysis Of Coupled Coordination Of Intensive Land Use And New Urbanization In Three Major Coastal Cities Of China. Resour. Environ. Yangtze Basin 2017, 26, 983–991. [Google Scholar]
  35. Peng, C.; Song, M.; Han, F. Urban economic structure, technological externalities, and intensive land use in China. J. Clean. Prod. 2017, 152, 47–62. [Google Scholar] [CrossRef]
  36. Zhou, L.; Shi, Y.; Cao, X. Evaluation of Land Intensive Use in Shanghai Pilot Free Trade Zone. Land 2019, 8, 87. [Google Scholar] [CrossRef] [Green Version]
  37. Li, Y.; Li, Y.; Zhou, Y.; Shi, Y.; Zhu, X. Investigation of a coupling model of coordination between urbanization and the environment. J. Environ. Manag. 2012, 98, 127–133. [Google Scholar] [CrossRef]
  38. Ji, X.; Wang, K.; Ji, T.; Zhang, Y.; Wang, K. Coupling Analysis of Urban Land Use Benefits: A Case Study of Xiamen City. Land 2020, 9, 155. [Google Scholar] [CrossRef]
  39. Fang, Z. Empirical study on the coordinated development of China’s energy-economy-environment (3E). Economist 2009, 35–41. [Google Scholar] [CrossRef]
  40. Liao, C. Quantitative Judgement and Classification System for Coordinated Development of Environment and Economy—A Case Study of the City Group in the Pearl River Delta. Trop. Geogr. 1999, 19, 171–177. [Google Scholar]
  41. Su, X. Agglomeration of Factors, Industrial Cluster and Megalopolis In the Urbanization. J. Cent. Univ. Financ. Econ. 2004, 49–52. [Google Scholar]
  42. Fang, Q. A Study on the Relevance between the Development of Central Cities and Peripheral Cities—Taking Economic Circle around Chengdu as an Example. Reform Econ. Syst. 2019, 54–61. [Google Scholar]
  43. Zhou, X.; Li, J.; Xiong, X.; Gong, X.; Sun, W. Coordinated Developmental Study on Urban Land-intensive Use and Urbanization in Chengdu. Hubei Agric. Sci. 2014, 236–240. [Google Scholar] [CrossRef]
  44. Wu, Y.; Qu, F. Mechanism of Intensive Urban Land Use in China: Theoretical and Practical Study. Resour. Sci. 2007, 29, 108–115. [Google Scholar]
  45. Mu, Z.; Wu, T. Spatial Difference in Urban Land Intensive Use of Sichuan Province. Hubei Agric. Sci. 2015, 54, 717–721. [Google Scholar]
  46. Cao, B.; He, P.; Gong, Q. Research on the Stability and Competitiveness of Industrial Chain Supply Chain under the Background of Chengde Meizi’s Integration. Reform Econ. Syst. 2021, 1, 63–69. [Google Scholar]
Figure 1. Location map of the study area.
Land 10 00499 g001
Figure 2. Three-dimensional intensive urban spatial land use model.
Land 10 00499 g002
Figure 3. The industrial urban co-agglomeration levels from 2004 to 2018.
Land 10 00499 g003
Figure 4. Intensive urban land use level from 2004 to 2018.
Land 10 00499 g004
Figure 5. Average intensive urban land use from 2004 to 2018.
Land 10 00499 g005
Figure 6. Coupling coordination degree from 2004 to 2018.
Land 10 00499 g006
Figure 7. Coupling coordination degree change trends.
Land 10 00499 g007
Table 1. Development classification for the urban industrial co-agglomeration and intensive land use coupling.
CategoryD-ValueSub-Class
Coordination development0.9000–1.0000High coordination
0.8000–0.8999Good coordination
0.7000–0.7999Average coordination
0.6000–0.6999Primary coordination
Transitional development0.5000–0.5999Poor coordination
0.4000–0.4999Near disorder recession
Imbalanced development0.3000–0.3999Light disorder recession
0.2000–0.2999Moderate disorder recession
0.1000–0.1999Serious disorder recession
0.0000–0.0999Extreme disorder recession
Publisher’s Note: MDPI stays neutral with regard to jurisdictional claims in published maps and institutional affiliations.

