Article

The Benefits of Combining Global and Local Data—A Showcase for Valuation and Mapping of Mangrove Climate Regulation and Food Provisioning Services within a Protected Area in Pará, North Brazil

1
Leibniz Institute of Ecological Urban and Regional Development, Weberplatz 1, 01217 Dresden, Germany
2
Institute for Coastal Research (IECOS), Federal University of Pará (UFPA), Bragança 66075-110, PA, Brazil
3
Leibniz Centre for Tropical Marine Research (ZMT), Fahrenheitstr. 6, 28359 Bremen, Germany
4
FB02 Biology/Chemistry, University of Bremen, 28359 Bremen, Germany
*
Author to whom correspondence should be addressed.
Land 2021, 10(4), 432; https://doi.org/10.3390/land10040432
Submission received: 31 March 2021 / Revised: 14 April 2021 / Accepted: 15 April 2021 / Published: 18 April 2021

Abstract

:
Mangrove forests provide a large variety of ecosystem services (ES) to coastal societies. Using a case study focusing on the Ajuruteua peninsula in Northern Brazil and two ES, food provisioning (ES1) and global climate regulation (ES2), this paper proposes a new framework for quantifying and valuing mangrove ES and allow for their small-scale mapping. We modelled and spatialised the two ES from different perspectives, the demand (ES1) and the supply (ES2) side respectively. This was performed by combining worldwide databases related to the global human population (ES1) or mangrove distribution and canopy height (ES2) with locally derived parameters, such as crab catches (ES1) or species-specific allometric equations based on local estimates of tree structural parameters (ES2). Based on this approach, we could estimate that the area delivers the basic nutrition of about 1400 households, which equals 2.7 million USD, and that the mangrove biomass in the area contains 2.1 million Mg C, amounting to 50.9 million USD, if it were paid as certificates. In addition to those figures, we provide high-resolution maps showing which areas are more valuable for the two respective ES, information that could help inform management strategies in the future.

Graphical Abstract

1. Introduction

Ecosystem services (ES) are defined as the contributions of ecosystems to human well-being. This concept involves not only luxury goods but also the basic requirements for survival (water, air, food, heating). The concept of ES is an approach to analyse and describe the relationships between characteristics and processes in the natural environment to emphasize their relevance to society [1]. Ecosystem service (ES) quantification and valuation critically depend on the relation of spatially differentiated components such as supply, demand, and accessibility [1]. A benefit for society is established when goods and services from ecosystems are transferred to people or when direct access is possible. However, there is often a spatial discrepancy between the areas where ES are generated (service providing areas = SPA) and those where people use them (service benefitting areas = SBA), which is a major challenge in the valuation and mapping of ES [2]. The values of ES depend on the flows which express the balance between ES supply, generated in the SPAs, and demand, in SBAs. In addition, the character of supply and demand relations determines what is critical for valuation. For instance, the value of ecosystem services having a relatively stable demand over time and space, such as global climate regulation, mainly depends on the supply parameters, that vary in space. On the contrary, the value of ecosystem services that are used in a spatially heterogeneous manner and at a small scale, e.g., the collection of food within an ecosystem, mainly depends on the spatial demand distribution [1].
Mangrove forests offer numerous ES, both to local societies and to humankind worldwide [3,4,5,6,7]. However, despite their high value, mangrove areas are still declining globally due to coastal urban development, aquaculture and agriculture, also leading to negative economic consequences for human livelihoods [8,9]. With an annual loss rate of 0.13 percent per year [10] due to deforestation, the sustainable use and conservation of this threatened and valuable ecosystem is urgently needed and requires sound management plans based on a broad range of data [11,12]. A lot of research has been done to assess the value of mangrove ES physically and economically, both related to provisioning services, e.g., timber production and fishery, and regulating services, e.g., coastal protection, climate regulation or nursery. Monetary valuation approaches, i.e., mostly direct and indirect use values, were successfully applied in case studies at different spatial scales [13,14,15,16]. However, map-based high-resolution spatial information on the condition and use of mangrove ecosystem services is still scarce and mostly limited to regulating ES, mainly aboveground biomass or sediment organic carbon estimations, supporting the climate regulation, or relate aggregated ES values to administrative entities [3,17,18,19]. Globally available databases offer the opportunity to easily assess regulating ES worldwide. While applying such global methodologies, however, small-scale processes and patterns can lead to deviations between the estimated and actual ES value on-site, e.g., in the case of climate regulation due to the use of non-specific allometric equations (both in terms of species composition or local conditions).
Small-scale quantification and mapping of the relevant ES for mangrove ecosystems remain challenging. Thriving at the interface between land and sea, mangrove ecosystems are very dynamic, submitted to drastic fluctuations in salinity and sediment oxygenation due to tidal influence [20]. Those environmental conditions, that will affect both the local species composition and activity of the flora, fauna and microbiota and their interactions, have to be taken into account methodically while approaching small-scale ES mapping. In addition, mapping human use is difficult as utilization is often informal, not spatially explicit and difficult to assess using official statistics.
Against the background of the challenges outlined, this study focuses on two central questions:
  • How can globally mapped data on regulating ES be refined by taking into account local empirical data and recent modelling approaches?
  • How can the value of provisioning services be estimated and mapped combining globally available databases and local empirical data?
High-resolution maps could help to better prioritise and implement sustainable management strategies in addition to already available data, e.g., on the municipality or regional level. In this regard, ES mapping techniques have to be further improved in order to support value-based communication among decision-makers for targeted mangrove ecosystem conservation [14,16,21]. As a case study, a mangrove forest in Brazil was selected, which is governed by a particular protection and management type called “Marine Extractive Reserve” (in Portuguese: Reserva Extrativista Marinha = RESEXM).

2. Materials and Methods

2.1. Case Study Area RESEXM Caeté-Taperaçu

The Coastal Amazonia makes up the largest continuous mangrove stretch in the world and is considered of extreme biological importance [22]. Community management of natural resources became an official policy in Brazil under the term “Extractive Reserve” (in Portuguese: Reserva Extrativista = RESEX) [23]. Extractive reserves constitute one type of Brazilian Federal conservation units and consist of semi-protected areas where sustainable use is allowed in dedicated areas. This type of reserve constitutes public land, but it can be used by the local population for traditional and sustainable extraction of resources. Such semi-protected areas were created on the demand of traditional and indigenous communities with the aim to use the area to extract natural resources in a sustainable way, thereby preserving the natural environment, the local population, their culture and traditions. Several protected areas of the specific type “Marine Extractive Reserve” (RESEXM), that are intended to provide protection and use together in a common governance scheme, have nonetheless been criticised for lacking sustainability [24,25].
The study area, the Caeté-Taperaçu Marine Extractive Reserve, is located close to the city of Bragança and 215 km east of Belém, the capital of Pará state, at Brazil’s northern Amazon coast. Covering an area of ca. 42,068 ha, it extends from its northern limit, the Atlantic Ocean, to the city of Bragança in the south and consists of predominantly natural mangrove forest. The RESEXM Caeté-Taperaçu was created in 2005 after the initial request by 37 communities associated with the estuarine mangroves, and covers coastal-estuarine areas, such as mangroves, saltmarshes, salt flats, sandbanks, dunes, beaches and coastal islands. Tourism is concentrated at the village of Ajuruteua where the touristic beach is accessed, but the village and beach are not part of the reserve. Only one paved road crosses the mangroves, connecting the city of Bragança to the beach of Ajuruteua. Between 2011/2012, the ICMBio (Instituto Chico Mendes de Conservação da Biodiversidade) ([22], p. 20) registered 9045 families as beneficiary of the area.
In our analysis, we focused on the valuation of ES provided by the mangrove forest within the RESEXM Caeté-Taperaçu reserve as a service-providing area (SPA). The mangrove extent was derived from the global mangrove watch database, providing global data on the distribution of mangrove forests based on a remote sensing approach [26], for the most recent year—2016. Reserve boundaries could be applied using data from the world database on protected areas [27]. The villages around the reserve that depend economically on the forest and their inhabitants can be considered traditional users of the mangroves. Based on empirical research dedicated to the use of provisioning ES by local villagers [6] and the collection practice of the mangrove crab Ucides cordatus shown by those local villagers [28], we defined the surrounding communities of Tamatateua, Acarajó with the neighbouring villages of Bacuriteua, Caratateua and Treme as service benefiting areas (SBA) (“Population”, Figure 1).

2.2. Valuation Techniques and GIS-Based Mapping

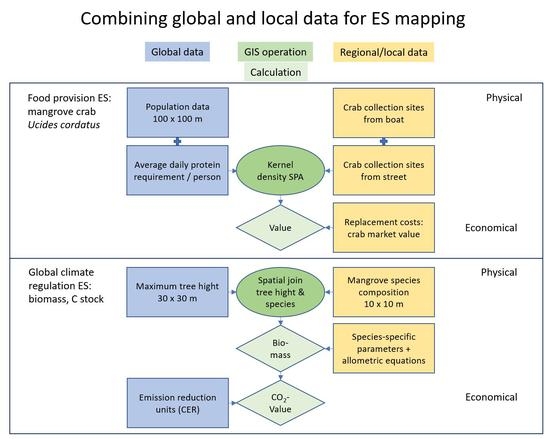
2.2.1. General Overview

We conducted qualitative stakeholder interviews in the study area of the RESEXM Caeté-Taperaçu. Twelve stakeholders, including representatives of the local fishers and senior officials of the city administration for planning, fishery, environmental conservation and tourism, with expert knowledge about the local conditions, were asked to select the most valuable and the most threatened ES in the area. The classification of the services was based on the Mapping and Assessment of Ecosystems and their Services framework (MAES) proposed by [29] together with the Common International Classification of Ecosystem Services (CICES) [30]. The respondents assigned value ranks on the importance of ecosystem services for the mangrove area using a Likert scale from one (minimum) to five (maximum).
The supply of food, the use of mangrove wood as timber, and the extraction of water were considered significant as provisioning services by the interviewed stakeholders. Furthermore, the nursery service as well as flood and coastal protection together with the carbon storage capacity of the ecosystem were assigned great importance as regulating services. The positive perception of mangrove aesthetics, the spiritual significance and educational opportunities were emphasized as culturally important services.
This empirical background and preliminary data availability checks led us to opt for a selection of two ecosystem services: Food from wild animals (the mangrove crab Ucides cordatus) and carbon stocks in aboveground biomass of mangrove trees for global climate regulation. The crab species Ucides cordatus is one of the most important sources of protein for the local population and at the same time an important economic factor, since over 60% of the households living in the villages are involved in the commercial exploitation of this crab species [6]. The importance and use of the crab species have been extensively examined empirically by various authors, which makes it possible to quantify the crab collection practice as an ecosystem service [5,28,31]. Regarding the climate regulation ES, small-scale globally mapped data on aboveground biomass are available and show that large parts of the RESEXM Caeté-Taperaçu are covered with a high density of biomass up to 260 Mg per hectare [18,19], being considerably higher than estimates of South American rainforests storing about 140 Mg ha−1 (95% confidence limits: 133–148 Mg ha−1, see [32] Table 1). Further empirical data on species distribution within the protected area, tree structural parameters as well as locally derived species-specific allometric equations can be used to refine the global dataset [33,34,35]. The valuation and mapping of ES were led by the flow of the service from supply to demand-side both spatially and quantitatively, i.e., we tried to identify the measurable service flow between the providing (SPA) and benefiting (SBA) areas. The two ES were first quantified in physical units (i.e., number of demanded crabs for food provision, Mg of mangrove aboveground biomass, Mg of C stocks and sequestered CO2). For the food provisioning ES, we regard the demand side as critical for the flow and thus the ES value. The ES value on the supply side could potentially be even higher; however, as it is driven by complex biophysical processes, we renounced to quantify it due to data deficiency. Demands for crabs were estimated for four communities within the SBA (Tamatateua, Acarajó and Bacuriteua, Caratateua and Treme) based on the village population size and the human protein demand per year. Small-scale population distribution could be obtained from WorldPop, a global and open database providing high-resolution geospatial population data as a 100-m grid [36]. In a second step, the resulting number of crabs per year was mapped within the RESEXM Caeté-Taperaçu based on empirical data related to the local crab collection practice [28] (Section 2.2.2 of this paper) and converted into an economic value using market prices. For the global climate regulation ES, on the contrary, the benefit flow can only be dependent on the supply side, since all of the potential service capacity is requested by human society at any time. Simard et al. [18,19] provide a database covering global mangrove distribution, aboveground biomass and maximum tree height data acquired via remote sensing in a 30-m resolution for the year 2000. In their approach, global aboveground biomass distribution was estimated using tree height-related and region-specific allometric equations verified through in-situ field measurements. For our purpose, we only focussed on the global maximum tree height data, which was applied as one input parameter to estimate aboveground biomass with the help of local species- and region-specific allometric equations directly within the SPA (Brazil: R. mangle and L. racemosa, [33]; French Guiana: A. germinans, [35]. In order to distinguish between different mangrove species while estimating aboveground biomass, we were able to apply empirically derived spatial information on dominant mangrove stands and respective structural parameters regarding tree height, diameter at breast height (DBH) and tree density for the Ajuruteua peninsula [34].
Monetary valuation addressed the price using “US Dollar per crab” for the food provisioning ES and “US Dollar per Mg CO2” for the climate regulation ES. The resulting economic value for both ES was standardised to one year in order to apply the discounted cash flow method (Equation (1); [37]), which offers the possibility of monetising a wide variety of ES in a uniform framework, thus, making them comparable. Following Atkinson et al. [3], yearly cash flows (CF) for the considered ES have been discounted over a 10-year period with a uniform interest rate of 10% [38]. The sum of the ten discounted cash flows for the years 2020 to 2029 results in the present value (PV) for each of the ES using the following formula:
P V ( i , N ) = t = 0 N C F t 1 ( 1 + i 100 ) t
Variables:
  • PV (i,N) = Sum of present values with discount rate i for N years
  • CFt = Cash flow in year t in US Dollar
  • N = Total number of years (10)
  • i = 10-year average discount rate (monetary policy interest) (10%: [38])
  • t = Number of the year starting in 2019 until 2029 (2020 = year 1 and so on)
If the economic values of ES would depict real investments, these should at least generate the interest rate that an alternative investment would receive, e.g., on the capital market.
The spatial distribution of the present value was modelled inside the RESEXM Caeté-Taperaçu based on the mangrove ecosystem extent [26,27], presented as raster data. The spatial resolution was set to a 30-m grid (whereby each cell covers 900 m2). By utilising GIS techniques (GIS = geographic information system), e.g., kernel density operation and inverse distance weighting, an area-related economic value was determined for each of these grid cells; its economic value depends in part on the total value of the respective ecosystem service, but is also influenced by spatial factors, such as the crab catch practice of the local population for the food provisioning ES or dominant mangrove species and tree density and height for the climate regulation ES. Results are presented in maps extrapolating the cell values to one hectare.

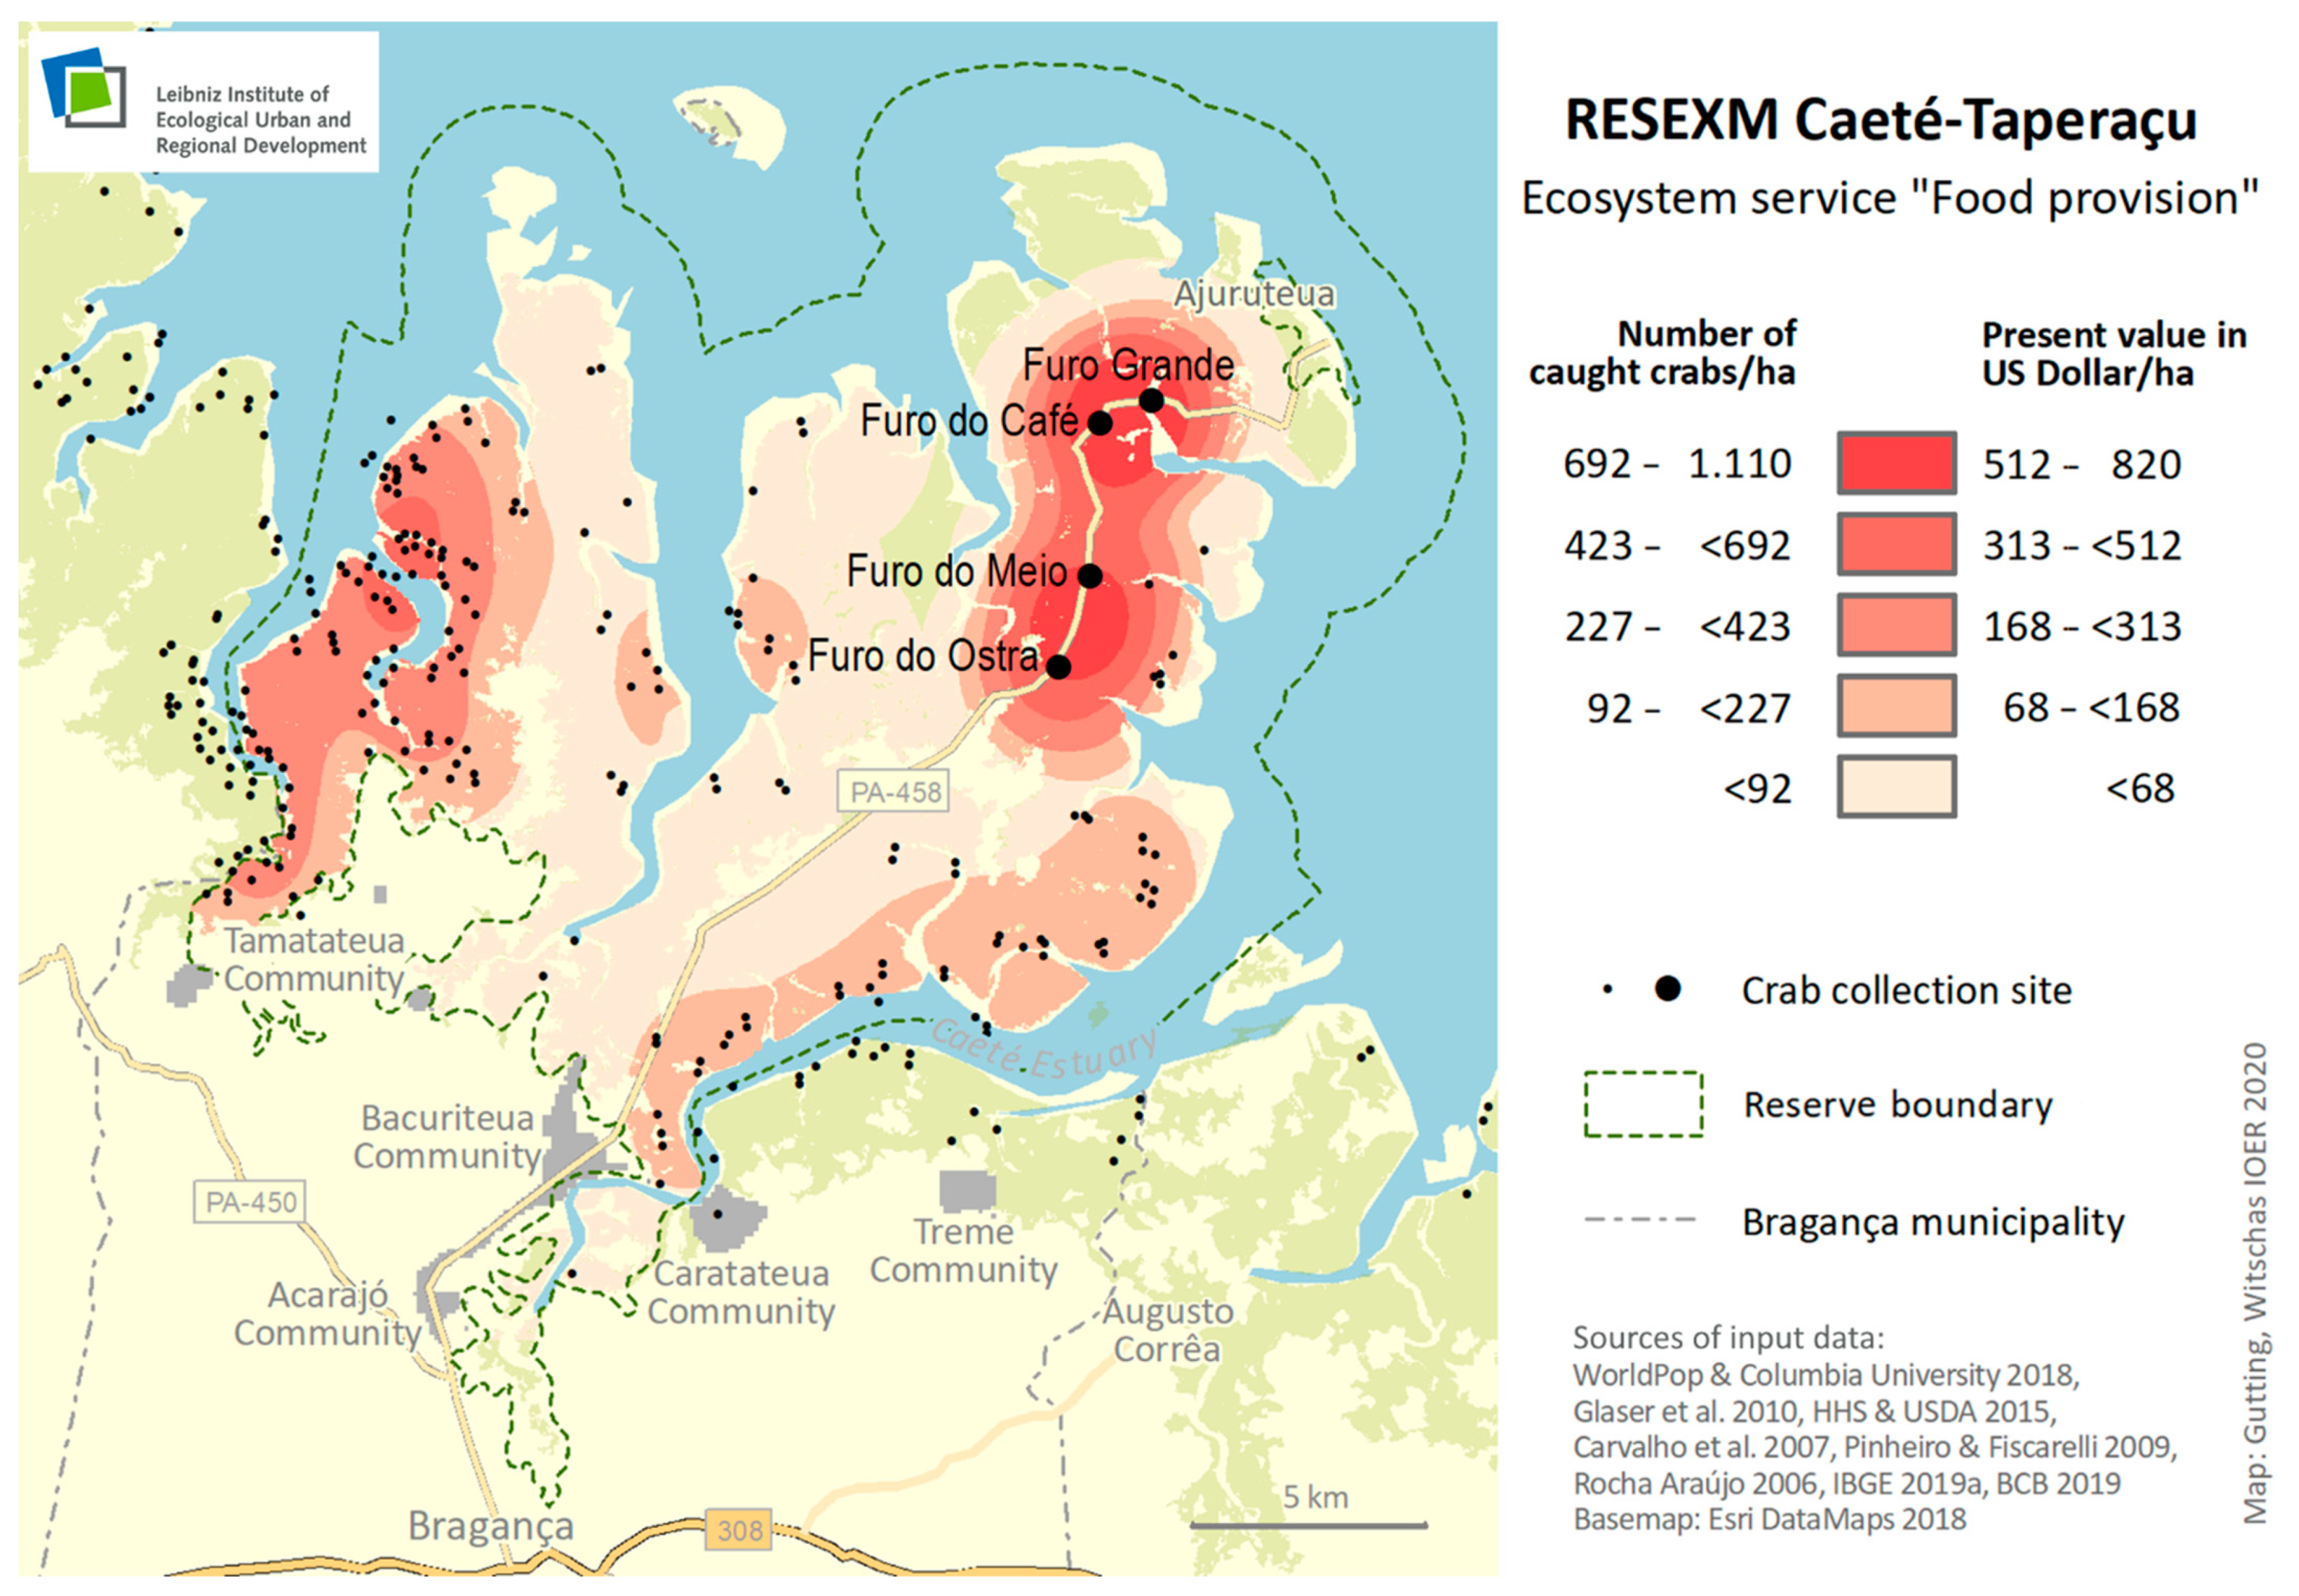
2.2.2. Valuation and Mapping of the Food Provisioning ES

The valuation of the food provisioning ES focuses on the mangrove crab Ucides cordatus. We regarded the subsistence use of crabs as a critical figure to measure how many crabs are caught in the forest per year for matching the basic protein need of the village communities within the SBA (Equation (2) and Figure 1). Quantification of the inhabitants as the subsistence demander of crabs was made possible through globally mapped raster population data available for different years, which estimate the number of residents in a 100 m × 100 m grid (Variable “Person” [36]). With regard to the analysis period, the population distribution in 2019 was used as the basis for the valuations and grid cells with more than 3.5 persons (= at least one household per grid cell, average household size in Pará [39], 877 grid cells in total) were selected. Of the households living in the villages in and around the reserve, 40% are using this crab species for personal consumption [6], which led us to assign this proportion to the number of inhabitants in each grid cell (Variable “Sub_crab”). The use of other sources of protein such as fish, clams, and other crab species has been documented. However, it is assumed that households that indicate crabs as a subsistence source of protein will focus on this food, because the crab collection practice is likely to be accompanied by a certain specialization of skills, which makes it more difficult for crab collecting households, for example, to operate the technically more complex fishing. To determine the daily need for crabs, the average daily protein requirement of a human in gram was used (Variable “Protein_requ”, [40]). Furthermore, empirical studies [41,42] show the share of the wet weight of proteins in gram in relation to the whole wet weight of the crab (Variable “Prot_weight”). We focused on large male crabs, since these are the primary target for consumption, and in accordance with the recommendation for sustainable crab fisheries. By dividing daily human protein requirement by protein wet weight, we obtained the number of crabs necessary to meet the protein demand and extrapolated the value to one year in every grid cell (Variable “Days”).
For mapping, the summed-up crab demand per year for all village grid cells was spatially distributed over the study area according to the collection sites of crab collectors, derived from the local empirical work of Rocha Araújo [28], who mapped the approximate collection sites in the mangroves for each of the four SBA communities, thus enabling us to digitise them in a GIS (Figure 2). The crab fishermen from the Tamatateua, Caratateua and Treme communities access the mangroves mainly by boat from the seaside. Crab fisherman from the Acarajó-Bacuriteua community, however, enter the woods from the terrestrial side by using the road traversing the Ajuruteua peninsula and gather at the four bridges Furo Grande, Furo da Ostra, Furo do Meio and Furo do Café to collect crabs in the surrounding mangroves. Since its construction, this road increased the accessibility of the mangrove forest and has led crab fishermen, especially from the Acarajó/Bacuriteua communities to enter the mangroves by foot from more central parts of the RESEXM Caeté-Taperaçu. The Caratateua community mainly focuses on the northern part of the Caeté estuary with small boats or canoes, which results in higher values along the river mouth. Treme community, however, is targeting other mangrove areas to the east of the RESEXM Caeté-Taperaçu but also to a minor extent the reserve itself [28].
Using the geolocation of those specific collection sites, it was possible to generate a continuous 30-m grid map of the region with the help of a kernel density operation. Each grid cell contains an estimated point density value depicting the average number of collection sites per km2 and represents a spatial pattern, which was used to distribute the whole subsistence crab demand per year within the respective mangroves. Single density values were put in relation to the summed density values of all grid cells to determine the proportion of crab demand that falls within each grid cell (Variable “Dis_fact”), which was then extrapolated from 900 m2 to one hectare.
For the monetary valuation, a replacement cost approach was used, following [43]. The replacement cost method assumes that, if the crab supply of the mangrove forest is completely depleted, it will have to be replaced by the supply of crabs from local markets nearby, e.g., Augusto Correa. This results in costs based on market prices, which in turn depict the economic ES value. The multiplication of the spatially distributed subsistence crab demand with a market price in USD per crab in each grid cell resulted in an economic value per year representing a yearly cash flow (Variable “US$/Crab”). The price per crab in 2019 was derived from [28] taking inflation into account [44]. Using the above-mentioned discounted cash-flow method, the present value for 2019 was derived for every grid cell (Variable “i” and “t”, Equations (1) and (2)).
Finally, a basic spatial distinction must be made. According to [28], the collection practice of the four communities spatially relates not only to the RESEXM Caeté-Taperaçu but also to neighbouring mangrove forests, producing a grid map during kernel density operation, which exceeds the SPA. While the distribution of the subsistence crab demand and its corresponding monetary value was estimated for this extended area, we focused only on the defined SPA within the RESEXM Caeté-Taperaçu [26,27] for the presentation of the results.
The present value for each mangrove grid cell within the RESEXM Caeté-Taperaçu was calculated using the formula:
P V = t = 1 10 ( ( D i s _ f a c t g c = 1 877 ( S u b _ c r a b P e r s o n ( P r o t _ r e q u D a y s P r o t _ w e i g h t ) ) ) ( U S $ C r a b ) ( 1 + i 100 ) t )
Variables:
  • PV = Present value for each grid cell
  • Dis_fact = Distribution factor to spatially distribute the whole number of crabs, i.e., subsistence crab demand of the four village communities, to each grid cell of the mangroves within the RESEXM area [28]
  • Gc = Grid cell number of the population raster data in the service benefitting area [36]
  • Sub_crab = Proportion of population within a population grid cell relying on crabs as a protein source (40%: [6])
  • Person = Number of persons per grid cell 2019 in the population raster data [36]
  • Prot_requ = Daily human protein requirement in grams (40.23 g: [40])
  • Days = Days per year (365)
  • Prot_weight = Average protein weight of big male crabs in gram (20.1 g: [41,42])
  • US$/Crab = Price per crab in US Dollar in December 2019 (USD 0.12/crab: [28,44])
Discount factor
  • i = 10-year average discount rate (monetary policy interest rate) (10%: [38])
  • t = Time of the cash flow in years starting in 2019 until 2029 (2020 = year 1 and so on)

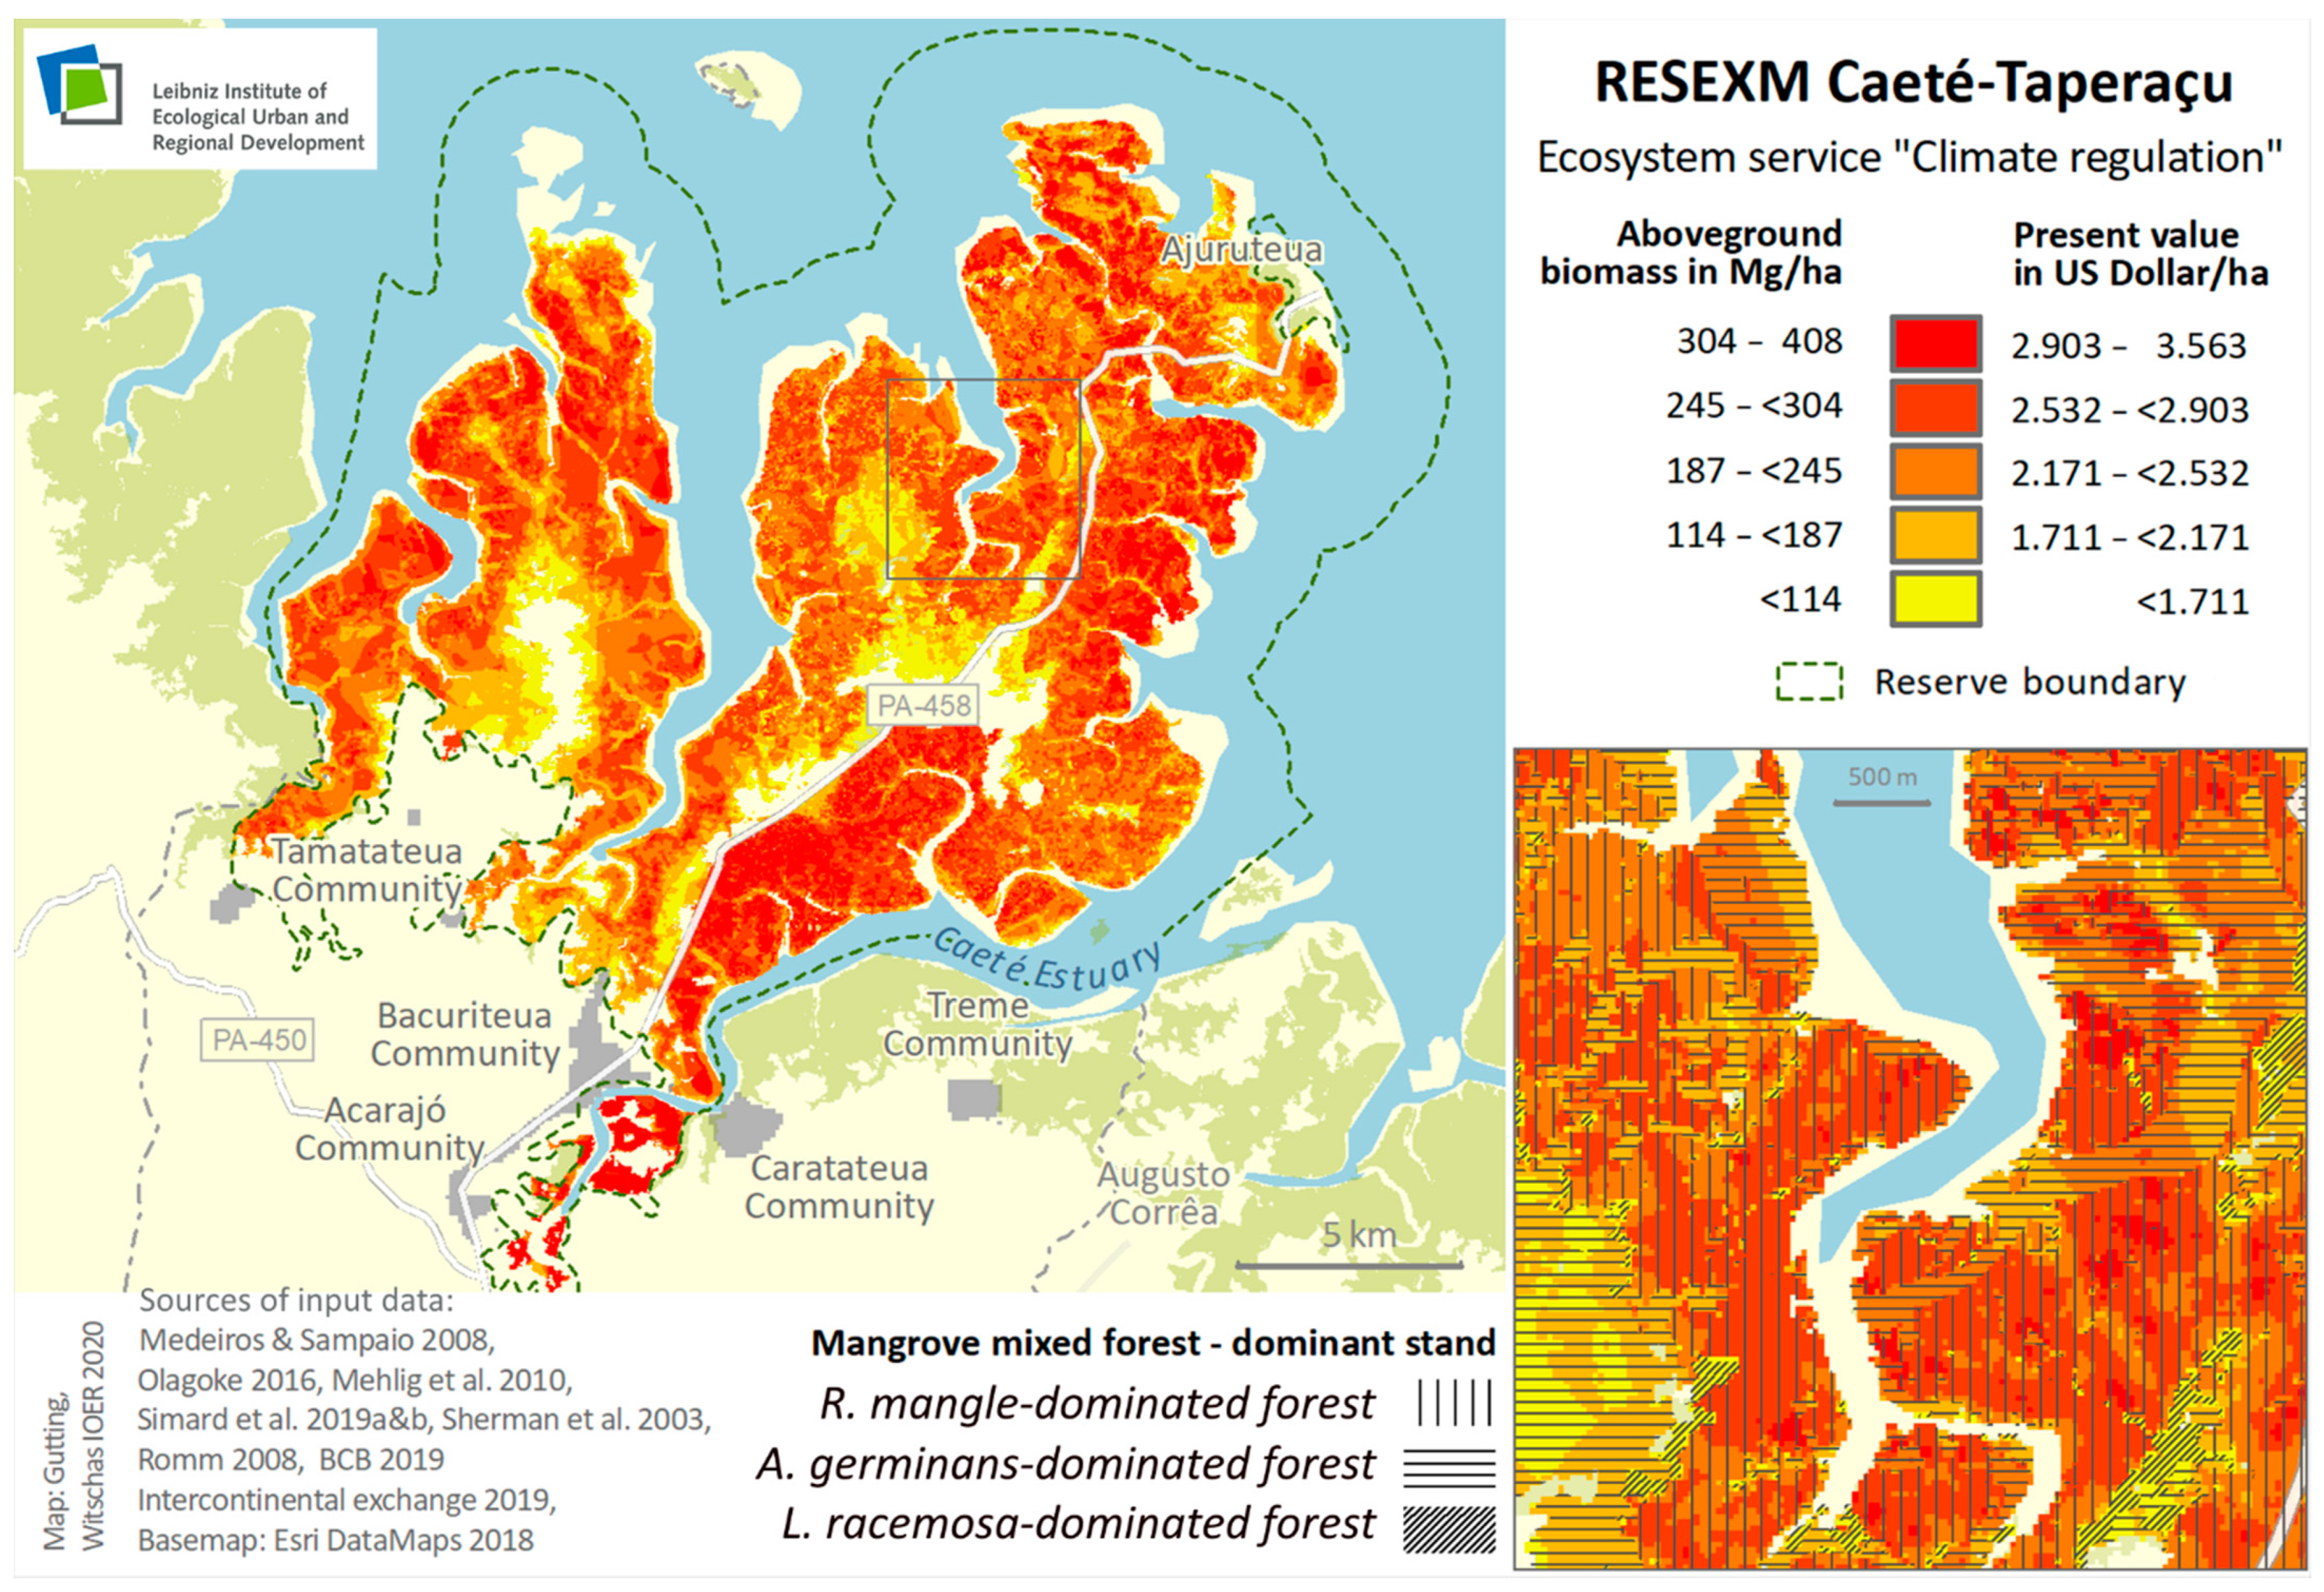
2.2.3. Valuation and Mapping of “Carbon Stock for Global Climate Regulation ES”

The valuation of the carbon stock within the RESEXM Caeté-Taperaçu was inspired by the analyses conducted by [3,18,19,43]. Comprehensive data availability allowed for ES valuation from the supply side. First, global raster data providing information on maximum tree height in a 30-m grid [19] were used as a spatial frame for physical and economic valuations. As this dataset contained some gaps within the SPA, missing values were spatially interpolated using the inverse distance weighting method (IDW). In a second step, aboveground biomass per grid cell in Mg was estimated using species-specific allometric equations (Equations (6)–(8)) empirically derived in the region (Brazil: Rhizophora mangle and Laguncularia racemosa, [33]; French Guyana: Avicennia germinans, [35]). For this operation, the species composition in each gird cell, together with tree height, diameter at breast height (DBH) and tree density are required as input parameters. Species composition was derived from Mehlig et al. [34], who provide a satellite-based mapping (raster data with 10-m resolution) of the three most relevant mangrove forest stands in terms of tree density of the respective species (tall forest dominated by R. mangle, A. germinans and L. racemosa respectively), which cover the Ajuruteua peninsula within the RESEXM Caeté-Taperaçu. Using this dataset, we classified each grid cell onto the three dominant mangrove stands by using GIS intersection operations. We also derived stand-specific average parameters based on the species-specific parameters of the species occurring in each stand, considering that a stand comprises more than the dominant species: diameter at breast height in cm (Variable “DBH”), tree height in meter (Variable “H”) and density in individuals per grid cell (Variable “Ind/Grid cell”) for R. mangle (Rm), A. germinans (Av) and L. racemosa (La) [34]. This is an important step since the same species in different stands show also different values for those variables. Following assumptions were made for estimating the overall aboveground biomass (in Mg) in each grid cell: Rhizophora stands comprise all three species (Equation (3)); Avicennia stands comprise A. germinans and R. mangle (Equation (4)); Laguncularia stands only comprise L. racemosa (Equation (5)) (see Supplementary Materials “Carbon stock for global climate regulation ES” for species- and stand-specific values). Spatial distribution of physical and monetary values results partly from the global grid-based tree height data from [19] mentioned above. The average tree height value for the allometric Equations (6)–(8) was replaced by the tree height data derived from the global dataset, but only for the dominant species in a forest stand, while applying local average values for diameter at breast height (DBH) and tree density. Parameters for the respective non-dominant species, i.e., tree height, diameter at breast height (DBH) and tree density, were considered as constant average values and led always to the same aboveground biomass in Mg per grid cell within a dominant stand.
The calculation of aboveground biomass in Mg for each mangrove grid cell within the RESEXM Caeté-Taperaçu followed the formulas:
A G B S u m R z = A G B R z + A G B A v + A G B L a
A G B S u m A v = A G B R z + A G B A v
A G B S u m L a = A G B L a
A G B R z = ( 0.2752 ( D B H R z 2 H R z ) 0.8529 I n d R z G r i d c e l l ) 1000
A G B A v = ( 0.072 ( D B H A v 2 H A v ) 0.91 I n d A v G r i d c e l l ) 1000
A G B L a = ( 0.1214 ( D B H L a 2 H L a ) 0.8615 I n d L a G r i d c e l l ) 1000
Variables:
  • AGBSumX = Stand-specific total aboveground biomass in Mg for R. mangle dominated stand (AGBSumRz), A. germinans dominated stand (AGBSumAv) and L. racemosa dominated stand (AGBSumLa) for each grid cell
  • AGBX = Species- and stand-specific aboveground biomass in Mg for R. mangle (AGBRz), A.germinans (AGBAv) and L. racemosa (AGBLa) for each grid cell [33,35]
  • DBHX = Species- and stand-specific diameter at breast height in cm for R. mangle (DBHRz), A. germinans (DBHAv) and L. racemosa (DBHLa) [34]
  • HX = Species- and stand-specific tree height in meter for R. mangle (HRz), A. germinans (HAv) and L. racemosa (HLa) [19,34]
  • IndX/Gridcell = Species- and stand-specific tree density in individuals per grid cell for R. mangle (IndRz/Gridcell), A. germinans (IndAv/Gridcell) and L. racemosa (IndLa/Gridcell) [19,34]
Then, the conversion to aboveground C and sequestered CO2 in Mg was done by applying carbon and carbon dioxide conversion factors (Variable “AGBSumtoC” and “CtoCO2”) according to [18,45]. The resulting sequestered CO2 in one grid cell represents the releasable stock (Equation (9)).
The replacement cost method was used for the monetary valuation, to convert the volume measure into an annual flow. The ability of a given area to sequester CO2 will be reduced upon mangrove degradation or loss. The latter can be compensated by purchasing CO2 certificates on various markets worldwide. The costs for a certificate were interpreted as replacement costs and were monetised applying the globally available certified emission reduction units (CER). In theory, the purchase of a certificate allows for the emission of 1 Mg CO2, which should be offset by the investment in environmental protection projects. A medium-term average of five US dollars per certificate was assumed for the valuations (Variable “US $/Mg CO2”, [46]).
The calculation of CO2 in Mg for each mangrove grid cell within the RESEXM Caeté-Taperaçu followed the formula:
Rel _ stock _ CO 2 = CtoCO 2 AGBSumtoC AGB Sum
AGBSumtoC = 0.451 CtoCO 2 = 3.67
Variables:
  • Rel_stock_CO2 = Releasable amount, total aboveground CO2 in Mg CO2 per grid cell
  • AGBSum = Sum of aboveground biomass in Mg per grid cell (obtained from Equations (3) to (5)
  • AGBSumtoC = Coefficient to convert from aboveground biomass to aboveground carbon weight (coefficient obtained via email from authors, same parameters used in [18] to value total carbon stocks)
  • CtoCO2 = Coefficient to convert carbon weight to CO2 weight [45]
The calculation of Present value for each mangrove grid cell within the RESEXM Caeté-Taperaçu used the formula:
P V = t = 1 10 ( ( ( N e t _ prim _ prod _ CO 2 + R e l _ stock _ CO 2 5 ) U S $ M g C O 2 ) ( 1 + i 100 ) t )
Variables:
  • PV = Present value for each grid cell
  • Net_prim_prod_CO2 = Average aboveground net primary productivity of the mangrove ecosystem in Mg CO2 per year and grid cell (2.94 Mg CO2/year and grid cell: [47])
  • Rel_stock_CO2 = Releasable amount, total aboveground CO2 in Mg CO2 per grid cell (Assumption: linear decay within 5 years, for year 6 to 10 the whole biomass is decayed and not part of the equation anymore)
  • US $/Mg CO2 = Assumed price of one certificate of the certified emission reduction market (CER) in US Dollar, equivalent to one Mg CO2 (USD 5/Mg CO2: [46])
Discount factor
  • i = 10-year average discount rate (monetary policy interest) (10%: [38])
  • t = Time of the cash flow in years starting in 2019 until 2029 (2020 = year 1 and so on)

3. Results

3.1. Food Provisioning ES

In 2019, the service benefitting area (SBA), defined as the four communities of Tamatateua, Acarajó/Bacuriteua, Caratateua and Treme, was inhabited by 15,741 persons in 4497 households following [36]. Under the assumption that 40% of that village population use crabs for personal consumption, 6300 persons in 1800 households satisfy their daily protein need through mangrove crabs. Focussing only on our study area, the RESEXM Caeté-Taperaçu, it can be estimated that 4980 persons in 1420 households depend on the collection and use of crabs as the main nutrition source, corresponding to a protein demand of 73 Mg resp. 3.6 million crabs per year.
Areas with high catch intensity can be observed at the western border of the smaller peninsula and at the northern tip of the Ajuruteua peninsula with 227 up to 1100 catches per hectare per year (Figure 2). More central parts indicate lower catch values with less than 227 catches per hectare per year. The corresponding present values range from 168 to USD 820 per hectare for the high catch intensity regions and lower than USD 168 per hectare for areas with lesser catch intensity. A wider area along the northern part of the Caeté estuary also shows moderate values both for crab catch and present values with a range from 92 to 226 catches per hectare per year resp. 68 to USD 167 per hectare. Based on the entire RESEXM Caeté-Taperaçu, the present value equates to USD 2.7 million, which corresponds to an average of USD 121 per hectare.
The crab collection practice of the four village communities (designated by black dots in Figure 2) strongly influences the spatial patterns observed in the final raster map. The high values at the western parts are caused by the crab fishermen of Tamatateua community entering the catch areas by boat from the seaside; they rely not only on the RESEXM Caeté-Taperaçu but also on the mangrove forests on the opposite side of the bay. The collection points along the road represent another strong influence driving the resulting spatial pattern of highest catch and present values observed around the four main collection sites at Furo Grande, Furo da Ostra, Furo do Meio and Furo do Café within central parts of the mangroves.

3.2. Carbon Stock for Global Climate Regulation ES

Based on the local species-specific mangrove distribution and physical parameters (average height, diameter at breast height (DBH) and density, [34]) and the satellite-based variable tree height data [19], the service providing area (SPA), i.e., the mangrove ecosystem of the RESEXM Caeté-Taperaçu, contains an aboveground biomass stock of 4.8 million Mg, which equates to a stock of approx. 2.1 million Mg C resp. 7.9 million Mg CO2 (Figure 3). Considering the aboveground biomass, the higher range lies between 187 and 408 Mg per hectare and covers a wide area of the peninsula (approximately 72% of all grid cells). Areas with less than 187 Mg per hectare are either directed as a narrow outer belt to the seaside or can be found in the most central elevated sites of the two peninsulas. On the Ajuruteua peninsula, parts of the mangrove forests had been severely affected by the road construction that resulted in salinization of large areas, and consequently caused large-scale die-back of formerly rich mangrove stands. Stands with high aboveground biomass often coincide with R. mangle-dominated forests. Compared to the other two forest stands, the trees in R. mangle-dominated forest are characterised by, on average, larger trunk diameters and tree heights (Annex “Carbon stock for global climate regulation ES” for species and stand-specific values), probably being a result of reaching a climax stage of mangrove succession [48]. Average tree density of R. mangle is also twice as high in these stands as in A. germinans-dominated stands. Central areas and the fringe directed to the Atlantic are more likely to be in the lower range of trunk diameter, tree height and density, as they are dominated either by A. germinans or, only as small patches, L. racemosa.
The corresponding present values range from USD 2171 per hectare to USD 3563 per hectare for areas with higher biomass and values of less than USD 2171 per hectare at the coastline and the inner parts of the RESEXM Caeté-Taperaçu. The total present value for the entire protected area amounts to USD 50.9 million with an average of USD 2290 per hectare.

4. Discussion

During the conception of the models and analyses, it became apparent that, in our specific case, the approach to map provisioning services, modelled here from the demand side only, differs significantly from that of regulating services, modelled from the supply side.

4.1. General Issue: ES Mapping of Remote Areas Using Local and Worldwide Available Data

For provisioning services modelled from the demand side, local data are often available as discrete values for specific locations, which require spatial interpolation when valuations are to be conducted for the whole study area. The analysis could be improved using primary extensive surveys, directed towards the detailed quantification of the demand patterns of the local population for ES, including not only spatial information about the collection practice, but also the amount of goods (e.g., crabs, wood and water) collected at each spot. Such local information, combined with surface interpolation methods in a GIS and information about the global human population distribution could be used for value estimation of other provisioning services, e.g., provision of wood for energy or construction purposes. When detailed surveys as part of the research project are not possible, secondary data, often scarce, have to be used, as this was the case here for the food provisioning ES. We concentrated on provisioning services modelled from the demand side; valuations of provisioning services from the supply side are even more challenging to conduct, since they have to consider not only socio-economic data on the use of ES but also the complex biotic and abiotic interactions that drive the ecosystem processes supporting those services.
There is also a difference between motile (able to move by themselves, e.g., animals) and stationery goods in terms of spatially explicit mapping. Value interpolation within the mangroves is only possible for stationery goods, since the extraction of the value, for example, the collection of a crab, takes place directly in the ecosystem. In the case of motile goods, such as fish as the target of commercial fishing, which is practiced mainly outside of the mangrove itself, breeding sites and food chains must be quantified and also the associated movement processes.
Achieving basic global results in mapping regulating services, even with moderate data availability, is easier. Regulating services are often based on biophysical processes (such as erosion, energy and matter transfer, and dilution), for which equation models may exist with associated geodata globally available at small-scale resolution and area-wide, but admittedly often with low accuracy and reliability. In addition, regulating services can be assigned usually to the supply side of ecosystem services, so that the entire service can be mapped without extensive surveys to determine the level of demand. In our specific case, the approach of combining global and local data to refine available global aboveground biomass estimations was solely centred around the climate regulation ES. In contrast to the method presented within the framework of provisioning ES, transferring this approach to other regulating ES is not easily possible because, depending on the ES, very different databases with specific requirements are necessary at the global and local levels.

4.2. Food Provisioning ES

The spatial distribution of the food provisioning ES followed the interpolation concept, where knowledge about preferred catch areas within the mangroves was used to spatially allocate the subsistence crab demand. However, the results of the spatial interpolation depend heavily on the empirical work of [28]. Despite being very comprehensive, both in terms of content and time, as the collection practice in the area was surveyed over a period of one year, it is certainly worth questioning whether spatial analyses, such as the one we carried out, should be based on a more detailed database and on a broader timescale. In the course of the research, we did not come across any newer research work with a similar level of detail. Additionally, it would also be worth investigating various extrapolation functions to minimize the influence of the local collection points.
The decision to model the food provisioning ES only from the demand side could also be questioned, as by doing so, we do not account for the provision of this ES in areas that are disregarded by the fishermen (for, e.g., accessibility reasons) while there might be large populations of crabs in those areas. Nonetheless, since the spatial demand is strongly influenced by conditions that refer to the supply side, e.g., through the number of available crabs or their accessibility, we are confident that the demand represents a part of the potential supply, so that when the demand is spatially located, part of the available supply is always mapped.
The crab Ucides cordatus is one of the most important sources of protein for the local population in the RESEXM Caeté-Taperaçu area. Based on a total crab yield (subsistence and commercial use) of around 1860 Mg for 2003 within Bragança municipality [28], the food provisioning ES corresponds to a present value of approximately USD 9.1 million. This indicates that the majority of the catches go to resellers, clients or the local markets, since the subsistence value of USD 2.7 million or 540 Mg per year for the RESEXM Caeté-Taperaçu contributes only to a minor extent to the total crab yield. Travel costs, inevitable if households have to buy crabs at a market, have not been included in the valuations as replacement costs so far, so the present value is likely to be even higher.
The exploitable biomass per year for this crab species was estimated by Diele et al. [31] to 1200 Mg for the eastern Ajuruteua Peninsula, when assuming a sustainable yield per year for all collection sites inside and outside Bragança municipality, reflect higher values. Under this condition, the estimated subsistence use of crabs as a protein source together with the commercial exploitation amounting to 1860 Mg can be considered somewhat sustainable. Nevertheless, crab fishers report decreasing sizes of crabs over the last decades, thus, while the crab used for the nutrition of the local population is within ecosystem capacity, the total extraction including the commercial part might not be sustainable in the long run.

4.3. Carbon Stock for Global Climate Regulation ES

The value distribution of the aboveground biomass stock and its corresponding C stocks and sequestered CO2 is more differentiated, which is related to the availability of very small-scale geodata used as the basis for the valuation. In contrast to the above-mentioned provisioning service, in which spatial interpolation methods had to be used to map physical or monetary values, high-resolution raster data, e.g., on species distribution at the local scale or maximum tree height at the global scale, are already available for the analysis of the climate regulation ES.
Additionally, globally available estimates for the aboveground biomass stock can be found in the literature and are available in public databases, which allows for comparison with our own estimates. Simard et al. [18,19] not only provide the global mangrove tree height data we used for our approach but also the aboveground biomass as Mg per hectare. In relation to our study area, the RESEXM Caeté-Taperaçu, the data show aboveground biomass of 106 Mg per hectare on average. Gardunho [49] developed his own allometric equations for the three abundant mangrove species of the Ajuruteua Peninsula on the basis of very extensive measurements of over 16,000 mangrove trees and estimated average aboveground biomass of 256 Mg per hectare for the peninsula. With 216 Mg per hectare aboveground biomass for the entire RESEXM area, our results are slightly lower, but they clearly tend towards the locally derived values of [49]. Therefore, when estimating the value of the ES climate regulation within mangrove ecosystems only relying on secondary data, better results can be achieved if local information is combined with global data. The use of local species-specific allometric equations and corresponding structural parameters seems to be crucial, since their integration during analysis led to a significant improvement of our aboveground biomass estimations in comparison to the global geodata [19]. However, our data might lead to a rather conservative (under)estimation of the carbon stock. We omitted the contribution of (i) dead wood or leaf litter, (ii) belowground biomass as well as (iii) sediment organic matter, knowing that the latter often exceeds the stocks in the aboveground biomass. While general approaches are available to estimate belowground biomass based on aboveground quantities using simple converting factors, those are neither species-specific nor taking regional differences into account and, thus, lack the accuracy needed for reliable small-scale valuation [18,19]. Moreover, they consider unrealistic linear models assuming linear belowground biomass increase in relation to the aboveground one, while this is hardly supported by empirical data. With regard to the quantification of the sediment organic matter, there are methodologically sophisticated global approaches available. Therefore, we would like to mention the global mangrove soil carbon database by Sanderman [17]. This approach uses a machine-learning data-driven model to quantify the distribution of soil carbon under mangrove forests globally and its spatial resolution is also based on a 30-m grid. According to this dataset, under R. mangle-dominated stands, up to 1300 Mg per hectare of soil organic matter could be added to our aboveground biomass results in the case study area. In principle, the data could well be combined with our results, but their approach does not differentiate between different mangrove stands (i.e., varying in tree species composition), the reason why we ignored this information in this study.
The estimation of CO2 release into the atmosphere from C stock data based on decay rates represents another challenging task and is often addressed by applying assumptions for the future use of the harvested mangrove wood. Basically, there are two possible pathways: (i) natural decay or (ii) accelerated or slowed decay through human utilisation. Natural decay can be modelled using empirically derived decay functions (e.g., [50,51]) that do not consider human influence, which is appropriate when the trees are not used as products. In the case where there is direct use of the trees by human communities, the models should consider the future human use of mangrove wood after clearing (e.g., for charcoal production, as firewood or for construction purposes). In reality, a combination of both pathways is occurring simultaneously, in different proportions depending on the location. In the case of charcoal production or firewood use, the CO2 release takes place much faster than it would have been under natural conditions, while the use as timber can retain the sequestered CO2 much longer within the construction. In our valuations, we assumed a full and linear decay of the C stock within five years, knowing that various scenarios are possible and a lot of them are common in the region. This adds to the complexity of modelling the climate regulation ES accurately.
The economic importance of the capacity of mangroves to sequester CO2 is one of the most volatile units in the valuation process. Monetisation was done with CO2 certificates and depending on the market, the price for 1 Mg CO2 differs considerably. The analyses assumed a constant price of 5 USD for 1 Mg CO2 based on a CER certificate. However, the price for one certificate in the European Emission Allowance System currently accounts for well over USD 20 per Mg CO2, thus leading to an economic value of the C stock four times as high as observed using CER certificates.

5. Conclusions

Methodologically, we evaluated and showed the plus-value of mapping provisioning and regulating ES provided by mangrove ecosystems combining published global data with empirically derived local information from the literature and statistics. Applying the described framework, additional provisioning services could be assessed with only a few adaptations since our approach is based on a globally mapped human population distribution. Therefore, also regional comparisons between different areas and even continents would be possible, using specific local data on the use of mangrove provisioning ES. The use of data originating from international databases having a global perspective and scale should be applied with caution, as accuracy at the local scale might be disputable. Nonetheless, despite their uncertainties, such datasets are highly valuable when we aim at global-scale comparisons. As we could show for the climate regulation ES, refining global data is possible and leads to a substantial increase in accuracy so that global data can also be applied to small-scale analyses without conducting extensive fieldwork. Nevertheless, depending on the spatial focus, one should limit the analyses to indicators and regions, for which data are available with adequate spatial resolution.
With our approach, areas with high demand in the case of food provisioning ES or high provision for climate regulation ES could be identified, highlighting where tight control and stricter regulations should be foreseen for upcoming plans and management within the RESEXM Caeté-Taperaçu. Nonetheless, a differentiated and comprehensive analysis of the major mangrove ecosystem services used by the local population should be considered to better inform future management strategies. Notably, as the interviews (Table 1) show, further research should be dedicated to cultural ecosystem services such as aesthetic interactions, spiritual/existence and educational values since they were highly rated. Finally, analyses of the governance situation would help better derivate recommendations for sustainable mangrove use and protection in the area. This was beyond the scope of this paper that aimed at developing and testing a new framework for ES quantification and valuation in a spatially explicit manner, combining precise local information with restricted spatial coverage and dataset with global coverage but less accurate information at the small-scale.
The small-scale and high-resolution representation and quantification of these two types of ES in the RESEXM Caeté-Taperaçu should enable a more targeted approach for the decision-makers in environmental protection and could allow for active monitoring of the socio-ecological development of the mangrove areas. In a broader perspective, global institutions such as IUCN demand that quantification and mapping of ecosystem services become mandatory in addition to the general community-oriented and integrated approach to conservation management. New methodologies for ES valuation and mapping, like the one presented here, should facilitate a value-based communication between resource users and nature conservation actors, to develop and implement sustainable use strategies.

Supplementary Materials

The following are available online at https://www.mdpi.com/article/10.3390/land10040432/s1.

Author Contributions

Conceptualization, R.G., R.-U.S., M.Z.; methodology, R.G., R.-U.S.; validation, R.G., R.-U.S., U.M., M.Z.; formal analysis, R.G.; investigation, K.G., R.-U.S., M.Z.; resources, U.M.; data curation, R.G.; writing—original draft preparation, R.G., R.-U.S.; writing—review and editing, R.G., R.-U.S., K.G., U.M., V.H., M.Z.; visualization, R.G.; supervision, M.Z.; project administration, R.-U.S., M.Z.; funding acquisition, M.Z. All authors have read and agreed to the published version of the manuscript.

Funding

This research was funded by Leibniz Association, grant number K218/2016.

Institutional Review Board Statement

Not applicable.

Informed Consent Statement

Informed consent was obtained from all subjects involved in the study.

Data Availability Statement

Not applicable.

Acknowledgments

The research was enabled and funded by the project “Digging into Sediments and Microbes for Nature conservation—Identifying the drivers of ecosystem processes for spatial conservation planning (DiSeMiNation)” by the German Leibniz association. The authors thank the Leibniz association and all involved researchers for their support and collaboration, in particular Moirah Menezes and Marcus E. B. Fernandes from the Federal University of Pará (UFPA), Campus Bragança, where we got great assistance and recommendations for our field work, Jörg Overmann, Olga Jeske and Johannes Sikorski from Leibniz Institute DSMZ—German Collection of Microorganisms and Cell Cultures, Steffen Neumann and Chris Ulpinnis from the Leibniz Institute of Plant Biochemistry, Hauke Reuter from the Leibniz Centre for Tropical Marine Research (ZMT), and Bevis Fedder from the Senator for Climate Protection, Environment, Mobility, Urban Development and Housing of the Free Hanseatic City of Bremen. Many thanks go to Sabine Witschas for improving the included maps and to Conny Heße for managing the financial issues from the Leibniz Institute of Ecological Urban and Regional Development (IOER) and to the administration of this institute for the support of the open access publication.

Conflicts of Interest

The authors declare no conflict of interest.

References

  1. Syrbe, R.U.; Grunewald, K. Ecosystem service supply and demand—the challenge to balance spatial mismatches. Int. J. Biodivers. Sci. Ecosyst. Serv. Manag. 2017, 13, 148–161. [Google Scholar] [CrossRef] [Green Version]
  2. Syrbe, R.U.; Walz, U. Spatial indicators for the assessment of ecosystem services: Providing, benefiting and connecting areas and landscape metrics. Ecol. Indic. 2012, 21, 80–88. [Google Scholar] [CrossRef]
  3. Atkinson, S.C.; Jupiter, S.D.; Adams, V.M.; Ingram, J.C.; Narayan, S.; Klein, C.J.; Possingham, H.P. Prioritising Mangrove Ecosystem Services Results in Spatially Variable Management Priorities. PLoS ONE 2016, 11, 1–21. [Google Scholar] [CrossRef] [Green Version]
  4. Cannicci, S.; Burrows, D.; Fratini, S.; Smith, T.J.; Offenberg, J.; Dahdouh-Guebas, F. Faunal impact on vegetation structure and ecosystem function in mangrove forests: A review. Aquat. Bot. 2008, 89, 186–200. [Google Scholar] [CrossRef]
  5. Fernandes, M.E.B.; Oliveira, F.P.; Eyzaguirre, I.A.L. Mangroves on the Brazilian Amazon Coast: Uses and Rehabilitation. In Threats to Mangrove Forests; Coastal Research Library; Makowski, C., Finkl, C.W., Eds.; Springer: Cham, Switzerland, 2018; Volume 25, pp. 621–635. [Google Scholar] [CrossRef]
  6. Glaser, M.; Krause, G.; Oliveira, R.S. Fontalvo-Herazo, M. Mangroves and People: A Social-Ecological System. In Mangrove Dynamics and Management in North Brazil; Ecological Studies; Saint-Paul, U., Schneider, H., Eds.; Springer: Berlin/Heidelberg, Germany, 2010; Volume 211, pp. 307–351. [Google Scholar] [CrossRef]
  7. Nagelkerken, I.; Blaber, S.J.M.; Bouillon, S.; Green, P.; Haywood, M.; Kirton, L.G.; Meynecke, J.O.; Pawlik, J.; Penrose, H.M.; Sasekumar, A.; et al. The habitat function of mangroves for terrestrial and marine fauna: A review. Aquat. Bot. 2008, 89, 155–185. [Google Scholar] [CrossRef] [Green Version]
  8. Polidoro, B.A.; Carpenter, K.E.; Collins, L.; Duke, N.C.; Ellison, A.M.; Ellison, J.C. The Loss of Species: Mangrove Extinction Risk and Geographic Areas of Global Concern. PLoS ONE 2010, 5, e10095. [Google Scholar] [CrossRef]
  9. Worthington, T.A.; Andradi-Brown, D.A.; Bhargava, R.; Buelow, C.; Bunting, P.; Duncan, C.; Fatoyinbo, L.; Friess, D.A.; Goldberg, L.; Hilarides, L.; et al. Harnessing Big Data to Support the Conservation and Rehabilitation of Mangrove Forests Globally. One Earth 2020, 2, 429–443. [Google Scholar] [CrossRef]
  10. Goldberg, L.; Lagomasino, D.; Thomas, N.; Fatoyinbo, T. Global declines in human-driven mangrove loss. Glob. Chang. Biol. 2020, 26, 5844–5855. [Google Scholar] [CrossRef] [PubMed]
  11. Hamilton, S.E.; Casey, D. Creation of a high spatio-temporal resolution global database of continuous mangrove forest cover for the 21st century (CGMFC-21). Glob. Ecol. Biogeogr. 2016, 25, 729–738. [Google Scholar] [CrossRef]
  12. Sandilyan, S.; Kathiresan, K. Mangrove conservation: A global perspective. Biodivers. Conserv. 2012, 21, 3523–3542. [Google Scholar] [CrossRef]
  13. Barbier, E.B.; Hacker, S.D.; Kennedy, C.; Koch, E.W.; Stier, A.C.; Silliman, B.R. The value of estuarine and coastal ecosystem services. Ecol. Monogr. 2011, 81, 169–193. [Google Scholar] [CrossRef]
  14. Himes-Cornell, A.; Pendleton, L.; Atiyah, P. Valuing ecosystem services from blue forests: A systematic review of the valuation of salt marshes, sea grass beds and mangrove forests. Ecosyst. Serv. 2018, 30, 36–48. [Google Scholar] [CrossRef]
  15. Mehvar, S.; Filatova, T.; Dastgheib, A.; De Ruyter van Steveninck, E.; Ranasinghe, R. Quantifying economic value of coastal ecosystem services: A review. J. Mar. Sci. Eng. 2018, 6, 5. [Google Scholar] [CrossRef] [Green Version]
  16. Vo, Q.T.; Kuenzer, C.; Vo, Q.M.; Moder, F.; Oppelt, N. Review of valuation methods for mangrove ecosystem services. Ecol. Indic. 2012, 23, 431–446. [Google Scholar] [CrossRef]
  17. Sanderman, J. Global mangrove soil carbon: Dataset and spatial maps. Harv. Dataverse 2017, 4. [Google Scholar] [CrossRef]
  18. Simard, M.; Fatoyinbo, L.; Smetanka, C.; Rivera-monroy, V.H.; Castaneda-Moya, E.; Thomas, N.; Van der Stocken, T. Mangrove canopy height globally related to precipitation, temperature and cyclone frequency. Nat. Geosci. 2019, 12, 40–45. [Google Scholar] [CrossRef]
  19. Simard, M.; Fatoyinbo, L.; Smetanka, C.; Rivera-monroy, V.H.; Castaneda-Moya, E.; Thomas, N.; Van der Stocken, T. Global Mangrove Distribution, Aboveground Biomass, and Canopy Height; ORNL DAAC: Oak Ridge, TN, USA, 2019. [CrossRef]
  20. Alongi, D.M. Present State and Future of the World’s Mangrove Forests. Environ. Conserv. 2002, 29, 331–349. [Google Scholar] [CrossRef] [Green Version]
  21. Syrbe, R.U.; Schröder, M.; Grunewald, K.; Walz, U.; Burkhard, B. What to map? In Mapping Ecosystem Services; Burkhard, B., Maes, J., Eds.; Pensoft Publishers: Sofia, Bulgaria, 2017; pp. 151–158. [Google Scholar] [CrossRef]
  22. ICMBio (Instituto Chico Mendes de Conservação da Biodiversidade). Plano de manejo da reserve extrativista marinha de Caeté-Taperaçu. In Portuguese, English Title: Caete-Taperacu Marine Reserve Management Plan PA; 2012; p. 339. Available online: https://repositorio.unb.br/handle/10482/14358 (accessed on 1 January 2021).
  23. Ruiz-Pérez, M.; Almeida, M.; Dewi, S.; Costa, E.M.; Pantoja, M.C.; Puntodewo, A.; de Postigo, A.A.; de Andrade, A.G. Conservation and development in Amazonian extractive reserves: The case of Alto Juruá. Ambio 2005, 34, 218–223. [Google Scholar] [CrossRef]
  24. Glaser, M.; Krause, G. Integrated coastal management in federal Brazil: Institutional sectoral and legal structures and the limits of participative planning. (In German, title: Integriertes Küstenmanagement im föderalen Brasilien: Institutionelle, sektorale und legale Strukturen und die Grenzen der partizipativen Planung). In Kueste, Oekologie und Mensch—Integriertes Kuestenmanagement als Instrument nachhaltiger Entwicklung; Glaeser, B., Ed.; Humanoekologie: Oekom, Munchen, 2005; Volume 2, pp. 37–54. [Google Scholar]
  25. Saint-Paul, U.; Schneider, H. (Eds.) Mangrove Dynamics and Management in North Brazil, Ecological Studies; Springer: Berlin/Heidelberg, Germany, 2010; Volume 211. [Google Scholar] [CrossRef]
  26. Bunting, P.; Rosenqvist, A.; Lucas, R.; Rebelo, L.-M.; Hilarides, L.; Thomas, N.; Hardy, A.; Itoh, T.; Shimada, M.; Finlayson, C.M. The Global Mangrove Watch—A New 2010 Global Baseline of Mangrove Extent. Remote Sens. 2018, 10, 1669. [Google Scholar] [CrossRef] [Green Version]
  27. UNEP-WCMC; IUCN; Protected Planet. The World Database on Protected Areas (WDPA); UNEP-WCMC and IUCN: Cambridge, UK, 2019. [Google Scholar]
  28. Rocha Araújo, A.R. Fishery Statistics and Commercialization of the mangrove crab, Ucides cordatus (L.) in Bragança, Pará, Brazil. Dissertation/Ph.D. Thesis, Universityof Bremen, Bremen, Germany, 2006. [Google Scholar]
  29. European Commission. Mapping and Assessment of Ecosystems and their Services—An Analytical Framework for Mapping and Assessment of Ecosystem Condition in EU. Discussion Paper. 2018, p. 60. Available online: https://ec.europa.eu/environment/nature/knowledge/ecosystem_assessment/pdf/2ndMAESWorkingPaper.pdf (accessed on 1 January 2021).
  30. European Environment Agency CICES—Towards a Common Classification of Ecosystem Services. 2020. Available online: https://cices.eu/ (accessed on 17 March 2021).
  31. Diele, K.; Koch, V.; Saint-Paul, U. Population structure, catch composition and CPUE of the artisanally harvested mangrove crab Ucides cordatus (Ocypodidae) in the Caeté estuary, North Brazil: Indications for overfishing? Aquat. Living Resour. 2005, 18, 169–178. [Google Scholar] [CrossRef] [Green Version]
  32. Sullivan, M.J.P.; Talbot, J.; Lewis, S.L.; Phillips, O.L.; Qie, L.; Begne, S.K.; Chave, J.; Cuni-Sanchez, A.; Hubau, W.; Lopez-Gonzalez, G.; et al. Diversity and carbon storage across the tropical forest biome. Sci. Rep. 2017, 7, 39102. [Google Scholar] [CrossRef] [Green Version]
  33. Medeiros, T.C.C.; Sampaio, E.V.S.B. Allometry of aboveground biomasses in mangrove species in Itamaracá, Pernambuco, Brazil. Wetl. Ecol. Manag. 2008, 16, 323–330. [Google Scholar] [CrossRef]
  34. Mehlig, U.; Menezes, M.P.M.; Reise, A.; Schories, D.; Medina, E. Mangrove Vegetation of the Caeté Estuary. In Mangrove Dynamics and Management in North Brazil; Saint-Paul, U., Schneider, H., Eds.; Ecological Studies; Springer: Berlin/Heidelberg, Germany, 2010; Volume 211, pp. 71–107. [Google Scholar] [CrossRef]
  35. Olagoke, A. Towards a Better Characterization of Morphological Plasticity and Biomass Partitioning of Trees in Structural Dynamics of Mangrove Forests. Dissertation/Ph.D. Thesis, Technical University of Dresden, Dresden, Germany, 2016. [Google Scholar]
  36. WorldPop (School of Geography and Environmental Science, University of Southampton; Department of Geography and Geosciences, University of Louisville; Departement de Geographie, Universite de Namur) and Center for International Earth Science Information Network (CIESIN), Columbia University 2018, Global High Resolution Population Denominators Project—Funded by The Bill and Melinda Gates Foundation (OPP1134076), Internet Database. Available online: https://www.worldpop.org/geodata/summary?id=6414 (accessed on 17 April 2021).
  37. Kruschwitz, L.; Loeffler, A. Discounted Cash Flow: A Theory of the Valuation of Firms; Wiley: Hoboken, NJ, USA, 2006. [Google Scholar]
  38. BCB (Banco Central do Brasil) Interest rates—Actual SELIC rate % p.y. 2019. Available online: https://www.bcb.gov.br/en/legacy?url=https:%2F%2Fwww.bcb.gov.br%2FPec%2FCopom%2FIngl%2FtaxaSelic-i.asp#notas (accessed on 17 March 2020).
  39. IBGE (Instituto Brasileiro de Geografia e Estatistica) Continuous National Household Sample Survey—Continuous PNAD. 2019. Available online: https://www.ibge.gov.br/en/statistics/social/housing/18083-annual-dissemination-pnadc3.html?edicao=24560&t=resultados (accessed on 17 March 2020).
  40. HHS (U.S. Department of Health and Human Services); USDA (U.S. Department of Agriculture). 2015–2020 Dietary Guidelines for Americans, 8th ed.; U.S. Department of Health and Human Services: Rockville, MD, USA, 2015; 125p.
  41. Carvalho, A.F.U.; Farias, D.F.; Barroso, C.X.; Sombra, C.M.L.; Silvino, A.S.; Menezes, M.O.T.; Soares, M.O.; Fernandes, D.A.O.; Gouveia, S.T. Nutritive value of three organisms from mangrove ecosystem: Ucides cordatus (Linnaeus, 1763), Mytella sp. (Soot-Ryen, 1955) and Crassostrea rhizophorae (Guilding, 1828). Braz. J. Biol. 2007, 67, 787–788. [Google Scholar] [CrossRef] [PubMed] [Green Version]
  42. Pinheiro, M.A.A.; Fiscarelli, A.G. Length-weight relationship and condition factor of the mangrove crab Ucides cordatus (Linnaeus, 1763) (Crustacea, Brachyura, Ucididae). Braz. Arch. Biol. Technol. 2009, 52, 397–406. [Google Scholar] [CrossRef] [Green Version]
  43. Pascal, N.; Bulu, M. Economic Valuation of Mangrove Ecosystem Services in Vanuatu: Case Study of Crab Bay (Malekula is.) and Eratap (Efate is.); Technical Report for Project Mescal: Suva, Fiji, 2013. [Google Scholar]
  44. IBGE (Instituto Brasileiro de Geografia e Estatistica) Índice Nacional de Preços ao Consumidor Amplo—IPCA. 2019. Available online: https://www.ibge.gov.br/estatisticas/economicas/precos-e-custos/9256-indice-nacional-de-precos-ao-consumidor-amplo.html?=&t=o-que-e (accessed on 17 March 2020).
  45. Romm, J. The biggest source of mistake: C vs. CO2. 2008. Available online: https://archive.thinkprogress.org/the-biggest-source-of-mistakes-c-vs-CO2-c0b077313b/ (accessed on 17 March 2020).
  46. Intercontinental exchange CER Futures. 2019. Available online: https://www.theice.com/products/814666/CER-Futures/data?marketId=5236635&span=2 (accessed on 17 March 2020).
  47. Sherman, R.; Fahey, T.; Martinez, P. Spatial Patterns of Biomass and Aboveground Net Primary Productivity in a Mangrove Ecosystem in the Dominican Republic. Ecosystems 2003, 6, 384–398. [Google Scholar] [CrossRef]
  48. Quadros, A.F.; Zimmer, M. Dataset of “true mangroves” plant species traits. Biodivers. Data J. 2017, 5, e22089. [Google Scholar] [CrossRef] [Green Version]
  49. Gardunho, D.C.L. Estimativa de biomassa e carbono acima do solo das especies arbóreas dominantes nas florestas de mangue da peninsula de Ajuruteua, nordeste do Pará, Costa Amazônica Brasileira 2018. Ph.D. Thesis, University of Bragança, Bragança, Brazil. Unpublished Dissertation.
  50. Herault, B.; Beauchene, J.; Muller, F.; Wagner, F.; Baraloto, C.; Blanc, L.; Martin, J.M. Modeling decay rates of dead wood in a neotropical forest. Oecologia 2010, 164, 243–251. [Google Scholar] [CrossRef]
  51. Pingoud, K.; Skog, K.E.; Martino, D.L.; Tonosaki, M.; Xiaoquan, Z. Chapter 12—Harvested wood products. In IPCC—National Guidelines for Greenhouse Gas Inventories; Eggleston, S., Buendia, L., Miwa, K., Ngara, T., Tanabe, K., Eds.; The Institute for Global Environmental Strategies (IGES) for the IPCC 2006: Hayama, Japan, 2006; Volume 4, Available online: https://www.ipcc-nggip.iges.or.jp/public/2006gl/pdf/4_Volume4/V4_12_Ch12_HWP.pdf (accessed on 1 January 2021).
Figure 1. Case study area—Spatial extension of the study area RESEXM Caeté-Taperaçu in Brazil.
Land 10 00432 g001
Figure 2. Ecosystem service food provision—Spatial distribution of number of caught crabs/ha and year and present value in US Dollar/ha for 2020 within the RESEXM Caeté-Taperaçu.
Land 10 00432 g002
Figure 3. Ecosystem service global climate regulation—Spatial distribution of aboveground biomass in Mg/ha and present value in US Dollar/ha for 2020 within the RESEXM Caeté-Taperaçu.
Land 10 00432 g003
Table 1. Evaluation of the importance of different ecosystem services. Shown are three services per category after the CICES classification with the number of highest valuation value.
Ecosystem Service CategoryEcosystem Service
ProvisioningFood from wild animals (e.g., crab, fish, honey) (Highest values 9 × 5)
Timber and fibers from trees or other plants (Highest values 6 × 5)
Water for general use (Highest values 6 × 5)
RegulatingNursery populations and habitats (Highest values 9 × 5)
Flood protection/Storm protection and air purification/ CO2-storage and global climate regulation (Highest values 6 × 5)
Coastal stabilization and control of erosion rates (Highest values 6 × 5)
CulturalAesthetic interactions (Highest values 7 × 5)
Spiritual/existence (Highest values 4 × 5)
Educational interactions (Highest values 7 × 5)
Publisher’s Note: MDPI stays neutral with regard to jurisdictional claims in published maps and institutional affiliations.

