Abstract
The Metropolitan Area of Quito has experienced exponential growth in recent decades, especially in peri-urban sectors. The literature has described this process as “urban sprawl”, a phenomenon that is changing the landscape by increasing land consumption and forming conurbations with the nearest populated centers. This article proposes a new, broader and more complex metropolitan structure for the metropolis of Quito, the linking of neighboring and conurbed areas to the form a new metropolitan area based on the case study of the Metropolitan District of Quito (DMQ). This new metropolitan area identification considers the interpretation of satellite images and the classification of land uses, highlighting the main urban growth areas located outside, but contiguous to the administrative limit of the DMQ, over a period of 19 years (1998 to 2017), the demographics analysis, particularly the densification of new urban peripheral areas close to the DMQ border and the mobility links of population, goods and services between human settlements that allows the configuration of urban corridors and the integration of the territory. The main findings evaluated are the need to evaluate urban planning strategies aimed at sustainable development.
1. Introduction
Urbanization is undoubtedly one of the most irreversible forms of land use transformation [1]. Approximately 54% of the world’s population lives in urban areas, a percentage that does not represent the great disparity between the degrees of urbanization that exist around the world. Asia and Africa have urban percentages of close to 40% while Europe, Oceania and North America are close to 70%. In the case of Latin America, this proportion approaches 80% and it is estimated that by 2050, 88.7% percent of the population will be urban [2].
Urbanization is a complex process of change from rural lifestyles to urban lifestyles, which has shown exponential growth since the late 19th century. There are many studies on how the urban structure of large cities like Beijing, Shanghai and Guangzhou, for example, are changing from the concentric zone cities of the industrial age to the decentralized multi-nuclear cities of today, like the postindustrial forms being taken by cities in the United States, Canada, Australia and Europe [3]. This dynamic indicates the alarming rate of urbanization and the extent of sprawl that could take place. In the same way, the main Latin America’s main urban areas have transitioned from radio-centric and delimited cities towards spatial configurations that expand physically, economically and functionally, bringing together urban agglomerations in a continuous or discontinuous morphology as well as non-agglomerated urban centers and their adjacent urban or rural areas. That is, how a new territorial and planning scale is structured [4].
Urban sprawl is a phenomenon that is changing landscapes worldwide. The physical expansion of cities is carried out at the expense of covering agricultural, forest or natural surfaces with urban land uses, degrading the natural resources that sustain the city [5]. The increasing consumption of land for urbanization and the decrease in population density in peri-urban areas has extensively consumed rural land on the periphery of cities. As a result, conurbations with the closest populated centers are formed [6]. These processes originate a series of urban social demands for infrastructure, services, transportation, and other anthropic pressures that are increasingly evident on the natural environment (agricultural and conservation areas), leading to unsustainable development. In this sense, Desmond [7] has argued that it is necessary for countries to implement land use planning strategies, or as Fernández [8] says, strategic planning based on models capable of territorializing land use public policies, mainly in the urban borders is essential.
1.1. The Inefficient Peri-Urban Control Process in Latin America
In Latin America, the process of consolidation of metropolises has differed greatly from those in Europe and North America. In Latin America, the rural-city migration process is not due to the formation of manufacturing peripheries that respond to the industrialization of the economy, but rather respond to a process of fragmentation of the city and added-value gains through speculation at best [9]. Two logics prevail in operations on peripheral urban territories of Latin America: on the one hand, the market as an organizing agent that, through informal or privatizing mechanisms, results in settlements on the periphery under the logic of lower land prices. On the other hand, urbanization policies and the weak role of the state in the regularization of land markets has resulted in a kind of periphery populated with lower-income settlements through mechanisms that drive the poor into social housing developments where peripherality is the logic of urban development [10].
Fragmentation means that new forms of segregation may appear. Different social statuses can be found on the fragmented periphery, but with increasingly visible limits that separate the poor from the privileged [11]. These inhabitants located in increasingly remote territories poorly served by the city generate a dependency by the poorest groups on the urban center. The shortage of work, education, health services, commerce or recreational areas in their spaces of residence, forces citizens to travel long distances in “pendular” trips to cover their needs and carry out daily activities to then return to their houses. In Avellaneda’s words, citizens are obliged to constantly move to spaces far from their residences, where their living space is far broader than their residential space [12].
Thus, the so-called urban corridors are formed, which move the inhabitants to the urban center daily. Infrastructure and services begin to be located in these areas, aimed at satisfying the demand of the new floating population that moves with economic flows and according to the permissiveness of the institutions in search of a livelihood with variable temporalities and spatialities [13].
Consequently, the physical occupation of the territory occurs discontinuously when residential areas, shopping centers, work groups or industries are built in areas surrounding the consolidated urban area or in forest or agricultural areas around the city far from each other. The residual space runs the risk of being urbanized over time due to its real estate value [14].
There is usually little variation in land uses in the residential areas of the periphery. The single-family house predominates and is generally far from work centers, service infrastructure, and commerce. Hence, the predominance of car use is a direct consequence of the low density and the scant land use diversity, as it is not profitable to introduce mass public transport. The inhabitants of social housing in the periphery spend up to 30% of total household income on transportation costs [15].
All of this has deteriorated the quality of environmental services and increased the contamination of soil, water, and air, which make areas more vulnerable to natural disasters [16]. The substitution of natural and vegetable areas for urbanized areas has caused the loss of fertile soil and with it, originated conflicts over this agricultural space. In the peri-urban area, there is competition among producers, who can be specialized farmers or agricultural producers located in lands far from the city where they can obtain better production margins. Some farmers have dedicated themselves to planting and harvesting specialized products such as vegetables, prepackaged, or the production of ornamental plants in greenhouses [14].
Peri-urban spaces also present the following new potentials: They focus on the daily demand for fresh products by the large urban market and therefore the link between this space and local, regional, national and global markets, clearly dependent on the urban system [14]. The peripheral spaces articulate the commercial flows that attract new inhabitants, leading to increased land consumption [17]. In addition, peripheral expansion leads to the redistribution of the workforce due to the growth of the metropolitan economy, fueled by a migration from rural areas to the city. Industries or large companies use labor that is from their own areas, but there are also certain “specialists” who come from the central area [18].
1.2. Quito: A Discontinuous and Divided Territory
The Metropolitan District of Quito (DMQ in Spanish) is located in the Province of Pichincha in the north-central highlands of Ecuador, within the hydrographic sub-basin of the Guayllabamba river belonging to the Esmeraldas basin. The DMQ is the political-administrative-economic capital of the country. It borders the provinces of Imbabura, Napo, Cotopaxi and Santo Domingo de los Tsáchilas.
This research analyzes the case of Quito, a city that has begun to present territorial-morphological changes, specifically in its peri-urban area, like the rest of the large Latin American metropolises.
The urban area of Quito grew 500% between 1962 and 1980 [19], producing discontinuous and fractional growth, so a new functional structure was established through a proposal for a district organization that was limited to controlling, regulating, and rationalizing the city’s physical development. By declaring the Metropolitan District of Quito in 1993 [20], the goal of deconcentrating the administration and controlling urban growth was set [21].
The concept of metropolization in the official municipal planning of the city of Quito appears with the incorporation of the road infrastructure that allows the development of urban expansion through the city’s integration with neighboring areas. The rural parishes (a type of sub-districts) that adjoin the city acquire the figure of “urban expander” [9]. Consequently, in the 1990s and early 2000s the city began to overflow. This phenomenon was fostered by the increase in road arteries across the city and by the new real estate projects located around the new Quito airport.
Thus, it went from a longitudinal territorial configuration to a polycentric structure. This expansive urban growth gradually occupied rural parishes located in the adjacent valleys which also adjoin other neighboring cantons (Mejía, Rumiñahui, Cayambe, and Pedro Moncayo). Remarkably, this expansion boosted the interaction and complementarity with the DMQ, surpassing Quito Canton’s current administrative limits (Figure 1).
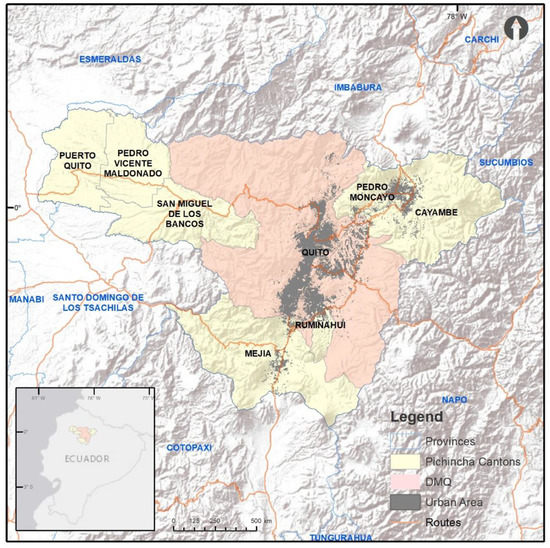
Figure 1.
Spatial location of the Metropolitan District of Quito (DMQ) and its neighboring cantons and parishes in the Province of Pichincha.
The tendency toward conurbation, urban dispersion and the increasing functional interdependencies between metropolitan Quito and the neighboring cantons have allowed the formation of a metropolitan territorial structure with various inefficiencies, including the oversaturation of infrastructure and services, which concentrates urban activities within the city of Quito. Moreover, the mobility system between cantons and parishes is discontinuous: transportation services from the urban area of Quito to the cantons and parishes are scarce and generally there is only one transport company for each route [22]. Most of them do not cover all of the cantons and on many occasions, they do not have access to populated areas [23] due to the lack of a transport network, thus limiting direct movement between the urban center and the metropolitan peripheries [24]. In addition to the low occupation density of urban areas, in which around 21% remains unoccupied (there are 86,448 undeveloped plots in the DMQ within the areas defined as urban; of these vacant areas, 48% correspond to the central city area and 52% is in the urban areas corresponding to rural parishes), while there is a loss of natural areas and changes of use from agricultural to urban areas [25].
Added to this is the lack of regulations marking the boundaries between urban and rural areas; there is no defined limit. Therefore, it allows urban expansion and consolidation in rural areas of the DMQ. The Land Use and Occupation Plan (PUOS-DMQ) grants flexibility to consolidate rural areas (the division of rural land into lots of 600 square meters for agricultural residential use, and up to 200 square meters for rural residential use is authorized) by promoting real estate projects for different types of urbanization [26].
The proliferation of gated communities in the urban periphery located in the valleys adjacent to the city of Quito and in the vicinity of the urban areas of the neighboring cantons is causing a type of residential and socioeconomic segregation that is repeated in other Latin American metropolises [27].
In this context, the objective of this paper is to identify urban sprawl as a product of change of the land use and land cover (LULC); this fragmented urban territory will help define a new Quito metropolitan area by articulating and integrating the adjacent urban and rural territory. It is also important to incorporate contiguous municipalities to make the metropolitan system broader and more complex than only the DMQ. This new metropolitan system should consider human mobility, activities and interconnections between cantons in search of goods and services through communication networks. So-called travel flows can be identified by counting commuting and other trips. These dynamics allow identifying the area of influence or “hinterland” as a product of urban sprawl and human interactions in a geographic space that has exceeded administrative political boundaries, forming a territorial continuum. This methodology can be used in other Latin American countries with similar characteristics to establish a new functional metropolitan area. Another key point is the creation of a polycentric structure that brings infrastructure and services closer to places of residence and that balances the provision for the territory with social and productivity services based on comprehensive planning between the prefecture (provincial) and the mayors (local governments). Under those circumstances, the creation of new centralities, evenly distributed in the territory, can be considered.
2. Materials and Methods
2.1. Study Area: The Metropolitan District of Quito and Its Adjacent Territory
The DMQ has a total area of 423,074 hectares ranging in altitude from 500 to 4780 m above sea level. This large difference is characterized by a diversity of valleys and mountains which allows the presence of different types of climate: tropical humid, semiarid and hyper-humid [28]. The integration of geoforms and climates allows a configuration of ecosystems and habitats that is characterized by large extensions of humid forests, scrubland, dry forests and some of the highest moorlands in the world [28] (Figure 1)
The territory of DMQ is divided into 8 Zonal Administrations for the purpose of decentralizing public bodies and improving the provision of public services. These areas are further divided into 32 urban parishes and 33 rural parishes (according to the Organic Code of Territorial Organization, autonomy and Decentralization (Cootad) [29] an urban parish is defined as the basic unit of a decentralized and autonomous district or government, while rural parishes constitute territorial constituencies integrated into a canton).
It should be noted that the former -National Secretariat for Planning and Development-SENPLADES (in charge of planning and decentralized development of the country), which is now named Technical Secretariat “Planifica Ecuador”, determined a territorial structure for administrative purposes that divides the Ecuadorian jurisdiction into nine Planning zones, formed by joint provinces or metropolitan districts. This organization was aimed to strengthen and improve the articulation between levels of Decentralized Autonomous Governments (GADs) that are part of the territorial organization of the State and have political, administrative and financial autonomy. They are divided into regional, provincial, cantonal and parish GADs.
At the same time, it is important to emphasize that, despite the search for decentralization, coordination and integration among the municipalities that share geographical areas, the contradictory Zone 9 (corresponding to the DMQ) was formed taking into account the 1993 delimitation [20]. Hence, the rest of the planning areas that grouped provinces together remained isolated. This was because, according to SENPLADES, it had special conditions for being the political-administrative-economic capital of the country. Currently, the urban growth of the DMQ has come to overflow beyond its administrative boundaries, resulting in conurbations with neighboring cantons.
The urban population of the DMQ is 1,619,146 inhabitants (72%), while the population in rural areas is 620,045 inhabitants (28%) [30]. It should be noted that the rural conurbations are those with the highest population growth rates compared to the consolidated urban structure. However, at the country level the growth rate over a period of 36 years (1974–2010) remained low (Figure 2).
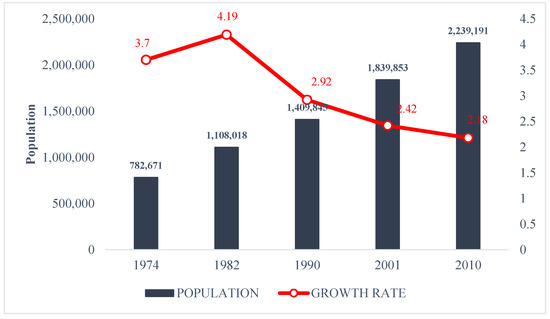
Figure 2.
Quito population and growth rates (1974–2010).
In general, the DMQ population has multiplied sevenfold since 1950 (the year marking the start of “lotting” or massive subdivision of land). By the 1960s and 1970s, mutualists, cooperatives and national housing institutions began to appear, which bore the responsibility of “lotting” and urbanizing, driven by the boom of oil sales in the 1970s [19]. The population reached 2,239,191 inhabitants in 2010, representing 15.5% of the national population and 86.9% of the province of Pichincha [25].
This urban renewal and expansion process dispersed urban activities and subdivided the land over the course of the 1970s and 80s. It went from the old pericentric form settled on 5188.8 ha to an overflowing polycentric form [31] spreading especially into the adjacent valleys until covering 43,550 ha in the late 1980s.
From the 1990s in Quito began an accelerated transformation of the peri-urban. The lack of official municipal planning and control allowed for the construction of formal housing and even informal settlements that took advantage and benefited from the currency changeover to dollarization. However, from the end of 1990 and the beginning of the 2000s, there was a radical overflow of the city toward the peri-urban areas fostered by the expansion of the transverse axes of the city and new megainfrastructures such as the international airport of Quito (operating since 2013). These are the bases for the new urban development cycle [9].
The DMQ constitutes a political-administrative center at the national level and with a highly diverse social, economic and productive areas. Currently, Quito, concentrates 20% of the country’s productive establishments, 26% of the employment, 49% of the research and development and 50% of the tax revenues [31].
Employment is distributed in different branches, a high percentage of which are professional, scientific and technical activities with 40.4%, followed by financial activities with 37.8%, administrative services activities with 34% and lastly activities such as agriculture, forestry, hunting and fishing, with only 3.2% [30].
Benabent, 2017 [32] explains that this capital city was initially configured as a mononuclear metropolis that gradually engulfed the settlements in its immediate environment, progressively spreading through the valleys until almost completely occupying them in an urban continuum [32]. This affirmation leads the researchers to investigate how the population is moving from the centers of urban agglomeration (Quito) to the neighboring cantons in search of residence and employment, (all distances were calculated in km with the Euclidean Distance tool from the hyper center of the urban area of Quito to the center of each parish).
Neighboring cantons, such as Rumiñahui, Mejía, Cayambe and Pedro Moncayo have some similar social features. For example, people work in primary activities like agriculture, farming and livestock in places like Pedro Moncayo (64% of the jobs), Cayambe (42%) and Mejía (32.8%), while in Rumiñahui people work in tertiary activities like commerce and technical services (67.47%) [33]. Furthermore, it is important to mention that the main health, education, and basic services infrastructure is concentrated in the capital canton, but the population is mostly located in rural areas without sufficient coverage of basic services (Table 1).

Table 1.
Population by canton and coverage of basic services.
2.2. How to Identify the Dynamics of Urban Growth of the Quito Metropolitan Area?
To identify urban dynamics in the Quito metropolitan area, an analysis of urban growth was carried out based on three criteria, based on similar methodologies that have been used to analyze the process of urban growth and metropolitaniztion in other regions, for example, in western China [3], Beijing-China [34], Karnataka-India [35], Santiago-Chile [36,37,38,39]. These criteria are:
- Areas of current urban expansion,
- Areas with the highest population density, and
- Areas with the most intensive socio-economic flows and productive exchange with the city.
For the first criterion, two Landsat satellite images from 1998 and 2017 were used to identify the pattern of urban growth in the Quito Metropolitan Area over the span of the 19 years. These images were downloaded from the United States Geological Survey (USGS) web portal and have a resolution of 30 m.
On the 2017 image, a sub-scenario adjusted to the borders between the cantons and neighboring parishes to the DMQ was explored. Using supervised classification false-color interpretation (red, green, and blue, based on the spectral signature; that is, based on the radiation that reflects the different types of surfaces) and selection of training sites in ArcGIS, land use categories were identified: 1. urban, 2. moorland, 3. native vegetation, 4. without vegetation, 5. scrub, 6. agricultural, 7. water bodies, and 8. no data (snow, ice, shade). The reclassification was carried out based on the Corine Land Cover (CLC) methodology initiated by the Coordination of Information on the Environment program (CORINE). This was promoted by the Commission of the European Community [39]. The application of this land use mapping technique helps to identify where the urban expansion is heading.
For the second criterion, the population density of the DMQ parishes and neighboring cantons was analyzed based on official data from the National Institute of Statistics and Censuses [30], which was the base to determine which parishes’ census tracts with significant distance from the central Quito were having an important gravitational influence of this city. Not only the population densities as a synchronic view of the census are presented, but the intercensal changes and migratory movements that have led to portray the current tendencies that help the authors to conclude what was the physical scope of the conforming new metropolitan area in terms of population placement processes.
Lastly, for the third criterion, the parishes with the most intensive interaction, economic, productive and social exchange with the DMQ and those demanding goods and services were identified. The parishes with the least interaction with the DMQ were not considered for the proposed metropolitan area. This economic criterion is supported on a series of thematic reports publicly and privately produced, which helped to understand inflows and outflows of products and services, as well as perspectives of further behavior for the proposed New Metropolitan Area.
Part of this third criterion based on socio-economic dynamics is the mobility flows that the population generate, mostly for daily activities, such as work, education and other reasons. When obtaining data, the authors considered the 2011 mobility survey carried out by the Metro-Q public enterprise. Interviews were also conducted on informants of transport cooperatives, whose origin-destination routes include the neighboring cantons that are part of the area of study of the metropolitan Quito (The field work was carried out in the cantons of Cayambe and Pedro Moncayo, in February 2019).
Moreover, not only the confined analysis of each criterion has been produced. In order to conceive integrated interpretations of their corresponding results and their subsequent discussion and conclusions, the interactions between each criterion with the other two criteria are described when presenting the results. These relations include the inefficiency in the consumption of land and unattended population with services, when considering the urban growth and the population density interactions; the disconnection and needs for strengthening metropolitan corridors when considering urban growth and socio-economic flows interactions; and, the territorial inequity evidenced by daily commutation, when analyzing the population densities and the socio-economic flows interactions.
A comprehensive diagram presenting the methodology that include the three applied criteria, a brief description of them and the used techniques, and equally relevant, the relations between their mutual interactions to interpret the results to hold on a base to present the conclusions of this work are portrayed in Figure 3.
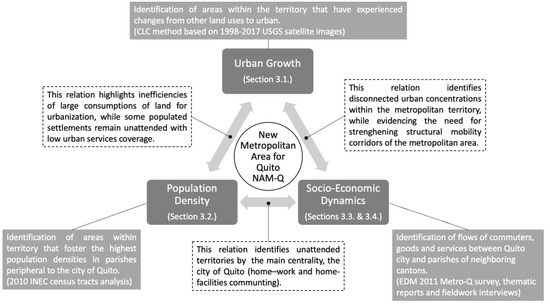
Figure 3.
Methodological scheme to identify a New Metropolitan Area for Quito.
3. Results
3.1. Evolution of Urban Area 1998–2017
In a period of 19 years (1998–2017), new urban growth fronts appear on the analyzed satellite images that head toward the cantons of Mejía, Pedro Moncayo, Rumiñahui and Cayambe. Thus, 23,879 ha of urban area was observed for the year 1998 (4.22% of the study area) and 71,515 ha (12.65% of the study area) for 2017, out of a total of 565,469 ha covering the conglomerate of the five cantons that would make up the new metropolitan area of Quito (Mejía, Rumiñahui, Cayambe, Pedro Moncayo and the DMQ) (Figure 4).
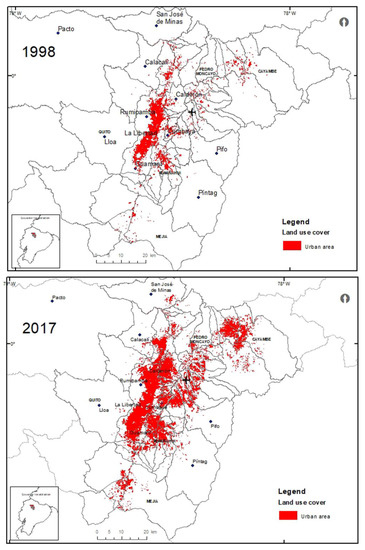
Figure 4.
Urban land use change of Quito and surrounding 1998–2017.
According to this figure, metropolitan growth exceeds the administrative limits of the DMQ and will therefore expand into the neighboring cantons.
Over these 19 years, the areas that changed their land use and contributed to the increase of the urban area (to reach 71,515 ha) are: first, agricultural areas with 30,612 ha (84% changed to urban use), secondly scrubland with 14,904 ha (1.38% changed to urban use), and lastly natural/native vegetation with 2126 ha (0.04% changed to urban use). Notably, the enormous loss of agricultural land has been impacting on the reduction of the food security and sovereignty of the inhabitants of Quito, because they have less access to local food production systems and therefore are forced to consume products from more distant sources.
The cantons neighboring Quito with the highest annual urban growth rate are Cayambe 10.04%, Mejía 9.41% and Pedro Moncayo 9.39%. However, it is noticeable that Rumiñahui in its conurbation with the DMQ has already urbanized large portion of its land in the 1980s and 1990s, while having an important urban growth rate of 5.47% for the analyzed nineteen-year period.
3.2. Population Density Analysis
When analyzing the population growth rate in the intercensal periods of the five cantons in the study area (Figure 5), one can appreciate how in fact Pedro Moncayo canton (63%), followed by Cayambe (48.7%), show the highest population growth compared to the other cantons in the period 1990–2001. This growth coincided with the time when floricultural activity came to occupy first place in non-traditional exports, with 11% at the national level [40], which consolidated and grew steadily until 2000.
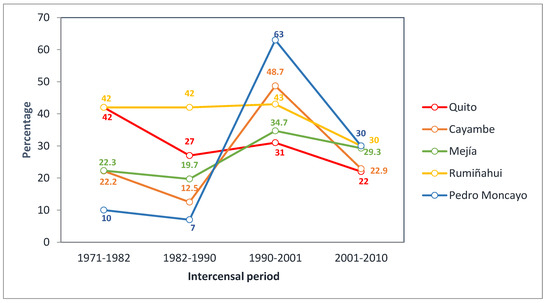
Figure 5.
Population growth rate per canton 1971–2010.
Since then, Ecuador has come to occupy the third place worldwide in flower exports (first is The Netherlands, with a 50% market share, followed by Colombia with 13.80% and Ecuador with 7.81%) [40]. Most of the floricultural production is in Pichincha, specifically in the cantons of Pedro Moncayo and Cayambe. Noticeably, this phenomenon has impacted on these cantons’ population growth.
Similarly, the canton of Mejía has also shown growth in the same decade (1990–2001), though, still moderate at a 34.7% intercensal rate and almost half the growth rate of the canton of Pedro Moncayo (the canton with the highest growth). In Mejía, the growth of the rural parish Cutuglagua, bordering the DMQ, stands out due to the migratory movements coming from other provinces in the country (the Mejía Development and Land Management Plan notes, as an example of this, movements by migrants who come from the province of Cotopaxi and are located in the northern neighborhoods of this parish) registering the highest growth rate in the canton 16.49%, unlike the town of Machachi (the seat town in the canton), which only registers 5.69% (Table 2). This is especially due to the proximity between this parish and the city of Quito [41].
Table 2.
Evolution of the urban area and annual growth rate of the cantons would comprise the new metropolitan area proposed to Quito 1998–2017.
All of these cantons and their parishes attract the vast majority of migrant inhabitants, both from other provinces (especially from the Sierra region such as Imbabura or Cotopaxi and increasingly from the provinces of Manabí and Guayas), as well as from abroad (Ecuadorians returning from Spain or foreigners) [42]. In sum, growth trends are largely due to migration to the rural parishes of Quito and neighboring cantons because of the proximity to the central urban area, making the search for employment, housing and education or other urban services easier (Table 3).
Table 3.
Migratory movements between Quito and surrounding cantons in 2011.
3.3. Territorial Dynamics and Economic Flows
In the large urban conglomerate composed of five cantons, there are functional relationships that are expressed as complementarity when offering administrative services related to the national government, employment, commercial, logistical, educational, recreational and health facilities. These are articulated with the productive specialization of the neighboring jurisdictions, which generates flows of people for activities like processing food, supplying raw materials and marketing of goods. As a result, a clear tendency toward conurbation with the neighboring cantons has been fostered, especially with Mejía and Rumiñahui. There is conurbation with Cayambe and Pedro Moncayo as well, but in less percentages [43].
In this way, various exchange processes, functional relationships by location and complementarity can be seen. Thus, with Cayambe and Pedro Moncayo the dynamics are given by the flower industry as the main export product: around 90 tons of roses arrive at the Quito international airport from these cantons every day [40]. Meanwhile, with Mejía the commercial relationship is for milk production; approximately 860,000 L of milk are produced per day for the city of Quito [44]. These commercial relationships have led to a configuration of urban corridors along the Pan-American highway, which connects the five cantons of the study area from north to south.
This concentration of economic activities in the urban area of Quito and its specialization in certain branches of activity and services (food, transportation, teaching, professional, scientific, technical, administrative, financial and insurance as well as health and social assistance) have a share in categories such as commerce 22.1%, manufacturing industries 12.3%, public administration, defense and social security 7.7%, construction 7.5%, services 48.40%, agriculture, livestock, hunting and forestry each with 0.7%, [31], constituting a potential aspect for the generation of production and consumption links with other territories, principally with neighboring cantons to complement activities.
The neighboring cantons are more specialized in branches of activity corresponding to agriculture, livestock, hunting, fishing and forestry, such as the case of Mejía and Pedro Moncayo. In the case of Mejía, 7457 of 25,692 of the Economically Active Population (EAP) are dedicated to agriculture, livestock, hunting, fishing and forestry. Similarly, in Pedro Moncayo Canton, 5550 of 10,917 of the EAP are dedicated to the same activities (Censo-INEC, 2010).
Agricultural production from Pichincha supplies 36% of Quito’s demand for food, while the remaining 66% comes from other provinces such as Santo Domingo and Manabí [45]. It is thus confirmed that an important supply and processing of food comes from these neighboring cantons, where the horticultural-fruit production and considerable dairy production are located. Mejía is the area with the highest milk production in the country with 20% of the national production. Consequently, a flow of people betweeen Quito and with these productive and reproductive areas is generated [44].
In the case of Rumiñahui, the activities that connect this canton (to Quito and from Quito) are work and education, according to information from the 2012–2025 Development and Land Use Plan of Rumiñahui Canton. The main non-native population group of Rumiñahui comes Quito [23] due to the presence of commercial and industrial activity.
Furthermore, the canton of Rumiñahui has registered between 25% and 40% growth in the number of buildings (according to the procedures for approval of plans and construction permits) [46]. Additionally, there has been a recent increment in the price of the square meter of land (it was USD 20 in 2015 and by 2018 it exceeded USD 50). In the city center, in 2019, generally the price of a square meter was between USD 220 to 1771 [47].
The proximity of this canton to Quito, just 14 km (25 min) by the use of the General Rumiñahui highway, has encouraged people who live in Quito to search in this neighboring canton mainly for housing, 68.17% (real estate companies have bulit more than 300 housing developments in the last decades in the canton of Rumiñahui) [48].
Moreover, dwellers look for sources of employment (secondary and tertiary sector of the economy, 9.05%; there is a great variety of food-type industries, raw material processors and collection centers) and they also go there on personal affairs (shopping, paperwork, leisure, 15.80%) and education (5.97%) (Figure 6). According to the Metro de Quito survey data [49] and the Plan for Development and Territorial Planning of Rumiñahui [23], many inhabitants of Quito come to this canton in search of calm and good weather [50]). Furthermore, in Sangolquí (cantonal seat) there is an economic engine related to the presence of a large food fair and market (which works only on weekends). Therefore, it constitutes a pole of attraction for neighboring cantons such as Quito and Mejía, which connect along the General Rumiñahui highway. This is demonstrated by the 29.35% of daily trips made to Quito for personal business [49]. On the whole, the relations between human mobility and intensity of urban activities shape the urban growth boundaries and expanding functional limits of the metropolitan area [34].
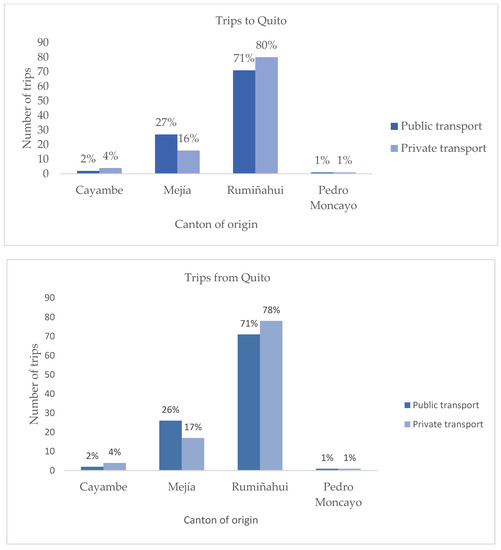
Figure 6.
Trips to and from Quito of the NAMQ. Based on the 2011 mobility survey (Quito Metro, 2011).
In sum, according to the origins and destinations, the majority of travel flows start in the urban growth boundaries but end in neighboring jurisdictions (and viceversa), in this case outside the boundaries of the DMQ. These flows are known as “disperse flows”, referring to a trip in which at least one end is outside any given urban growth boundary [34].
3.4. Daily Mobility and Transportation
Regarding mobility as an essential element that allows the interaction of the population within the metropolitan territory and the physical accessibility to facilities and services, public transport is analyzed in each of the cantons of the study area.
The Rumiñahui Canton stands out as the canton with the greatest commutation with Quito (10 km-18 min between urban centers), representing the majority of trips to and from Quito, carried out by private transport (80% of total private intercantonal transport trips to Quito city and 78% of outwards trips), by public transport (71% of total public transport intercantonal trips to Quito in both directions) (Figure 6). There are around 14 routes that originate in the hypercenter of Quito that go to the Rumiñahui Canton [51]. It is estimated that around 32,000 vehicles a day travel from the Rumiñahui canton valley to the hypercenter of Quito and likewise in the opposite direction [52]. More than 67% of the trips to Quito are carried out before 1:00 p.m. and to a lesser extent in the opposite direction [24]. The General Rumiñahui highway is the main connecting axis between these two cantons.
Regarding the Mejía canton, located in the south of the urban area of Quito (55 km-60 min between urban centers), it has become a peri-urban space with a migrant population from the entire country (according to data from the INEC 2010 census [30], the 27.58% from the central highlands of Ecuador).
This is the case of the Cutuglagua parish (the one with the highest intercensal growth in Mejía Canton. It is expected that by 2025 the population will exceed the population of the cantonal seat Machachi). It is the preferred settling location due to its proximity to the capital city and especially because of housing prices, which are far lower than those within the urban area of Quito. For example, the cost per square meter of land with all services in the parish of Cutuglagua is approximately USD 80, while in the parishes located in the south of the DMQ, it can reach USD 200 [53].
In general, the population of Mejía maintains a cultural and socio-economic link with Quito. Inhabitants travel to the capital for work (23.42%), education (22.36%), especially the school-age population that chooses to finish high school in institutions of the capital [53] and personal affairs (22.51%), but the main reason for traveling to Quito is return to their housing settings (28.59%). The fact that 65.46% of trips are from Quito to Mejía evidences that the majority of the population makes pendular trips for work reasons [49] (Figure 7) due to the influence of the urban area [54].
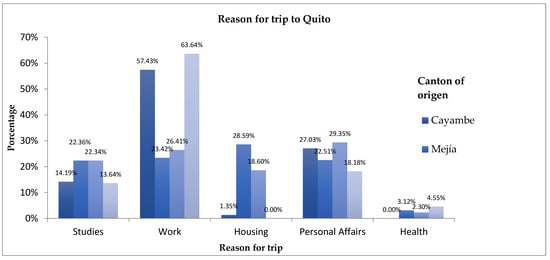
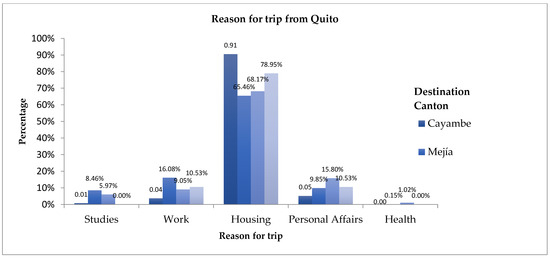
Figure 7.
Reason for traveling to and from Quito, from and to cantons NAMQ (Quito Metro, 2011).
Regarding the Cayambe Canton, located 68 km away (1 h 23 min between centers), according to the data from the mobility survey [49], the main reason for traveling to Quito during the week is work (57.43%) (in the hypecenter of Quito are located the offices of government and more employment opportunities that attract the outsider population), followed by personal affairs (27.03%), education (14.19%), while for housing just 1.35% of the trips head toward Quito. However, the percentage is 90.51% for housing motives in the opposite direction from Quito to Cayambe, (the population returns to Cayambe to rest mainly on weekends). In sum, these data indicate that the population in this canton also makes pendular trips for work reasons (Figure 7).
Cayambe maintains commutation with Quito due to the productive dynamics driven by floricultural activity since the 1990s, which led people to settle in the urban area and in areas close to plantations. As reported by the Cayambe Land Management Plan, there is internal migration from other Ecuadorian provinces to Cayambe, as the result of expanding flowers production industry [22].
Most of the population that has immigrated to Cayambe Canton comes from large urban areas such as Quito (32.5%), Tabacundo (22.9%), the cantonal seat of Pedro Moncayo Canton bordering Cayambe, and the DMQ rural parishes Calderón (16.3%), Guayllabamba (8.7%), Pomasqui (7.8%) and El Quinche (8.1%), [22].
Immigrants mostly prefer to locate in the rural area of Cayambe (87.5%) due to the prosperous floricultural activity and only 12.7% are located in the urban sector. The presence of the new Quito Airport and the new “Panamerican Road”, the E35 national highway, has allowed a close relationship between flowers producers and the Quito airport because it is a point of shipment for flower exports.
Regarding the canton of Pedro Moncayo, whose town seat (Tabacundo) is located approximately 58 km (1 h 11 min) from the city center of Quito, there is no direct public transport route to the capital. There are only interprovincial buses routes that connect with Imbabura, the closest province, so they only use the Panamerican highway, placed on the outskirts of Tabacundo (parish capital of Pedro Moncayo), which has made it a place where users wait for provincial buses.
The inhabitants of Pedro Moncayo, when unable to find enough jobs or possibilities to obtain supplies, and trained in different areas/technologies [55], go to Quito to work (63.64%). Most of the population is engaged in agricultural and livestock activities, but these are increasingly relegated by floriculture, which has become one of the main economic activities of the canton (5550 inhabitants are linked to the branch of activities comprising agriculture, livestock, hunting, fishing, forestry) [30]. Other reasons for traveling to Quito are personal affairs (18.18%, including leisure, paperwork, shopping) or health (4.55%), since there is only a single primary attention health center that does not serve sufficiently to the population of Pedro Moncayo [56].
On the contrary, the flow of inhabitants from Quito to Pedro Moncayo occur specifically for work (10.53%): professionals and technicians who work mostly in flower plants, in the Tabacundo hospital or in the court, according to the interviews. Nevertheless, the main reason for traveling from Quito to Cayambe is residence (78.95%) [49].
In sum, the main reasons for traveling to Quito from Mejía, Rumiñahui, Cayambe and Pedro Moncayo and vice versa are work and housing. They are the two essential factors to enhance connectivity through a road system under continuous optimization, as it is the Panamerican highway or E35 road, which at the same time links Quito northwards with other provinces capitals such as Ibarra, Tulcán, southern Colombia and with the central highlands of Ecuador in the southwards direction (Figure 1).
In relation to public transport, the main interprovincial, interparish and inter-cantonal land transport terminals are connected through the E35 or Panamerican highway, which breaks off the trunk line of the Sierra by entering to the urban area of Quito. As a result, it strengthens the interrelations between the neighboring cantons and Quito, and that is the reason why co-management between neighboring governments is required [43].
4. Discussion
Defining a New Metropolitan Area for Quito
The physical expansion of Quito has configured a new geographical space-the periphery–which has begun to be urbanized in parts. Therefore, the installation of, services, infrastructure and diversified activities is also gradually being completed. In this process, new centralities appear around rural areas that remain connected to the central zone through arterial roads that at the same time link them with other neighboring territories, generating a consolidated metropolitan space.
This continuous expansion has exceeded the administrative boundaries of the DMQ. The new growth fronts are directed towards the northeast, mainly the parishes of Toacachi, La Esperanza and Tabacundo, which belong to the Pedro Moncayo canton. To the east it advances towards the parishes of Ascazubi, Cangahua and Cayambe, which belong to the Cayambe canton. This growth has started a process of consolidation since 2000, with the planning and implementation of the new Quito airport in 2013. To the South, it extends towards Mejía and Rumiñahui, forming a conurbation with these neighboring cantons. Lastly, to the west growth is directed towards the parishes of LLoa and Calacalí. It should be considered that the Pichincha Volcano and the Andean Choco protected area are located on this flank.
The example of the Quito Metropolitan Area confirms that the current urban system model would theoretically follow the Anglo-Saxon model of diffuse conurbation [57]. This conceptual model does not prioritize expanding the clustered complexity of the city. Rather, it is a city created in a dispersed way. It occupies larger areas that exceed administrative limits, which in turn is why new urban corridors are generated and not the opposite way, in which the structural elements are set first prior to development, contrarily to a formally managed metropolitanization process. In Quito, the spread settlements are currently linked through a network of roads and pathways that exacerbate mobility in search of goods and services in other territories. This type of metropolitan dynamics that can be seen in Latin America has been intensely affected by the political and economic transformations associated with the neoliberal model (exodus of commercial services, traditional centers) giving rise to polynuclear metropolitan systems, at least in the structural-morphological sense.
The evidence shows the configuration of a single conglomerate in continuous urban expansion. Consequently, a New Metropolitan Area for Quito (NMA-Q) is proposed, which would be composed of five cantons (Figure 8): (1) Rumiñahui, with the parishes Sangolquí, Cotogchoa and Rumipamba; (2) Mejía, with the parishes Machachi, Alóag, Aloasí, Cutuglagua, El Chaupi, Tambillo, Uyumbicho. The parish of Manuel Cornejo is excluded because its proximity and interaction are more related to the province of Santo Domingo de los Tsáchilas; (3) Cayambe with the parishes Ayora, Juan Montalvo, Cangahua, Otón, Cusubamba and Ascázubi. The parish of Olmedo is excluded because its proximity and interaction is more related to the province of Imbabura; (4) Pedro Moncayo with the parishes of Tabacundo, La Esperanza, Malchinguí, Tocachi, Tupigachi, and lastly (5) Quito with all 32 urban and 29 rural parishes except for Pacto, Gualea, Nanegalito and Nanegal due to their limited urban dynamics related to Quito.
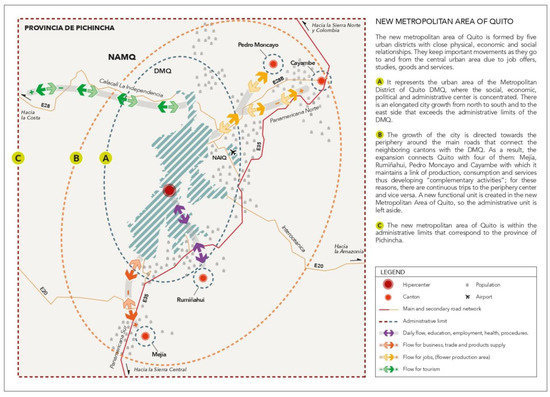
Figure 8.
Model of the new metropolitan area of Quito. Own elaboration.
The results obtained allow one to conclude that the New Metropolitan Area of Quito is an area composed of five conurbated cantons. The conurbation does not always imply physical contact between urban or rural boundaries [6] with close physical, economic and social relations. In addition, there is a significant displacement of the population to and from the central urban area related to housing, the supply of jobs, studies, goods and services. Consequently, the so-called tertiary corridors are formed, which attract users and create centrality-oriented spaces for economic activities that are gradually unifying the territory [58].
The conurbation of the DMQ with the five neighboring cantons is the second most populated urban agglomeration in Ecuador after the Guayaquil conurbation. As stated by Soja, [59] this is a monocentric model of deconcentrating the city towards the peripheries, from within the city to outside of it.
It is confirmed that the absence of a limit for urban growth has allowed urban expansion. Therefore, there is more demand for the city. This has led to the appearance of new and modern infrastructures with their corresponding “connection networks” in the peri-urban area, which at the same time cause the change in land use that fragments the territory and the population [43]. The case of Quito and its urban consolidation is an example of a social, economic, political and administrative center with urban areas related to each other [60]. The neighboring cantons of Cayambe, Pedro Moncayo, Mejía and Rumiñahui make up a new functional unit, leaving aside the function of the traditional administrative unit.
In the early 2000s, studies addressing mobility, essential services and risks in the DMQ, which were carried out jointly by the Municipality of Quito and the French Institute for Development Research-Institut de Recherche pour le Développement (IRD)-already explained the remarkable concentration of urban activities within the city of Quito, describing it as a “metropolitan hypercentrality” that justifies center-periphery trips [24].
The analysis presented here shows the way that the DMQ and its metropolitan areas have expanded as part of the city metropolization process, highlighting the polynuclear character of the DMQ and establishing a geographical concentration of urban land uses with functional interactions between the sub-centers, which attract services, trade and migratory movements. The results, though they do not quantify all the functional flows (due to the lack of data) and the types of specialized services and innovation that occur in the metropolitan city -further research- prove that urban renewal processes are resulting in residential densification, the mixture of uses, concentration of commercial and logistic equipment at a metropolitan scale as in other Latin American cases. Several mid-sized Latin American cities are experiencing similar metropolization processes [61].
In this sense, in Quito there is a process of “localized peripheral urbanization” mainly in the areas of the inter-Andean valleys (Los Chillos, Tumbaco and Cumbayá). New growth fronts are presented towards the east around the new airport in Tababela and towards the north and south ends of the urban area of Quito into the neighboring cantons of Rumiñahui and Mejía, as well as the northeastern cantons of Pedro Moncayo and Cayambe.
The persistence of an expansive, discontinuous and inequitable form of urban growth is evident, thus threatening territorial equity and the people’s right to mobility, the city’s physical infrastructure, to sufficiently articulated transport that facilitates the interaction of the population, and to a quality of habitat [12]. This denotes the need to promote the configuration of a polycentric structure that brings infrastructure and services closer to the entire territory of the DMQ and its neighbors.
As noted by the main decision-making authorities, there is a lack of collaboration among the GADs in each canton (entities in charge of formulating land use plans where urban and rural areas are defined). An urban area is the land occupied by concentrated human settlements that are fully or partially equipped with basic infrastructure and public services. These human settlements include urban conglomerations on rural land. Rural area is intended for the development of agro-productive, extractive or forestry activities, which should be protected from or reserved against future urban uses due to their biophysical characteristics [62].
The city of Quito as a central core concentrates infrastructure, services and activities, so it does not take into account the potential and specialization of neighboring territories, which are important aspects to generate links with the capital so that the complementary activities can be carried out. The proximity to Quito is an opportunity for accessing infrastructure, transport and large markets. Therefore, a combined effort between all decentralized autonomous governments (GADs) in this new metropolitan area would be justified.
Currently, the 2016 Organic Law on Territorial Planning, Use and Management of Land (LOOTUGS) is the one governing the principles and rules for the use and management of urban and rural land. It articulates and integrates territorial planning at the level of the GADs. However, Quito shows a lack of regulation. Regulations from Quito (PUOS) do not establish a classification of urban and rural land and thus facilitate urban development in rural, agricultural, and protected natural areas. Furthermore, there are no mechanisms or spaces for coordinated territorial planning and management between the different GADs. Policies and new legal instruments like the Land Use and Management Plans (PUGS), mandated by the LOOTUGS and currently in the process of implementation -2021- are expected to generate a series of actions aimed for the rationalized occupation, preservation and recovery of urban land and urban expansion as a basis for improving the quality of life of the population. Additionally, the mobility and transport are also inefficient due to the discontinuous and scarce transport routes between Quito and the neighboring cantons to the north, Pedro Moncayo and Cayambe. In contrast, the cantons located in the south of the urban area of Quito, Mejía and Rumiñahui, are served by the same transport cooperatives that cover the urban area of Quito.
It is corroborated that one of the main reasons for expansion towards the periphery is the price of land. The cheapest places have minimal services and are configured as popular (lowest socio-economic strata) areas [63]. At the same time, they become an incipient capital accumulation on the periphery that results in the creation of new centralities that are profited by the real estate markets.
This affects the use and occupation of the land or the conservation of natural areas. On the other hand, floating populations seek to settle in areas close to the DMQ. Consequently, informal settlements are eventually promoted.
As noted by Castells and Borja [13], the accelerated urbanization process has increased daily movements in the periphery and cantonal centers, especially in metropolitan areas, thus generating a new category of population: the floating one that moves with economic and productive flows in search of goods, services and quality of life.
The current development model has prioritized the exchange of goods, services and real estate activities. Urban expansion is putting more pressure on areas of ecosystemic value (moorland, native vegetation, scrub) and on agricultural areas [64]. It should be kept in mind that the neighboring jurisdictions are the main producers and suppliers of food for Quito.
Coordination and articulation between different GAD levels (provincial, cantonal and parish) will prevent the “leapfrog” type growth (growth strategy that occupies the most remote and cheapest land first and then revalues the intermediate spaces) [65] and achieve a more structured and equitable territory.
In sum, Quito presents special conditions due to being the political and administrative capital of the country. It could create a new metropolitan area considering its articulation with other cantons, specialization in various activities and services, the diversity of the productive fabric, technological development and above all, the physical expansion of the central metropolitan area, which is exceeding the borders and administrative limits corresponding to the DMQ jurisdiction. Quito continuously grows towards the territory administered by the Government of Pichincha province (GAD-provincial) which implies a process of consolidating a New Metropolitan Area.
This new trans-territorial urban space will link geographically distant yet intensely connected points with each other, allowing us to see human occupation comprehensively. As stated by Terradas and Franquesa [66], the diffuse growth of cities should not be delimited; any limit established cuts connections between what is inside and what is outside. It is better to study the urbanization process as a continuous or discontinuous spatial articulation of population and activities [67].
This phenomenon is mainly visible in Latin American cities where the increasing rural-city migration is a rapid and explosive process. Consequently, there is rapid metropolitan growth using previously rural and agricultural lands. For instance, Mexico City, Santiago de Chile, Buenos Aires, Sao Paulo, Medellín and Bogotá show clear signs of dispersion. According to De Mattos [68], this dynamics is not only observed in large metropolises, but also in smaller cities such as Cali, Concepción, Córdoba, Guadalajara, Montevideo, San José de Costa Rica and Quito.
5. Conclusions
Quito could become a model city evolving into a city-region because of its articulation with neighboring cantons, the specialization in various activities and services, the diversity of the productive fabric, its technological development and the physical expansion of the central metropolitan area. Under those circumstances, it would be an extended urban region that goes beyond the boundaries and articulates a system of secondary cities, acting as a sender and receiver node in exchange processes between the region and the world.
The design of a new Metropolitan Area, which goes beyond administrative boundaries, suggests incorporating coordinated territorial development and administrative mechanisms. The execution of programs and projects at the inter-cantonal and intergovernmental level make equitable territorial planning possible. Therefore, it will strengthen or create new urban centralities with endowment of distributed of urban services, health, education, recreation, as well as adequate access to public transport between neighboring territories, prioritizing connectivity and human mobility.
In conclusion, a New Metropolitan Area of Quito is evidenced by the urban land produced around the central city, the considerable population densities that the regional settlements foster, and the socio-economic flows made up between this central city and its surrounding region, even reaching neighboring cantons within the Pichincha province. The DMQ shares geographical areas with these municipalities as well as close ties of economic, social and physical exchange, so mobility and human displacements act as the main articulators of the territory of the NMA-Q. Along with this, planning instruments must be promoted through the implementation of Land Use and Management Plans (PUGS) in each of the GADs that allow to control and regulate the expansive urban growth.
In complement and facing the fact that there is no legal figure in the Ecuadorian legal system addressing the management of metropolitan areas, a territorial organization tool named “mancomunidad”, included in the COOTAD law. This tool is an association of GADs pursuing a common goal (metropolitan planning for this case) and fostered by the National System of Jurisdictions, part of the National Planning System [29]. This could be an option to shape a better metropolitan planning and management of the capital and one of the two metropolitan regions in Ecuador.
Author Contributions
Conceptualization E.S. and C.H.; methodology E.S., C.H., J.Q., G.D. and F.P.-S.; software analysis E.S., C.H. and J.Q.; validation C.H., G.D. and F.P.-S.; formal analysis E.S., C.H.; research analysis E.S.; resources C.H.; data curation, E.S., C.H. and J.Q.; writing—original draft preparation E.S. and C.H.; drafting—review and editing E.S., C.H., G.D. and F.P.-S.; visualization E.S., C.H., J.Q., G.D. and F.P.-S.; supervision C.H.; project administration C.H.; funding acquisition, C.H. All authors have read and agreed to the published version of the manuscript.
Funding
This research was funded by FONDECYT/ANID (Chile) grant number Nº1180268 (Proyección de escenarios de crecimiento en ciudades medias. Modelos de simulación espacial para la planificación urbana-ambiental) and SENESCYT (Ecuador), doctoral scholarship program for university teachers (2015).
Institutional Review Board Statement
Not applicable.
Informed Consent Statement
Not applicable.
Data Availability Statement
Not applicable.
Acknowledgments
The author(s) gratefully acknowledge the research support provided by CEDEUS, ANID/FONDAP 15110020. The authors acknowledge the support received from the PhD Program in Geography, Pontificia Universidad Católica de Chile; Universidad de Fuerzas Armadas-ESPE; the Department of Urban Planning and Geoinformation Management, ITC Department of the University of Twente (Enschede, The Netherlands) and the Vicerrectorado de Investigación, Doctorados e Innovación of the Universidad Central del Ecuador. Special thanks to Richard Sliuzas, Alice Nikuze, Paulina Contreras, Mario Valdivia, Mauricio Morales, Andrea López, Adriana López, Juan Francisco Salazar, and the valuable contributions of anonymous reviewers.
Conflicts of Interest
The authors declare no conflict of interest.
References
- Taubenböck, H.; Wegmann, M. Urbanization in India—Spatiotemporal analysis using remote sensing data. Comput. Environ. Urban Syst. 2009, 33, 179–188. [Google Scholar] [CrossRef]
- ONU-DAES. Las Ciudades Seguirán Creciendo, Sobre Todo en los Países en Desarrollo; Organización de las Naciones Unidas: New York, NY, USA, 2018. [Google Scholar]
- Schneider, A.; Seto, K.C.; Webster, D.R. Urban growth in Chengdu, western China: Application of remote sensing to assess planning and policy outcomes. Environ. Plan. B Plan. Des. 2005, 32, 323–345. [Google Scholar] [CrossRef]
- De Mattos, C.A. Globalización y metamorfosis metropolitana en América Latina: De la ciudad a lo urbano generalizado. Rev. Geogr. Norte Gd. 2010, 47, 81–104. [Google Scholar] [CrossRef]
- Henríquez, C. Modelando el Crecimiento de Ciudades Medias Chilenas, 1st ed.; Ediciones UC: Santiago, Chile, 2014. [Google Scholar]
- Isaza, J. Conurbación y Desarrollo Sustentable: Una Estrategia de Intervención Para la Integración Regional Caso: Primer Anillo Metropolitano Bogotá—Sabana de Occidente. 2008. Available online: https://repository.javeriana.edu.co/handle/10554/223#.XV6Uv4MUips.mendeley (accessed on 22 August 2019).
- Desmond, M.N.; Nesheim, I.; Brouwer, F. Land Use Policies for Sustainable Development; Edward Elgar: Cheltenham, UK, 2012. [Google Scholar]
- Güell, J.M.F. Planificación Estratégica De Ciudades: Crisis Y Validez. Red Procesos Estratégicos Locales; Editorial Reverté: Barcelona, España, 2007. [Google Scholar]
- Durán, G.; Martí, M.; Mérida, J. Crecimiento, segregación y mecanismos de desplazamiento en el periurbano de Quito. Íconos Rev. Ciencias Soc. 2016, 56, 123. [Google Scholar] [CrossRef]
- Carrión, F. Centro histórico: Relación social, globalización y mitos. In Desarrollo Cultural y Gestión en Centros Históricos; Carrión, F., Ed.; Flacso Ecuador: Quito, Ecuador, 2000; pp. 179–192. [Google Scholar]
- Janoschka, M. El nuevo modelo de la ciudad latinoamericana: Fragmentación y privatización. Eure 2002, 28, 11–20. [Google Scholar] [CrossRef]
- Avellaneda, P.; Lazo, A. Aproximación a la movilidad cotidiana en la periferia de dos ciudades latinoamericanas. Los casos de Lima y Santiago de Chile. Transp. y Territ. 2011, 4, 47. [Google Scholar] [CrossRef]
- Borja, J.; Castells, M.; Belil, M.; Benner, C. Local y Global: La Gestión de las Ciudades en la era de la Información; Taurus: Madrid, México, 1997. [Google Scholar]
- Ávila, H. Periurbanización y espacios rurales en la periferia de las ciudades. Estud. Agrar. 2009, 41, 96–97. [Google Scholar]
- Pulido, J.; Díaz, G.; Gómez, J.; Sanginés, A. Los Costos de la Expansión Urbana: Aproximación a Partir de un Modelo de Precios hedónicos en la zona metropolitana del valle de México. Estud. Demogr. Urbanos Col. Mex. 2017, 32, 37–63. Available online: http://www.scielo.org.mx/pdf/educm/v32n1/2448-6515-educm-32-01-00037.pdf (accessed on 15 January 2021). [CrossRef]
- Romero, H. El Crecimiento-Espacial de la Ciudad de Santiago Entre 1989 y 2003 y sus Efectos Sobre la Pèrdida de Servicios Ambientales. 2004. Available online: http://repositorio.uchile.cl/handle/2250/118053 (accessed on 12 December 2020).
- Hidalgo, R.; Arenas, F.; Mosalve, R. Chile: Del País Urbano al País Metropolitano; GEOlibros & EURE-Libros: Santiago, Chile, 2009. [Google Scholar]
- Hiernaux, D. Nueva Periferia, Vieja Metrópoli; el Valle de Chalco, Ciudad de México; Universidad Autónoma Metropolitana Xochimilco: Ciudad de México, México, 1989. [Google Scholar]
- Carrión, F.; Erazo, J. La forma urbana de Quito: Una historia de centros y periferias*. Bull. l’Institut Français D’études Andin. 2012, 41, 503–522. [Google Scholar] [CrossRef]
- Registro Oficial 345. Ley Orgánica de Régimen para el Distrito Metropolitano de Quito; Registro Oficial: Quito, Ecuador, 1993.
- Municipio del Distrito Metropolitano de Quito. La Planificación Del Desarrollo Territorial En El Distrito Metropolitano De Quito. Dir. Metrop. Planif. Territ. 2009, 466. Available online: http://www.flacsoandes.edu.ec/libros/digital/45458.pdf (accessed on 13 November 2020).
- Cayambe, G.M. Plan de Desarrollo y Ordenamiento Territorial. 2015. Available online: http://app.sni.gob.ec/sni-link/sni/PORTAL_SNI/data_sigad_plus/sigadplusdiagnostico/1360027750001_PRELIMINARES%20DIAGNOSTICO%20PDYOT%20CONVENTO%202015_15-05-2015_10-05-13.pdf (accessed on 6 April 2021).
- Rumiñahui, G.D. Plan de Desarrollo y Ordenamiento territorial Actualización 2014–2019 Gobierno Autónomo Descentralizado Municipal Cantòn Rumiñahui. 2014, p. 374. Available online: http://181.112.151.212/Documentacion/CantónRumiñahui/pdyot-2014-2019.pdf (accessed on 13 November 2020).
- Florent, D. Movilidad, Elementos Esenciales y Riesgos en el Distrito Metropolitano de Quito; IFEA: Quito, Ecuador, 2005.
- De Planificación, C.M. Plan Metropolitano de Desarrollo y Ordenamiento Territorial 2012–2022; MDMQ: Quito, Ecuador, 2012.
- Tapia, V. Comunicación Personal, Director Metropolitano de Políticas y Planemiento del Suelo; MDMQ: Quito, Ecuador, 2019.
- Rubio, R. Reseña: “Transformaciones urbanas y procesos territoriales. Lecturas del nuevo dibujo de la ciudad latinoamericana”de Rodrigo Hidalgo, Ricardo Trumper y Axel Borsdorf. Rev. Geogr. Norte Gd. 2005, 34, 107–109. [Google Scholar]
- Secretaría de Ambiente. Atlas Ambiental Quito Sostenible 2016; MDMQ: Quito, Ecuador, 2016.
- Presidencia de la República. Código Orgánico de Organización Terrtitorial, Autonomía y Descentralización (COOTAD); Asamblea Nacional: Quito, Ecuador, 2010.
- INEC. Fascículo Provincial Pichincha. 2010. Available online: https://www.ecuadorencifras.gob.ec/wp-content/descargas/Manu-lateral/Resultados-provinciales/pichincha.pdf (accessed on 20 October 2020).
- Instituto de la Ciudad. Boletín Conociendo Quito N.2,4,7,9,10,11,13; MDMQ: Quito, Ecuador, 2019.
- Benabent, M. La Delimitación de Ámbitos Funcionales Para la Aplicacion de Políticas Públicas; Boletín N.75. 2017. Available online: https://bage.age-geografia.es/ojs/index.php/bage/article/view/2498/2355 (accessed on 25 October 2020).
- Instituto Nacional de Estadística y Censos. Fascículo Provincial Pichincha: Censo-INEC; INEC: Quito, Ecuador, 2010. [Google Scholar]
- Long, Y.; Han, H.; Tu, Y.; Shu, X. Evaluating the effectiveness of urban growth boundaries using human mobility and activity records. Cities 2015, 46, 76–84. [Google Scholar] [CrossRef]
- Sudhira, H.S.; Ramachandra, T.V.; Jagadish, K.S. Urban sprawl: Metrics, dynamics and modelling using GIS. Int. J. Appl. Earth Obs. Geoinf. 2004, 5, 29–39. [Google Scholar] [CrossRef]
- Vèliz, J.O. Crecimiento periférico del Gran Santiago. ¿Hacia la desconcentración funcional de la ciudad? Scr. Nova Rev. Electrónica Geogr. y Ciencias Soc. Univ. Barcelona 2005, 11. Available online: https://www.researchgate.net/profile/Severino_Utrilla/publication/28091603_Crecimiento_periferico_del_Gran_Santiago_hacia_la_desconcentracion_funcional_de_la_ciudad/links/5ae8525645851588dd7fe476/Crecimiento-periferico-del-Gran-Santiago-hacia-la-desconcentracion-funcional-de-la-ciudad.pdf (accessed on 6 April 2021).
- De Mattos, C.; Fuentes, L.; Link, F. Tendencias recientes del crecimiento metropolitano en Santiago de Chile. ¿Hacia una nueva geografía urbana? Rev. INVI 2014, 29, 266. [Google Scholar] [CrossRef]
- Gutiérrez, A.; Loreto, M.; Herrera, V.; Salas, Á. Metodología Para Determinar áreas Funcionales de las Ciudades Chilenas; Instituto Nacional de Estadísticas de Chile, Ministerio de Vivienda y Urbanismo, Ministerio de Transportes y Telecomunicaciones: Santiago, Chile, 2018. [Google Scholar]
- Agengency, E.E. Cartografía Corine Land Cover Landsat Explorer: Análisis Multiespectral y Procesado Online Servidores WMS Libres Para Datos e Imágenes Satélite Buscó por el Término Corine Land Cover—Gis & Beers Cálculo del Polígono Mínimo Convexo en Biodiversidad Recu. 2019. Available online: http://www.gisandbeers.com/descarga-corine-land-cover-2018/ (accessed on 20 November 2020).
- Gómez, C.; Egas, A. Análsis Histórico del Sector Florícola en el Ecuador y Estudio del Mercado Para Determinar su Situación Actual. 2014. Available online: https://repositorio.usfq.edu.ec/handle/23000/3323 (accessed on 21 November 2020).
- GAD de Mejía. Actualizacion Del Plan De Desarrollo Y Ordenamiento Territorial del Cantón Mejía; GAD Mejía: Machachi, Ecuador, 2014.
- INEC. Estudios Demográficos En Profundidad: Migración Y Distribución Espacial. 2001, p. 67. Available online: https://www.ecuadorencifras.gob.ec/documentos/web-inec/Bibliotecas/Estudios/Estudios_Socio-demograficos/Migracion%20y%20Distribucion%20Espacial%201990-2001.pdf (accessed on 23 November 2020).
- Secretaría Nacional de Planificación y Desarrollo. Agenda Zona 9: Distrito Metropolitano de Quito Documento Final; SENPLADES: Quito, Ecuador, 2016; pp. 1–137.
- Cisneros, E.; Machuca, R. Estructuración de un Modelo de Encadenamiento Productivo Para la Producción y Comercialización de los Productos Derivados de la Leche en la Provincia de Pichincha, Cantón, Mejía. Bachelor’s Thesis, UPS, Quito, Ecuador, 2014. [Google Scholar]
- Secretaría de Desarrollo Productivo y Competitividad, Estrategia Agroalimentaria de Quito; MDMQ: Quito, Ecuador, 2017.
- El Comercio. Más Casas y Plusvalía en Rumiñahui; El Comercio: Quito, Ecuador, 2018; pp. 1–2. [Google Scholar]
- Gobierno Descentralizado de Rumiñahui. Plan de Uso y Ocupacion del Suelo del Cantón Rumiñahui, GAD Rumiñahui, 2020–2032; Gobierno Descentralizado de Rumiñahui: Sangolquí, Ecuador, 2020; p. 58.
- El Telégrafo. El 76% de la población de Rumiñahui proviene de otras zonas del Ecuador; Diario El Telégrafo: Guayaquil, Ecuador, 2016. [Google Scholar]
- Metro de Quito. Encuesta Domiciliaria de Movilidad-Metro-Q; MDMQ: Quito, Ecuador, 2011.
- Zapatta, A.; Alfaro Reyes, E.; Calle, D.; Chipantasig, A.; Gualotuña, A.; Gündüz, S.; Jácome, R.; Hernández, M.; Proaño, V.; Ramos, M.; et al. Sistemas Rurales-Urbanos; Instituto de la Ciudad: Quito, Ecuador, 2013. Available online: http://biblioteca.clacso.edu.ar/Ecuador/icq/20170621041610/pdf_746.pdf (accessed on 1 December 2020).
- Chiriboga, J.A. Metodología de Estudio de Preferencias Declaradas y Reveladas Para la Implementación del Sistema de Bicicleta Pública en una Ciudad. Estudio de caso el centro urbano de Sangolqui; Pontificia Universidad Católica del Ecuador: Quito, Ecuador, 2014; p. 126. [Google Scholar]
- Telégrafo, E. 21 Mil Vehículos Usan Diariamente Nuevo Proyecto Vial en la Zona de Los Chillos; Diario El Telégrafo: Guayaquil, Ecuador, 2017. [Google Scholar]
- López, A. Propuesta de Vías Colectoras y Locales en los Predios Pertenecientes al INIAP, EPMAPS y ex Lotización Ciudad del Sol para el año 2026 en base al Parroquia rural Cutuglagua, Cantón Mejía. Bachelor’s Thesis, Pontificia Universidad Católica del Ecuador, Quito, Ecuador, 2018. [Google Scholar]
- Aguilar, A. Las mega-ciudades y las periferias expandidas. Ampleando el concepto en Ciudad de México. Eure 2002, 28, 121–149. [Google Scholar] [CrossRef]
- GAD P. Moncayo. Plan de Ordenamiento Territorial del Cantón Pedro Moncayo; GAD P. Moncayo: Tabacundo, Ecuador, 2012; p. 48.
- Añazco, C. Propuesta de Estrategias de Desarrollo Local Para la Parroquia Malchinguí; PUCE: Quito, Ecuador, 2011. [Google Scholar]
- Rueda, S. La ciudad compacta y diversa frente a la conurbación difusa. La Construcción la Ciudad Sosten. 1997, 1–18. Available online: https://alojamientos.uva.es/guia_docente/uploads/2013/474/46059/1/Documento38.pdf%0Ahttp://habitat.aq.upm.es/cs/lista.html (accessed on 6 December 2020).
- Cobos, E.P. Mundialización Neoliberal, Cambios Urbanos, Urbanismo Y Políticas Estatales En América Latina. Rev. M 2009, 6, 6–25. [Google Scholar] [CrossRef]
- Soja, E.W. Exópolis. La reestructuración de la forma urbana. Postmetropolis. Estudios críticos sobre las Ciudad. y las Regiones 2008, 333–417. Available online: http://ve.scielo.org/scielo.php?script=sci_arttext&pid=S1012-25082012000300009 (accessed on 6 December 2020).
- Rojas, C.; Muñiz, I.; García, M. Estructura urbana y policentrismo en el área metropolitana de concepción. Eure 2009, 35, 47–70. [Google Scholar]
- Pastene, A.T.N.; Bride, A.O.M. Metropolización y organización funcional de sistemas urbanos intermedios. Gran La Serena, Concepción y Puerto Montt. Bitácora Urbano Territ. 2019, 29, 65–78. [Google Scholar] [CrossRef]
- Nacional, A. Ley Orgánica de Ordenamiento Territorial; Asamblea Nacional: Quito, Ecuador, 2016.
- Serrano, C.; Durán, G. Geografía de la fragmentación en el periurbano de quito: Un análisis de las nuevas centralidades cumbayá-tumbaco y san antonio de pichincha. Eure 2020, 46, 247–271. [Google Scholar] [CrossRef][Green Version]
- Salazar, E.; Henríquez, C.; Sliuzas, R.; Qüense, J. Evaluating spatial scenarios for sustainable development in Quito, Ecuador. ISPRS Int. J. Geo-Inf. 2020, 9. [Google Scholar] [CrossRef]
- Romero, H.; Moscoso, C.; Smith, P. Lecciones y conclusiones sobre la falta de sustentabilidad ambiental del crecimiento espacial de las ciudades chilenas. En ‘Chile: Del país urbano al país metropolitano. Geo Libros 2007, 12, 89–110. [Google Scholar]
- Terradas, J.; Franquesa, T.; Parés, M.; Chaparro, L. Ecología Urbana; Universidad Estatal a Distancia: San José, Costa Rica, 2001. [Google Scholar]
- Ramos, J. Jordi Borja Manuel Castells Local y global. La gestión de las ciudades en la era de la información. EURE 1998, 73, 122–125. [Google Scholar] [CrossRef]
- De Mattos, C.A. Globalización Y Metamorfosis Urbana En América Latina. EURE 2012, 38, 157–160. [Google Scholar] [CrossRef][Green Version]


Publisher’s Note: MDPI stays neutral with regard to jurisdictional claims in published maps and institutional affiliations. |
© 2021 by the authors. Licensee MDPI, Basel, Switzerland. This article is an open access article distributed under the terms and conditions of the Creative Commons Attribution (CC BY) license (https://creativecommons.org/licenses/by/4.0/).