Article

Urbanization Significantly Affects Pan-Evaporation Trends in Large River Basins of China Mainland

1
Department of Atmospheric Science, School of Environmental Studies, China University of Geosciences, Wuhan 430074, China
2
Laboratory for Climate Studies, National Climate Center, China Meteorological Administration, Beijing 100081, China
3
School of Tourism and Geographical Sciences, Jilin Normal University, Siping 136000, China
*
Author to whom correspondence should be addressed.
Land 2021, 10(4), 407; https://doi.org/10.3390/land10040407
Submission received: 15 March 2021 / Revised: 5 April 2021 / Accepted: 10 April 2021 / Published: 13 April 2021
(This article belongs to the Special Issue Feature Papers for Land–Climate Interactions Section)

Abstract

:
The causes of the pan-evaporation decline have been debated, and few researches have been carried out on the possible effect of local land use and land cover change on the regional pan-observation data series. In this paper, the urbanization effect on the estimate of pan-evaporation trends over 1961–2017 was examined for the data series of 331 urban stations, applying a previously developed dataset of the reference stations, in seven large river basins of the China mainland. The trends of pan-evaporation difference series (transformed to anomaly percentage) between urban stations and reference stations were negative and statistically significant in all of the basins, indicating that urbanization significantly reduced the pan-evaporation. The urbanization-induced trend in the whole study region was −2.54%/decade for the urban stations. Except for the Yellow River Basin and the upper Yangtze River Basin, the urbanization effects in the other five large river basins of the country are all significant, with the mid and low reaches of the Yangtze River and the Songhua River registering the largest urbanization effects of −4.08%/decade and −4.06%/decade, respectively. Since the trends of regional average series for reference stations across half of the river basins are not statistically significant, the urbanization effect is a dominant factor for the observed decline in pan-evaporation. This finding would deepen our understanding of the regional and basin-wide change in pan-evaporation observed over the last decades.

1. Introduction

Evaporation plays an important role in the Earth’s water cycle and energy cycle [1]. Pan-evaporation can reflect the evaporation potential of an area, and it also has great significance for estimating the actual evaporation. The global surface air temperature has been warming rapidly in the past decades to one hundred years [2,3,4,5,6]. In this context of global warming, the evaporation should be increased. However, the decreased trends of pan-evaporation were observed in many regions [7,8,9,10,11,12,13], which is the well-known paradox of evaporation [14]. The different underlying factors, including those of natural and anthropogenic drivers, were suggested to explain the observed decrease in pan-evaporation [1,14,15]. In China, change in the climatic factors including wind speed, solar radiation and diurnal temperature range has been found to keep in pace with the change of pan-evaporation, and they were therefore considered as the direct atmospheric factors causing the reduction of pan-evaporation in the country [16,17].
Wind speed and solar radiation are the key factors affecting pan-evaporation. Due to the rapid urbanization process and urban expansion of the world (especially in China) over the past decades, many weather stations which were originally located in rural environments are gradually getting closer and closer to the urban, and even surrounded by urban areas. The research of Tysa et al. (2019) [18] showed that nearly 90% of the 2286 observation stations in China were surrounded by built-up areas. As a result, the wind speed and solar radiation of the stations affected by urbanization might have been decreased, which might have caused the pan-evaporation to decrease.
It has been affirmed that urbanization has caused significant bias in data series of surface air temperature, wind speed, and relative humidity (RH) in observational networks in China [19,20,21,22,23], especially for surface air temperature (SAT) trends in eastern and northern China [18,24,25]. It is not clear, however, whether such changes in local environment around the observation stations has an influence on pan-evaporation records. Assuming it has, the current observation records do not reflect the large-scale pan-evaporation or potential evaporation, and the previous analysis conclusions of the pan-evaporation trends may be inaccurate. In this case, before examining the change of large-scale potential evaporation and other water cycle components, the pan-evaporation data need to be evaluated and adjusted for the systematic bias in the same way as SAT [25].
In this paper, an assessment of the urbanization effect on the estimate of pan-evaporation trends in 7 large river basins of eastern China was conducted. The results of the analysis would be important for a better understanding of the causes of the pan-evaporation change.

2. Data and Methods

2.1. Date Sources

In China mainland, there are 751 national stations that have daily pan-evaporation records from the 1950s to the present. The number of stations increased during the period of 1951–1960 and stabilized after 1960. The pans used for measuring evaporated water had a small diameter of 20 cm before 1998, and after that they was gradually replaced by larger pans with diameter of 60 cm (the E601 evaporator). The inhomogeneities of the data series caused due to instrumentation change has been adjusted [26]. The homogenization was equivalent to reconstructing the large-pan evaporation data series, based on historical records of small-pan and large-pan evaporation and the method of partial least-squares. The post-1998 (including 1998) data of the 60-cm pans were directly used in the new dataset, and the pre-1998 data of the 20-cm pans were transformed to large-pan evaporation data. The homogenized pan-evaporation data were available from the Climate Data Center of the National Meteorological Information Center, China Meteorological Administration, which ensured the temporal homogeneity of different observational data.
In order to affirm the homogeneity of the reconstructed data, we made a new examination of the inhomogeneities of the data by using the maximum penalized F-test method preset in RHtestsV4 software [27,28], with no reference series applied. The examination showed that the new data were homogeneous, and no breakpoint had been found around 1998.

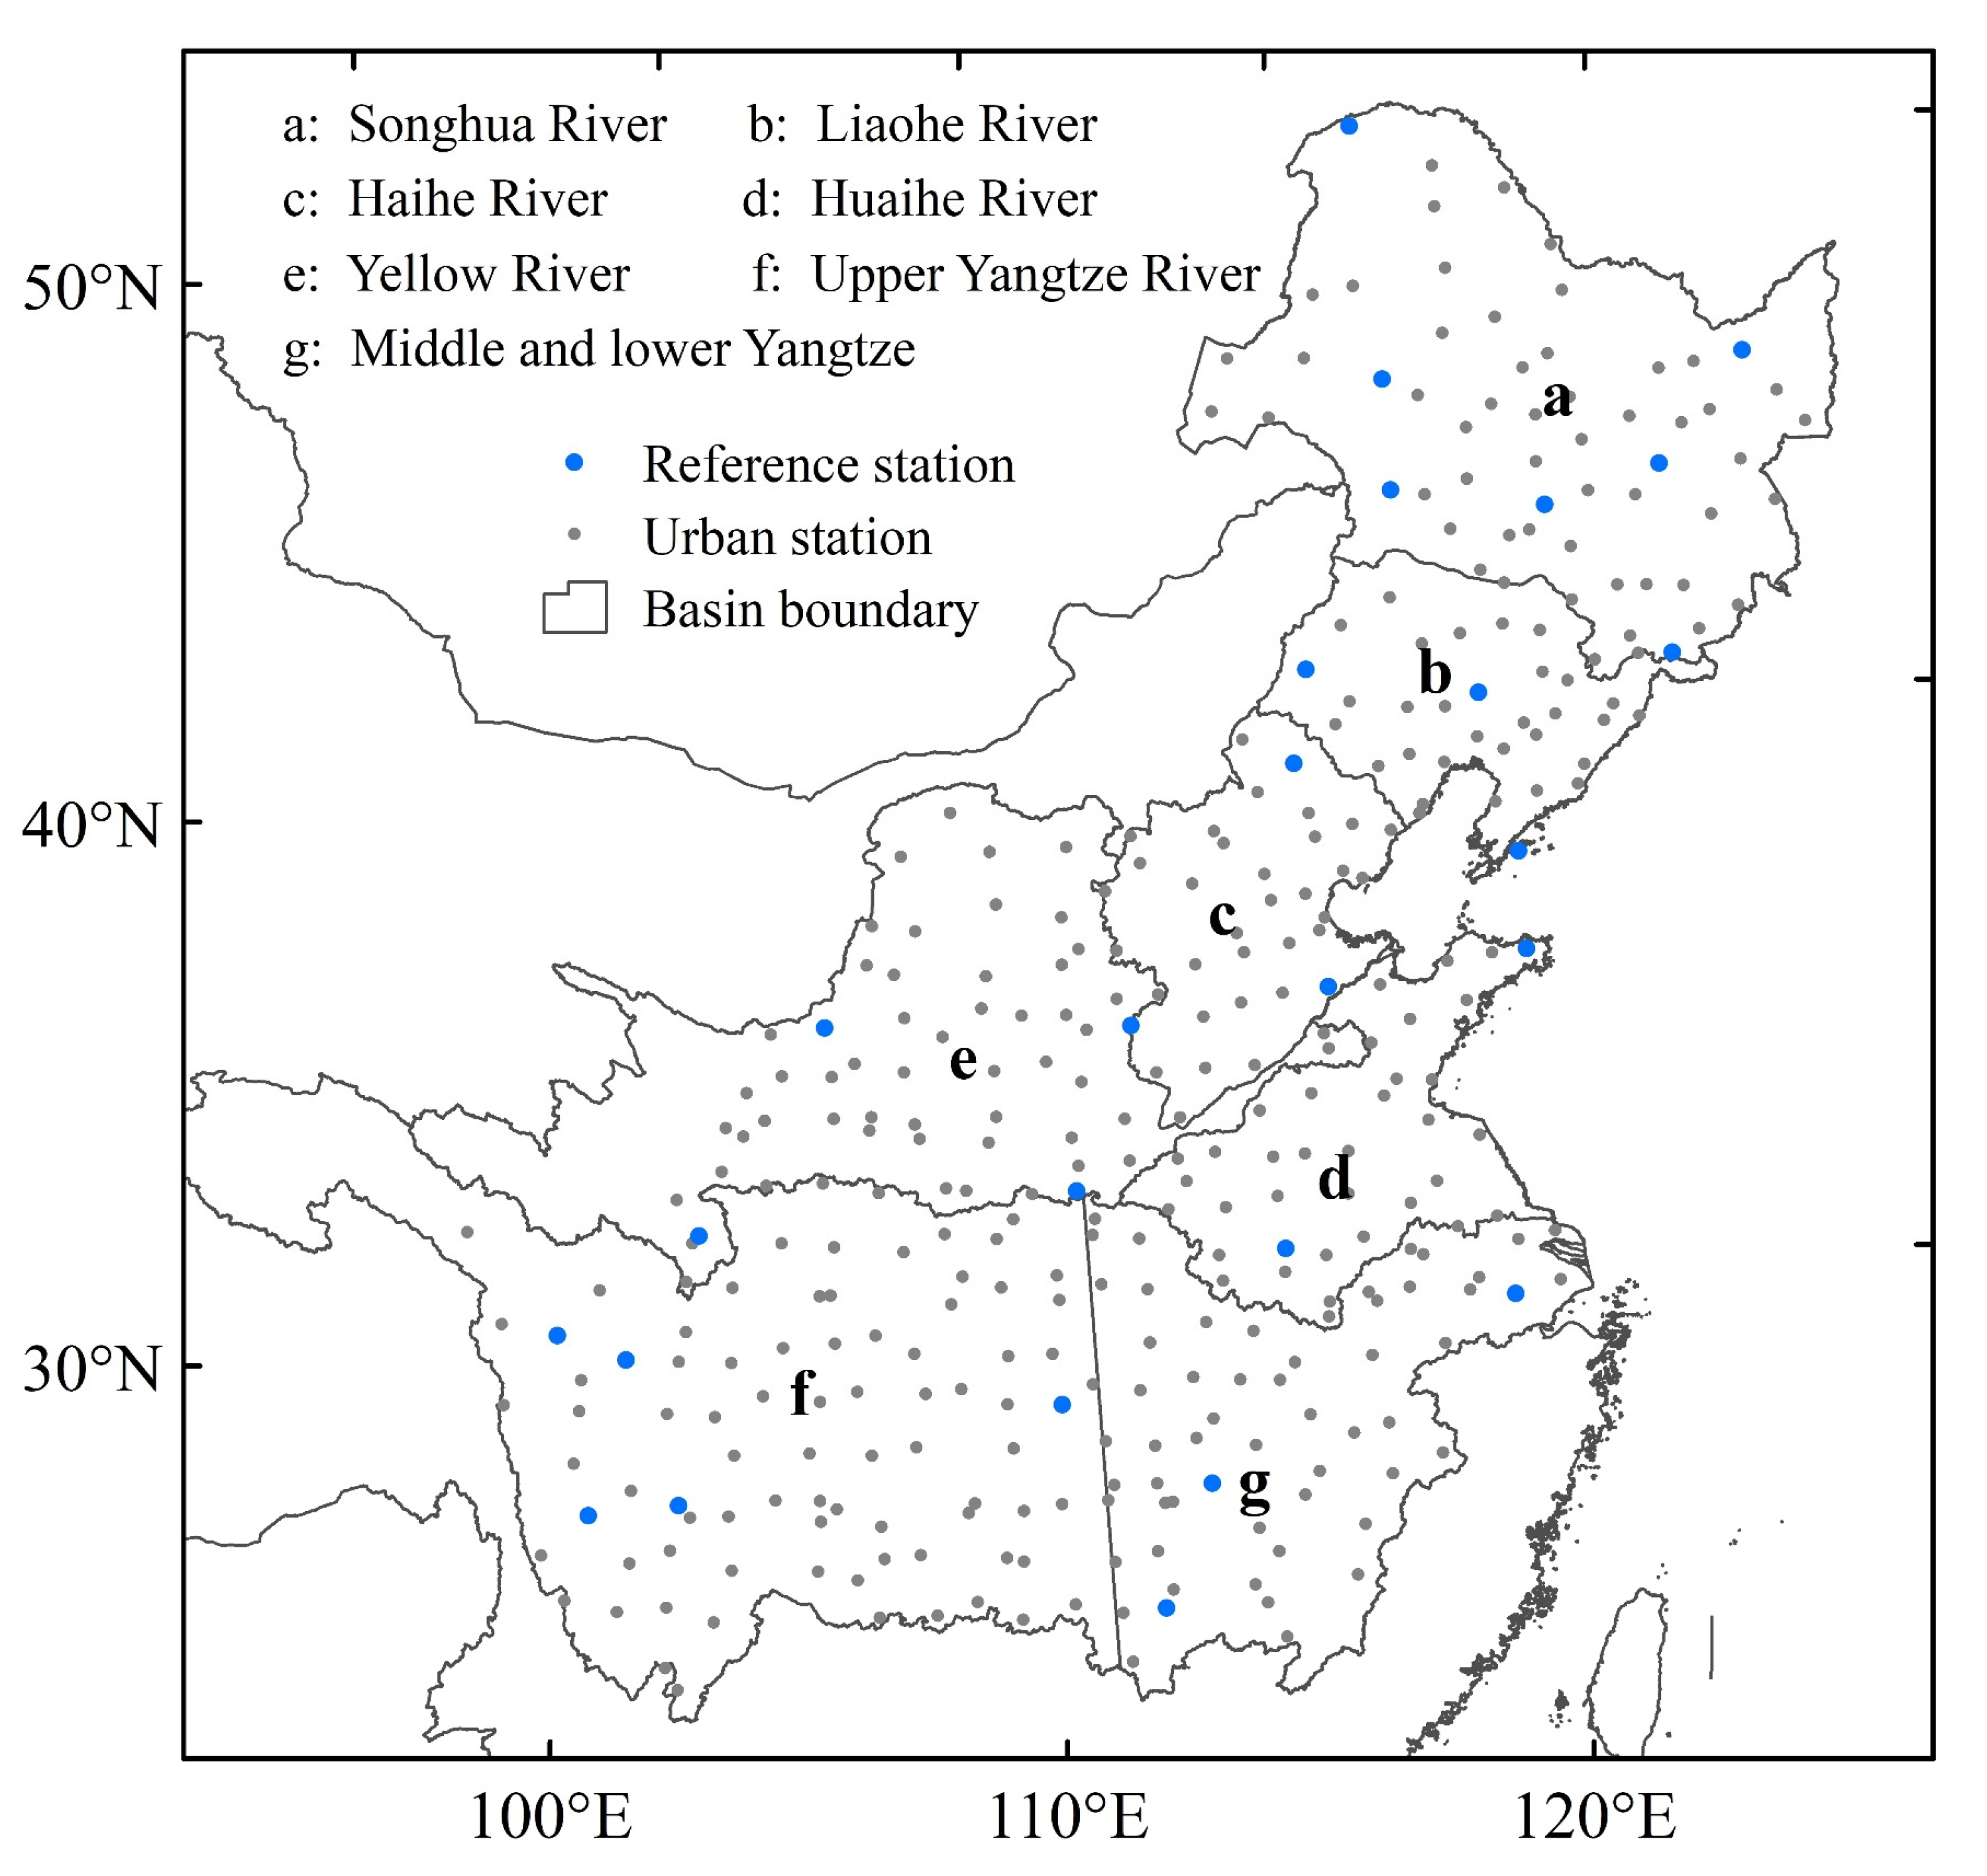
2.2. Regions (Basins) and Periods

The following considerations were made in the station selection. Firstly, the completeness of the observational records was checked. The stations with data missing rate less than 50% during reference period (1971–2000) were retained. Secondly, based on the distribution of the remaining stations, the basins with uneven distribution of stations were excluded. The excluded basins included the Northwest River Basin and the Southwest River Basin. The Southeast River Basin and the Pearl River Basin were not included because they were composed of many medium and small size rivers. Due to the large size and different hydrological characteristics [29], the Yangtze River basin was divided into two sub-basins: The upper Yangtze and the mid and lower Yangtze by the longitude of Yichang City (111.3° E) (Figure 1), which the upper reaches of the Yangtze River refers to the section from the source of the Yangtze River to Yichang Station, and the middle and lower reaches of the Yangtze River refers to the part of the Yangtze River from Yichang Station to the estuary. The river basins included in this study are the Songhua, Liaohe, Haihe, Huaihe, and Yellow rivers, the upper Yangtze river, and the mid and lower Yangtze river. Finally, 357 stations were selected for the basins from a total of 751 stations across the country.
The analysis period is 1961–2017. Data before 1960 was not used because of the lack of observations for most stations. Considering that most stations for northern China did not measure pan-evaporation in late autumn to early spring because of freezing, only the warm-season (May–September) pan-evaporation was analyzed.

2.3. Reference Stations

Reference (rural) stations were used to evaluate the urbanization effect. The reference stations should be representative of regional background climate and free of urban influences. In previous studies, information such as population, siting and satellite surface temperature around the stations was used to identify reference stations [30,31,32]. Ren et al. (2015) [25] put forward a set of principles and criteria for defining reference stations. The scheme considered, among others, the sufficient length and good continuity of the observational records, the stability and immobility of observational sites, the immunity to the urban influences, the sufficiency of station numbers, and the uniformity of station distribution. The reference stations determined by applying this scheme have been affirmed representative and effective in studying the effect of urbanization in surface air temperature data series [5,33].
In this study, 26 out of 143 reference stations selected by Ren et al. (2015) [25] for the whole China mainland were used. The selection principle of reference stations ensures that most of them in the past few decades were located in rural or natural background environments, which can be used as the background climate reference for this work. There were 357 national stations in the study region, and those which did not meet the requirement of reference stations were regarded as urban stations, which reached 331 stations and were assumed to have been affected by urbanization in varied extents. Meanwhile, all river basins contained at least two reference stations and 30 urban stations. The numbers of reference and urban stations for each of the river basins are shown in Table 1, and their distributions are shown in Figure 1.

2.4. Methods

We choose the river basins as basic analysis units for estimating the spatial average of pan-evaporation. Each basin is characterized by a unique climate [34]. The whole study region, which includes all 7 river basins, was also analyzed.
Based on daily pan-evaporation data, warm-season accumulated pan-evaporation was calculated for each station for the period 1961–2017. If the missing values reach more than 15 days in the warm-season, the warm-season value would be regarded as a missing one. In this case, the Kriging interpolation method was used to interpolate the pan-evaporation values.
The regional averaging method of grid boxes was utilized to obtain the basin and region averaged annual warm-season pan-evaporation. The study region was divided into 118 grids of 2° × 2°. The grid average was calculated through the simple arithmetical mean of all stations in the grids. The basin and regional average were the area-weighted mean of all grids, and the weight was the cosine value of latitude of the grid center. Grid, basin and regional averages of all, urban and reference stations were calculated separately.
The percent pan-evaporation anomaly (Eppa) was used to indicate the relative change in pan-evaporation. It can eliminate the influence of geographical factors, such as topography, vegetation, water body, et cetera, on analysis results. The period of 1971–2000 was used as the reference period when calculating the percent pan-evaporation anomalies.
Given ΔEppa(%) is the regional average difference series between urban and reference stations, it is expressed as:
Δ E ppa = E u(ppa) E r(ppa)
where Eu(ppa) refers to Eppa the regional average series of urban stations and Er(ppa) refers to the Eppa regional average series of reference stations.
Liner trend of ΔEppa was defined as urbanization effect [19,32,35], and the trends were estimated using the Sen slope estimator (Sen 1968). It could be expressed as:
Δ T = Median ( Δ E ppa j Δ E ppa i j i )   ×   10 ,   j   >   i
where ΔT (%/10 y) is the linear trend of ΔEppa (Tu is the linear trend of Eu(ppa), Tu is the linear trend of Er(ppa), T is linear trend of Eppa regional average series in all stations), j and i are index of year (1 ≤ i < j ≤ n, n is the number of data), Median is the median value of the resulting series from formula contained in parentheses.
If ΔT < 0, the Eppa regional average series in urban stations reflected a relative decrease trend, and urbanization effect is negative, and if ΔT > 0, urbanization effect is positive.
Urbanization contribution is the percent proportion of the statistically significant urbanization effect to the overall trend of urban stations [19,33,36]. Only if ΔT was statistically significant, urbanization contribution was calculated. It was expressed as:
C u = | Δ T T u |   ×   100%
The statistical significance of ΔT and urbanization effect was examined using the Mann–Kendall test. If the significant p-value was less than 0.05, the trend was considered as statistically significant.

3. Results

During 1961–2017, the mean annual warm-season pan-evaporation in the whole study region is 584.9 mm. The high value areas are concentrated in the Haihe, Huaihe and Yellow rivers (Table 1). The pan-evaporation was low in the southwestern and northeastern part of China. In addition, there is a large spatial difference in the Yellow river, which is related to the complex topography and the diversified climate along the river [8].
In terms of the long-term change, each basin has a negative trend of the warm-season pan-evaporation during the past 57 years (Table 1). The Haihe and Huaihe rivers, and the mid and lower Yangtze experience the most obvious decrease, and the trend values are all greater than 25 mm/decade. The regional average annual warm-season pan-evaporation also sees a significant decrease, which is well consistent with the results of many previous works that examined the issue of the so-called “evaporation paradox” [11,12,14,37]. The regional average warm-season Eppa series of all stations (Figure 2a) shows a downward trend of −2.5%/decade during the period of 1961–2017. The decrease mainly appears in the first thirty years, and the change after 1990 seems more or less stable.
The Eppa series of urban stations has a similar trend with that of all stations (Figure 2b), but a larger decrease than that of reference stations (−2.74%/decade vs. −0.89%/decade), indicating an urbanization effect in the Eppa series of all stations and urban stations. It is also notable that the decrease of the urban stations mainly occurred in the first 40 years, especially the first 30 years. However, the last two to three decades also show a decline at the urban stations relative to the reference stations, which exhibit a weak upward trend instead during the same period.
Figure 3 shows the changes in the difference series of warm-season Eppa between urban and reference stations in the whole region and each basin. In the whole study region, the difference series shows a continuous decline, implying a large urbanization effect, which is significant at the 0.01 significance level (Figure 3a). The urbanization effect in each river basin is negative, indicating that urbanization processes have caused a decline of pan-evaporation in these basins (Figure 3b–h). Except for the Yellow river and the upper Yangtze river, the urbanization effects are all statistically significant. The largest urbanization effects appear in the mid and lower Yangtze river, and the Songhua river, reaching −4.08%/decade and −4.06%/decade, respectively.
Figure 4 shows the urbanization effects and contribution in the different basins. Areas with large urbanization effects are concentrated in the basins of the Songhua, Liaohe, Haihe, Huaihe rivers, and the mid and lower Yangtze River, which are located in the east and north of the study region where there is a high population and a large number of cities. The urbanization contributions in the Haihe and Huaihe rivers and the mid and lower Yangtze river reach 40.9%, 52.5% and 88.9%, respectively. Since the trend of evaporation at the urban station is completely opposite to the trend at the reference stations, the Songhua river registers the second largest urbanization effect and a 100% urbanization contribution, indicating that the pan-evaporation decrease of the urban stations is caused totally by the urbanization. For the whole study region, the urbanization contribution is 76.3%. However, the areas of western and central China, including the Yellow river and the upper Yangtze river, show a non-significant urbanization effect, probably due to the slow urbanization processes around the observational sites.

4. Discussion

The lack of observational stations (especially reference stations) and quality of the pan-evaporation data may lead to certain uncertainty in the analysis results. Although pan-evaporation records with higher missing rates during the reference period have been removed, including the period when the site record is incomplete, and the period when the station was not established, the data series of the remaining stations still contain 3.8% missing values. However, the characteristics of the pan-evaporation variation on the inter-annual and decadal timescales, and also on the long-term trend, is well consistent with the results of previous studies [8,12,17], indicating that the quantity and quality of the observational data will not significantly affect the results of this analysis.
It is clear that the pan-evaporation data series of the urban stations, just like the surface air temperature data series, contain a significant systemic bias caused by urbanization processes. The urbanization has contributed 76.3% to the overall downward trend of the annual warm-season pan-evaporation observed during 1961–2017 across the study region.
Further studies are needed to examine by what mechanism the urbanization process has caused the decrease in the observed pan-evaporation. According to previous studies [12,23,38], atmospheric factors controlling pan-evaporation change includes solar radiation, wind speed and diurnal temperature range (DTR), which had all experienced a decrease over the last half of the 20th century [19,36,39]. Trends of the surface air temperature, especially minimum temperature and DTR in eastern and northern China, have been significantly affected by urbanization [24,31,40], with the DTR decrease in North China almost entirely caused by the expansion of urban areas around the observational sites [41,42]. Changes in solar radiation and surface (10 m) wind speed have been shown to be sensitive to urbanization [23]. It is possible that the decrease of solar radiation, surface wind speed and DTR around the observational sites mainly due to urbanization, is weakening the pan-evaporation strength of the urban stations.
However, since 2000, the percent pan-evaporation anomaly difference between the urban and reference stations in the Songhua, Liao, and Hai rivers and the upper Yangtze river has been narrowing. This may be related to the weakening of atmospheric driving forces around the urban stations partly due to the slowdown of urban development [43]. It is also possible that the observational grounds of the reference stations have been gradually affected by urbanization.
The growing effect of urban heat island (UHI) and urban dry island (UDI) on cities should be conductive to the increase in pan-evaporation at the urban stations. However, urban climate factors of solar radiation and surface wind speeds may have dominated the pan-evaporation responses to urbanization, with the effect of UHI and UDI being secondary because they are usually more obvious during the nighttime [44,45]. The decreasing trend in the solar radiation observed at urban stations may be more related to urban air pollution or aerosol emissions [46,47]. It is worth noting that this paper only analyzes the changes in pan-evaporation and the urbanization effect of the warm-season. Considering the difference between the previous estimates [37,48,49] of the pan-evaporation trend in the 21st century and the results of this article, the pan-evaporation in the non-warm season may have a different trend. This issue needs to be further examined.
Overall, the long-term trend of the pan-evaporation at the urban stations has been affected by the urbanization. This effect should be regarded as a systematic bias in the observational data if large-scale climatology and long-term climate change are concerned. A consequence of the existing bias is the overestimation of the downward trend of basin to regional-scale pan-evaporation over the past decades. In other words, the actual decrease in pan-evaporation in northern and eastern China would be rather small, and probably not as significant as reported before [1,8,37], if the bias in the data was removed. Therefore, it is important to understand the nature and magnitude of the urbanization bias, and to develop a methodology to remove it in the pan-evaporation data of the observational stations.
Therefore, our analysis shows that the so-called “evaporation paradox” is very likely to be an artefact induced by the worsened observational settings around the weather stations due to urbanization. In rural areas, the significant decrease in pan-evaporation or any calculated potential evaporation might have not been occurring. Our study adds a new perspective to the pending debate about the “evaporation paradox” or the cause of pan-evaporation decline across the global lands.
If the bias in the evaporation record is affected by the surface climate within a city, it is clear that the effects are related to the process of urban development (expansion of built-up areas and the growth of population). The quantification of various stages of urban development and their impact on pan-evaporation are necessary. It is beyond the analysis scope of this article, but can be considered as a potential problem for future work. Many current studies used population density, night lights, land cover and other data for the division of urbanization levels [30,31,32,50,51,52]. However, some of the indicators still have limitations (e.g., satellite remote sensing data only began in mid to late 1970s). Research should be carried out through a variety of ways and indicators, including new remote sensing indicators, model simulation, in order to gain an in-depth understanding of hydrological cycle changes caused by urbanization.

5. Conclusions

In this paper, urbanization effect on warm-season pan-evaporation trends of urban stations over the period 1961–2017 was assessed for the large river basins of China. The following conclusions were drawn:
(1) A large difference of pan-evaporation was found between the urban and reference stations in the main river basins and in the study region as a whole, with the negative trend of the urban stations (−2.74%/10 y) much larger than that of the reference stations (−0.89%/decade). The averaged trends of the reference stations for half of the river basins are non-significant.
(2) There are significant urbanization effects on pan-evaporation trends in all the large river basins. For the study region as a whole, the urbanization contribution reaches 76.3% during 1961–2017, indicating that urbanization processes have caused significant decline of pan-evaporation in the study region.
(3) The pan-evaporation trends in the eastern and northern river basins have been more significantly affected by urbanization. The Songhua river and the mid and lower Yangtze river witnessed the largest urbanization effects of −4.08%/decade and −4.06%/decade, respectively, and the urbanization contribution reached more than 80%.

Author Contributions

Conceptualization, G.R. and C.R.; methodology, G.R., P.Z., Y.Q. and S.K.T.; software, C.R.; validation, C.R., P.Z. and G.R.; formal analysis, G.R.; investigation, C.R.; writing—original draft preparation, C.R.; writing—review and editing, G.R. and P.Z.; supervision, G.R.; visualization, C.R.; funding acquisition, G.R. All authors have read and agreed to the published version of the manuscript.

Funding

This study is supported by the National Key R&D Program (2018YFA0605603).

Institutional Review Board Statement

The study did not involve humans or animals.

Data Availability Statement

Pan-evaporation data and station indices are partly available on http://data.cma.cn/data/cdcdetail/dataCode/SURF_CLI_CHN_MUL_DAY_V3.0.html (accessed on 31 December 2017). Complete data requires permission from the corresponding author and Xiong et al. [26].

Acknowledgments

We thank the Editor and four anonymous reviewers for their constructive comments, which improved the quality of this paper.

Conflicts of Interest

The authors declare no conflict of interest.

References

  1. Zheng, H.; Liu, X.; Liu, C.; Dai, X.; Zhu, R. Assessing contributions to panevaporation trends in Haihe River Basin, China. J. Geophys. Res. Atmos. 2009, 114. [Google Scholar] [CrossRef] [Green Version]
  2. Hansen, J.; Ruedy, R.; Sato, M.; Lo, K. Global surface temperature change. Rev. Geophys. 2010, 48. [Google Scholar] [CrossRef] [Green Version]
  3. Jones, P.D.; Lister, D.H.; Osborn, T.J.; Harpham, C.; Salmon, M.; Morice, C.P. Hemispheric and large-scale land-surface air temperature variations: An extensive revision and an update to 2010. J. Geophys. Res. 2012. [Google Scholar] [CrossRef] [Green Version]
  4. Sun, X.; Ren, G.; Xu, W.; Li, Q.; Ren, Y. Global land-surface air temperature change based on the new CMA GLSAT data set. Sci. Bull. 2017, 62, 236–238. [Google Scholar] [CrossRef] [Green Version]
  5. Zhang, P.; Ren, G.; Qin, Y.; Zhai, Y.; Sun, X. Urbanization Effects on Estimates of Global Trends in Mean and Extreme Air Temperature. J. Clim. 2021, 34, 1923–1945. [Google Scholar] [CrossRef]
  6. Osborn, T.J.; Jones, P.D.; Lister, D.H.; Morice, C.P.; Harris, I.C. Land Surface Air Temperature Variations Across the Globe Updated to 2019: The CRUTEM5 Data Set. J. Geophys. Res. Atmos. 2021, 126. [Google Scholar] [CrossRef]
  7. Golubev, V.S.; Lawrimore, J.H.; Groisman, P.Y.; Speranskaya, N.A.; Zhuravin, S.A.; Menne, M.J.; Peterson, T.C.; Malone, R.W. Evaporation changes over the contiguous United States and the former USSR: A reassessment. Geophys. Res. Lett. 2001, 28, 2665–2668. [Google Scholar] [CrossRef]
  8. Liu, C.; Zeng, Y. Changes of Pan Evaporation in the Recent 40 Years in the Yellow River Basin. Water Int. 2004, 29, 510–516. [Google Scholar] [CrossRef]
  9. Peterson, T.C.; Golubev, V.S.; Groisman, P.Y. Evaporation losing its strength. Nature 1995, 377, 687–688. [Google Scholar] [CrossRef]
  10. Vicente-Serrano, S.M.; Bidegain, M.; Tomas-Burguera, M.; Dominguez-Castro, F.; El Kenawy, A.; McVicar, T.R.; Azorin-Molina, C.; López-Moreno, J.I.; Nieto, R.; Gimeno, L. A comparison of temporal variability of observed and model-based pan evaporation over Uruguay (1973–2014). Int. J. Climatol. 2018, 38, 337–350. [Google Scholar] [CrossRef]
  11. Cong, Z.T.; Ni, G.H.; Yang, D.W.; Lei, Z.D. Evaporation paradox in China. Adv. Water Sci. 2008, 19, 147–152. [Google Scholar] [CrossRef]
  12. Ren, G.; Guo, J. Change in Pan Evaporation and the Influential Factors over China: 1956–2000. J. Nat. Resour. 2006, 21, 31–44. [Google Scholar] [CrossRef]
  13. Ren, G.; Guo, J.; Xu, M.; Chu, Z.; Li, Q. Climate changes of china’s mainland over the past half century. Acta Meteorol. Sin. 2005, 63, 942–956. [Google Scholar]
  14. Brutsaert, W.; Parlange, M.B. Hydrologic cycle explains the evaporation paradox. Nature 1998, 396, 30. [Google Scholar] [CrossRef]
  15. Roderick, M.L.; Farquhar, G.D. The Cause of Decreased Pan Evaporation over the Past 50 Years. Science 2002, 298, 1410–1411. [Google Scholar] [CrossRef] [PubMed]
  16. Qin, M.; Hao, L.; Sun, L.; Liu, Y.; Sun, G. Climatic controls on watershed reference evapotranspiration varied during 1961–2012 in southern China. Jawra J. Am. Water Resour. Assoc. 2019, 55, 189–208. [Google Scholar] [CrossRef] [Green Version]
  17. Liu, B.; Xu, M.; Henderson, M.; Gong, W. A spatial analysis of pan evaporation trends in China, 1955–2000. J. Geophys. Res. 2004, 109, 1. [Google Scholar] [CrossRef] [Green Version]
  18. Tysa, S.K.; Ren, G.; Qin, Y.; Zhang, P.; Ren, Y.; Jia, W.; Wen, K. Urbanization effect in regional temperature series based on a remote sensing classification scheme of stations. J. Geophys. Res. Atmos. 2019, 124, 10646–10661. [Google Scholar] [CrossRef]
  19. Bian, T.; Ren, G.; Zhang, L. Significant urbanization effect on decline of near-surface wind speed at Shijiazhuang station. Clim. Chang. Res. 2018, 14, 21–30. [Google Scholar] [CrossRef]
  20. Ren, G. Urbanization as a major driver of urban climate change. Adv. Clim. Chang. Res. 2017, 6, 1–6. [Google Scholar] [CrossRef]
  21. Ryu, Y.H.; Baik, J.J. Quantitative Analysis of Factors Contributing to Urban Heat Island Intensity. J. Appl. Meteorol. Climatol. 2011, 51, 842–854. [Google Scholar] [CrossRef]
  22. Wang, X.Q.; Gong, Y.B. The impact of an urban dry island on the summer heat wave and sultry weather in Beijing City. Sci. Bull. 2010, 55, 1657–1661. [Google Scholar] [CrossRef]
  23. Yang, P.; Ren, G.; Yan, P.; Deng, J. Tempospatial Pattern of Surface Wind Speed and the “Urban Stilling Island” in Beijing City. J. Meteorol. Res. 2020, 34, 986. [Google Scholar] [CrossRef]
  24. Ren, G.Y.; Chu, Z.Y.; Chen, Z.H.; Ren, Y.Y. Implications of temporal change in urban heat island intensity observed at Beijing and Wuhan stations. Geophys. Res. Lett. 2007, 34, 89–103. [Google Scholar] [CrossRef]
  25. Ren, G.; Li, J.; Ren, Y.; Chu, Z.; Zhang, A.; Zhou, Y.; Zhang, L.; Zhang, Y.; Bian, T. An Integrated Procedure to Determine a Reference Station Network for Evaluating and Adjusting Urban Bias in Surface Air Temperature Data. J. Appl. Meteorol. Climatol. 2015, 54. [Google Scholar] [CrossRef]
  26. Xiong, A.-Y.; Liao, J.; Xu, B. Reconstruction of a daily large-pan evaporation dataset over China. J. Appl. Meteorol. Climatol. 2012, 51, 1265–1275. [Google Scholar] [CrossRef]
  27. Wang, X.L. Accounting for Autocorrelation in Detecting Mean Shifts in Climate Data Series Using the Penalized Maximal t or F Test. J. Appl. Meteorol. Climatol. 2008, 47, 2423–2444. [Google Scholar] [CrossRef]
  28. Wang, X.L. Penalized Maximal F Test for Detecting Undocumented Mean Shift without Trend Change. J. Atmos. Ocean. Technol. 2008, 25, 368–384. [Google Scholar] [CrossRef]
  29. Jiang, T.; Su, B.; Hartmann, H. Temporal and spatial trends of precipitation and river flow in the Yangtze River Basin, 1961–2000. Geomorphology 2007, 85, 143–154. [Google Scholar] [CrossRef]
  30. Ren, Y.; Ren, G. A remote-sensing method of selecting reference stations for evaluating urbanization effect on surface air temperature trends. J. Clim. 2011, 24, 3179–3189. [Google Scholar] [CrossRef] [Green Version]
  31. Yang, X.; Hou, Y.; Chen, B. Observed surface warming induced by urbanization in east China. J. Geophys. Res. Atmos. 2011, 116. [Google Scholar] [CrossRef]
  32. Ren, G.; Zhou, Y.; Chu, Z.; Zhou, J.; Zhang, A.; Guo, J.; Liu, X. Urbanization Effects on Observed Surface Air Temperature Trends in North China. J. Clim. 2008, 21, 1333–1348. [Google Scholar] [CrossRef] [Green Version]
  33. Sun, Y.; Zhang, X.; Ren, G.; Zwiers, F.W.; Hu, T. Contribution of urbanization to warming in China. Nat. Clim. Chang. 2016, 6, 706–709. [Google Scholar] [CrossRef]
  34. Liu, C.; Zhang, D.; Liu, X.; Zhao, C. Spatial and temporal change in the potential evapotranspiration sensitivity to meteorological factors in China (1960–2007). J. Geogr. Sci. 2012, 22, 3–14. [Google Scholar] [CrossRef]
  35. Ren, G.; Zhou, Y. Urbanization effect on trends of extreme temperature indices of national stations over mainland China, 1961–2008. J. Clim. 2014, 27, 2340–2360. [Google Scholar] [CrossRef]
  36. Fu, C.; Yu, J.; Zhang, Y.; Hu, S.; Ouyang, R.; Liu, W. Temporal variation of wind speed in China for 1961–2007. Theor. Appl. Climatol. 2011, 104, 313–324. [Google Scholar] [CrossRef]
  37. Wang, T.; Zhang, J.; Sun, F.; Liu, W. Pan evaporation paradox and evaporative demand from the past to the future over China: A review. Wiley Interdiscip. Rev. Water 2017, 4, e1207. [Google Scholar] [CrossRef]
  38. Gao, G.; Chen, D.; Ren, G.; Chen, Y.; Liao, Y. Trend of potential evapotranspiration over China during 1956 to 2000. Geogr. Res. 2006, 25, 378–387. [Google Scholar] [CrossRef]
  39. Ren, G.; Ding, Y.; Zhao, Z.; Zheng, J.; Wu, T.; Tang, G.; Xu, Y. Recent progress in studies of climate change in China. Adv. Atmos. Sci. 2012, 29, 958–977. [Google Scholar] [CrossRef]
  40. Zhang, A.Y.; Ren, G.Y.; Zhou, J.X.; Chu, Z.Y.; Tang, G.L. On the urbanization effect on surface air temperature trends over China. Acta Meteorol. Sin. 2010, 68, 957–966. [Google Scholar]
  41. Zhou, Y.; Ren, G. Change in extreme temperature event frequency over mainland China, 1961–2008. Clim. Res. 2011, 50, 125–139. [Google Scholar] [CrossRef] [Green Version]
  42. Wang, K.; Ye, H.; Chen, F.; Xiong, Y.; Wang, C. Urbanization effect on the diurnal temperature range: Different roles under solar dimming and brightening. J. Clim. 2012, 25, 1022–1027. [Google Scholar] [CrossRef]
  43. Wei, Y.H.D. Restructuring for growth in urban China: Transitional institutions, urban development, and spatial transformation. Habitat Int. 2012, 36, 396–405. [Google Scholar] [CrossRef]
  44. Zhou, D.; Zhang, L.; Hao, L.; Sun, G.; Liu, Y.; Zhu, C. Spatiotemporal trends of urban heat island effect along the urban development intensity gradient in China. Sci. Total Environ. 2016, 544, 617–626. [Google Scholar] [CrossRef]
  45. Yang, P.; Ren, G.; Liu, W. Spatial and Temporal Characteristics of Beijing Urban Heat Island Intensity. J. Appl. Meteorol. Climatol. 2013, 52, 1803–1816. [Google Scholar] [CrossRef]
  46. Dickerson, R.; Kondragunta, S.; Stenchikov, G.; Civerolo, K.; Doddridge, B.; Holben, B. The impact of aerosols on solar ultraviolet radiation and photochemical smog. Science 1997, 278, 827–830. [Google Scholar] [CrossRef] [PubMed] [Green Version]
  47. Yang, X.; Zhao, C.; Zhou, L.; Wang, Y.; Liu, X. Distinct impact of different types of aerosols on surface solar radiation in China. J. Geophys. Res. Atmos. 2016, 121, 6459–6471. [Google Scholar] [CrossRef]
  48. Cong, Z.T.; Yang, D.W.; Ni, G.H. Does evaporation paradox exist in China? Hydrol. Earth Syst. Sci. 2009, 13, 357–366. [Google Scholar] [CrossRef] [Green Version]
  49. Xing, W.; Wang, W.; Shao, Q.; Yu, Z.; Yang, T.; Fu, J. Periodic fluctuation of reference evapotranspiration during the past five decades: Does Evaporation Paradox really exist in China? Sci. Rep. 2016, 6, 1–12. [Google Scholar] [CrossRef] [PubMed]
  50. Owen, T.W.; Gallo, K.P. Updated Population Metadata for United States Historical Climatology Network Stations. J. Clim. 2010, 13, 4028–4033. [Google Scholar] [CrossRef]
  51. Johnson, G.L.; Davis, J.M.; Karl, T.R.; Mcnab, A.L.; Gallo, K.P.; Tarpley, J.D.; Bloomfield, P.R. Estimating urban temperature bias using polar-orbiting satellite data. J. Appl. Meteorol. Climatol. 2010, 33, 358–369. [Google Scholar] [CrossRef] [Green Version]
  52. Small, C. Global Population Distribution and Urban Land Use in Geophysical Parameter Space. Earth Interact. 2009, 8, 145–147. [Google Scholar] [CrossRef]
Figure 1. The distribution of the reference and urban stations in each river basin.
Land 10 00407 g001
Figure 2. Change trends of the warm season (May to September) mean pan-evaporation for all (a), urban and reference stations (b) in the whole study region, 1961–2017 (T, Tu, Tr: regional average trend; * and ** refers to the statistically significant trend at 0.05 and 0.01 levels of significance).
Land 10 00407 g002
Figure 3. Difference series of warm-season (May to September) percent pan-evaporation anomaly (Eppa) between urban and reference stations in each river basin (dash line indicates linear trends (∆T, unit: %/decade); * and ** denote that trend was statistically significant at 0.05 and 0.01 levels).
Land 10 00407 g003
Figure 4. The urbanization effects and contributions of the large river basins for period 1961–2017 (values on map represent urbanization effect and contribution; * and ** denote that the trend was statistically significant at 0.05 and 0.01 level).
Land 10 00407 g004
Table 1. Numbers of reference, urban and total stations, and mean and trend of warm-season pan-evaporation during 1961–2017, in each river basin.
Basin NameReference StationsUrban StationsTotal StationsMean Pan-Evaporation
(mm)
Pan-Evaporation Trend
(mm/Decade)
Songhua river75158534.66−6.67 *
Liaohe river33033633.06−15.23 **
Haihe river33134656.44−29.40 **
Huaihe river23436710.9−16.61 **
Yellow river35255596.93−30.09 **
Upper Yangtze58388497.15−5.43 **
Mid/lower Yangtze35053582.93−27.33 **
Whole study region26331357584.92−14.88 **
* refers to the trend statistically significant at the 0.05 level, ** refers to the trend statistically significant at the 0.01 level.
Publisher’s Note: MDPI stays neutral with regard to jurisdictional claims in published maps and institutional affiliations.

