Abstract
Plants are affected by the features of their surrounding environment, such as climate change and air pollution caused by anthropogenic activities. In particular, agricultural production is highly sensitive to environmental characteristics. Since no environmental factor is independent, the interactive effects of these factors on plants are essential for agricultural production. In this context, the interactive effects of ozone (O3) and supraoptimal temperatures remain unclear. Here, we investigated the physiological and stomatal characteristics of leaf mustard (Brassica juncea L.) in the presence of charcoal-filtered (target concentration, 10 ppb) and elevated (target concentration, 120 ppb) O3 concentrations and/or optimal (22/20 °C day/night) and supraoptimal temperatures (27/25 °C). Regarding physiological characteristics, the maximum rate of electron transport and triose phosphate use significantly decreased in the presence of elevated O3 at a supraoptimal temperature (OT conditions) compared with those in the presence of elevated O3 at an optimal temperature (O conditions). Total chlorophyll content was also significantly affected by supraoptimal temperature and elevated O3. The chlorophyll a/b ratio significantly reduced under OT conditions compared to C condition at 7 days after the beginning of exposure (DAE). Regarding stomatal characteristics, there was no significant difference in stomatal pore area between O and OT conditions, but stomatal density under OT conditions was significantly increased compared with that under O conditions. At 14 DAE, the levels of superoxide (O2-), which is a reactive oxygen species, were significantly increased under OT conditions compared with those under O conditions. Furthermore, leaf weight was significantly reduced under OT conditions compared with that under O conditions. Collectively, these results indicate that temperature is a key driver of the O3 response of B. juncea via changes in leaf physiological and stomatal characteristics.
1. Introduction
Over the next 40 years, the demand for agricultural production is expected to increase by at least 50% as a result of the projected growth of human population [1]. However, agricultural production is highly sensitive to environmental characteristics [2]. According to the latest Intergovernmental Panel on Climate Change (IPCC) Fifth Assessment Report, anthropogenic activities, such as rapid industrial development, have led to substantial climate change due to increased greenhouse gas emission [3]. The global mean temperature is expected to increase by 1.1 °C to 4.8 °C depending on future climate scenarios within this century, which will further worsen global warming and its associated problems related to the ecosystems and crops [3,4]. Climate change is a critical threat to ecosystem health. In particular, global warming may severely damage agricultural crops [4].
To combat global warming, the responses of agricultural crops to increased temperatures in the future must be investigated. Prolonged exposure to elevated temperatures is a critical threat to global crop production [5]. Depending on their developmental stages and specific characteristics, plants respond differently to temperature. However, temperatures exceeding the upper tolerance threshold of plants decrease their net photosynthetic rate and total biomass [6]. Given the importance of temperature in determining net carbon metabolism [7], supraoptimal temperatures can negatively affect plant growth and development. In general, high temperatures increase respiration and photorespiration and possibly deactivate ribulose 1,5-bisphosphate carboxylase/oxygenase (RuBisCO) to limit photosynthesis. There are two reasons for the increased photorespiration and suppressed photosynthesis under elevated temperatures. First, high temperature decreases the specificity of RuBisCO for CO2 relative to that for O2, promoting rapid oxygenation. Next, the solubility of O2 decreases more slowly than that of CO2 [8]. In addition, the imbalance between photosynthesis and respiration impairs plant growth under elevated temperatures [9].
Furthermore, elevated environmental temperatures can increase stomatal movement, which is linked to primary metabolism [10]. Plant stomatal processes play pivotal roles in carbon cycles [11]. In particular, stomatal conductance is one of the important factors influencing plant net photosynthetic rate and carbon metabolism. However, previous experiments assessing the direct dependence of stomatal conductance on temperature have achieved inconsistent results [12]. In general, stomatal characteristics are strongly affected by elevated temperatures [13]. Recent studies have reported that plants can acclimate to warmer conditions by regulating the interaction between stomatal movement and vapor pressure deficit to allow growth and photosynthesis [14,15]. As a result of these physiological changes, plant growth and development are suppressed at supraoptimal temperatures, which further reduces the total biomass and yield of crops [16].
In addition, tropospheric ozone (O3) concentration is expected to rise along with global warming, since the levels of O3 precursors, such as NOx, CO, and volatile organic compounds, are predicted to increase in the future [17]. Currently, O3 is more harmful to agricultural crops than other air pollutants. Specifically, elevated O3 levels may impede plant physiological processes, including photosynthesis [18]. Plants grown in the presence of elevated O3 levels show decreased carbon metabolism [19]. In particular, photosynthetic inhibition by O3 exposure has been attributed to reduced carboxylation efficiency, impaired electron transport, and dysregulated stomatal movement. Consequently, the levels of nonstructural carbohydrates, including sucrose and starch, are reduced [20]. In addition to decreased carbon availability, O3-induced stress indirectly affects the carbon balance in plant cells via reactive oxygen species (ROS) generation [21].
The rate of O3 influx to leaves is controlled by the stomatal aperture. Typically, stomatal closure is recognized as a response to limit O3 uptake. Acute O3 exposure can substantially decrease stomatal conductance via ROS accumulation in the guard cells [22]. Several studies using open-top chamber experiments have reported that O3 decreases stomatal conductance, consequently limiting CO2 influx to leaves [23,24]. Nonetheless, this mechanism is not supported by the results of other experiments. Some studies have reported that stomata cannot rapidly close as a result of impairment following exposure to high O3 concentrations [25,26]. Elevated O3 may delay the stomatal response by delignifying the guard cells and reducing abscisic acid (ABA) sensitivity [26]. The ABA response of stomata is associated with O3-induced ethylene emission [27]. Regardless of the mechanisms involved, O3 is evidently an important determinant of plant physiology.
Individual effects of supraoptimal temperatures and O3 levels are unlikely to occur in natural environments, because neither factor acts independently on plants [28]. As such, tropospheric O3 concentration shows a linear relationship with atmospheric temperature [29]. In addition, elevated O3 is related to increased temperature, which can directly affect the chemical kinetics and mechanisms of O3 formation [30]. Environmental factors can synergistically affect plant responses, which cannot be predicted based on the results of experiments on individual factors [31]. Although recent studies have proven the individual effects of O3 or temperature on plants, their interactive effects remain relatively understudied [5,7,19,32]. Furthermore, in addition to greenhouses, agricultural crops are cultivated on open fields, where they are highly prone to exposure to elevated temperatures and O3 concentrations. Therefore, the interactive effects of these two environmental factors on crops warrant close attention.
To this end, the present study examined the individual and combined effects of supraoptimal temperatures and elevated O3 concentrations in leaf mustard (Brassica juncea L.), which is widely cultivated in East Asia. Leaf mustard B. juncea is a biennial vegetable crop usually used for edible leaves and seeds to make mustard [33]. The effects of elevated O3 have been largely researched on Brassica species throughout the world [34,35,36,37]. Singh et al. [37] reported observed decreases in photosynthetic rate and nutrient levels of Brassica campesteris L. var. Kranti under ambient O3 ranging from 40 to 52 ppb at field condition. Singh et al. [38] also studied the synergistic effects of elevated O3 and CO2 on yield and photosynthetic rate of Brassica juncea. There is not sufficient research to assess the effects of O3 and temperature on the physiological changes of B. juncea. Specifically, we investigated the effects of optimal and supraoptimal temperatures and/or ambient and elevated O3 concentrations on the physiological and stomatal characteristics of leaf mustard and observed whether supraoptimal temperatures alter the O3 responses of plants by regulating stomatal movement and carbon metabolism. We hypothesized that (i) the interactive effects of supraoptimal temperature and elevated O3 concentration on the primary metabolism of leaf mustard are negative and stronger than their individual effects and (ii) supraoptimal temperatures worsen O3 damage by regulating stomatal movement in B. juncea.
2. Materials and Methods
2.1. Plant Material and O3 Fumigation Chamber
Seedlings of leaf mustard (B. juncea), which is widely cultivated in East Asia, were used as the test plant material in this study. Seeds were germinated and cultivated for 2 weeks in a closed-type plant factory (temperature: 20 ± 2 °C; relative humidity: 60 ± 5%; light intensity: 200 ± 20 mol m−2 s−1; day length: 16 h) at the University of Seoul, Seoul, Korea (37°34′57.5″ N, 127°03′39.1″ E). Thereafter, the seedlings were transplanted into 3 L plastic pots filled with a growing medium containing perlite, vermiculite, and peat moss (Green Partner, Nongwoo Bio, Suwon, Korea). All test seedlings were allowed to acclimatize for a week in the chambers, which were enclosed by glass, under sunlight before starting the treatments.
The present experiment was performed in growth chambers (Growth chamber, Koito Industries, Yokohama, Japan) equipped with an O3 generator (ON-1-2, Nippon Ozone Co., Tokyo, Japan). The fumigation system has been described elsewhere [39]. For each test, 15 plants with similar growth conditions were placed in a control chamber with a charcoal filter, and an additional 15 plants were placed in a treatment chamber with an O3 fumigator. All plants were irrigated well and randomly placed everyday throughout the experiment. Leaves were sampled twice at 7 and 14 days after the beginning of exposure (DAE) between 09:00 and 12:00 h. The experiment lasted from March to April 2018. Fully expanded leaves were used to analyze the O3 response of physiological and stomatal characteristics. Samples were stored at − 80 °C until analysis.
The treatment conditions in the growth chamber are summarized in Table 1. The elevated O3 concentration used was based on the hourly average maximum O3 concentration from March to July 2016 measured in South Korea [40]. The optimal temperature was 22 °C, since Brassica spp. grow the best within the temperature range of 22–25 °C according to previous reports [41,42,43]. The supraoptimal temperature was 5 °C above the optimal temperature range for leaf mustard considering one of the moderate scenarios for 2100 projected previously [3]. The test plants were exposed to O3 for 8 h daily from 09.30 to 17.30 h while controlling the temperature and relative humidity for 24 h (Figure 1).

Table 1.
Controlled environmental conditions in each treatment chamber in the experiment.
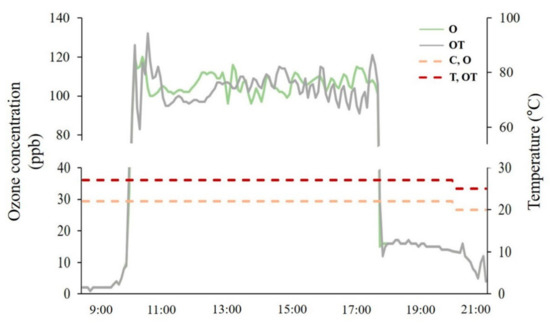
Figure 1.
Daily variation in ozone concentration (solid line) and temperature (dash line) in each treatment chamber. C: optimal temperature + ambient O3; T: supraoptimal temperature + ambient O3; O: optimal temperature + elevated O3; OT: supraoptimal temperature + elevated O3.
2.2. Physiological Characteristics
Photosynthetic rate curves were plotted against intercellular CO2 concentration (A/Ci) using a portable photosynthesis measurement system (Li-6400 XT, LI-COR Inc., Lincoln, NE, USA) with an LED source (6400-02B, LI-COR Inc., Lincoln, NE, USA). Measurements were performed on the second to fourth fully expanded leaves in each treatment group, with CO2 concentration settings of 50, 100, 150, 200, 400, 600, 800, 1000, and 1200 μmol mol−1, tested under photosynthetically active radiation of 1000 μmol m−2 s−1, block temperature of 20 °C, and relative humidity of 50–60%. The maximum reaction velocity of RuBisCO for carboxylation (Vcmax), maximum rate of electron transport (Jmax), triose phosphate use (TPU), daytime respiration (Rd), and mesophyll conductance (gm) were calculated based on the response curves using the A/Ci curve fitting utility program described previously [44].
Chlorophyll a (Chl a) fluorescence was determined for the second to fourth fully developed leaves using Pocket PEA software (PEA plus V1.10, Hansatech Instrument Ltd., Norfolk, UK) between 10.00 and 12.00 h. Before measurement, leaves were adapted to darkness using leaf clips for 30 min. A saturating pulse at an intensity of 3500 μmol m−2 s−1 (peak wavelength, 627 nm) was applied to the upper surface of the test leaves to measure the minimum fluorescence (Fo), maximum fluorescence (Fm), and OJIP transients. The maximum photochemical efficiency of photosystem II (PS II) was determined as the ratio of variable fluorescence (Fv = Fm − Fo) to maximum fluorescence (Fv/Fm).
The measured values of OJIP transients indicate Fo intensity at 50 μs when all PS II reaction centers (RCs) are open (O-step), fluorescence intensity at 2 ms (J-step), fluorescence intensity at 30 ms (I-step), and Fm intensity when all PS II RCs are closed (P-step). The JIP parameters were calculated to identify the extent of damage to the electron acceptor sites of PS II by O3 according to the JIP test equations [45,46]. The value of each JIP parameter is listed in Table S1.
2.3. Chlorophyll Content
Chl a, chlorophyll b (Chl b), and total chlorophyll (Chl a + Chl b) content was estimated as previously described [47]. Fresh leaves (0.1 g) were extracted in 10 mL of 80% (v/v) acetone for 14 days at 4 °C. The chlorophyll content was quantified using a microplate reader (Epoch Microplate Spectrophotometer, Synergy, BioTek, Winooski, VT, USA) at an absorbance (A) of 663, 645, and 470 nm. Chlorophyll content was determined using the following formulas:
Chlorophyll a (mg g−1 FW) = 12.7 × A663−2.69 × A645
Chlorophyll b (mg g−1 FW) = 22.9 × A645−4.68 × A663
Total chlorophyll (mg g−1 FW) = 20.2 × A645 + 8.02 × A663.
Chlorophyll b (mg g−1 FW) = 22.9 × A645−4.68 × A663
Total chlorophyll (mg g−1 FW) = 20.2 × A645 + 8.02 × A663.
In practice, the phytol chain of chlorophyll molecules can be easily cleaved with the addition of 80% acetone [48]. We did not consider the phytol chain cleavage, because phytol has the same absorption and light spectra as chlorophyll and thus does not affect the values obtained using this method [49].
2.4. Stomatal Characteristics
For the measurement of stomatal characteristics, leaf samples were harvested at 14 DAE between 09:00 and 12:00 h and freeze-dried using a lyophilizer (FD 8508, ilShinbiobase CO. Ltd., Dongducheon, South Korea). Stomatal density per leaf and stomatal size were evaluated via field emission scanning electron microscopy (FESEM; SU-70, Hitachi, Tokyo, Japan). Stomatal density was determined based on the number of stomata obtained by FESEM.
2.5. Hydrogen Peroxide (H2O2) and Superoxide (O2−) Accumulation
H2O2 and O2- accumulation in sampled leaves was measured as described previously [50], with slight modification. To detect H2O2, leaf discs were cut with a cork borer (diameter, 2 cm), vacuum-infiltrated in 1 mg ml−1 of 3,3-diaminobenzidine (DAB) in 0.2 M HCl (pH 3.8), and incubated at 25 °C for 4 h in the dark. To detect O2-, the leaf discs were cut (diameter, 2 cm), vacuum-infiltrated in 50 mM potassium phosphate buffer (pH 7.8) containing 0.1% (w/v) nitroblue tetrazolium (NBT), and incubated at 25 °C for 20 min in the dark. For both measurements, leaf discs were immersed in 96% (v/v) ethanol for 20 min at 70 °C to remove chlorophyll. After cooling, the leaf discs were stored in 70% (v/v) glycerol. The leaf discs were photographed and observed under a stereomicroscope (Leica M275, Leica Microsystems, Mannheim, Germany). The stained areas were calculated as the proportion of pixels in the stained area to the total pixels using Adobe Photoshop CS6 (Adobe Inc., Mountain View, CA, USA).
2.6. Growth Characteristics
All plants in each treatment chamber were collected at 14 DAE. Five plants per treatment were randomly selected to determine leaf fresh and dry weight, leaf number, and leaf area. Leaf area was measured on three fully expanded leaves of five plants using winFolia (Regent Instruments Inc., Sainte-Foy, QC, Canada). Leaf dry weight was obtained by drying the samples for 48 h at 60 °C in an oven (HK-300DO, HUKO FS, Seoul, Korea).
2.7. Statistical Analysis
Effects of O3 concentration, temperature, sampling date, and their interactions on the physiological and stomatal characteristics of B. juncea were analyzed using two-way or three-way analysis of variance (ANOVA). Tukey’s honestly significant difference test (p ≤ 0.05) was used to compare the differences among the parameters tested. Significance of differences in values at 7 and 14 DAE among various treatments was tested using independent t-test. All analyses were performed using SPSS Statistics 25 (SPSS Inc., Chicago, IL, USA). Values in figures and tables are presented as mean ± SD.
3. Results
3.1. A/Ci Curve Response
At 7 DAE, Vcmax was significantly decreased under ambient O3 + supraoptimal temperature (T) (by 19.3%) and elevated O3 + supraoptimal temperature (OT) (by 36.2%) conditions compared with that under ambient O3 + optimal temperature (C) conditions. At 14 DAE, Vcmax under O and OT conditions was significantly reduced by respectively 44.6% and 54.3% compared with that under C conditions. Therefore, supraoptimal temperatures did not significantly affect the Vcmax of B. juncea at 14 DAE (Figure 2). Three-way ANOVA showed that Vcmax was significantly affected by all individual factors and their interactions except for the temperature × O3 × sampling date interaction (Table S2).
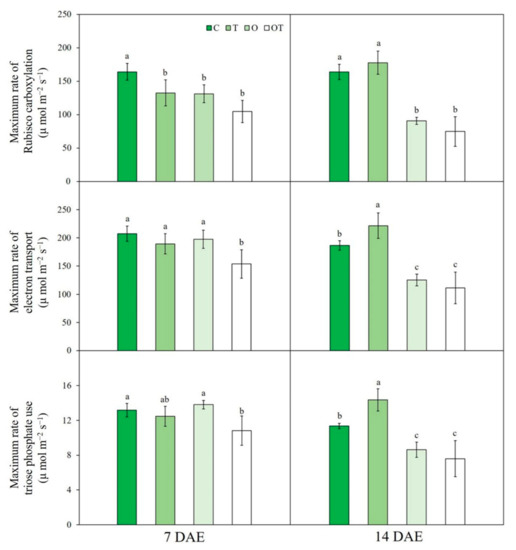
Figure 2.
The maximum rate of ribulose 1,5-bisphosphate carboxylase/oxygenase (RuBisCo) carboxylation, electron transport, and triose phosphate use of Brassica juncea L. under different ambient and supraoptimal temperatures and O3 concentrations at 7 and 14 DAE. Data are plotted as mean ± SD (n = 5). Different letters indicate significant differences among treatments at p < 0.05 according to Tukey’s honestly significant difference test. C: ambient O3 + optimal temperature; T: ambient O3 + supraoptimal temperature; O: elevated O3 + optimal temperature; OT: elevated O3 + supraoptimal temperature; DAE: days after the beginning of exposure.
At 7 and 14 DAE, Jmax under OT conditions was significantly decreased by respectively 34.9% and 67.9% compared with that under C conditions. Furthermore, Jmax under O conditions was significantly reduced by 55.05% compared with that under C conditions (Figure 2). Three-way ANOVA showed that two individual factors, namely elevated O3 and sampling date, significantly affected Jmax. Moreover, the interactions among factors also significantly affected Jmax, except the temperature × O3 × sampling date interaction (Table S2).
At 7 DAE, there were no significant differences in TPU under O, OT, and T conditions compared with that under C conditions; however, at 14 DAE, TPU under O (by 31.6%) and OT (by 43.4%) conditions was significantly reduced compared with that under C conditions (Figure 2). Three-way ANOVA showed that TPU was significantly affected by two individual factors, namely elevated O3 and sampling date, as well as by interactions among all factors, except the temperature × O3 × sampling date interaction (Table S1).
At 7 DAE, Rd was increased under OT conditions compared with that under C and O conditions (by 56.3% and 53.3%, respectively). At 14 DAE, Rd under T conditions was significantly increased (by 44.8%) compared with that under C conditions (Figure 3). Three-way ANOVA showed that elevated temperature strongly affected Rd (Table S2).
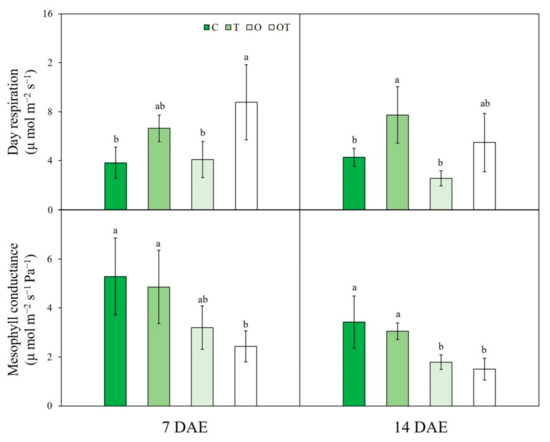
Figure 3.
Daytime respiration and mesophyll conductance of Brassica juncea L. under different ambient and supraoptimal temperatures and O3 concentrations at 7 and 14 DAE. Data are plotted as mean ± SD (n = 5). Different letters indicate significant differences among treatments at p < 0.05 according to Tukey’s honestly significant difference test. C: ambient O3 + optimal temperature; T: ambient O3 + supraoptimal temperature; O: elevated O3 + optimal temperature; OT: elevated O3 + supraoptimal temperature; DAE: days after the beginning of exposure.
Moreover, gm was significantly reduced under OT conditions compared with that under C conditions. Similarly, gm under OT conditions was significantly reduced by 47.4% compared with that under T conditions (Figure 3). Three-way ANOVA indicated that gm was significantly affected by the sampling date alone (Table S2).
3.2. Chl Content
At 14 DAE, total Chl content was significantly decreased under O (by 23.2%) and OT (by 55.3%) conditions compared with that under C conditions. However, at 7 DAE, total Chl content was significantly reduced under OT (by 36.2%) conditions alone (Figure 4). Total Chl content was affected by two individual factors, namely supraoptimal temperature and O3, whereas sampling date and interactions among all factors did not significantly affect total Chl content, except the O3 × sampling date interaction (Table S2).
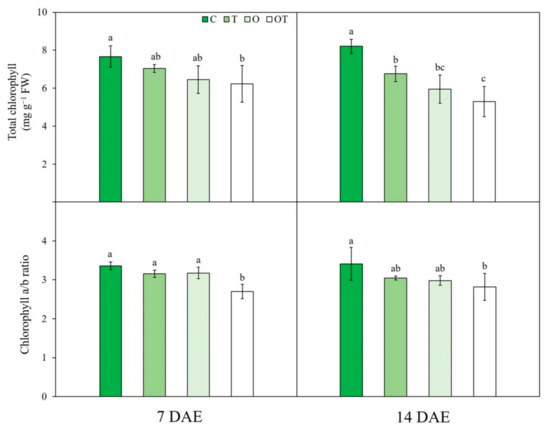
Figure 4.
Total chlorophyll content and chlorophyll a/b ratio of Brassica juncea L. under different ambient and supraoptimal temperatures and O3 concentrations at 7 and 14 DAE. Data are plotted as mean ± SD (n = 5). Different letters indicate significant differences among treatments at p < 0.05 according to Tukey’s honestly significant difference test. C: ambient O3 + optimal temperature; T: ambient O3 + supraoptimal temperature; O: elevated O3 + optimal temperature; OT: elevated O3 + supraoptimal temperature; DAE: days after the beginning of exposure.
Chl a/b ratio was significantly reduced under OT conditions compared with that under C conditions at both 7 (by 25.0%) and 14 (by 25.7%) DAE (Figure 4). Three-way ANOVA showed no significant effect of any factor or interaction on this ratio except for the temperature × sampling date interaction (Table S2).
3.3. Chl a Fluorescence
In the OJIP transient curves of B. juncea, each step showed a different response to various treatments. Overall, the expected degradation of the photosynthetic apparatus in plants grown under O and OT conditions was observed in the OJIP transient curves. Fluorescence at the J-step was significantly reduced under OT conditions compared with that under C conditions at 7 and 14 DAE (by 12% and 23.7%, respectively). Fluorescence at the I-step was also significantly decreased under OT conditions compared with that under C conditions at 14 DAE (by 28.8%). Moreover, relative fluorescence at the P-step was decreased under O and OT conditions (by 25% and 33%, respectively) compared with that under C conditions at 14 DAE (Figure 5B). The values of JIP parameters estimated based on the OJIP transient curves of Chl a fluorescence were significantly different between the test and controls plants, and these values were used to construct the spider plots shown in Figure 6. There were no significant differences among treatments in terms of phenomenological fluxes per excited cross-section (CS) at both 7 and 14 DAE. The maximum quantum yield of PS II (φPO) was significantly decreased, but the quantum yield of energy dissipation (φDO), electron transport flux per RC (ETO/RC), and dissipated energy flux per RC (DIO/RC) were significantly increased under OT conditions compared with that under C conditions at 7 DAE. The absorption flux, trapped energy flux, and electron transport flux per RC under O conditions were significantly increased compared with those under C conditions at 7 DAE. Compared with controls, test plants showed significantly reduced φPO, QA reducing PS II RC/CS, and performance index assessed on an absorption basis (PIABS) but significantly increased φDO, ETO/RC, and DIO/RC under both O and OT conditions at 7 DAE. The estimated initial slope of the fluorescence transient (Mo), relative variable fluorescence at 2 ms (VJ), absorption flux per RC (ABS/RC), and trapped energy flux per RC (ETO/RC) were significantly increased under O conditions compared with those under C conditions at 14 DAE (Figure 6).
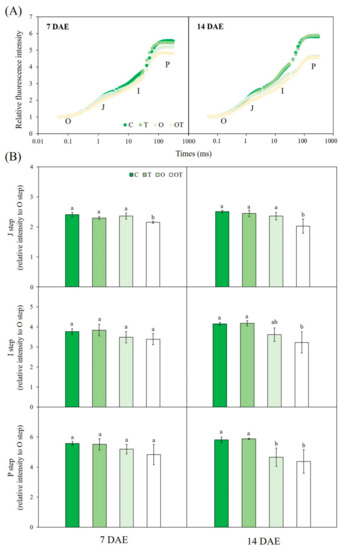
Figure 5.
(A) Chlorophyll a fluorescence OJIP transient curves and (B) J-, I-, and P-steps derived from chlorophyll a fluorescence OJIP transient curves of Brassica juncea L. under different ambient and supraoptimal temperatures and O3 concentrations at 7 and 14 DAE. The J- (intensity at 2 ms), I- (intensity at 30 ms), and P (maximum intensity when all PS II reaction centers (RCs) are closed) steps in the figure indicate fluorescence intensity at these points relative to that at the O-step (when all PS II RCs are open). Data are plotted as mean ± SD (n = 5). Different letters indicate significant differences among treatments at p < 0.05 according to Tukey’s honestly significant difference test. C: ambient O3 + optimal temperature; T: ambient O3 + supraoptimal temperature; O: elevated O3 + optimal temperature; OT: elevated O3 + supraoptimal temperature; DAE: days after the beginning of exposure.
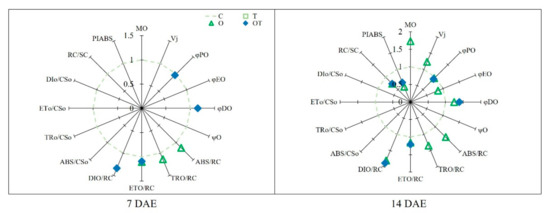
Figure 6.
Spider plots of JIP parameters derived from chlorophyll a fluorescence OJIP transient curves of Brassica juncea L (see Table S1 for definitions) under different ambient and supraoptimal temperatures and O3 concentrations at 7 and 14 DAE. The parameters values of plants grown under control conditions were set to 1. Only parameter values that were significantly different from those under C conditions at p < 0.05 according to Tukey’s honestly significant difference test are shown in the figure. C: ambient O3 + optimal temperature; T: ambient O3 + supraoptimal temperature; O: elevated O3 + optimal temperature; OT: elevated O3 + supraoptimal temperature; DAE: days after the beginning of exposure.
3.4. Stomatal Characteristics
The stomatal appearance differed among plants exposed to supraoptimal temperature, elevated O3 concentration, or a combination of both (Figure 7A). Stomatal density on the abaxial leaf surface in B. juncea was decreased (by 45%) under O conditions compared with that under C conditions. However, there were no significant differences in stomatal density under T, OT, and C conditions (Figure 7B). The stomatal pore area was slightly increased by supraoptimal temperatures, albeit not significantly. The stomatal pore area was significantly decreased under O (by 57.8%) and OT (53.9%) conditions compared with that under C conditions (Figure 7B). Two-way ANOVA showed that individual factors and their interactions significantly affected stomatal density, whereas only ambient and elevated O3 concentration significantly affected stomatal pore area (Table S2).
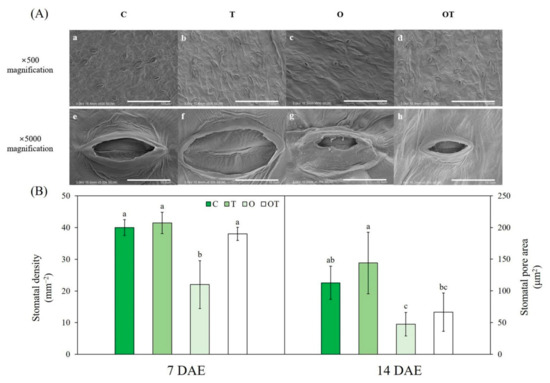
Figure 7.
(A) Field emission scanning electron micrographs (A–H) and (B) stomatal density and stomatal pore area of Brassica juncea L. under different ambient and supraoptimal temperatures and O3 concentrations at 14 DAE. Micrographs under control conditions (A,E); at supraoptimal temperature and ambient O3 (B,F); at optimal temperature and elevated O3 (C,F); and at supraoptimal temperature and elevated O3 (D,H) at 500 and 5000× magnification, respectively. (a–d) Scale bar = 100 μm. (e–h) Scale bar = 10 μm. Data are plotted as mean ± SD (n = 5). Different letters indicate significant differences among treatments at p < 0.05 according to Tukey’s honestly significant difference test. C: ambient O3 + optimal temperature; T: ambient O3 + supraoptimal temperature; O: elevated O3 + optimal temperature; OT: elevated O3 + supraoptimal temperature; DAE: days after the beginning of exposure.
3.5. H2O2 and O2− Accumulation
DAB and NBT staining showed ROS accumulation in B. juncea at 14 DAE (Figure 8A). The DAB-stained area, representing H2O2 accumulation, was significantly increased under O and OT conditions compared with that under C conditions. However, there were no significant differences between C and T conditions at 14 DAE (Figure 8B). In addition, there were no significant differences between O and OT conditions. Following NBT staining at 14 DAE, blue spots indicating O2- accumulation were the most abundant under OT conditions (Figure 8A). NBT staining revealed O2- accumulation in the leaves of plants under O and OT conditions at 14 DAE. Blue spots resulting from a reaction between O2- and NBT were the most abundant in the leaves of plants under OT conditions (Figure 8B). Two-way ANOVA showed that all individual factors, but not their interactions, significantly affected H2O2 accumulation. Moreover, all individual factors and their interactions significantly affected O2- accumulation (Table S2).
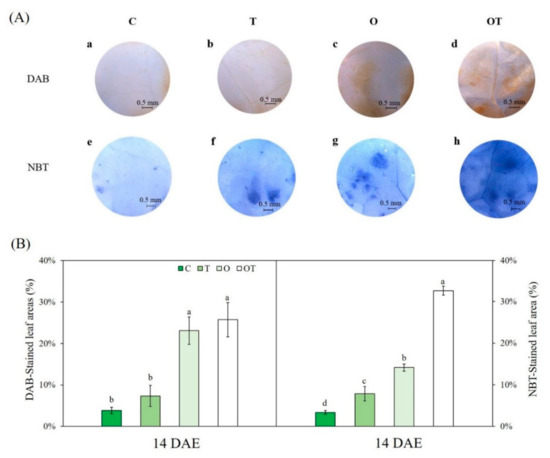
Figure 8.
(A) Hydrogen peroxide (H2O2) and superoxide (O2−) accumulation and (B) percentage of 3,3′-diaminobenzidine (DAB)- and nitroblue tetrazolium (NBT)-stained leaf area of Brassica juncea L. under different ambient and supraoptimal temperatures and O3 concentrations at 14 DAE. (a–d) Histochemical detection of H2O2 in B. juncea leaves by DAB staining. (e–h) Histochemical detection of O2- in B. juncea leaves by NBT staining. H2O2 and O2- accumulation under control conditions (a,e); at supraoptimal temperature and ambient O3 (b,f); at optimal temperature and elevated O3 (c,g); and at supraoptimal temperature and elevated O3 (d,h) at 14 DAE. Scale bars = 0.5 mm. Data are plotted as mean ± SD (n = 5). Different letters indicate significant differences among treatments at p < 0.05 according to Tukey’s honestly significant difference test. C: ambient O3 + optimal temperature; T: ambient O3 + supraoptimal temperature; O: elevated O3 + optimal temperature; OT: elevated O3 + supraoptimal temperature; DAE: days after the beginning of exposure.
3.6. Plant Growth Characteristics
Leaf fresh weight was significantly decreased under T, O, and OT (by 26.5%, 57.3%, and 93.4%, respectively) conditions compared with that under C conditions. Leaf fresh weight under OT conditions was significantly decreased compared with that under O conditions. Conversely, leaf dry weight was not significantly different between OT and O conditions (Figure 9). Leaf dry weight was significantly decreased under T, O, and OT (by 34.7%, 48.3%, and 55.8%, respectively) conditions compared with that under C conditions. Leaf number and area were significantly decreased under O and OT conditions compared with those under C conditions (Figure 9). However, there were no significant differences between O and OT conditions. Two-way ANOVA showed that leaf fresh and dry weight was significantly affected by all individual factors and their interactions, whereas leaf number and area were not affected by any factor or interaction (Table S2).
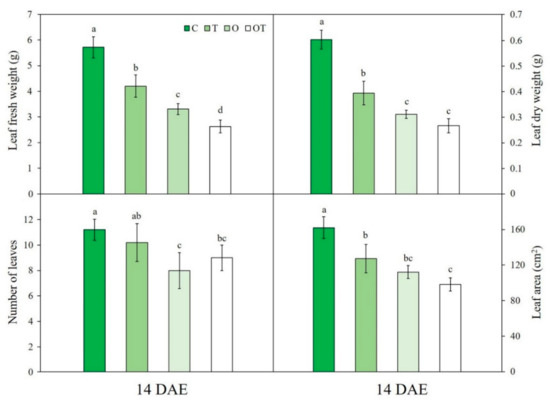
Figure 9.
Leaf fresh weight, dry weight, number, and area of Brassica juncea L. under different ambient and supraoptimal temperatures and O3 concentration at 14 DAE. Data are plotted as mean ± SD (n = 5). Different letters indicate significant differences among treatments at p < 0.05 according to Tukey’s honestly significant difference test. C: ambient O3 + optimal temperature; T: ambient O3 + supraoptimal temperature; O: elevated O3 + optimal temperature; OT: elevated O3 + supraoptimal temperature; DAE: days after the beginning of exposure.
4. Discussion
Given the potential effects of supraoptimal temperature and elevated O3 on plants, the present study explored the impact of these environmental factors on the physiological and stomatal characteristics of B. juncea. We demonstrated that the interactions of supraoptimal temperature and elevated O3 negatively affected leaf mustard rather than the individual factors.
Regarding physiological characteristics, B. juncea leaves showed lower photosynthetic capacity under OT conditions than under other conditions, as indicated by Vcmax, Jmax, and TPU. Measurements of Vcmax and Jmax, which are indicators of biochemical capacity, are typically based on intercellular CO2. Vcmax decreased under O and OT conditions compared with that under C conditions at both 7 and 14 DAE (Figure 2). This result is consistent with previous reports on the effects of O3 on plant physiological characteristics [51,52]. Previous research found a significant reduction in net photosynthesis (Pn) of B. juncea under O and OT conditions compared to C at 7 and 14 DAE. Furthermore, there was also significant difference in Pn between O and OT conditions at 14 DAE [39]. Vcmax indicates the intrinsic photosynthetic capacity as well as RuBisCo activity and kinetics, and Jmax indicates the rate of RuBP regeneration via electron transport [44,53]. Biochemical limitations related to RuBisCo are associated with reduced CO2 assimilation in the presence of elevated O3 [54,55]. In general, O3 reduces the RuBisCo protein content of plants by producing ethylene [56]. O3 stress impairs the photosystems (PSs), thereby generating the energy required to produce NADPH (nicotinamide adenine dinucleotide phosphate) and ATP (adenosine triphosphate) [57]. Photosynthetic capacity is linked to leaf nitrogen (N) content since the majority of leaf N comes from thylakoid proteins and stromal enzymes [58]. O3 can result in lower N content per leaf area, higher investment of N in cell walls, and a reduction of leaf N allocation to photosynthetic processes [59]. However, in the present study, there were no significant differences in Vcmax between C and T conditions at 14 DAE (Figure 2). This result suggests that supraoptimal temperature (5 °C above the optimal) did not affect Vcmax as much as elevated O3 did. The same tendency was observed for Jmax and TPU. Similarly, Thwe et al. [57] have reported a strong correlation between Vcmax and Jmax in tomato under O3 stress. However, some previous studies have reported that a minor limitation to RuBisCo activation is closely related to moderately high temperatures [60,61]. Indeed, in the present study, Jmax and TPU were not significantly affected by supraoptimal temperatures alone (Table S2). Increased Jmax and TPU were observed under T conditions compared with those under C conditions (Figure 2). By shifting the operating range beyond the optimal temperature, short-term supraoptimal temperature of about 5 °C may decrease Pn [62]. In previous study, Pn of B. juncea under elevated temperature was significantly decreased compare to that in optimum temperature at 7 DAE [39]. This form of acclimation, which results in a general up-regulation of leaf N and photosynthetic proteins, is based on the availability of N resources for higher investment in the photosynthetic apparatus [62]. Under sustained high temperatures, most plants can acclimate their photosynthetic traits. Through thermal acclimation, metabolic activities are modified to compensate for temperature changes, resulting in metabolic homeostasis [63]. Three-way ANOVA on the response parameters of A/Ci curves indicated that Rd was significantly affected by supraoptimal temperature. The rates of enzymatic processes involved in Rd are enhanced by high temperatures [64]. An increase in Rd along with a decrease in net photosynthesis reduces carbohydrate availability to plants [65]. In this study, there were no significant differences in these parameters in the presence of elevated O3. Contrary to our results, Calatayud et al. [51] reported increased Rd in a Mediterranean endemic plant exposed to an O3 concentration of 70 ppb. In this study, significant reductions in gm were observed under O conditions at 14 DAE and under OT conditions at both 7 and 14 DAE compared with the values under C conditions (Figure 3). Several studies on soybean, birch, and poplar have reported negative effects of elevated O3 on gm [66,67,68]. As such, gm is affected by O3 conductance through cell wall, intercellular air spaces, and intracellular fluid [69]. Elevated O3 likely reduces gm via mechanisms involving the altered levels, shape, and position of the chloroplasts and thickening of the cell wall [70]. gm is closely correlated with stomatal conductance (gs), since CO2 and H2O are likely to share a common pathway in leaves [71]. In a previous study, a result was that a rapid transient decrease in gs can occur when O3 level was elevated as with gm. The gs of B. juncea under OT condition was found to be significantly lower than that of plants under T condition [39].
Reduced total Chl content is considered an indicator of O3-induced biochemical damage [72]. In this study, total Chl content was decreased under O and OT conditions compared with that under C conditions at 14 DAE. Moreover, total Chl content under OT conditions was lower than that under T and O conditions at 14 DAE (Figure 4). A decrease in the total Chl content of leaves following O3 exposure has been reported previously [73,74]. O3 indirectly affects plant Chl content by accelerating leaf senescence [75]. A decrease in total Chl content generally reduces CO2 assimilation [76], and there is a strong correlation between total Chl content and photosynthetic rate [77].
A significant decrease in the Chl a/b ratio was observed under OT conditions compared with that under C conditions at 7 and 14 DAE (Figure 4). These results regarding the relative O3 sensitivities of Chl a and b are overall contrary to previous reports [78]. There was a positive correlation between the ratio of Chl a to b and the ratio of PS II to light-harvesting chlorophyll a/b protein complex-II (LHCII) level. LHCII is the major light-harvesting complex in plants that exclusively contains Chl b and, accordingly, has a low Chl a/b ratio [79]. Czuba and Ormrod [80] reported that the Chl b content of Lepidium sativum L. was decreased to a greater extent than its Chl a content by O3. However, greater reductions in Chl a content than in Chl b content by O3 have also been reported in other plants [81].
In this study, OJIP transient curves were plotted and compared as indicators of photoinhibition in leaves under all treatments. Photoinhibition decreases the photosynthetic activity by reducing light-induced carbon assimilation [82]. Overall, the slope of OJIP curve significantly decreased from the J- to P-step under OT conditions at 7 and 14 DAE, whereas this decrease was only observed from the I- to P-step at 14 DAE (Figure 5A). These results indicate that the function of PS II RCs was more severely inhibited under OT conditions than under O conditions. Marzuoli et al. [83] reported that elevated O3 levels significantly decreased PS II photochemical efficiency and electron flow in lettuce. O3 induced ROS damage PS II RCs [84]. According to the OJIP transient curves in this study, elevated temperature did not negatively affect PS II RCs. However, φPO was significantly decreased under OT conditions at both 7 and 14 DAE (Figure 6). This result is consistent with previous reports on the effects of elevated O3 [57,85]. The observed φPO reduction may be a result of enhanced non-photochemical processes of PS II light-harvesting antennae, which are related to the suppression of photochemical quenching and photodamage of PS II RCs [86]. In addition, φDO was increased under O and OT conditions at 7 and 14 DAE (Figure 6). The observed increase in φDO (φDO = Fo/Fm) was reflected in the increased value of Fo, which was perhaps due to the inactivation of some PS II RCs [87].
Stomata play a crucial role in determining the O3 influx to leaves, because the majority of the O3 enters the leaf via stomatal pores [88]. Since O3 enters leaves of the plant through stomata, O3 influx are highly dependent on stomatal density and conductance [89]. At 7 DAE, O3 influx of B. juncea under OT condition was significantly higher than plants grown under O condition, as gs significantly increased under OT compared to those in O [39]. Elevated O3-induced oxidative stress also results in ultrastructural changes to mesophyll cells and their cell walls in plants, limiting O3 entering into the leaves [90]. In a previous study, 100 ppb of O3 led to the collapse of some epidermal cells adjacent to the stomata, and 150 ppb of O3 led to the complete collapse of epidermal cells and loss of leaf structural integrity [91]. Consistent with previous reports, we observed a collapse of stomatal shape under O conditions (Figure 7A). Moreover, the stomatal density in leaf mustard under O conditions was significantly lower than that under other conditions at 14 DAE (Figure 7B). Neufeld et al. [92] reported that 100 ppb of O3 tended to reduce stomatal density, suggesting structural changes in plants. Reductions in stomatal width and pore area in the presence of elevated O3 have been confirmed in previous studies [93,94]. The stomatal density of B. juncea was affected by supraoptimal temperatures, elevated O3, and their interaction, while its stomatal pore area was only affected by elevated O3 (Table S2). Some previous studies have reported increased stomatal densities at supraoptimal temperatures [95,96]. Some plant species can develop leaves with different stomatal density in supraoptimal temperature, which can affect gs [97]. gs of B. jnucea under T and OT condition was significantly higher that in the C and O condition at 7 DAE, respectively. However, no significant difference in gs between C and T condition was observed at 14 DAE, which was consistent with the result of stomatal density of B. juncea at 14 DAE [39].
Furthermore, increased H2O2 and O2- accumulation observed under O and OT conditions in this study suggests O3 injury in B. juncea grown under these conditions. The visible injury of O3 (necrosis and chlorosis) was observed on the leaves of plants grown under O and OT at both 7 and 14 DAE (Figure S1). The first O3 injury symptoms on the surface of leaves under OT conditions at 3 DAE and those under O at 5 DAE were reported [39]. A major effect of O3 on plants is ROS generation. ROS production in plant cells is closely related to the O3 flux and oxidative stress tolerance of plants [98,99]. ROS production is a critically harmful process and is also a key component of the abiotic stress responsive signaling networks of plants [100]. In this study, DAB and NBT staining indicated significant H2O2 and O2- accumulation, respectively, as a consequence of elevated O3 (Table S2). These results indicate that long-term exposure to elevated O3 can augment H2O2 and O2- production. Furthermore, our results showed an interactive effect of elevated O3 and supraoptimal temperature on O2- accumulation, but not on H2O2 accumulation, in plant cells. O2- produces a strong effect on carbon assimilation, and it is a vital precursor of other ROS as an unstable radical with a high redox potential [101]. H2O2 can be produced from O2- via Mn-SOD [102].
In this study, we focused on the leaf growth response of B. juncea, because it is one of the most widely consumed leafy vegetables in East Asia. A significant decrease in leaf fresh and dry weight under O and OT conditions was observed (Figure 9). Many studies have indicated that prolonged O3 exposure is typically detrimental to leaf growth and development [103], which is possibly due to O3-induced damage to mesophyll cells upon uptake into the plants [104]. Li et al. [19] reported that the growth of eggplant (Solanum melongena L.) was significantly reduced in the presence of elevated O3. Cell death as well as suppression of photosynthetic and stomatal activity in leaves can decrease the biomass and yield of leafy vegetables [105]. Additionally, leaf area was significantly reduced under O and OT conditions (Figure 9). The suppression of leaf primary metabolism leads to a reduction in leaf area [18].
5. Conclusions
By studying the responses of leaf physiological and stomatal characteristics, we demonstrated that elevated O3 caused more severe damage in leaf mustard (B. juncea) at supraoptimal temperatures than at optimal temperatures. Stomatal density, which is related to O3 influx to leaves, was higher in the presence of elevated O3 at supraoptimal temperatures than that at optimal temperature, indicating detrimental effects of O3 on the physiological, biochemical, and growth characteristics of B. juncea at 14 DAE. In particular, the interactive effects of O3 stress and supraoptimal temperature decreased photosynthetic parameters, including Jmax and TPU. Furthermore, Chl a fluorescence at the J-step of the OJIP transient curves was decreased in the presence of elevated O3 at supraoptimal temperatures. Regarding biochemical characteristics, NBT-stained spots indicating O2- accumulation in plant cells were abundant under OT conditions. As a consequence of physiological and biochemical responses, elevated O3 at supraoptimal temperatures significantly reduced leaf fresh and dry weight. Collectively, these findings indicate the interactions of supraoptimal temperature and elevated O3 worsen the damage to B. juncea rather than the individual factors.
Supplementary Materials
The following are available online at https://www.mdpi.com/article/10.3390/land10040357/s1, Table S1: Formulas and descriptions of OJIP parameters based on data obtained from OJIP transient curves. Table S2: Results of analyses of variance of the main effects of temperature, O3, and sampling date and their interactions on A/Ci curve response, chlorophyll content, chlorophyll a fluorescence, stomatal density, stomatal pore area, hydrogen peroxide and superoxide radical accumulation, and leaf growth parameters. Table S3: Comparison of each parameter under different ambient and supraoptimal temperatures and O3 concentrations at 7 and 14 days after the beginning of exposure (DAE). Figure S1: Visible ozone symptoms of Brassica juncea L. under different optimal and supraoptimal temperatures and O3 concentration at 7 and 14 DAE.
Author Contributions
S.Y.W. as the corresponding author, developed the concept, edited the manuscript, supervised the study, and acquired funding. J.K.L. designed the experiments, analyzed the data, and wrote the manuscript. M.J.K. and J.K.L. developed the analytical methods. H.D.K., S.H.P., Y.J.L., and S.G.J. organized the data input and analysis. M.J.K. and Y.S.C. edited the manuscript. All authors have read and agreed to the published version of the manuscript.
Funding
This work was supported by the Basic Study and Interdisciplinary R&D Foundation Fund of the University of Seoul (2019).
Institutional Review Board Statement
Not applicable.
Informed Consent Statement
Not applicable.
Data Availability Statement
Not applicable.
Conflicts of Interest
The authors declare no conflict of interest.
References
- Tai, A.P.K.; Martin, M.V.; Heald, C.L. Threat to future global food security from climate change and ozone air pollution. Nat. Clim. Chang. 2014, 4, 817–821. [Google Scholar] [CrossRef]
- Battisti, D.S.; Naylor, R.L. Historical warnings of future food insecurity with unprecedented seasonal heat. Science 2009, 323, 240–244. [Google Scholar] [CrossRef]
- Pachauri, R.K.; Allen, M.R.; Barros, V.R.; Broome, J.; Cramer, W.; Christ, R.; Church, J.A.; Clarke, L.; Dahe, Q.; Dasgupta, P. Climate Change 2014: Synthesis Report. Contribution of Working Groups I, II and III to the Fifth Assessment Report of the Intergovernmental Panel on Climate Change; IPCC: Geneva, Switzerland, 2014. [Google Scholar]
- Ainsworth, E.A. Rice production in a changing climate: A meta-analysis of responses to elevated carbon dioxide and elevated ozone concentration. Glob. Chang. Biol. 2008, 14, 1642–1650. [Google Scholar] [CrossRef]
- Bita, C.E.; Gerats, T. Plant tolerance to high temperature in a changing environment: Scientific fundamentals and production of heat stress-tolerant crops. Front. Plant Sci. 2013, 4, 273. [Google Scholar] [CrossRef]
- Zhao, C.; Liu, B.; Piao, S.; Wang, X.; Lobell, D.B.; Huang, Y.; Huang, M.; Yao, Y.; Bassu, S.; Ciais, P.; et al. Temperature increase reduces global yields of major crops in four independent estimates. Proc. Natl. Acad. Sci. USA 2017, 114, 9326–9331. [Google Scholar] [CrossRef] [PubMed]
- DaMatta, F.M.; Grandis, A.; Arenque, B.C.; Buckeridge, M.S. Impacts of climate changes on crop physiology and food quality. Food Res. Int. 2010, 43, 1814–1823. [Google Scholar] [CrossRef]
- Dusenge, M.E.; Duarte, A.G.; Way, D.A. Plant carbon metabolism and climate change: Elevated CO2 and temperature impacts on photosynthesis, photorespiration and respiration. New Phytol. 2019, 221, 32–49. [Google Scholar] [CrossRef]
- Fahad, S.; Bajwa, A.A.; Nazir, U.; Anjum, S.A.; Farooq, A.; Zohaib, A.; Sadia, S.; Nasim, W.; Adkins, S.; Saud, S.; et al. Crop production under drought and heat stress: Plant responses and management options. Front. Plant Sci. 2017, 8, 1147. [Google Scholar] [CrossRef]
- Lawson, T.; Matthews, J. Guard Cell Metabolism and Stomatal Function. Annu. Rev. Plant Biol. 2020, 71, 273–302. [Google Scholar] [CrossRef] [PubMed]
- Schlesinger, W.H.; Jasechko, S. Transpiration in the global water cycle. Agric. For. Meteorol. 2014, 189–190, 115–117. [Google Scholar] [CrossRef]
- Urban, J.; Ingwers, M.W.; McGuire, M.A.; Teskey, R.O. Increase in leaf temperature opens stomata and decouples net photosynthesis from stomatal conductance in Pinus taeda and Populus deltoides x nigra. J. Exp. Bot. 2017, 68, 1757–1767. [Google Scholar] [CrossRef] [PubMed]
- Zhang, H.; Pan, C.; Gu, S.; Ma, Q.; Zhang, Y.; Li, X.; Shi, K. Stomatal movements are involved in elevated CO2 -mitigated high temperature stress in tomato. Physiol. Plant. 2019, 165, 569–583. [Google Scholar] [CrossRef]
- Drake, J.E.; Tjoelker, M.G.; Vårhammar, A.; Medlyn, B.E.; Reich, P.B.; Leigh, A.; Pfautsch, S.; Blackman, C.J.; López, R.; Aspinwall, M.J.; et al. Trees tolerate an extreme heatwave via sustained transpirational cooling and increased leaf thermal tolerance. Glob. Chang. Biol. 2018, 24, 2390–2402. [Google Scholar] [CrossRef] [PubMed]
- Duursma, R.A.; Blackman, C.J.; Lopéz, R.; Martin-StPaul, N.K.; Cochard, H.; Medlyn, B.E. On the minimum leaf conductance: Its role in models of plant water use, and ecological and environmental controls. New Phytol. 2019, 221, 693–705. [Google Scholar] [CrossRef] [PubMed]
- Atkin, O.K.; Tjoelker, M.G. Thermal acclimation and the dynamic response of plant respiration to temperature. Trends Plant Sci. 2003, 8, 343–351. [Google Scholar] [CrossRef]
- Fuhrer, J.; Val Martin, M.; Mills, G.; Heald, C.L.; Harmens, H.; Hayes, F.; Sharps, K.; Bender, J.; Ashmore, M.R. Current and future ozone risks to global terrestrial biodiversity and ecosystem processes. Ecol. Evol. 2016, 6, 8785–8799. [Google Scholar] [CrossRef] [PubMed]
- Ainsworth, E.A.; Yendrek, C.R.; Sitch, S.; Collins, W.J.; Emberson, L.D. The effects of tropospheric ozone on net primary productivity and implications for climate change. Annu. Rev. Plant Biol. 2012, 63, 637–661. [Google Scholar] [CrossRef] [PubMed]
- Li, Y.; Woo, S.Y.; Lee, J.K.; Kwak, M.J.; Khaine, I.; Jang, J.H.; Kim, H.N.; Kim, J.E.; Park, S.H.; Kim, H.D.; et al. Effects of elevated ozone on physiological, biochemical and morphological characteristics of eggplant. Hortic. Environ. Biotechnol. 2019, 60, 809–820. [Google Scholar] [CrossRef]
- Sarkar, A.; Rakwal, R.; Agrawal, S.B.; Shibato, J.; Ogawa, Y.; Yoshida, Y.; Kumar Agrawal, G.; Agrawal, M. Investigating the impact of elevated levels of ozone on tropical wheat using integrated phenotypical, physiological, biochemical, and proteomics approaches. J. Proteome Res. 2010, 9, 4565–4584. [Google Scholar] [CrossRef]
- Ainsworth, E.A. Understanding and improving global crop response to ozone pollution. Plant J. 2017, 90, 886–897. [Google Scholar] [CrossRef] [PubMed]
- Paoletti, E.; Grulke, N.E. Does living in elevated CO2 ameliorate tree response to ozone? A review on stomatal responses. Environ. Pollut. 2005, 137, 483–493. [Google Scholar] [CrossRef] [PubMed]
- Schauberger, B.; Rolinski, S.; Schaphoff, S.; Müller, C. Global historical soybean and wheat yield loss estimates from ozone pollution considering water and temperature as modifying effects. Agric. For. Meteorol. 2019, 265, 1–15. [Google Scholar] [CrossRef]
- Hoshika, Y.; De Carlo, A.; Baraldi, R.; Neri, L.; Carrari, E.; Agathokleous, E.; Zhang, L.; Fares, S.; Paoletti, E. Ozone-induced impairment of night-time stomatal closure in O3-sensitive poplar clone is affected by nitrogen but not by phosphorus enrichment. Sci. Total Environ. 2019, 692, 713–722. [Google Scholar] [CrossRef] [PubMed]
- McAinsh, M.R.; Evans, N.H.; Montgomery, L.T.; North, K.A. Calcium signalling in stomatal responses to pollutants. New Phytol. 2002, 153, 441–447. [Google Scholar] [CrossRef]
- Hoshika, Y.; Carriero, G.; Feng, Z.; Zhang, Y.; Paoletti, E. Determinants of stomatal sluggishness in ozone-exposed deciduous tree species. Sci. Total Environ. 2014, 481, 453–458. [Google Scholar] [CrossRef] [PubMed]
- Wilkinson, S.; Davies, W.J. Drought, ozone, ABA and ethylene: New insights from cell to plant to community. Plant Cell Environ. 2010, 33, 510–525. [Google Scholar] [CrossRef]
- Frenck, G.; van der Linden, L.; Mikkelsen, T.N.; Brix, H.; Jørgensen, R.B. Increased [CO2] does not compensate for negative effects on yield caused by higher temperature and [O3] in Brassica napus L. Eur. J. Agron. 2011, 35, 127–134. [Google Scholar] [CrossRef]
- Steiner, A.L.; Davis, A.J.; Sillman, S.; Owen, R.C.; Michalak, A.M.; Fiore, A.M. Observed suppression of ozone formation at extremely high temperatures due to chemical and biophysical feedbacks. Proc. Natl. Acad. Sci. USA 2010, 107, 19685–19690. [Google Scholar] [CrossRef] [PubMed]
- Vukovich, F.M.; Sherwell, J. An examination of the relationship between certain meteorological parameters and surface ozone variations in the Baltimore-Washington corridor. Atmos. Environ. 2003, 37, 971–981. [Google Scholar] [CrossRef]
- Qaderi, M.M.; Reid, D.M. Growth and physiological responses of canola (Brassica napus) to UV-B and CO2 under controlled environment conditions. Physiol. Plant. 2005, 125, 247–259. [Google Scholar] [CrossRef]
- Yadav, D.S.; Mishra, A.K.; Rai, R.; Chaudhary, N.; Mukherjee, A.; Agrawal, S.B.; Agrawal, M. Responses of an old and a modern Indian wheat cultivar to future O3 level: Physiological, yield and grain quality parameters. Environ. Pollut. 2020, 259, 113939. [Google Scholar] [CrossRef]
- Farrell, K.T. Spices, Condiments, and Seasonings, 2nd ed.; Springer Science & Business Media: Berlin/Heidelberg, Germany, 1999; pp. 138–140. [Google Scholar]
- Black, V.J.; Stewart, C.A.; Roberts, J.A.; Black, C.R. Timing of exposure to ozone affects reproductive sensitivity and compensatory ability in Brassica campestris. Environ. Exp. Bot. 2012, 75, 225–234. [Google Scholar] [CrossRef]
- Bosac, C.; Robert, J.A.; Black, V.J.; Black, C.R. Impact of O3 and SO 2 on reproductive development in oilseed rape (Brassica napus L.). New Phytol. 1994, 126, 71–79. [Google Scholar] [CrossRef]
- Singh, S.; Agrawal, S.B. Use of ethylene diurea (EDU) in assessing the impact of ozone on growth and productivity of five cultivars of Indian wheat (Triticum aestivum L.). Environ. Monit. Assess. 2009, 159, 125–141. [Google Scholar] [CrossRef]
- Singh, P.; Agrawal, M.; Agrawal, S.B. Evaluation of physiological, growth and yield responses of a tropical oil crop (Brassica campestris L. var. Kranti) under ambient ozone pollution at varying NPK levels. Environ. Pollut. 2009, 157, 871–880. [Google Scholar] [CrossRef] [PubMed]
- Singh, S.; Bhatia, A.; Tomer, R.; Kumar, V.; Singh, B.; Singh, S.D. Synergistic action of tropospheric ozone and carbon dioxide on yield and nutritional quality of Indian mustard (Brassica juncea (L.) Czern.). Environ. Monit. Assess. 2013, 185, 6517–6529. [Google Scholar] [CrossRef] [PubMed]
- Lee, J.K.; Woo, S.Y.; Kwak, M.J.; Park, S.H.; Kim, H.D.; Lim, Y.J.; Park, J.H.; Lee, K.A. Effects of elevated temperature and ozone in Brassica juncea L.: Growth, physiology, and ROS accumulation. Forests 2020, 11, 68. [Google Scholar] [CrossRef]
- National Institute of Environmental Research. Annual Report of Air Quality in Korea 2016; National Institute of Environmental Research: Incheon, Korea, 2017.
- Hatfield, J.L.; Prueger, J.H. Temperature extremes: Effect on plant growth and development. Weather Clim. Extrem. 2015, 10, 4–10. [Google Scholar] [CrossRef]
- Angadi, S.V.; Cutforth, H.W.; Miller, P.R.; McConkey, B.G.; Entz, M.H.; Brandt, S.A.; Volkmar, K.M. Response of three brassica species to high temperature stress during reproductive growth. Can. J. Plant Sci. 2000, 80, 693–701. [Google Scholar] [CrossRef]
- Qaderi, M.M.; Kurepin, L.V.; Reid, D.M. Growth and physiological responses of canola (Brassica napus) to three components of global climate change: Temperature, carbon dioxide and drought. Physiol. Plant. 2006, 128, 710–721. [Google Scholar] [CrossRef]
- Sharkey, T.D.; Bernacchi, C.J.; Farquhar, G.D.; Singaas, E.L. Fitting photosynthetic carbon dioxide response curves for C3 leaves. Plant. Cell Environ. 2007, 30, 1035–1040. [Google Scholar] [CrossRef] [PubMed]
- Strasser, R.J.; Tsimilli-Michael, M.; Srivastava, A. Analysis of the Chlorophyll a Fluorescence Transient; Springer: Dordrecht, The Netherlands, 2004; pp. 321–362. [Google Scholar]
- Jiang, H.X.; Chen, L.S.; Zheng, J.G.; Han, S.; Tang, N.; Smith, B.R. Aluminum-induced effects on Photosystem II photochemistry in Citrus leaves assessed by the chlorophyll a fluorescence transient. Tree Physiol. 2008, 28, 1863–1871. [Google Scholar] [CrossRef]
- Arnon, D.I. Copper enzymes in isolated chloroplasts. Polyphenoloxidase in Beta vulgaris. Plant Physiol. 1949, 24, 1–15. [Google Scholar] [CrossRef] [PubMed]
- Venketeswaran, S. Studies on the isolation of green pigmented callus tissue of tobacco and its continued maintenance in suspension cultures. Physiol. Plant. 1965, 18, 776–789. [Google Scholar] [CrossRef]
- Hu, X.; Tanaka, A.; Tanaka, R. Simple extraction methods that prevent the artifactual conversion of chlorophyll to chlorophyllide during pigment isolation from leaf samples. Plant Methods 2013, 9, 1–13. [Google Scholar] [CrossRef] [PubMed]
- Xia, X.J.; Wang, Y.J.; Zhou, Y.H.; Tao, Y.; Mao, W.H.; Shi, K.; Asami, T.; Chen, Z.; Yu, J.Q. Reactive oxygen species are involved in brassinosteroid-induced stress tolerance in cucumber. Plant Physiol. 2009, 150, 801–814. [Google Scholar] [CrossRef]
- Calatayud, V.; García-Breijo, F.J.; Cervero, J.; Reig-Armiñana, J.; Sanz, M.J. Physiological, anatomical and biomass partitioning responses to ozone in the Mediterranean endemic plant Lamottea dianae. Ecotoxicol. Environ. Saf. 2011, 74, 1131–1138. [Google Scholar] [CrossRef] [PubMed]
- Gao, F.; Calatayud, V.; García-Breijo, F.; Reig-Armiñana, J.; Feng, Z. Effects of elevated ozone on physiological, anatomical and ultrastructural characteristics of four common urban tree species in China. Ecol. Indic. 2016, 67, 367–379. [Google Scholar] [CrossRef]
- Cho, S.; Ser-Oddamba, B.; Batkhuu, N.-O.; Seok Kim, H. Comparison of water use efficiency and biomass production in 10-year-old Populus sibirica and Ulmus pumila plantations in Lun soum, Mongolia. For. Sci. Technol. 2019, 15, 147–158. [Google Scholar] [CrossRef]
- Pell, E.J.; Eckardt, N.A.; Glick, R.E. Biochemical and molecular basis for impairment of photosynthetic potential. Photosynth. Res. 1994, 39, 453–462. [Google Scholar] [CrossRef] [PubMed]
- Calatayud, V.; Marco, F.; Cerveró, J.; Sánchez-Peña, G.; Sanz, M.J. Contrasting ozone sensitivity in related evergreen and deciduous shrubs. Environ. Pollut. 2010, 158, 3580–3587. [Google Scholar] [CrossRef] [PubMed]
- Glick, R.E.; Schlagnhaufer, C.D.; Arteca, R.N.; Pell, E.J. Ozone-induced ethylene emission accelerates the loss of ribulose-1,5-bisphosphate carboxylase/oxygenase and nuclear-encoded mRNAs in senescing potato leaves. Plant Physiol. 1995, 109, 891–898. [Google Scholar] [CrossRef] [PubMed]
- Thwe, A.A.; Vercambre, G.; Gautier, H.; Gay, F.; Phattaralerphong, J.; Kasemsap, P. Response of photosynthesis and chlorophyll fluorescence to acute ozone stress in tomato (Solanum lycopersicum Mill.). Photosynthetica 2014, 52, 105–116. [Google Scholar] [CrossRef]
- Makino, A.; Osmond, B. Effects of nitrogen nutrition on nitrogen partitioning between chloroplasts and mitochondria in pea and wheat. Plant Physiol. 1991, 96, 355–362. [Google Scholar] [CrossRef] [PubMed]
- Shang, B.; Xu, Y.; Dai, L.; Yuan, X.; Feng, Z. Elevated ozone reduced leaf nitrogen allocation to photosynthesis in poplar. Sci. Total Environ. 2019, 657, 169–178. [Google Scholar] [CrossRef] [PubMed]
- Feller, U.; Crafts-Brandner, S.J.; Salvucci, M.E. Moderately high temperatures inhibit ribulose-1,5-bisphosphate carboxylase/oxygenase (Rubisco) activase-mediated activation of Rubisco. Plant Physiol. 1998, 116, 539–546. [Google Scholar] [CrossRef] [PubMed]
- Ferguson, J.N.; McAusland, L.; Smith, K.E.; Price, A.H.; Wilson, Z.A.; Murchie, E.H. Rapid temperature responses of photosystem II efficiency forecast genotypic variation in rice vegetative heat tolerance. Plant J. 2020. [Google Scholar] [CrossRef] [PubMed]
- Sharwood, R.E.; Crous, K.Y.; Whitney, S.M.; Ellsworth, D.S.; Ghannoum, O. Linking photosynthesis and leaf N allocation under future elevated CO 2 and climate warming in Eucalyptus globulus. J. Exp. Bot. 2017, 68, erw484. [Google Scholar] [CrossRef]
- Yamori, W.; Hikosaka, K.; Way, D.A. Temperature response of photosynthesis in C3, C4, and CAM plants: Temperature acclimation and temperature adaptation. Photosynth. Res. 2014, 119, 101–117. [Google Scholar] [CrossRef]
- Huntingford, C.; Atkin, O.K.; Martinez-De La Torre, A.; Mercado, L.M.; Heskel, M.A.; Harper, A.B.; Bloomfield, K.J.; O’Sullivan, O.S.; Reich, P.B.; Wythers, K.R.; et al. Implications of improved representations of plant respiration in a changing climate. Nat. Commun. 2017, 8, 1–11. [Google Scholar] [CrossRef]
- Booker, F.L.; Burkey, K.O.; Pursley, W.A.; Heagle, A.S. Elevated carbon dioxide and ozone effects on peanut: I. Gas-exchange, biomass, and leaf chemistry. Crop Sci. 2007, 47, 1475–1487. [Google Scholar] [CrossRef]
- Sun, J.; Feng, Z.; Ort, D.R. Impacts of rising tropospheric ozone on photosynthesis and metabolite levels on field grown soybean. Plant Sci. 2014, 226, 147–161. [Google Scholar] [CrossRef]
- Eichelmann, H.; Oja, V.; Rasulov, B.; Padu, E.; Bichele, I.; Pettai, H.; Möls, T.; Kasparova, I.; Vapaavuori, E.; Laisk, A. Photosynthetic parameters of birch (Betula pendula Roth) leaves growing in normal and in CO2- and O3-enriched atmospheres. Plant Cell Environ. 2004, 27, 479–495. [Google Scholar] [CrossRef]
- Xu, Y.; Feng, Z.; Tarvainen, L.; Shang, B.; Dai, L.; Uddling, J. Mesophyll conductance limitation of photosynthesis in poplar under elevated ozone. Sci. Total Environ. 2019, 657, 136–145. [Google Scholar] [CrossRef] [PubMed]
- Flexas, J.; Ribas-Carbó, M.; Diaz-Espejo, A.; Galmés, J.; Medrano, H. Mesophyll conductance to CO2: Current knowledge and future prospects. Plant Cell Environ. 2008, 31, 602–621. [Google Scholar] [CrossRef]
- Paoletti, E.; Contran, N.; Bernasconi, P.; Günthardt-Goerg, M.S.; Vollenweider, P. Structural and physiological responses to ozone in Manna ash (Fraxinus ornus L.) leaves of seedlings and mature trees under controlled and ambient conditions. Sci. Total Environ. 2009, 407, 1631–1643. [Google Scholar] [CrossRef]
- Xiong, D.; Douthe, C.; Flexas, J. Differential coordination of stomatal conductance, mesophyll conductance, and leaf hydraulic conductance in response to changing light across species. Plant. Cell Environ. 2018, 41, 436–450. [Google Scholar] [CrossRef] [PubMed]
- Rai, R.; Agrawal, M.; Agrawal, S.B. Effects of ambient O3 on wheat during reproductive development: Gas exchange, photosynthetic pigments, chlorophyll fluorescence, and carbohydrates. Photosynthetica 2011, 49, 285–294. [Google Scholar] [CrossRef]
- Welfare, K.; Flowers, T.J.; Taylor, G.; Yeo, A.R. Additive and antagonistic effects of ozone and salinity on the growth, ion contents and gas exchange of five varieties of rice (Oryza sativa L.). Environ. Pollut. 1996, 92, 257–266. [Google Scholar] [CrossRef]
- Agrawal, M.; Krizek, D.T.; Agrawal, S.B.; Kramer, G.F.; Lee, E.H.; Mirecki, R.M.; Rowland, R.A. Influence of Inverse Day/Night Temperature on Ozone Sensitivity and Selected Morphological and Physiological Responses of Cucumber. J. Am. Soc. Hortic. Sci. 1993, 118, 649–654. [Google Scholar] [CrossRef]
- Donnelly, A.; Jones, M.B.; Burke, J.I.; Schnieders, B. Elevated CO2 provides protection from O3 induced photosynthetic damage and chlorophyll loss in flag leaves of spring wheat (Triticum aestivum L., cv. ‘Minaret’). Agric. Ecosyst. Environ. 2000, 80, 159–168. [Google Scholar] [CrossRef]
- Hassan, I.A. Physiological and biochemical response of potato (Solanum tuberosum L. cv. Kara) to O3 and antioxidant chemicals: Possible roles of antioxidant enzymes. Ann. Appl. Biol. 2006, 148, 197–206. [Google Scholar] [CrossRef]
- Pandey, A.K.; Ghosh, A.; Agrawal, M.; Agrawal, S.B. Effect of elevated ozone and varying levels of soil nitrogen in two wheat (Triticum aestivum L.) cultivars: Growth, gas-exchange, antioxidant status, grain yield and quality. Ecotoxicol. Environ. Saf. 2018, 158, 59–68. [Google Scholar] [CrossRef]
- Singh, E.; Rai, R.; Pandey, B.; Agrawal, M. Development of resistance in two wheat cultivars against constant fumigation of ozone. Proc. Natl. Acad. Sci. India Sect. B Biol. Sci. 2018, 88, 1121–1134. [Google Scholar] [CrossRef]
- Atherton, J.; Olascoaga, B.; Alonso, L.; Porcar-Castell, A. Spatial variation of leaf optical properties in a boreal forest is influenced by species and light environment. Front. Plant Sci. 2017, 8, 309. [Google Scholar] [CrossRef] [PubMed]
- Czuba, M.; Ormrod, D.P. Effects of cadmium and zinc on ozone-induced phytotoxicity in cress and lettuce. Can. J. Bot. 1974, 52, 645–649. [Google Scholar] [CrossRef]
- Pellegrini, E.; Nali, C.; Lorenzini, G. Ecophysiology of Tilia Americana under ozone fumigation. Atmos. Pollut. Res. 2013, 4, 142–146. [Google Scholar] [CrossRef]
- Murata, N.; Takahashi, S.; Nishiyama, Y.; Allakhverdiev, S.I. Photoinhibition of photosystem II under environmental stress. Biochim. Biophys. Acta Bioenerg. 2007, 1767, 414–421. [Google Scholar] [CrossRef] [PubMed]
- Marzuoli, R.; Finco, A.; Chiesa, M.; Gerosa, G. A dose-response relationship for marketable yield reduction of two lettuce (Lactuca sativa L.) cultivars exposed to tropospheric ozone in Southern Europe. Environ. Sci. Pollut. Res. 2017, 24, 26249–26258. [Google Scholar] [CrossRef] [PubMed]
- Maliba, B.G.; Inbaraj, P.M.; Berner, J.M. The use of OJIP fluorescence transients to monitor the effect of elevated ozone on biomass of Canola Plants. Water. Air. Soil Pollut. 2019, 230, 1–12. [Google Scholar] [CrossRef]
- Calatayud, A.; Iglesias, D.J.; Talon, M.; Barreno, E. Effects of long-term ozone exposure on citrus: Chlorophyll a fluorescence and gas exchange. Photosynthetica 2006, 44, 548–554. [Google Scholar] [CrossRef]
- Walter, J.; Nagy, L.; Hein, R.; Rascher, U.; Beierkuhnlein, C.; Willner, E.; Jentsch, A. Do plants remember drought? Hints towards a drought-memory in grasses. Environ. Exp. Bot. 2011, 71, 34–40. [Google Scholar] [CrossRef]
- Kalaji, H.M.; Jajoo, A.; Oukarroum, A.; Brestic, M.; Zivcak, M.; Samborska, I.A.; Cetner, M.D.; Łukasik, I.; Goltsev, V.; Ladle, R.J. Chlorophyll a fluorescence as a tool to monitor physiological status of plants under abiotic stress conditions. Acta Physiol. Plant. 2016, 38, 102. [Google Scholar] [CrossRef]
- Vainonen, J.P.; Kangasjärvi, J. Plant signalling in acute ozone exposure. Plant Cell Environ. 2015, 38, 240–252. [Google Scholar] [CrossRef] [PubMed]
- Shang, B.; Xu, Y.; Peng, J.; Agathokleous, E.; Feng, Z. High nitrogen addition decreases the ozone flux by reducing the maximum stomatal conductance in poplar saplings. Environ. Pollut. 2021, 272, 115979. [Google Scholar] [CrossRef]
- Vollenweider, P.; Ottiger, M.; Günthardt-Goerg, M.S. Validation of leaf ozone symptoms in natural vegetation using microscopical methods. Environ. Pollut. 2003, 124, 101–118. [Google Scholar] [CrossRef]
- Hassan, I.A.; Ashmore, M.R.; Bell, J.N.B. Effects of O3 on the stomatal behaviour of Egyptian varieties of radish (Raphanus sativus L. cv. Baladey) and turnip (Brassica rapa L. cv. Sultani). New Phytol. 1994, 128, 243–249. [Google Scholar] [CrossRef]
- Neufeld, H.S.; Sullins, A.; Sive, B.C.; Lefohn, A.S. Spatial and temporal patterns of ozone at Great Smoky Mountains National Park and implications for plant responses. Atmos. Environ. X 2019, 2, 100023. [Google Scholar] [CrossRef]
- Baek, S.G.; Park, J.H.; Na, C.S.; Lee, B.; Cheng, H.C.; Woo, S.Y. The morphological characteristics of Pterocarpus indicus induced by elevated ozone under well-watered and drought conditions. For. Sci. Technol. 2018, 14, 105–111. [Google Scholar] [CrossRef]
- Frey, B.; Scheidegger, C.; Günthardt-Goerg, M.S.; Matyssek, R. The effects of ozone and nutrient supply on stomatal response in birch (Betula pendula) leaves as determined by digital image-analysis and X-ray microanalysis. New Phytol. 1996, 132, 135–143. [Google Scholar] [CrossRef]
- Wu, G.; Liu, H.; Hua, L.; Luo, Q.; Lin, Y.; He, P.; Feng, S.; Liu, J.; Ye, Q. Differential responses of stomata and photosynthesis to elevated temperature in two co-occurring subtropical forest tree species. Front. Plant Sci. 2018, 9, 467. [Google Scholar] [CrossRef] [PubMed]
- Apple, M.E.; Olszyk, D.M.; Ormrod, D.P.; Lewis, J.; Southworth, D.; Tingey, D.T. Morphology and stomatal function of Douglas fir needles exposed to climate change: Elevated CO2 and temperature. Int. J. Plant Sci. 2000, 161, 127–132. [Google Scholar] [CrossRef] [PubMed]
- Jumrani, K.; Bhatia, V.S.; Pandey, G.P. Impact of elevated temperatures on specific leaf weight, stomatal density, photosynthesis and chlorophyll fluorescence in soybean. Photosynth. Res 2017, 3, 333–350. [Google Scholar] [CrossRef] [PubMed]
- Baek, S.G.; Park, J.H.; Kwak, M.J.; Lee, J.K.; Na, C.S.; Lee, B.; Woo, S.Y. Physiological and biochemical responses of elevated ozone on Pterocarpus indicus under well-watered and drought conditions. For. Sci. Technol. 2018, 14, 153–159. [Google Scholar] [CrossRef]
- Mukherjee, A.; Agrawal, S.B.; Agrawal, M. Responses of tropical tree species to urban air pollutants: ROS/RNS formation and scavenging. Sci. Total Environ. 2020, 710, 136363. [Google Scholar] [CrossRef] [PubMed]
- del Río, L.A. ROS and RNS in plant physiology: An overview. J. Exp. Bot. 2015, 66, 2827–2837. [Google Scholar] [CrossRef] [PubMed]
- Hasanuzzaman, M.; Bhuyan, M.H.M.B.; Parvin, K.; Bhuiyan, T.F.; Anee, T.I.; Nahar, K.; Hossen, M.S.; Zulfiqar, F.; Alam, M.M.; Fujita, M. Regulation of ROS metabolism in plants under environmental stress: A review of recent experimental evidence. Int. J. Mol. Sci. 2020, 21, 8695. [Google Scholar] [CrossRef]
- Huang, S.; Van Aken, O.; Schwarzländer, M.; Belt, K.; Millar, A.H. The roles of mitochondrial reactive oxygen species in cellular signaling and stress response in plants. Plant Physiol. 2016, 171, 1551–1559. [Google Scholar] [CrossRef]
- Han, Y.J.; Gharibeshghi, A.; Mewis, I.; Förster, N.; Beck, W.; Ulrichs, C. Plant responses to ozone: Effects of different ozone exposure durations on plant growth and biochemical quality of Brassica campestris L. ssp. chinensis. Sci. Hortic. (Amst.) 2020, 262, 108921. [Google Scholar] [CrossRef]
- Menéndez, A.I.; Gundel, P.E.; Lores, L.M.; Martínez-Ghersa, M.A. Assessing the impacts of intra-and interspecific competition between Triticum aestivum and Trifolium repens on the species’ responses to ozone. Botany 2017, 95, 923–932. [Google Scholar] [CrossRef]
- Feng, Z.; Hu, E.; Wang, X.; Jiang, L.; Liu, X. Ground-level O3 pollution and its impacts on food crops in China: A review. Environ. Pollut. 2015, 199, 42–48. [Google Scholar] [CrossRef] [PubMed]


Publisher’s Note: MDPI stays neutral with regard to jurisdictional claims in published maps and institutional affiliations. |
© 2021 by the authors. Licensee MDPI, Basel, Switzerland. This article is an open access article distributed under the terms and conditions of the Creative Commons Attribution (CC BY) license (http://creativecommons.org/licenses/by/4.0/).