Article

A Regional GIS-Assisted Multi-Criteria Evaluation of Site-Suitability for the Development of Solar Farms

by
Jesús A. Prieto-Amparán
1,
Alfredo Pinedo-Alvarez
2,
Carlos R. Morales-Nieto
2,
María C. Valles-Aragón
1,
Alan Álvarez-Holguín
3 and
Federico Villarreal-Guerrero
2,*
1
Facultad de Ciencias Agrotecnológicas, Universidad Autónoma de Chihuahua, Ave. Pascual Orozco s/n, Campus 1, Chihuahua, Chihuahua 31350, Mexico
2
Facultad de Zootecnia y Ecología, Universidad Autónoma de Chihuahua, Periférico Francisco R. Almada km 1, Chihuahua, Chihuahua 31453, Mexico
3
Instituto Nacional de Investigaciones Forestales, Agrícolas y Pecuarias (INIFAP), Campo Experimental La Campana, km 33.3 Carretera Chihuahua-Ojinaga, Aldama, Chihuahua 32910, Mexico
*
Author to whom correspondence should be addressed.
Land 2021, 10(2), 217; https://doi.org/10.3390/land10020217
Submission received: 13 January 2021 / Revised: 16 February 2021 / Accepted: 18 February 2021 / Published: 21 February 2021

Abstract

:
One of the fastest-growing renewable energy sources is solar energy. A strategic step for a well-performing solar project is site identification. The evaluation of site-suitability is a complex task, where multiple qualitative and quantitative criteria, inherent to the territory, are involved. In this study, a GIS-based multi-criteria decision-making (MCDM) methodology for site-suitability evaluation in the development of solar farms (DSF) is presented. Two scenarios, the ranking method (RM) and the Analytical Hierarchy Process (AHP), each representing a different weighting approach, were tested. A case study was performed for the Desert of Chihuahua, Mexico, a region with the potential to provide a significant portion of the country’s energy demand. The RM was more stringent and identified less area with high suitability (1237 km2) compared to the AHP (4983 km2). Given its flexibility in assigning weights, the AHP is considered to have greater potential in identifying site-suitability levels. The final suitability maps of the AHP showed the northern part of the study region to have high suitability for the DSF. Thus, sites in this area could be used for the construction of solar energy projects in the future. This methodology provides a useful tool for land-use planning based on its suitability level.

1. Introduction

Per capita energy consumption is one of the main indices for assessing the development of societies [1] due to the key role energy plays in economic activities. Currently, the world economy is highly dependent on fossil energy sources such as coal, oil, and natural gas [2]; however, natural reserves of fossil fuels are limited and expected to be exhausted in the next century if consumption continues at the current rate [3]. Moreover, the burning of fossil fuels adds pollution to the environment [4,5]. The widespread use of fossil energy resources has led to the degradation of natural resources, lowering the quality of the ecosystem services they provide [6,7].
The worldwide energy demand has increased so rapidly that, by 2050, anthropogenic energy use may double or even triple. The global demand for electricity and heat is now a major concern and this challenge is being tackled by developing safe and sustainable energy conversion systems [8]. Increasing energy production from renewable sources can contribute to several of the Sustainable Development Goals of the Agenda 2030, adopted by world leaders in 2015 at a historic UN Summit [9]. Thus, it is essential to promote massive energy resource projects that are environmentally friendly, renewable, and sustainable [10].
Due to rapid technological development, many forms of renewable energy have become economically available [11]. Expanding the use of renewable energy can potentially lead to energy security and reduce the effects of climate change while obtaining economic benefits [2]. One such source of energy is solar radiation, which is clean, renewable, and safely convertible to other forms of energy without emitting pollutants into the air [12]. The most widely used applications of solar radiation are thermal and photovoltaic (PV) processes [13]. Specifically, PV energy is one of the best options to sustainably supply the future global energy demand [14].
Solar farms based on PV technology have promising potential for deployment over vast land areas where the amount of solar radiation per year is high. Hence, the regional identification of ideal sites for large-scale solar farms is of great importance [15]. However, the criteria influencing the development of solar farms (DSF) in a region are spatially variable and that should be taken into account. Thus, conducting a comprehensive analysis to evaluate site-suitability for the DSF, where multiple quantitative and qualitative criteria are evaluated, is a strategic stage to ensure a profitable and well-performing solar project [16].
In the last decade, several studies have been conducted on site selection for the installation of solar farms [16,17]. For that, Geographic Information Systems (GIS) have been widely used. To simultaneously evaluate qualitative and quantitative spatial criteria, multi-criteria decision-making (MCDM) methods have often been integrated with GIS. The methodologies of MCDM have received attention for GIS-based decision-making [18,19] due to their usefulness in solving questions requiring a big set of variables covering large, sometimes inaccessible, territories. In this context, GIS-MCDM methods have been used for land-use decision-making [20,21].
Pohekar and Ramachandran [22] conducted a review on GIS-MCDM methods and concluded that the Analytical Hierarchy Process (AHP) was the most widely used in sustainable energy location studies. The AHP was first presented by Saaty [23] as a method of pair-wise criteria comparison, where a specific weight of relative importance is assigned to each considered criterion. The AHP offers the opportunity of integrating the points of view of experts and decision-makers in pair-wise comparisons, which can be then represented in a GIS environment to achieve specific objectives [24]. In addition, the simulation of scenarios under MCDM can be used to develop supportive decision-making processes based on hypotheses of interest [25].
Mexico is located in what is called the “solar belt”, receiving above 5 kWh m−2 day−1 of solar radiation [26]. In addition, Mexico has enacted the General Law of Climate Change, which plans to have 35% of the energy generated from renewable sources by 2024 [26,27]. Thus, solar energy has great potential to contribute to fulfilling such a law and could be the source of a significant portion of the country’s energy needs [28]. However, solar energy only contributes to 0.12% of the energy produced nationwide [29], despite it showing the highest growth rates in recent years. According to Aleman-Nava et al. [26], some of the issues preventing the integration of solar energy, and renewable energies in general in Mexico, include the lack of effective strategies (including evaluation of feasibility), incentives (e.g., energy bank, a preferential rate of energy transmissions, net metering), and policies leading the promotion of renewable energies.
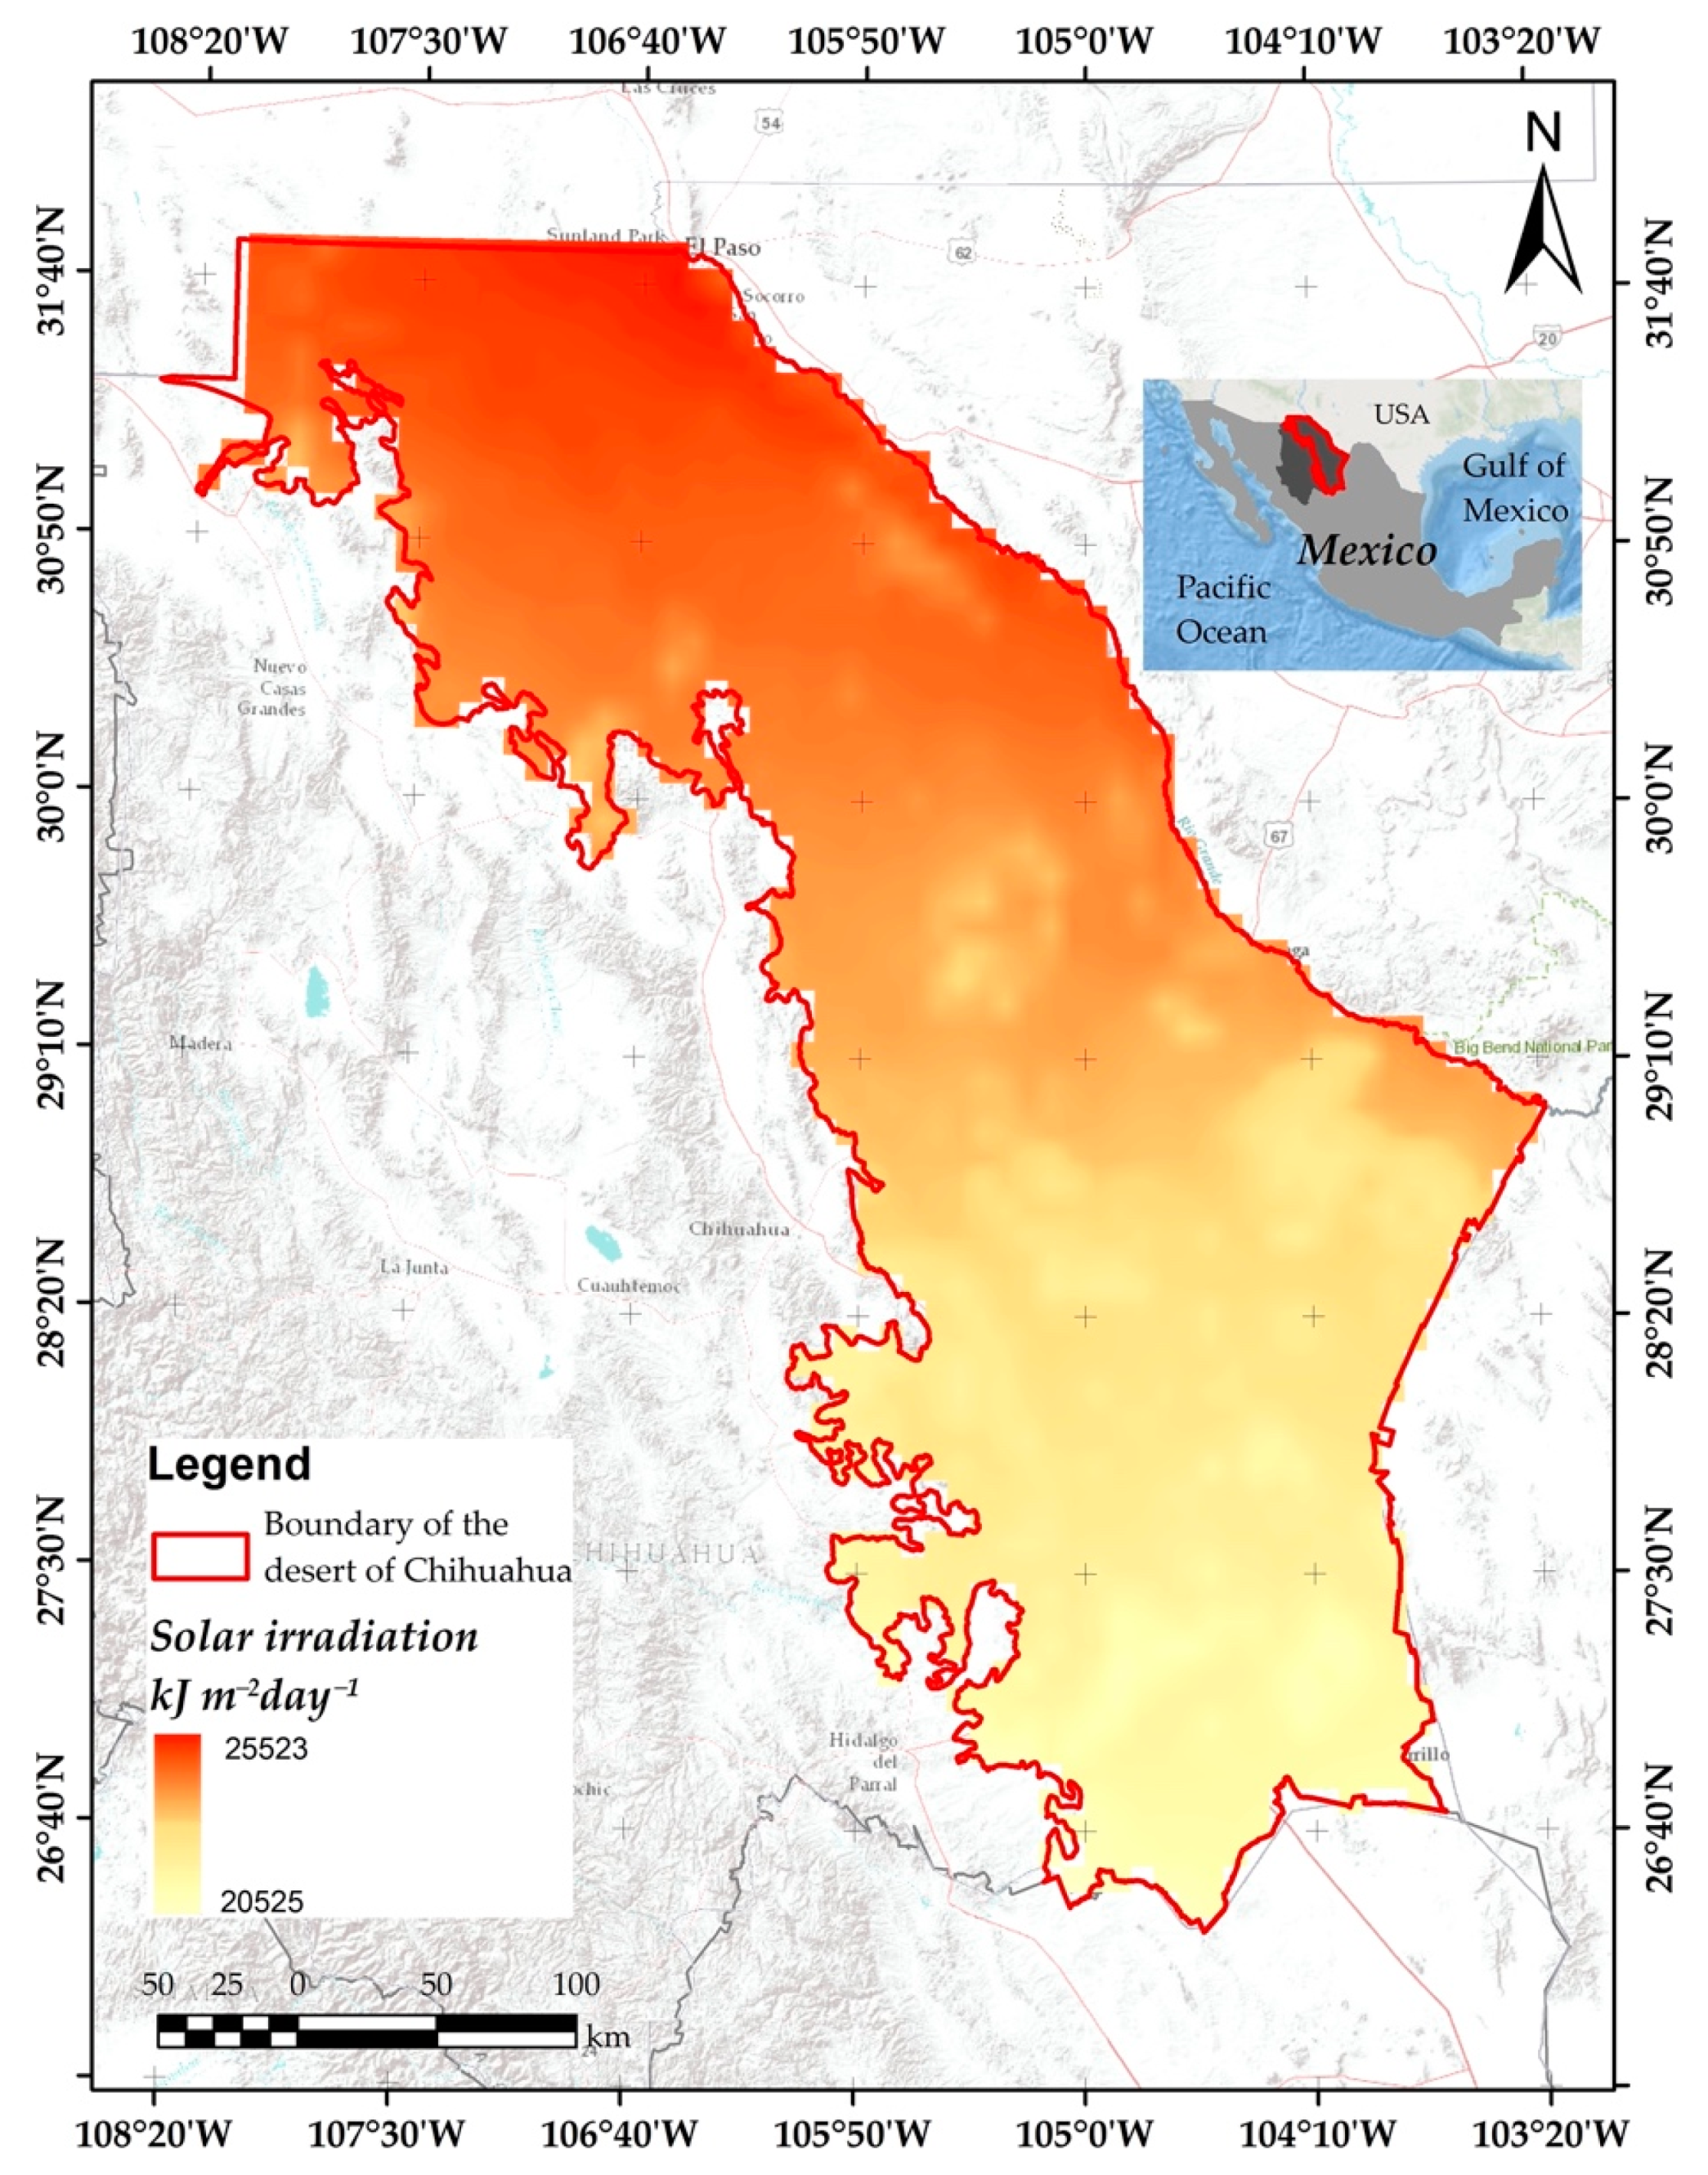
Regarding solar energy potential, the state of Chihuahua has one of the highest within Mexico, receiving average solar radiation ranging from 4 to 6 kWh m−2 day−1 [30]. In addition, Chihuahua has a large land area with potential for the installation of solar farms based on PV electricity generation. Specifically, the desert of the state has high potential due to its topography composed of moderate slopes and large plains, covered mostly by grasslands and shrublands. That makes this territory attractive to study the suitability of sites for the location of solar farms on a regional scale.
Although the Desert of Chihuahua has the potential to satisfy a significant portion of Mexico’s energy demand by means of solar energy, the studies about site-suitability for the development of solar farms in the area are limited. To the author’s knowledge, no solar farm studies applying GIS-MCDM methods have been conducted in the region. Thus, this study aimed at evaluating site-suitability in the Desert of Chihuahua for the DSF by using two multi-criteria decision-making methodologies integrated with GIS. Discussions about the similarities and differences in the outcomes from the two approaches were stated. In addition, inferences were made on the potential risks assumed when one method is employed over another.

2. Materials and Methods

2.1. Study Area

The study area comprised the portion of the Chihuahuan Desert falling within the boundaries of the state of Chihuahua, Mexico (Figure 1). The boundaries were defined from the map of the Mexican terrestrial ecoregions [31], encompassing an area of ≈112,787 km2, distributed in altitudes ranging from 800 to 1800 m. In this region, a large portion of the annual precipitation (40–50% on average) occurs during the summer season [32,33]. Its vegetation is dominated by grasslands and shrublands and its climate is semi-arid, with an average annual temperature between 12 °C and 18 °C [34].

2.2. Summary of the Framework

Figure 2 summarizes the methodology used to evaluate site-suitability for the DSF in the Desert of Chihuahua, Mexico.

2.3. Rules to Define Restricted Areas

To increase the effectiveness of the decision-making for the DSF, non-suitable sites were defined as restricted areas and they were excluded from the evaluation. Restricted areas, where the implementation of solar farms is not feasible, were masked out in ArcMap 10.5© (ESRI, Redlands, CA, USA; https://www.esri.com/en-us/home; accessed on 20 February 2021). For this, a layer of restrictions, grouping all non-suitable areas, was created (Table 1). The delimitation of the restricted areas was defined based on the literature [14]. Protected areas located in the region and declared by the government were also defined as restricted areas.

2.4. Selection of Criteria

Based on expert knowledge, the literature [41], the objectives of the study, the spatial scale, and the availability of geo-referenced data, 10 criteria related to the suitability of sites for the DSF [42,43], were selected. These criteria, which can be represented in maps, included: (1) land use/land cover, (2) distance from main roads (Euclidean distance), (3) solar radiation, (4) annual mean temperature, (5) vapor pressure, (6) slope, (7) aspect, (8) wind speed, (9) soil texture, and (10) landforms (Table 2). Although the suitability of the territory involves more variables (e.g., potential investors, public utility companies, government agencies, and environmentalists, among others), this study focused only on biophysical ones influencing the site-suitability for the DSF. The inclusion of social and economic criteria in the evaluation was out of the scope of this study.
The maps were obtained from various sources and presented in different formats (vector, raster) and scales. Prior to the analysis, a homogenization consisting of all the maps in a raster format, with a cell size of 100 m, was conducted in the ArcMap 10.5© software (ESRI, Redlands, CA, USA; https://www.esri.com/en-us/home; accessed on 20 February 2021).

2.5. Criteria Standardization

Each criterion was standardized on a scale of 1 to 5, as it has been done in previous studies [46,50]. According to the suitability for the development of solar farms, a value of 1 was assigned to the least suitable range values of each criterion while a value of 5 was assigned to the most suitable ones (Table 3). The assigned suitability levels in this study were: 1 (Very low), 2 (Low), 3 (Moderate), 4 (High), and 5 (Very high). For criteria like solar radiation, annual mean temperature, vapor pressure, slope, and wind speed, which include continuous values, the classification of suitability levels was based on natural breaks [53].

2.6. Multi-Criteria Decision-Making

The evaluation of site-suitability for the development of solar farms is complex. It requires identifying different alternatives and finding the most suitable solution [54]. A methodology widely used to solve complex problems is multi-criteria decision-making (MCDM) [52,55]. There are four main methods for the choice/assignment of weights to selected criteria for the solution of complex problems involving multiple factors [56]:
(a)
Ranking method. This is the simplest method for assessing the importance through weighting, where each considered criterion is ranked in the order of the decision-makers’ preferences. In this method, criteria could be ordered based on their importance; in other words, each criterion is classified in the order preferred by the decision-maker. Such classification could be straight (the most important criterion = 1, the second most important = 2, etc.) or inverse (the least important criterion = 1, the following criterion with less importance = 2, etc.). The classification could also consist of assigning the same importance to all of the criteria (criterion 1 = 1, criterion 2 = 1, criterion n = 1).
(b)
Rating method. This method requires the estimation of weights on the basis of a predetermined scale.
(c)
Analytical Hierarchy Process (AHP). It involves pair-wise comparison to create a matrix of relationships.
(d)
Trade-off analysis methods. Uses direct peer-compensation evaluations of alternatives.
In this study, two scenarios were defined and consisted of assigning weights to the criteria based on two of the aforementioned methods: the ranking method (a) and the AHP (c).

2.6.1. Scenario 1: Ranking Method

A simple method for the assignment of weights is to rank the criteria in the order of the decision-makers’ preference [56]. This scenario consisted of assigning weights of equal value to all the criteria.

2.6.2. Scenario 2: Analytical Hierarchy Process (AHP)

The AHP is one of the most widely used MCDM methods [44,57] to solve different problems with different approaches [17,58]. The AHP is a mathematical approach developed by Saaty in 1977 [23]. This method reduces complex decisions to a series of side-by-side comparisons. In addition, the method allows checking the consistency of the decision, thus reducing bias in decision making [59].
At the beginning of each AHP process, a goal, as well as the alternatives, are defined, and the criteria are selected. A pair-wise comparison matrix (A) is then generated. For instance, Equation (1) represents a comparison matrix when the criteria are three (a, b, and c).
A = [ 1 a b 1 a 1 c 1 b 1 c 1 ]
If n is the number of criteria, then the matrix (A) will be a matrix where each entry aij of the matrix describes the importance of the ith criterion with respect to the jth criterion. The relative importance of the two criteria is measured according to a numerical scale from 1 to 9 (Table 4).
For weighting each criterion, the matrix (A) is standardized by dividing the elements in each column by the sum of the elements in that same column. The rows average in the new matrix defines the required relative weights of the criteria.
Some inconsistencies may arise once a certain number of pairwise comparisons are performed. The AHP includes the consistency ratio (CR), which is a parameter to evaluate the weights’ consistency. To calculate the CR, the consistency index (CI) must be first calculated (Equation (2)):
C I = λ m a x n n 1  
where: λmax denotes the eigenvalue of the pairwise comparison matrix, n is the number of the criteria. In the end, the CR is calculated by dividing the CI by the random consistency index (RI). The RI values for the appropriate n values were reported by Saaty [23] (Table 5). To obtain the value of CR, Equation (3) is used.
C R = C I R I
The value of CR must have a value equal to or lower than 0.10 (CR ≤ 0.10) to avoid inconsistency and to get meaningful results. If CR > 0.10, the pair-wise comparison values need to be adjusted because an inconsistency exists.
For each scenario, the standardization of the criteria was performed with the Reclassify tool while the assignment of weights was done with the Weighted Overlay tool. These tools can be found within the Spatial Analyst module of the ArcMap 10.5© software (ESRI, Redlands, CA, USA; https://www.esri.com/en-us/home; accessed on 20 February 2021).

2.7. Classification and Mapping of Site Suitability for the Development of Solar Farms

The procedure followed to obtain the final map for each scenario can be consulted in the study by Vázquez-Quintero et al. [60]. The categories assigned to the resulting accumulated values were: Very high, High, Moderate, Low, and Very low. The description of such categories can be seen in Table 6. The sites with very high suitability for the DSF include the highest solar radiation, lowest temperature, lowest vapor pressure, lowest slope, lowest wind speed, among others. In contrast, the sites with very low suitability are those with a low solar radiation incidence, high temperatures, high vapor pressure, steep slopes, high wind speed, among others.

3. Results

In this study, a combination of MCDM and GIS has been used to assess the suitability levels of the region comprehending the Desert of Chihuahua for the DSF. Two scenarios were investigated, each one including a different MCDM method. A total of 10 criteria were selected for the evaluation. The first scenario weighted the criteria according to the ranking method while the second scenario performed it under the AHP. Prior to the evaluation, restricted areas were defined and then masked out. The restricted areas were the same under the two scenarios. After that, a final map for each scenario was generated.

3.1. Layer of Restricted Areas

The resulting restricted areas are shown in Figure 3. These areas were considered non-suitable for the DSF. The resulting surface area of the restricted lands was 52,585 km2, which represents 46.62% of the study area. Land uses such as urban areas, natural protected areas, and priority land regions were defined as restricted areas. Lands near water bodies and hydrological streams were also restricted for the development of solar farms.

3.2. Consistency of the Pair-Wise Comparison Matrix

For the AHP scenario, the weights assigned to the criteria can be seen in Table 7. The consistency ratio (CR) was lower than 0.10, which makes the pairwise comparisons acceptable and the values consistent (Table 8). Based on the weighting, solar irradiance is the most important criterion, followed by aspect and landforms (topography), which agrees with previous studies [61,62]. This is reasonable because the presence of steep topography is a limiting factor for site suitability. That significantly increases investment costs for the installation of solar farms. Thus, suitable sites for the development of solar farms should have high solar irradiances and be located in places with no obstruction of solar radiation.
The final weights assigned to the criteria under both, the ranking and the AHP scenarios, can be seen in Table 9.

3.3. Spatial Distribution of Site-Suitability for the Development of Solar Farms

The application of the MCDM method allowed the evaluation of site-suitability for the DSF in the Desert of Chihuahua based on 10 selected criteria. This allowed to spatially represent five levels of suitability, based on two scenarios. The surface areas corresponding to each site suitability level are shown in Table 10. Under the two scenarios, the resulting surface area for the very high suitability level was zero. For the high suitability level, the AHP scenario identified an area of 4983 km2, which is four times bigger than the area identified by the ranking scenario (1237 km2). Regarding the moderate suitability level, the ranking scenario showed the largest area (51,098 km2). The low suitability level showed similar results for both, the AHP and the ranking scenarios, with areas of 8685 km2 and 7867 km2, respectively. In the case of the very low suitability level, the ranking scenario did not identify an area (0 km2) while the AHP scenario allocated an area of only 11 km2. For the two scenarios, the moderate suitability level dominated with 77.28% and 84.88% of the study area for the AHP and the ranking scenarios, respectively.
Under the AHP scenario (Figure 4), the sites with a high suitability level are distributed in an isolated pattern in the center while most of the area corresponding to this level was located in the northern part of the study area. In the northern part, the patches with this suitability level are bigger than in the central part, where large portions of land can be found. In contrast, the area with a moderate suitability level is widely distributed throughout the Desert of Chihuahua. The low suitability level also grouped large areas distributed mainly in the southern zone of the study area.
For the ranking scenario (Figure 5), the areas with high suitability, unlike the AHP scenario, are distributed in a concentrated and isolated pattern in the northern part of the study area. The area with a moderate suitability level is widely distributed in the Desert of Chihuahua. The low suitability area is also widely distributed in the southern and central parts, with some isolated areas in the northern part.

4. Discussion

This study evaluated the suitability of sites for the development of solar farms in the Desert of Chihuahua. For that, an approach synergizing a multi-criteria methodology with GIS was employed. Results provide a spatial configuration of site-suitability, based on five categories (levels), for the DSF. In addition, they could serve decision-makers in choosing where to establish solar farm projects in northern Mexico. This country recently approved and published an updated version of the Transition Strategy to Promote the Use of Cleaner Technologies and Fuels [63]. Thus, this research is aligned with such a strategy and it may contribute to meeting the country’s goal of using cleaner energy technologies.
Many of the advantages of decision-making assisted with MCDM methods and GIS have been reported previously [64,65]. The main criticism about employing combined methodologies to solve a problem, similar to the way addressed in this study, is the uncertainty associated with allocating weights to the criteria due to the strong influence that has on the final results [66]. To overcome such limitation, the consistency ratio—CR was estimated in this study. To test the efficacy of this approach, we also tested a common scenario (ranking), which has been previously employed for political decisions or potential stakeholders [56].
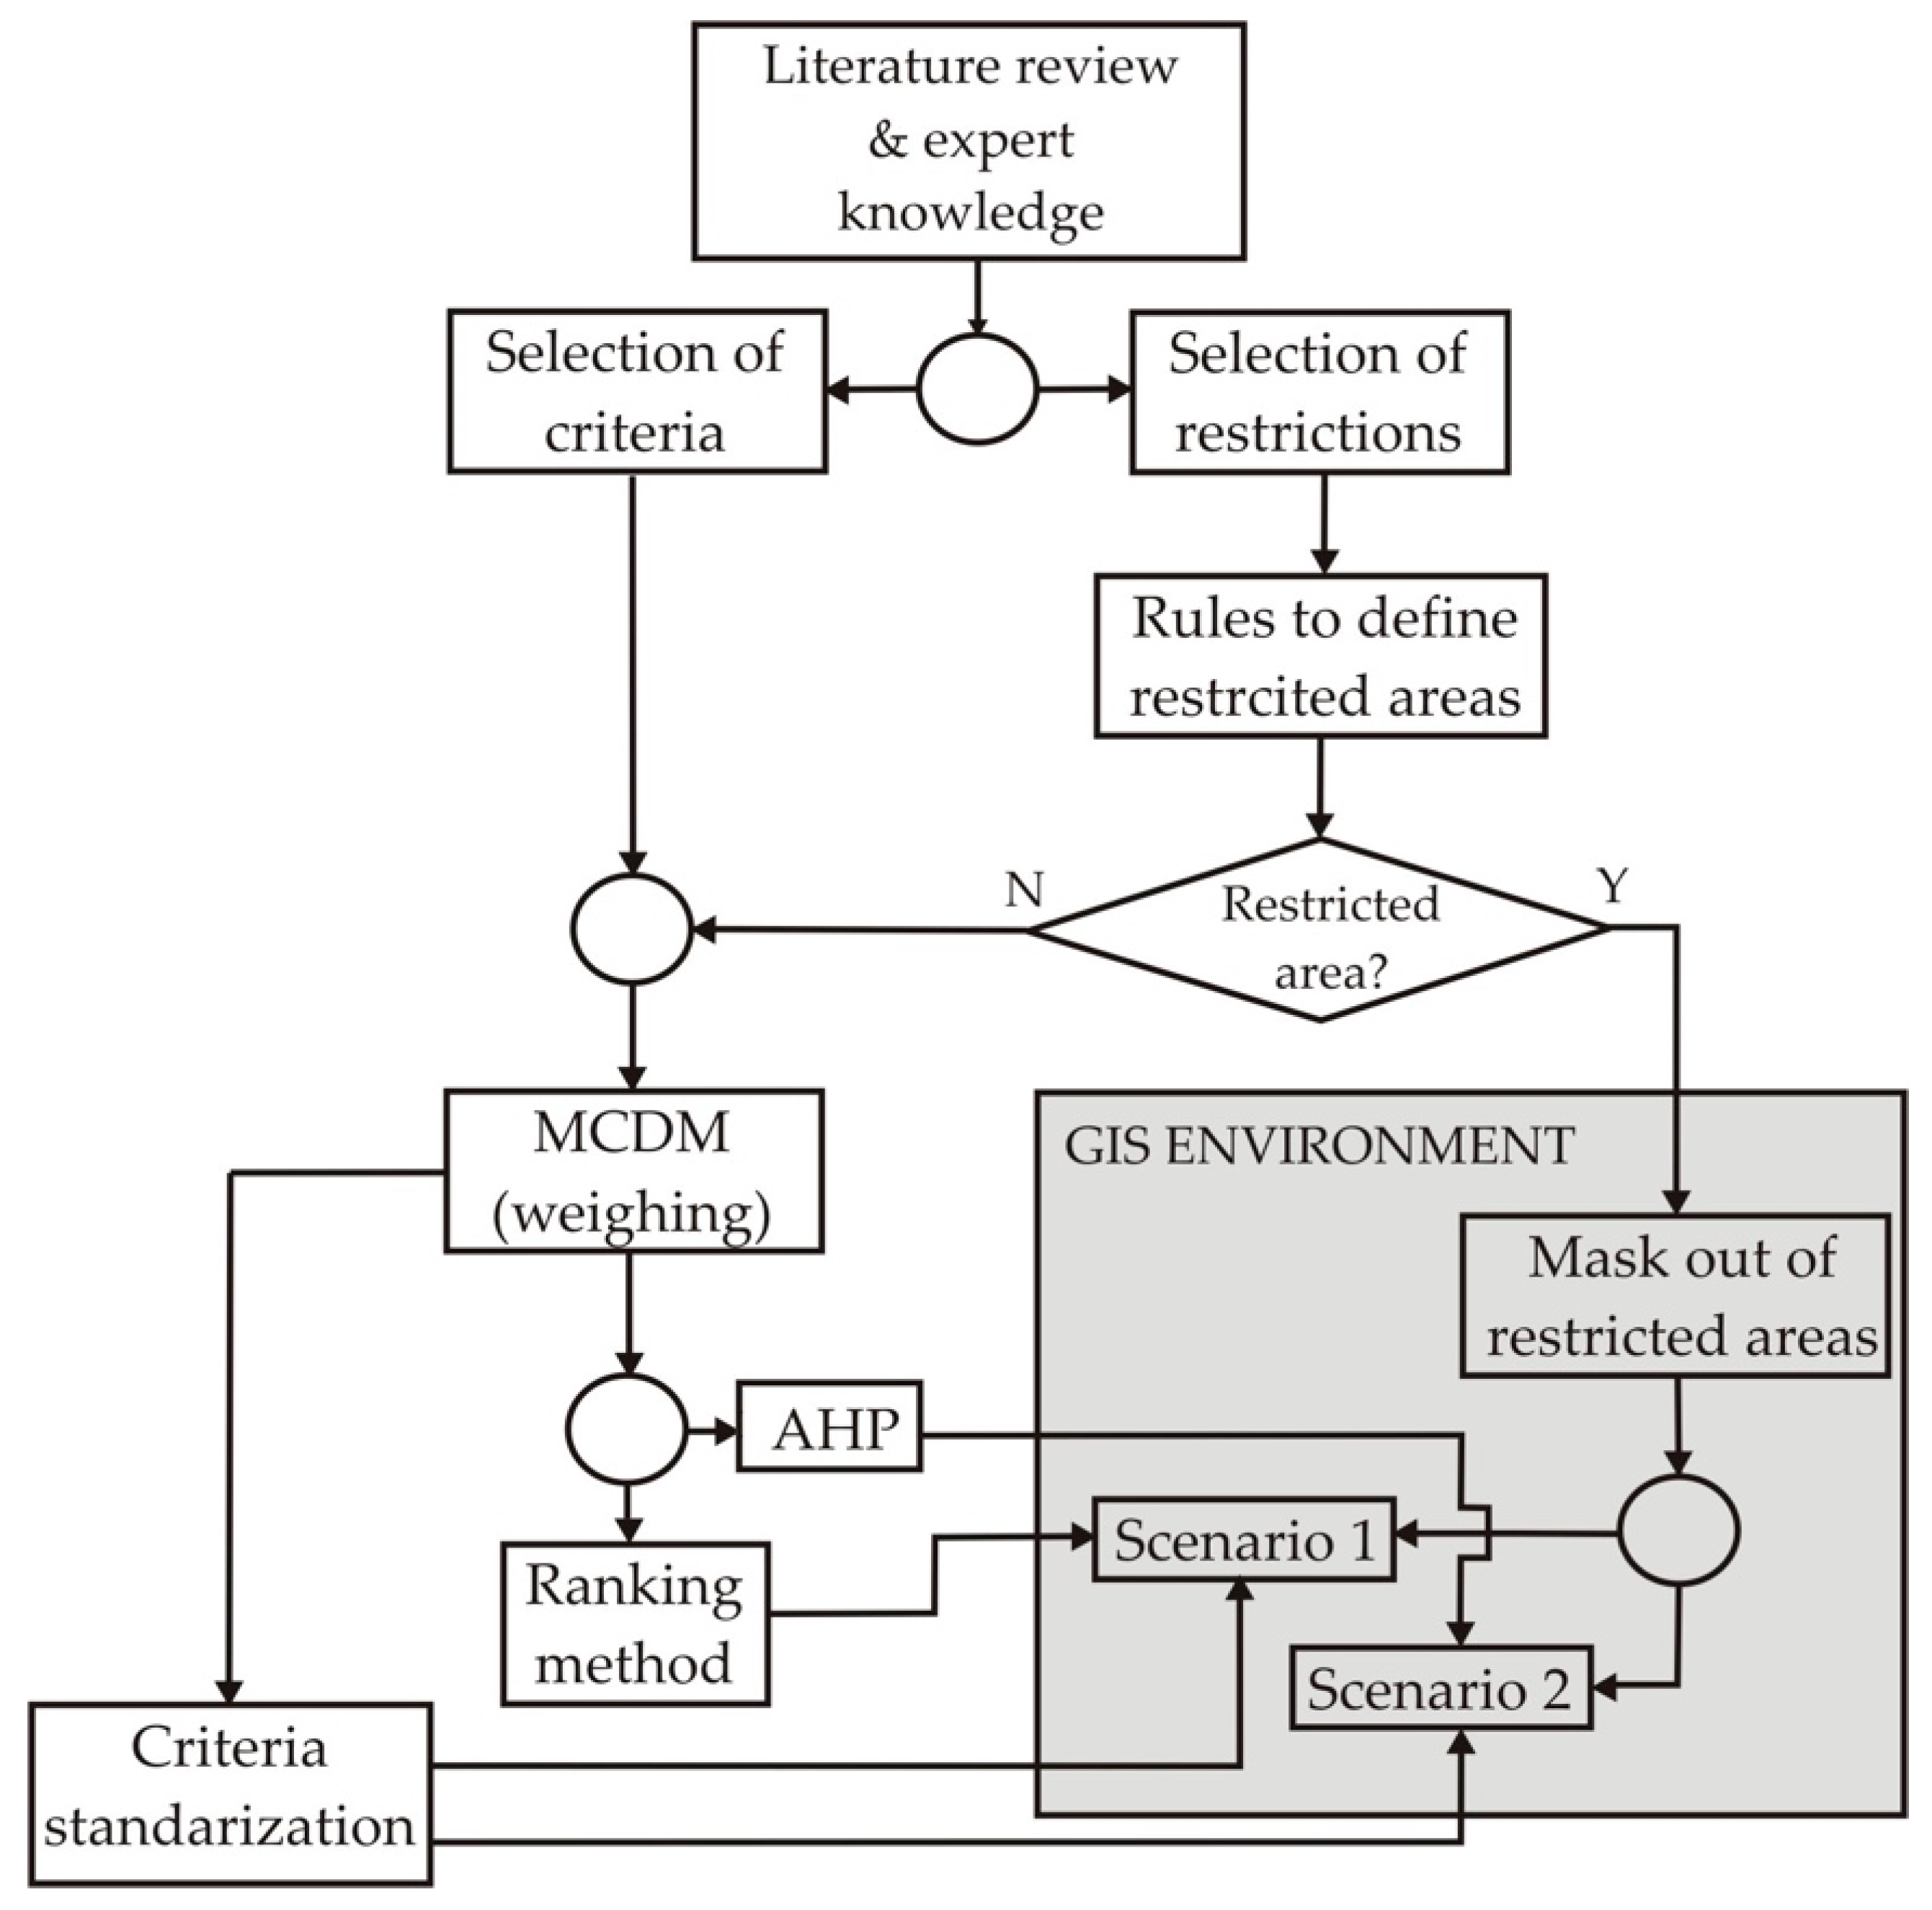
Particularly, MCDM and GIS have been useful in the past for identifying various levels of land-suitability, under different scenarios, for the DSF [67,
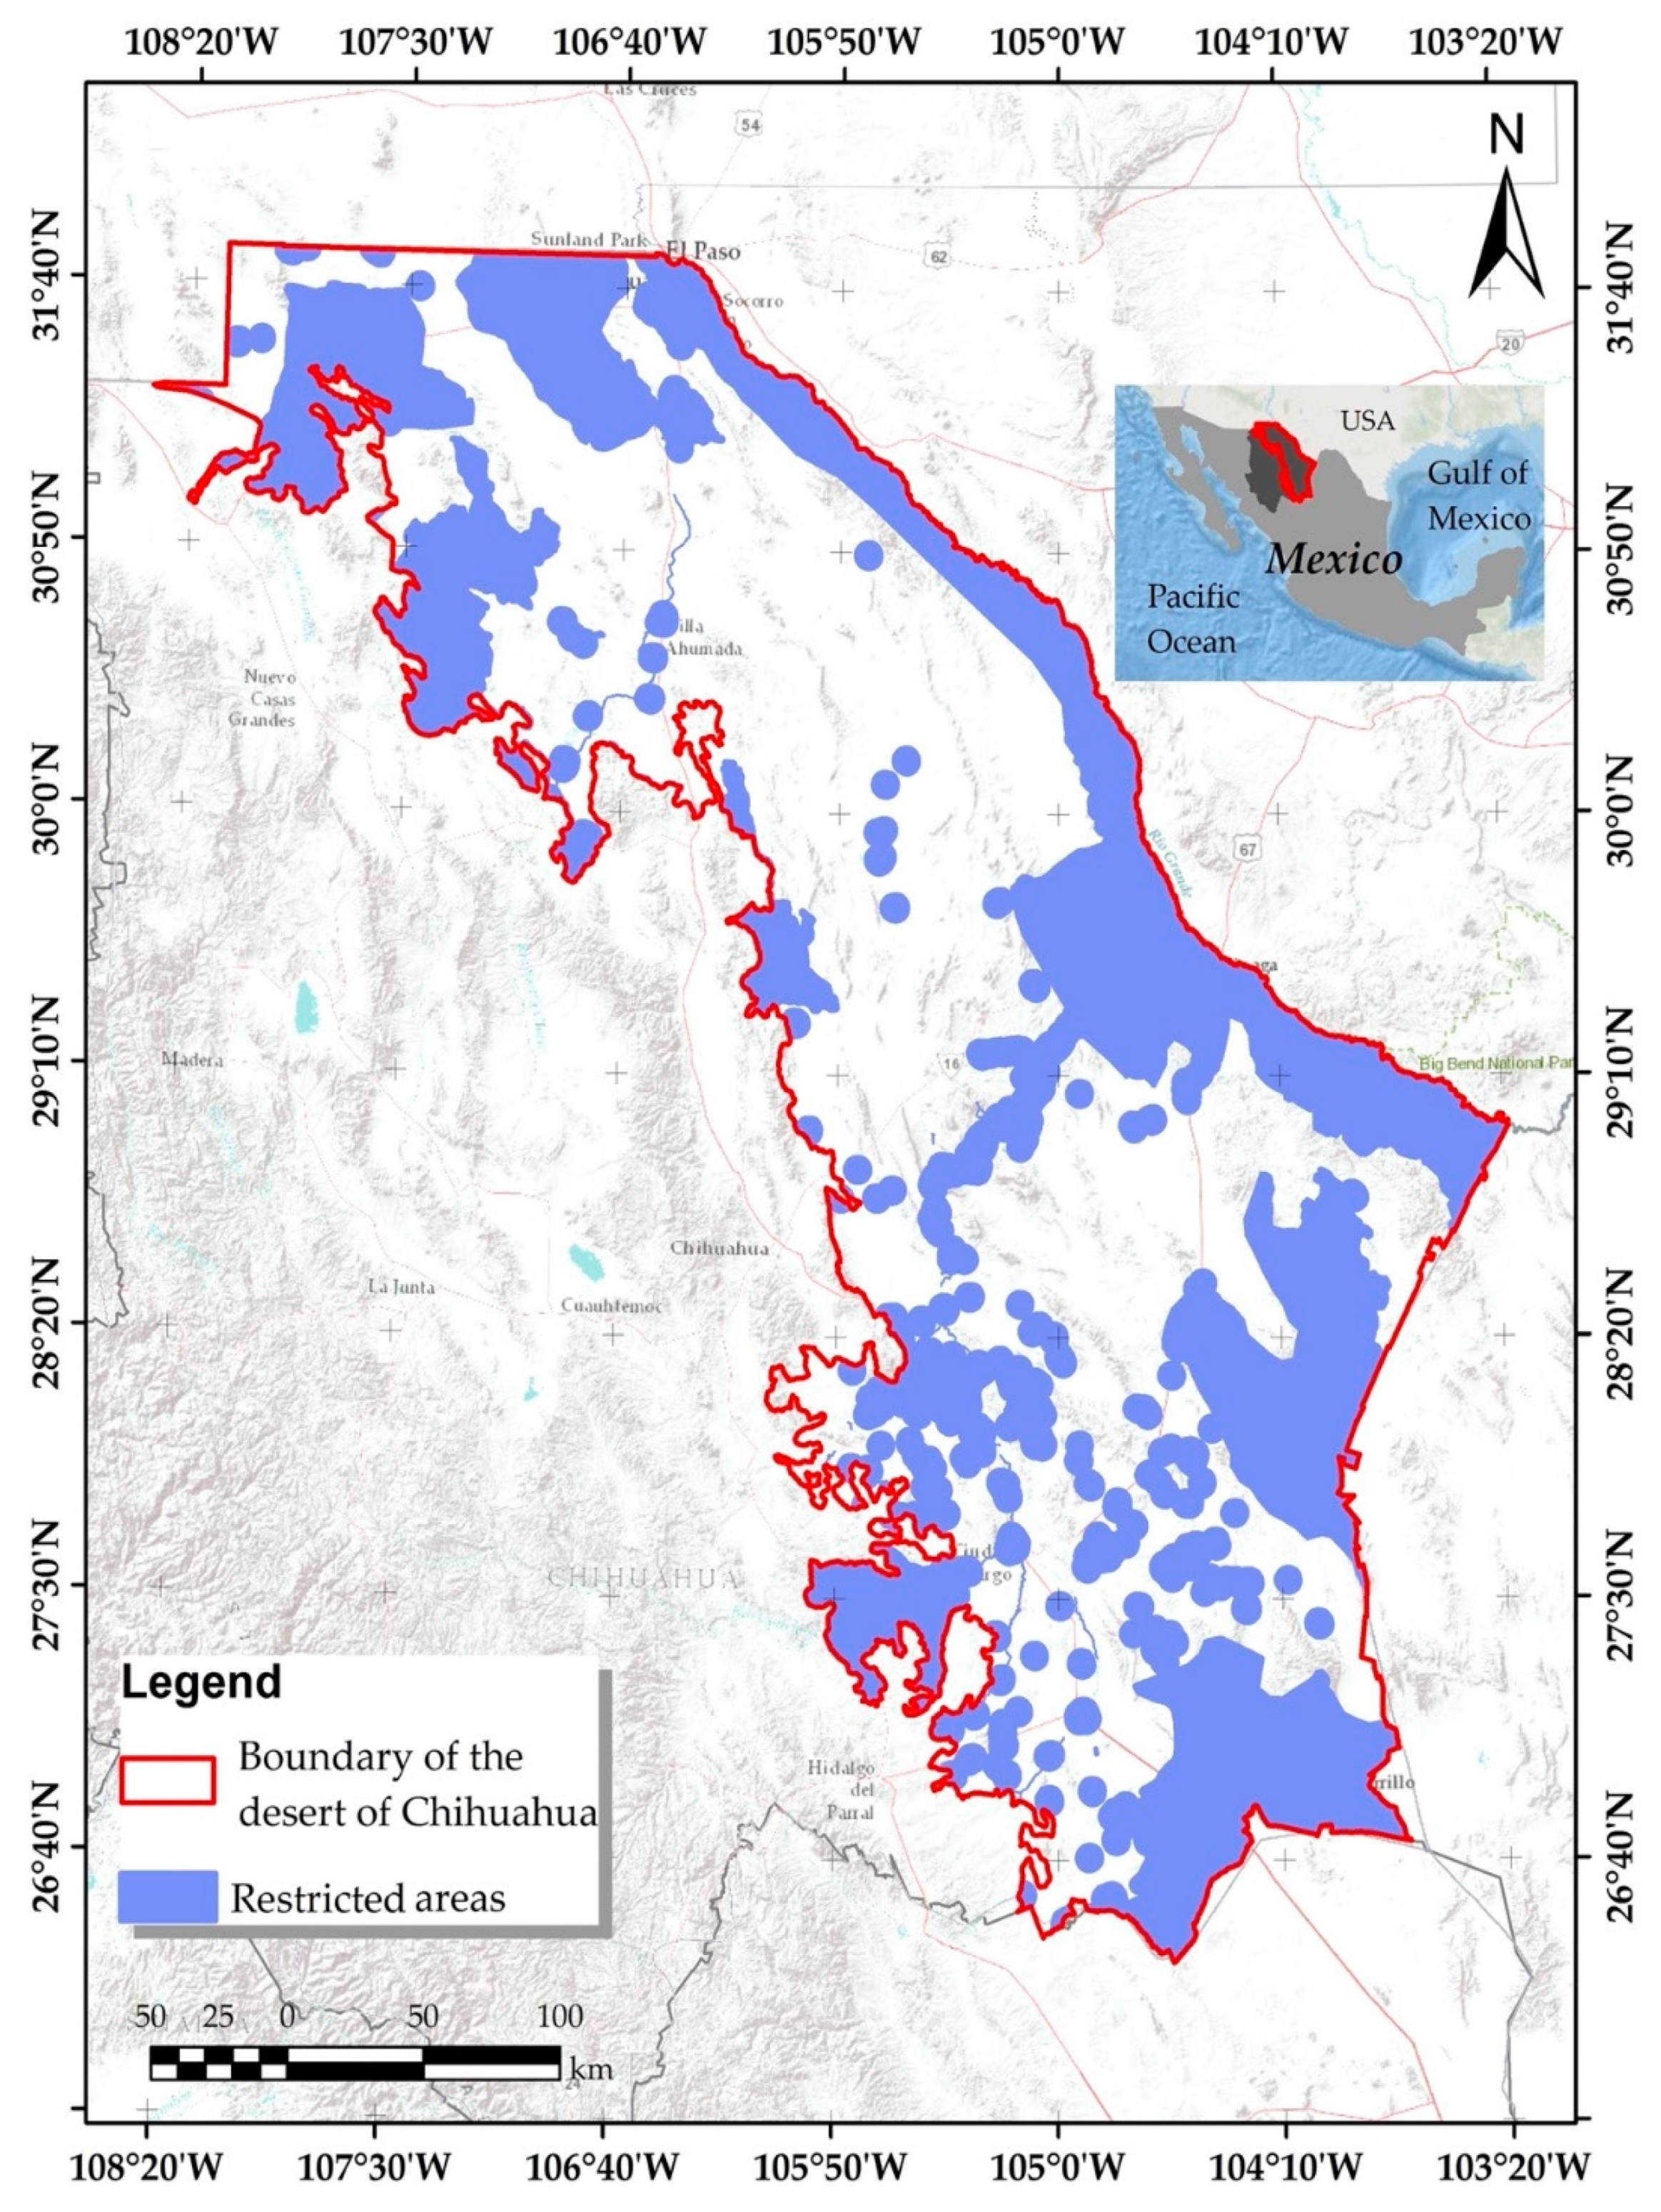
68]. This study tested two scenarios and they were constructed by weighting differently 10 criteria influencing suitability for the DSF. The criteria incorporated topographical, environmental, and infrastructure attributes. The generation of the spatial databases, at the chosen scale, was quick and practical for all the criteria selected. That represented an advantage. In addition, we defined eight restriction rules, which served to mask out 46.62% of the study area. Such portions of land were identified as non-suitable for the development of solar farms. Previous studies have proven the feasibility of defining restrictions rules to mask out non-suitable areas [2,52].
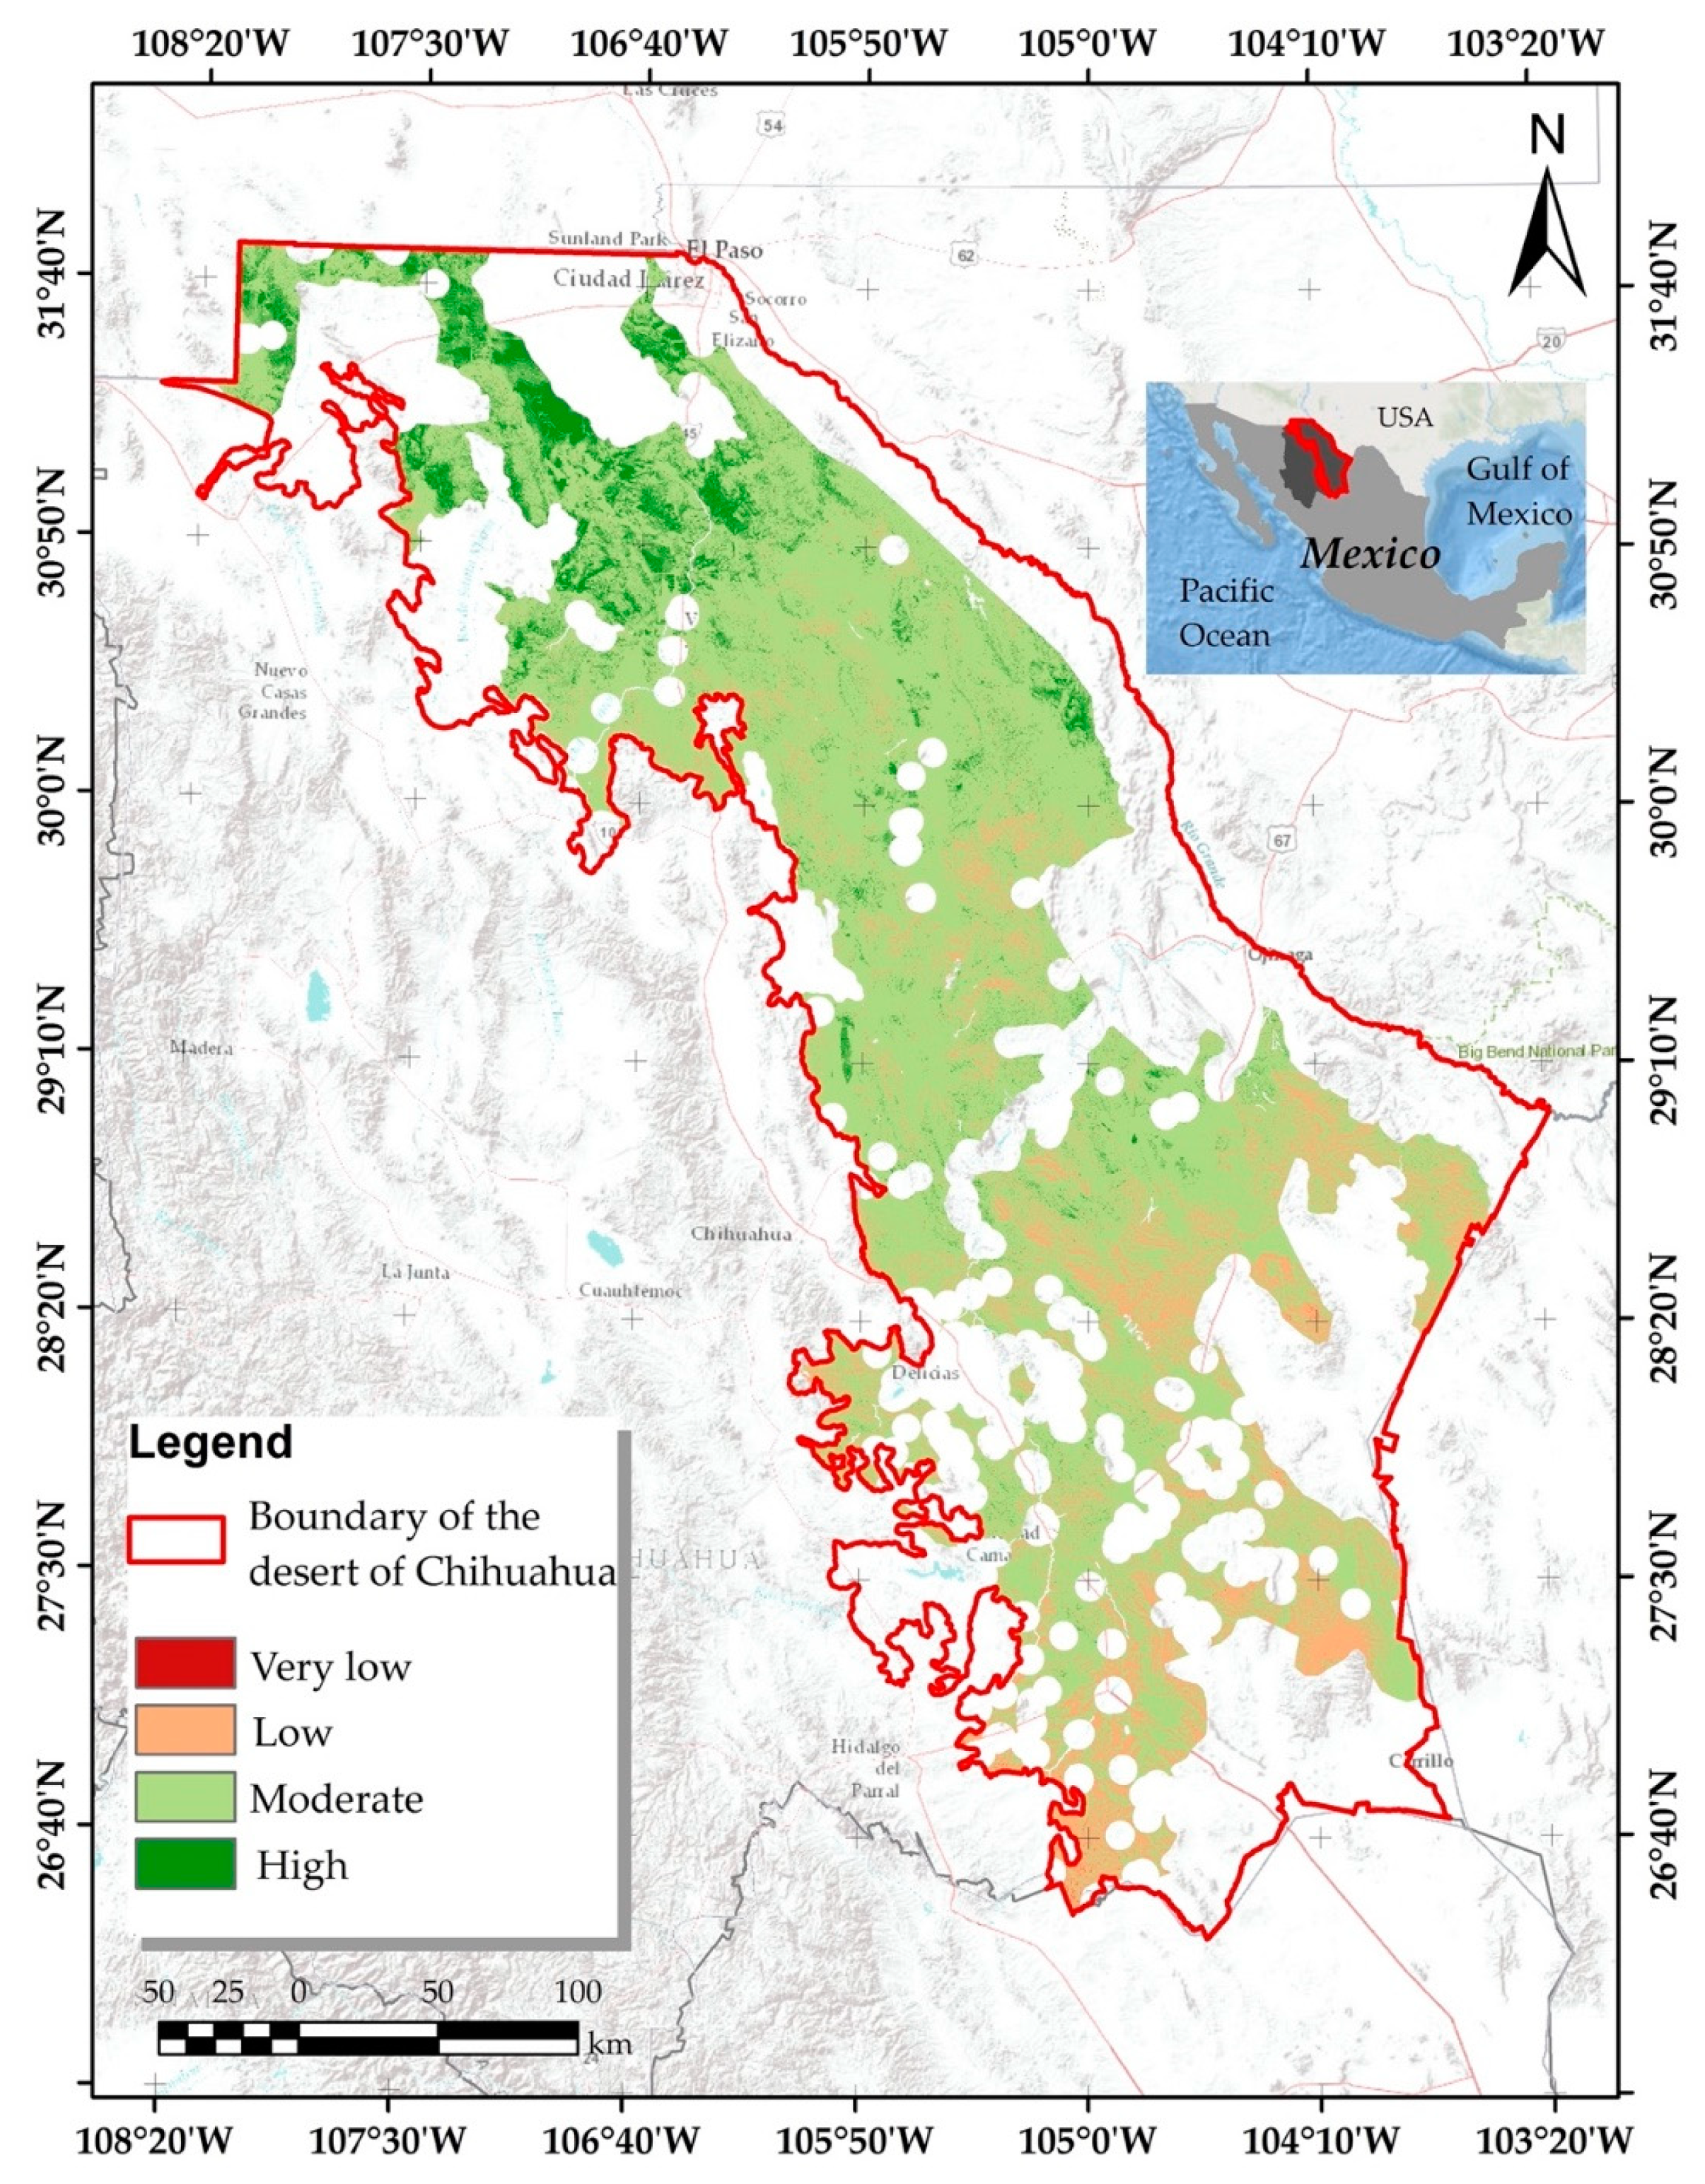
This study was effective in identifying different levels of site-suitability, as it has also been possible in previous studies [68,
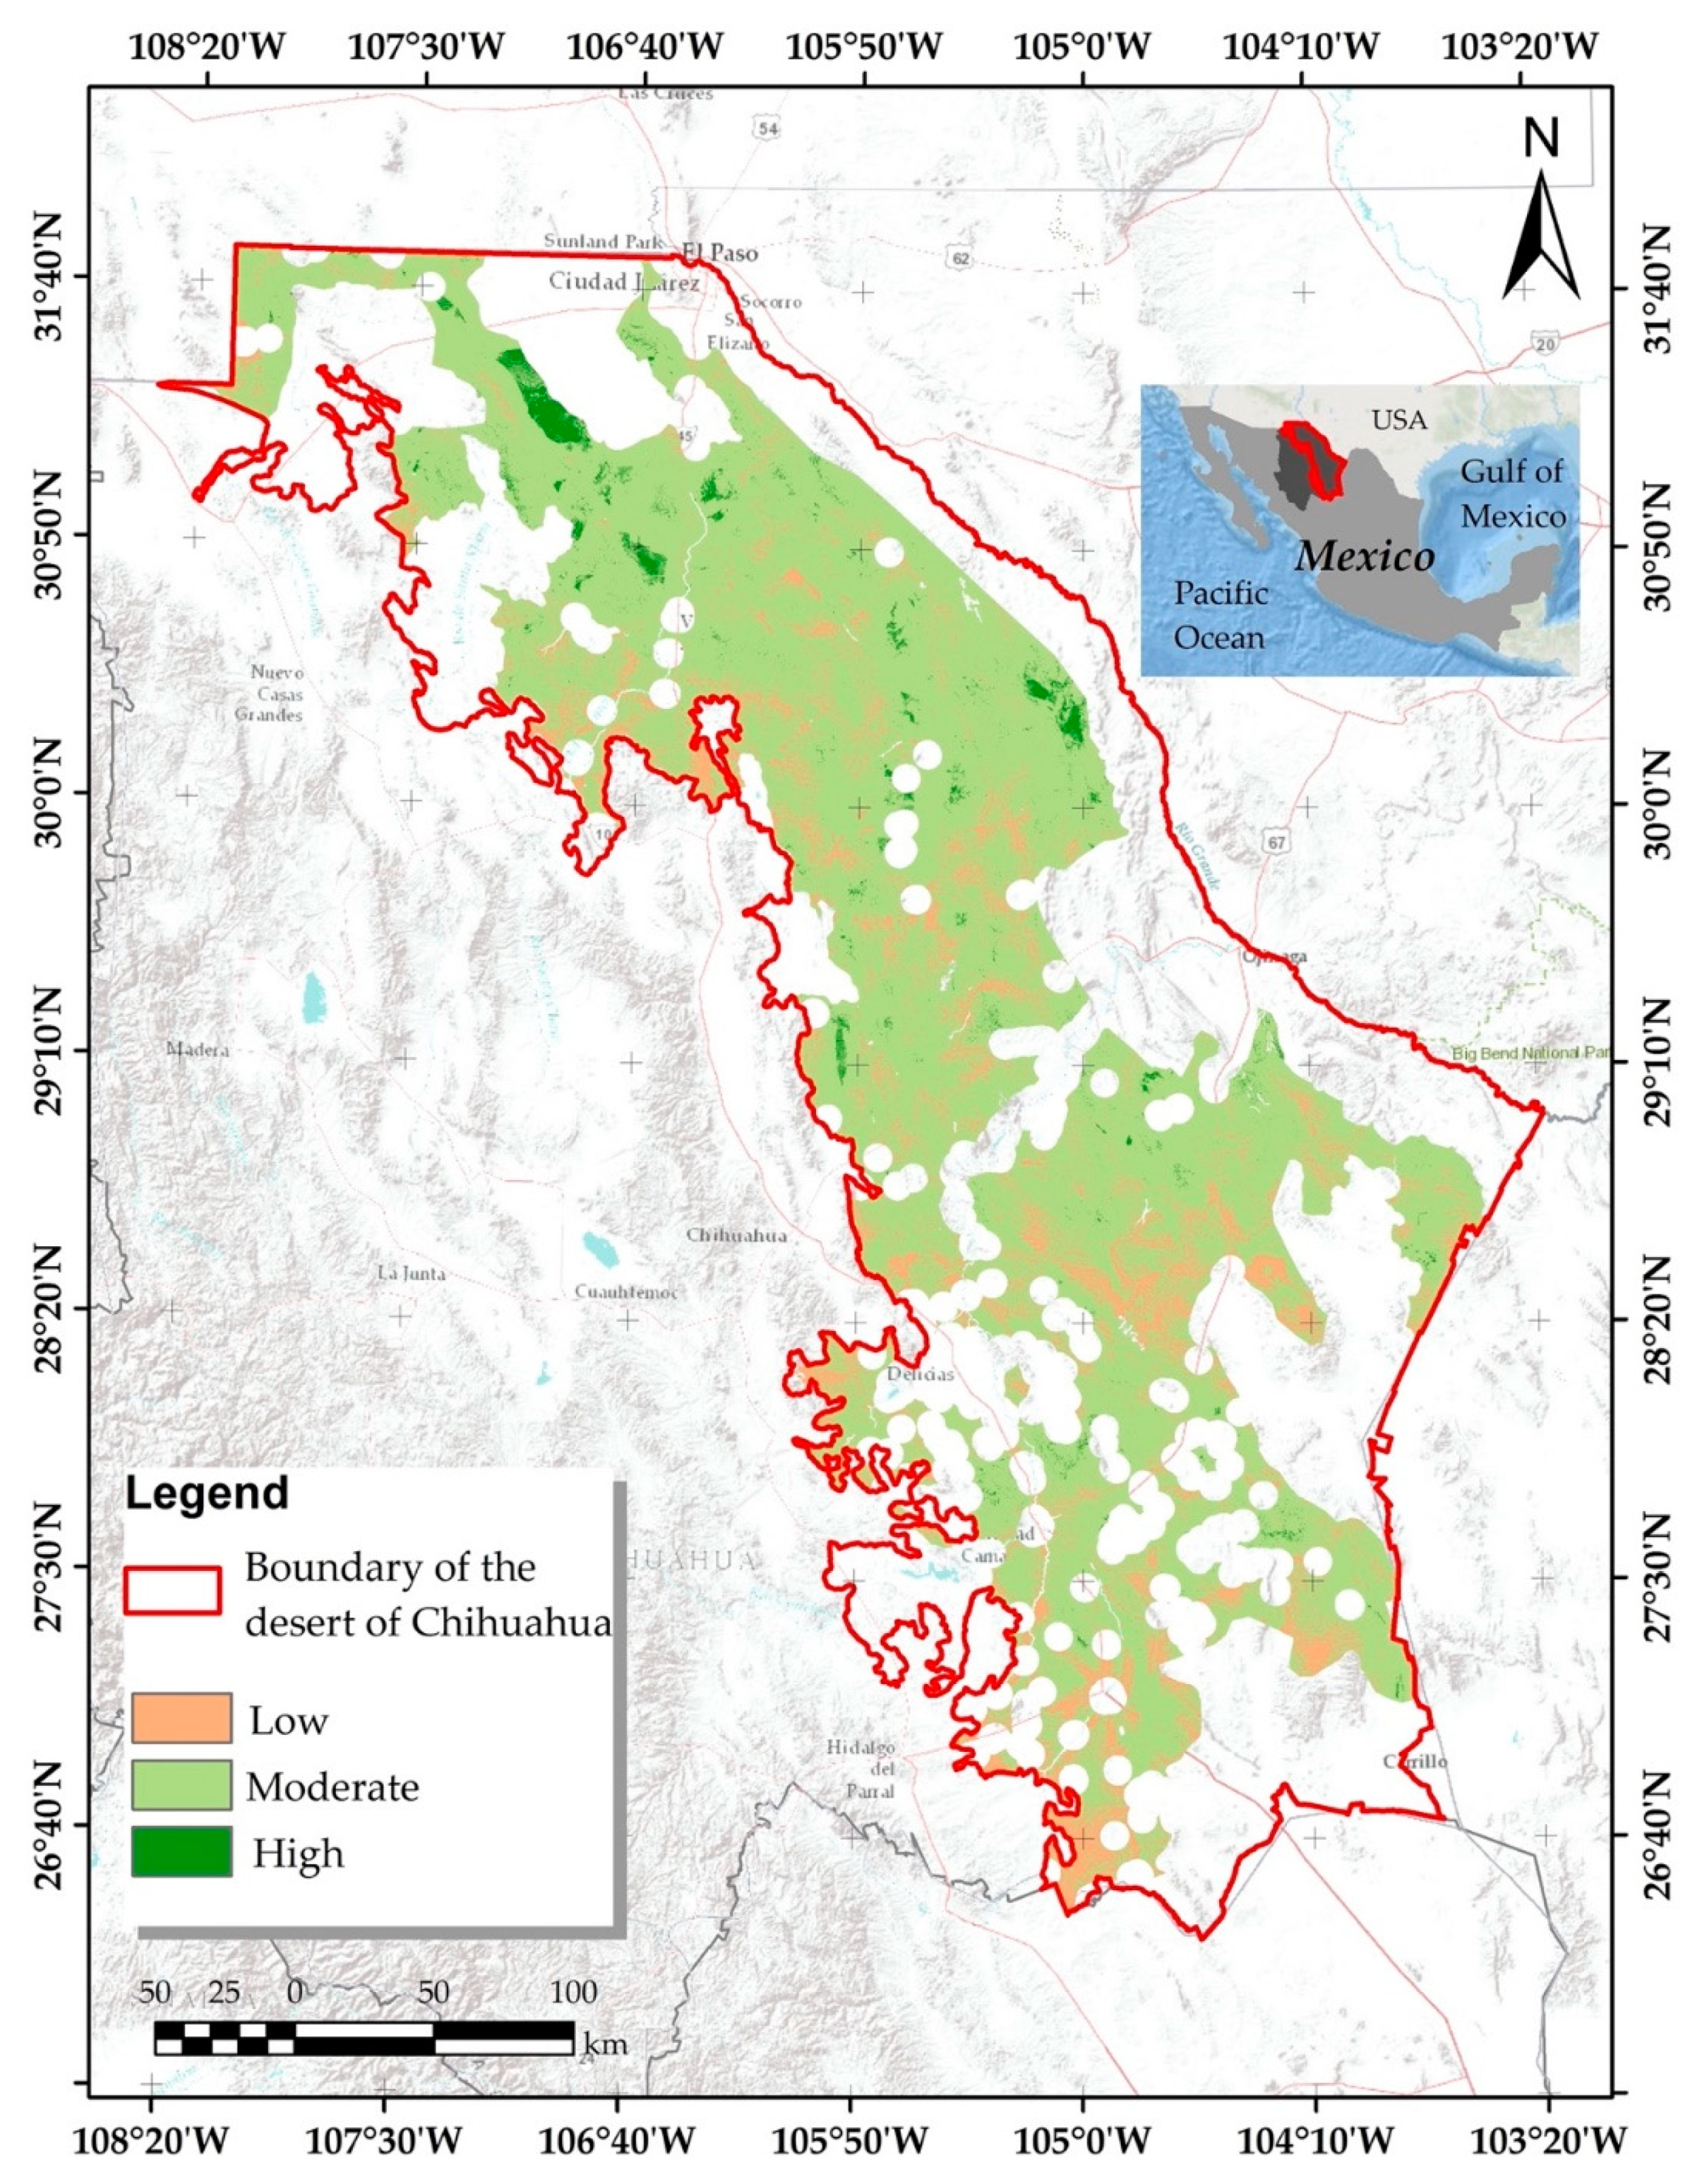
69]. In the two scenarios evaluated, areas of very high suitability were not identified. Meanwhile, the very low suitability level was represented by small areas, only in the case of the AHP scenario. Regarding the areas represented by moderate and low site-suitability levels, the two scenarios showed similar amounts. However, the spatial distribution of these areas showed notable differences. The allocation of weights in each of the scenarios followed a differentiated procedure and that impacted the results.
The ranking scenario, which consisted of equal weighting for all the criteria, resulted to be more conditioning, especially for the areas with high suitability. Previous studies in the area have considered similar approaches [30]. The RM is the simplest decision-making method and it may be chosen when the purpose is to avoid risks [17]. In contrast, the allocation of weights by the AHP method revealed a higher surface area for lands with high suitability in the northern part of the study area. This scenario is more effective than the ranking scenario in defining the specific influence of each criterion; thus, the suitability map of the AHP scenario may represent more realistic results.
Unfortunately, a map with the location of the actual farms in Mexico is not publicly available. Hence, a validation of the methods with these data is not possible. In addition, we cannot make sure the sites where solar farms are currently operating in the study region are the ones with either high or the highest suitability. Some of these farms may have not been installed by following a scientific procedure to previously identify the sites with potential for PV energy generation. Instead, the maps of land use employed in this study are considered trustable since they were validated by and retrieved from governmental sources in Mexico, as previous studies have stated [70]. The digital elevation model was also retrieved from official sources. That gives certainty about the resulting map of site-suitability and its agreement with what exists in reality.
This is the first study integrating the methodologies of MCDM and AHP for the study area. It provides a starting point for decision-making on site selection for the development of solar farms. The two scenarios were sensitive to the weights given to the criteria and that resulted in differentiated distributions of the suitability areas on the territory.
The choice of criteria with a knowledge-based approach, such as that employed in the AHP scenario, is commonly applied in spatial planning studies [71,72]. Based on a knowledge-based approach, solar radiation was defined as the dominant criterion influencing the suitability of the territory for the DSF. In fact, previous studies in the area have considered solar radiation as the only criterion for planning solar farm projects [73]. However, other criteria, such as the ones selected in this study, play a key role in the prioritization of potential sites for the development of solar farms [67]. Thus, future policies on spatial planning could also take into account some or all of the aforementioned criteria.
Given that the DSF implies high initial costs and requires large areas of land to produce energy; construction, proximity to the national grid, and to the main roads could imply significant economic costs, which sometimes may exceed the value of the electricity generated by the solar farm itself. Hence, site selection based on slope and aspect of the terrain, as well as the establishment near existing infrastructure, are relevant criteria to take into account for the development of solar farms [18].
Notorious differences can be detected between the two scenarios, which assemble two territorial policies represented by different weightings. It implies that policy (i.e., weighting) can play a key role in the selection of the most suitable sites. Results also indicate that, besides solar radiation, another criterion also influences site-suitability significantly. For instance, topographic criteria such as landforms and aspects.
For the sake of repeatability and simplicity, the criteria used in this study were not exhaustive and only some of them influencing the site-suitability for the DSF were included. Due to the large scale of the study area, the evaluation required the adoption of a high-level approach. If any decision-maker were to adopt this approach on a small scale, criteria influencing at the local level should be considered. Moreover, additional criteria may be examined based on the demands of potential investors, utilities, government agencies, and environmentalists [74]. The inclusion of social and economic criteria may significantly improve the evaluation and that is recommended for future research on the study area.
The advantage of generating scenarios of suitable areas for the development of solar farms, based on multi-criteria assessment, lies in the minimum criteria and their modification [75]. Based on data availability, modeling the suitability of the territory for the DSF can be performed for any region [76,77]. It is possible to test several weighting procedures to explore different scenarios and represent policies addressing specific problems, such as ecosystem preservation and their sustainable use [78].
The existence of roads does not necessarily mean accessibility to the electricity grid. It was assumed for this study that wherever main roads exist, access to the electricity grid is feasible. However, there may be some capacity constraints on transmission lines in the grid, which could introduce a potential obstacle to the integration of large-scale solar farms, even if they are in places located near an existing transmission line. The assessment of restrictions for all the components of the infrastructure is beyond the scope of this study and the final results do not take into account such constraints.
With the methodology used in this study, updates of the input data can be easily performed whenever new or more data are available. Planned infrastructure can also be taken into account. In addition, this MCDM-AHP method offers high flexibility in updating the suitability maps [62], for example, based on the preferences of new decision-makers. The combined MCDM-AHP and GIS methodology is applicable to similar analyses for other regions and is useful for assessing the site-suitability for other renewable energy technologies. For that, appropriate criteria representing technological factors, taking into account the local context, and representing the distinctive preferences of decision-makers, must be carefully identified.

5. Conclusions

This study presents an approach based on MCDM and GIS to identify suitable sites for the development of solar farms in the Desert of Chihuahua, Mexico. The MCDM included topographical, environmental, and infrastructure criteria based on expert knowledge, as well as data available from the study region. Two scenarios employing different weighting to the criteria were tested. The final site-suitability maps from the two scenarios showed that the northern part of the study region has the highest suitability for the development of solar farms. Thus, this area could be used for the construction of renewable energy projects in the future.
The identification of suitable sites for the development of solar farms is the first step before the use of lands for clean energy generation. The inclusion of expert knowledge (i.e., AHP), which allocated a different weight to each criterion based on its influence, contributed to spatially identifying more effectively the sites with high suitability compared to the ranking method, which equally weighted all the criteria. This AHP approach represents a valuable tool, which may facilitate the decision-making process in the establishment of solar farm projects. The development of solar farms on the sites with the highest suitability may in turn contribute to reducing the overall costs.
This study offers a solution to the complexity of decision-making in the renewable energy sector in the Desert of Chihuahua. The results provide a scientific-based selection of sites for solar energy on a regional scale. This knowledge should increase the confidence of those interested in investing in solar energy, which is critical to achieving Mexico’s attempts to reduce its dependence on fossil fuel-based energy.

Author Contributions

Conceptualization and methodology, F.V.-G. and J.A.P.-A.; software, A.P.-A.; formal analysis, M.C.V.-A., C.R.M.-N., and A.Á.-H.; investigation, A.Á.-H.; data curation, A.P.-A., C.R.M.-N., and M.C.V.-A.; writing—original draft preparation, J.A.P.-A.; writing—review and editing, F.V.-G. All authors have read and agreed to the published version of the manuscript.

Funding

This research received no external funding.

Institutional Review Board Statement

Not applicable.

Informed Consent Statement

Informed consent was obtained from all subjects involved in the study.

Conflicts of Interest

The authors declare no conflict of interest.

References

  1. Singh, J.M. On Farm Energy Use Pattern in Different Cropping Systems in Haryana, India. Master’s Thesis, Sustainable Energy Systems and Managements, International Institute of Management, University of Flensburg, Flensburg, Germany, 2002. [Google Scholar]
  2. Sliz-Szkliniarz, B. Assessment of the renewable energy-mix and land use trade-off at a regional level: A case study for the Kujawsko–Pomorskie Voivodship. Land Use Policy 2013, 35, 257–270. [Google Scholar] [CrossRef]
  3. Capellán-Pérez, I.; Mediavilla, M.; de Castro, C.; Carpintero, Ó.; Miguel, L.J. Fossil fuel depletion and socio-economic scenarios: An integrated approach. Energy 2014, 77, 641–666. [Google Scholar] [CrossRef]
  4. Li, D.H.W.; Lam, T.N.T.; Chan, W.W.H.; Mak, A.H.L. Energy and cost analysis of semi-transparent photovoltaic in office buildings. Appl. Energy 2009, 86, 722–729. [Google Scholar] [CrossRef]
  5. Kalogirou, S.A. Solar thermal collectors and applications. Prog. Energy Combust. 2004, 30, 231–295. [Google Scholar] [CrossRef]
  6. Shao, H.; Chu, L. Resource evaluation of typical energy plants and possible functional zone planning in China. Biomass Bioenergy 2008, 32, 283–288. [Google Scholar] [CrossRef]
  7. Chow, J.; Kopp, R.J.; Portney, P.R. Energy resources and global development. Science 2003, 302, 1528–1531. [Google Scholar] [CrossRef] [Green Version]
  8. Fadai, D. Utilization of renewable energy sources for power generation in Iran. Renew. Sustain. Energy Rev. 2007, 11, 173–181. [Google Scholar] [CrossRef]
  9. United Nations (UN). Transforming Our World: The 2030 Agenda for Sustainable Development; United Nations: New York, NY, USA, 2015; pp. 27–30. [Google Scholar]
  10. Mirhosseini, M.; Sharifi, F.; Sedaghat, A. Assessing the wind energy potential locations in province of Semnan in Iran. Renew. Sustain. Energy Rev. 2011, 15, 449–459. [Google Scholar] [CrossRef]
  11. Hosenuzzaman, M.; Rahim, N.A.; Selvaraj, J.; Hasanuzzaman, M.; Malek, A.A.; Nahar, A. Global prospects, progress, policies, and environmental impact of solar photovoltaic power generation. Renew. Sustain. Energy Rev. 2015, 41, 284–297. [Google Scholar] [CrossRef]
  12. Kabir, E.; Kumar, P.; Kumar, S.; Adelodun, A.A.; Kim, K.H. Solar energy: Potential and future prospects. Renew. Sustain. Energy Rev. 2018, 82, 894–900. [Google Scholar] [CrossRef]
  13. Asakereh, A.; Omid, M.; Alimardani, R.; Sarmadian, F. Developing a GIS-based Fuzzy AHP model for selecting solar energy sites in Shodirwan Region in Iran. IJAST 2014, 68, 37–48. [Google Scholar] [CrossRef]
  14. Razykov, T.M.; Ferekides, C.S.; Morel, D.; Stefanakos, E.; Ullal, H.S.; Upadhyaya, H.M. Solar photovoltaic electricity: Current status and future prospects. Sol. Energy 2011, 85, 1580–1608. [Google Scholar] [CrossRef]
  15. Gormally, A.M.; Whyatt, J.D.; Timmis, R.J.; Pooley, C.G. A regional-scale assessment of local renewable energy resources in Cumbria, UK. Energy Policy 2012, 50, 283–293. [Google Scholar] [CrossRef]
  16. Georgiou, A.G.; Skarlatos, D. Optimal site selection for sitting a solar park using multi-criteria decision analysis and geographical information systems. Geosci. Instrum. Method. Data Syst. 2016, 5, 321–332. [Google Scholar] [CrossRef] [Green Version]
  17. Al Garni, H.Z.; Awasthi, A. Solar PV power plant site selection using a GIS-AHP based approach with application in Saudi Arabia. Appl. Energy 2017, 206, 1225–1240. [Google Scholar] [CrossRef]
  18. Malczewski, J. GIS-based land-use suitability analysis: A critical overview. Prog. Plan. 2004, 62, 3–65. [Google Scholar] [CrossRef]
  19. Yousefi, H.; Hafeznia, H.; Yousefi-Sahzabi, A. Spatial site selection for solar power plants using a GIS-based boolean-fuzzy logic model: A case study of Markazi province, Iran. Energies 2018, 11, 1648. [Google Scholar] [CrossRef] [Green Version]
  20. Cengiz, T.; Akbulak, C. Application of analytical hierarchy process and geographic information systems in land-use suitability evaluation: A case study of Dümrek village (Çanakkale, Turkey). Int. J. Sustain. Dev. World Ecol. 2009, 16, 286–294. [Google Scholar] [CrossRef]
  21. Mendas, A.; Delali, A. Integration of MultiCriteria Decision Analysis in GIS to develop land suitability for agriculture: Application to durum wheat cultivation in the region of Mleta in Algeria. Comput. Electron. Agric. 2012, 83, 117–126. [Google Scholar] [CrossRef]
  22. Pohekar, S.; Ramachandran, M. Application of multi-criteria decision making to sustainable energy planning—A review. Renew. Sustain. Energy Rev. 2004, 8, 365–381. [Google Scholar] [CrossRef]
  23. Saaty, T.L. The Analytic Hierarchy Process: Planning, Priority Setting, Resource Allocation, 1st ed.; McGraw-Hill: New York, NY, USA, 1980; pp. 27–30. [Google Scholar]
  24. Hofer, T.; Sunak, Y.; Siddique, H.; Madlener, R. Wind farm siting using a spatial Analytic Hierarchy Process approach: A case study of the Stadteregion Aachen. Appl. Energy 2016, 163, e222–e243. [Google Scholar] [CrossRef]
  25. Camacho Olmedo, M.T.C.; Paegelow, M.; Mas, J.F.; Escobar, F. Geomatic Approaches for Modeling Land Change Scenarios, 1st ed.; Springer: Cham, Switzerland, 2018; pp. 27–30. [Google Scholar]
  26. Alemán-Nava, G.S.; Casiano-Flores, V.H.; Cárdenas-Chávez, D.L.; Díaz-Chavez, R.; Scarlat, N.; Mahlknecht, J.; Dallemand, J.F.; Parra, R. Renewable energy research progress in Mexico: A review. Renew. Sustain. Energy Rev. 2014, 32, 140–153. [Google Scholar] [CrossRef]
  27. Pérez-Denicia, E.; Fernández-Luqueño, F.; Vilariño-Ayala, D.; Montaño-Zetina, L.M.; Maldonado-López, L.A. Renewable energy sources for electricity generation in Mexico: A review. Renew. Sustain. Energy Rev. 2017, 78, 597–613. [Google Scholar] [CrossRef]
  28. Bernardelli, F. Energía Solar Termodinamica en America Latina: Los casos de Brasil, Chile y México, 1st ed.; CEPAL: Santiago de Chile, Chile, 2010; pp. 44–48. [Google Scholar]
  29. PROMEXICO. La Industria Solar Fotovoltaica y Fototérmica en México, 1st ed.; Secretaria de Economía: Ciudad de México, Mexico, 2017; pp. 27–30. [Google Scholar]
  30. Hinojos-Mendoza, G.I.; Heredia-Corral, D.M.; Mariscal-Guerra, J.; Cervera-Gómez, L.E.; Cervantes-Redón, E.; Botello-Mares. Propuesta de un sistema de ayuda a la decisión referenciado espacialmente (sadre) para el establecimiento de parques fotovoltaicos: Chihuahua, México. In Medio Ambiente y Sociedad: Potencial de la Energía Renovable en México, 1st ed.; Cervantes Rendon, E., Montano Armendáriz, G., Eds.; El Colegio de Chihuahua: Chihuahua, Mexico, 2018; Volume 1, pp. 43–63. [Google Scholar]
  31. Comisión Nacional para el Conocimiento y Uso de la Biodiversidad (CONABIO). Sierra del Nido-Pastizal de Flores Magón. Available online: http://www.conabio.gob.mx/conocimiento/regionalizacion/doctos/rtp_047.pdf (accessed on 12 January 2021).
  32. Douglas, M.W.; Maddox, R.A.; Howard, K.; Reyes, S. The Mexican monsoon. J. Clim. 1993, 6, 1665–1677. [Google Scholar] [CrossRef]
  33. Muldavin, E.H.; Moore, D.I.; Collins, S.L.; Wetherill, K.R.; Lightfoot, D.C. Aboveground net primary production dynamics in a northern Chihuahuan Desert ecosystem. Oecologia 2008, 155, 123–132. [Google Scholar] [CrossRef] [PubMed]
  34. García, E. Modificaciones al Sistema de Clasificación Climática de Köppen, 1st ed.; CONABIO: Mexico City, Mexico, 1998; pp. 27–30. [Google Scholar]
  35. SIATL. Simulador de Flujos de Agua de Cuencas Hidrográficas. Available online: http://antares.inegi.org.mx/analisis/red_hidro/siatl/ (accessed on 12 January 2021).
  36. Comisión Nacional de Áreas Naturales Protegidas (CONANP). Buscador de Datos Por Área Natural Protegida. Available online: http://sig.conanp.gob.mx/website/pagsig/ (accessed on 12 January 2021).
  37. Comisión Nacional para el Conocimiento y Uso de la Biodiversidad (CONABIO). Available online: http://www.conabio.gob.mx/conocimiento/regionalizacion/doctos/regionalizacion.html (accessed on 12 January 2021).
  38. Instituto Nacional de Geografía e Informática (INEGI). Marco Geoestadistico. Available online: https://www.inegi.org.mx/temas/mg/default.html#Descargas (accessed on 12 January 2021).
  39. Instituto Nacional de Geografía e Informática. Uso del Suelo y Vegetación. Available online: https://www.inegi.org.mx/temas/usosuelo/default.html#Descargas (accessed on 12 January 2021).
  40. Instituto Nacional de Geografía e Informática. Continuo de Elevaciones Mexicano (CEM). Available online: https://www.inegi.org.mx/app/geo2/elevacionesmex/ (accessed on 12 January 2021).
  41. Al Garni, H.Z.; Awasthi, A. Solar PV power plants site selection: A review. In Advances in Renewable Energies and Power Technologies, 1st ed.; Yahyaoui, I., Ed.; Elsevier: Amsterdam, The Netherlands, 2018; Volume 1, pp. 57–75. [Google Scholar]
  42. Lee, A.; Kang, H.Y.; Lin, C.Y.; Shen, K.C. An integrated decision-making model for the location of a PV solar plant. Sustainability 2015, 7, 13522–13541. [Google Scholar] [CrossRef] [Green Version]
  43. Firozjaei, M.K.; Nematollahi, O.; Mijani, N.; Shorabeh, S.N.; Firozjaei, H.K.; Toomanian, A. An integrated GIS-based Ordered Weighted Averaging analysis for solar energy evaluation in Iran: Current conditions and future planning. Renew. Energy 2019, 136, 1130–1146. [Google Scholar] [CrossRef]
  44. Asakereh, A.; Soleymani, M.; Sheikhdavoodi, M.J. A GIS-based Fuzzy-AHP method for the evaluation of solar farms locations: Case study in Khuzestan province. Iran. Sol. Energy 2017, 155, 342–353. [Google Scholar] [CrossRef]
  45. Instituto Nacional de Geografía e Informática. Red Nacional de Caminos RNC. Available online: https://www.inegi.org.mx/app/biblioteca/ficha.html?upc=889463776086 (accessed on 14 January 2021).
  46. Aly, A.; Jensen, S.S.; Pedersen, A.B. Solar power potential of Tanzania: Identifying CSP and PV hot spots through a GIS multicriteria decision making analysis. Renew. Energy 2017, 113, 159–175. [Google Scholar] [CrossRef]
  47. WorldClim. Historical Climate Data. Available online: https://www.worldclim.org/data/worldclim21.html (accessed on 12 January 2021).
  48. Radziemska, E.; Klugmann, E. Thermally affected parameters of the current–voltage characteristics of silicon photocell. Energy Convers. Manag. 2002, 43, 1889–1900. [Google Scholar] [CrossRef]
  49. Kazem, H.A.; Chaichan, M.T. Effect of humidity on photovoltaic performance based on experimental study. IJAER 2015, 10, 43572–43577. [Google Scholar]
  50. Doljak, D.; Stanojević, G. Evaluation of natural conditions for site selection of ground-mounted photovoltaic power plants in Serbia. Energy 2017, 127, 291–300. [Google Scholar] [CrossRef] [Green Version]
  51. Instituto Nacional de Geografía e Informática. Edafología. Available online: https://www.inegi.org.mx/temas/edafologia/default.html#Descargas (accessed on 12 January 2021).
  52. Sánchez-Lozano, J.M.; Teruel-Solano, J.; Soto-Elvira, P.L.; García-Cascales, M.S. Geographical Information Systems (GIS) and Multi-Criteria Decision Making (MCDM) methods for the evaluation of solar farms locations: Case study in south-eastern Spain. Renew. Sustain. Energy Rev. 2013, 24, 544–556. [Google Scholar] [CrossRef]
  53. Fajardo, J.; Lessmann, J.; Bonaccorso, E.; Devenish, C.; Munoz, J. Combined use of systematic conservation planning, species distribution modelling, and connectivity analysis reveals severe conservation gaps in a megadiverse country (Peru). PLoS ONE 2014, 9, e114367. [Google Scholar] [CrossRef] [Green Version]
  54. Charabi, Y.; Gastli, A. PV site suitability analysis using GIS-based spatial fuzzy multi criteria evaluation. Renew. Energy 2011, 36, 2554–2561. [Google Scholar] [CrossRef]
  55. Uyan, M. GIS-based solar farms site selection using analytic hierarchy process (AHP) in Karapinar region, Konya/Turkey. Renew. Sustain. Energy Rev. 2013, 28, 11–17. [Google Scholar] [CrossRef]
  56. Malczewski, J. GIS and Multicriteria Decision Analysis, 1st ed.; John Wiley & Sons: New York, NY, USA, 1999; pp. 177–192. [Google Scholar]
  57. Merrouni, A.A.; Elalaoui, F.E.; Ghennioui, A.; Mezrhab, A.; Mezrhab, A. A GIS-AHP combination for the sites assessment of large-scale CSP plants with dry and wet cooling systems. Case study: Eastern Morocco. Sol. Energy 2018, 166, 2–12. [Google Scholar] [CrossRef]
  58. Noorollahi, E.; Fadai, D.; Akbarpour Shirazi, M.; Ghodsipour, S. Land suitability analysis for solar farms exploitation using GIS and fuzzy analytic hierarchy process (FAHP)—A case study of Iran. Energies 2016, 9, 643. [Google Scholar] [CrossRef] [Green Version]
  59. Saaty, T.L. Decision Making for Leaders: The Analytic Hierarchy Process for Decisions in A Complex World, 3rd ed.; RWS Publications: Pittsburgh, PA, USA, 2001. [Google Scholar]
  60. Vázquez-Quintero, G.; Prieto-Amparán, J.A.; Pinedo-Alvarez, A.; Valles-Aragón, M.C.; Morales-Nieto, C.R.; Villarreal-Guerrero, F. GIS-Based Multicriteria Evaluation of Land Suitability for Grasslands Conservation in Chihuahua, Mexico. Sustainability 2020, 12, 185. [Google Scholar] [CrossRef] [Green Version]
  61. Van Haaren, R.; Fthenakis, V. GIS-based wind farm site selection using spatial multi-criteria analysis (SMCA): Evaluating the case for New York State. Renew. Sustain. Energy Rev. 2011, 15, 3332–3340. [Google Scholar] [CrossRef]
  62. Ali, S.; Taweekun, J.; Techato, K.; Waewsak, J.; Gyawali, S. GIS based site suitability assessment for wind and solar farms in Songkhla, Thailand. Renew. Energy 2019, 132, 1360–1372. [Google Scholar] [CrossRef]
  63. Secretaria de Energía (SENER). Estrategia de Transición para Promover el Uso de Tecnologías y Combustibles más Limpios. Available online: https://dof.gob.mx/nota_detalle.php?codigo=5585823&fecha=07/02/2020 (accessed on 12 January 2021).
  64. Tahri, M.; Hakdaoui, M.; Maanan, M. The evaluation of solar farm locations applying Geographic Information System and Multi-Criteria Decision-Making methods: Case study in southern Morocco. Renew. Sustain. Energy Rev. 2015, 51, 1354–1362. [Google Scholar] [CrossRef]
  65. Ozdemir, S.; Sahin, G. Multi-criteria decision-making in the location selection for a solar PV power plant using AHP. Measurement 2018, 129, 218–226. [Google Scholar] [CrossRef]
  66. Abu-Taha, R. Multi-criteria applications in renewable energy analysis: A literature review. In Research and Technology Management in the Electricity Industry, 1st ed.; Daim, T., Oliver, T., Eds.; Springer: Berlin/Heidelberg, Germany, 2013; Volume 1, pp. 1–8. [Google Scholar]
  67. Latinopoulos, D.; Kechagia, K. A GIS-based multi-criteria evaluation for wind farm site selection. A regional scale application in Greece. Renew. Energy 2015, 78, 550–560. [Google Scholar] [CrossRef]
  68. Al Garni, H.; Kassem, A.; Awasthi, A.; Komljenovic, D.; Al-Haddad, K. A multicriteria decision making approach for evaluating renewable power generation sources in Saudi Arabia. Sustain. Energy Technol. Assess. 2016, 16, 137–150. [Google Scholar] [CrossRef]
  69. Tegou, L.I.; Polatidis, H.; Haralambopoulos, D.A. Environmental management framework for wind farm siting: Methodology and case study. J. Environ. Manage. 2010, 91, 2134–2147. [Google Scholar] [CrossRef]
  70. Clay, E.; Moreno-Sanchez, R.; Torres-Rojo, J.; Moreno-Sanchez, F. National assessment of the fragmentation levels and fragmentation-class transitions of the forests in Mexico for 2002, 2008 and 2013. Forests 2016, 7, 48. [Google Scholar] [CrossRef] [Green Version]
  71. Krueger, T.; Page, T.; Hubacek, K.; Smith, L.; Hiscock, K. The role of expert opinion in environmental modelling. Environ. Modell. Softw. 2012, 36, 4–18. [Google Scholar] [CrossRef]
  72. Kaya, İ.; Çolak, M.; Terzi, F. Use of MCDM techniques for energy policy and decision-making problems: A review. Int. J. Energy Res. 2018, 42, 2344–2372. [Google Scholar] [CrossRef]
  73. Rodríguez, M.C.N.; De la Cruz, E.E.; Aragón, C.V.; Domínguez, C.B.M.; Bustamante, M.S. Modelado del potencial fotovoltaico del estado de Chihuahua. Tecnociencia Chihuah. 2016, 10, 154–160. [Google Scholar]
  74. Ramírez-Rosado, I.J.; García-Garrido, E.; Fernández-Jiménez, L.A.; Zorzano-Santamaria, P.J.; Monteiro, C.; Miranda, V. Promotion of new wind farms based on a decision support system. Renew. Energy 2008, 33, 558–566. [Google Scholar] [CrossRef] [Green Version]
  75. Saaty, T.L. The analytic hierarchy and analytic network processes for the measurement of intangible criteria and for decision-making. In Multiple Criteria Decision Analysis, 2nd ed.; Greco, S., Ehrgott, M., Rui Figueira, J., Eds.; Springer: Berlin/Heidelberg, Germany, 2016; Volume 1,2, pp. 363–419. [Google Scholar]
  76. Garmendia, E.; Gamboa, G. Weighting social preferences in participatory multi-criteria evaluations: A case study on sustainable natural resource management. Ecol. Econ. 2012, 84, 110–120. [Google Scholar] [CrossRef] [Green Version]
  77. Nguyen, T.T.; Verdoodt, A.; Van, Y.T.; Delbecque, N.; Tran, T.C.; Van Ranst, E. Design of a GIS and multi-criteria-based land evaluation procedure for sustainable land-use planning at the regional level. Agr. Ecosyst. Environ. 2015, 200, 1–11. [Google Scholar] [CrossRef]
  78. Mayfield, C.J. Automating the Classification of Thematic Rasters for Weighted Overlay Analysis in GeoPlanner for ArcGIS. Master’s Thesis, Master of Science in Geographic Information Systems, University of Redlands, Redlands, CA, USA, 2016. [Google Scholar]
Figure 1. Location of the study area.
Land 10 00217 g001
Figure 2. Flowchart summarizing the methodology for the evaluation of site-suitability for the development of solar farms. MCDM: Multi-criteria decision-making, AHP: Analytical Hierarchy Process, GIS: Geographic Information Systems.
Land 10 00217 g002
Figure 3. Map of the study area showing the restricted areas for the development of solar farms.
Land 10 00217 g003
Figure 4. Spatial distribution of site-suitability levels for the development of solar farms in the Desert of Chihuahua. AHP scenario. The non-colored sites within the study area correspond to restricted areas.
Land 10 00217 g004
Figure 5. Spatial distribution of site-suitability levels for the development of solar farms in the Desert of Chihuahua. Ranking scenario. The non-colored sites within the study area correspond to restricted areas.
Land 10 00217 g005
Table 1. Restrictions influencing site-suitability for the development of solar farms.
NoRestrictionsDelimitation (Buffer Zone)Source
1Water bodies500 m[35]
2Hydrology (streams)500 m [35]
3Protected natural areas1000 m[36]
4Priority land region1000 m[37]
5Priority hydrological region1000 m[37]
6Urban settlements5000 m[38]
7Forest, riparian vegetation1000 m[39]
8SlopeSlopes steeper than 11°[40]
Table 2. Criteria used in the analysis to identify site-suitability for the development of solar farms.
NoCriteriaSDescriptionUnit
1Land use/land cover[39]Solar farms on lands with poor vegetation coverage are preferable. In addition, areas with vegetation of low heights (e.g., grasslands, shrublands) and croplands are considered suitable [44].Unitless
2Distance to main roads[45]It represents the easiness of access. The shorter the euclidean distance the better [46].km
3Solar radiation[47]The amount of solar radiation at the earth’s surface determines the potential for PV electricity generation [46].kJ m−2 day−1
4Annual mean temperature[47]High temperatures reduce the power output and the conversion efficiency of the PV module. The higher the panel temperature, the lower its efficiency [48].°C
5Vapor pressure[47]High contents of water vapor in the air can lead to condensation, reducing the transmissivity of solar radiation, and affecting the panel efficiency [49].kPa
6Slope[40]Flat land is essential for solar farms. Lands with steep slopes are not preferable [46].Degrees
7Aspect[40]Referring to the direction the slope of the terrain faces, the most favorable aspects are southern slopes (i.e., slopes facing south) and flat terrain as they receive the highest irradiance all year round [50].Unitless
8Wind speed[47]The PV panels and equipment have to withstand wind loads. Erosion particles produced by the wind lower the far efficiency [43].m s−1
9Soil texture[51]Fine textures with small pore sizes favor compaction, which is desirable for the structures needed for solar farms (e.g., ground mounting system, utility substation).Unitless
10Landforms[40]Small plains, U-shaped valleys, open slopes, and mesas are the mos suitable landforms. In contrast, canyons, hilltops, and mountain tops would imply higher costs for the installation of solar farms [52]. Unitless
S = source.
Table 3. Standardization of the criteria influencing the suitability of sites for the development of solar farms.
SSLLULCDMRSRAMTVP
Unitless KmkJ m−2 day−1°CkPa
1SDV 7.5>17.0–17.621.8–19.71.2–1.08
2Crp 5–7.517.6–18.119.7–18.51.08–1.0
3Shr 3–518.1–18.718.5–17.41.0–0.9
4Grs 1.5–318.7–19.317.4–16.30.9–0.8
5NAV0–1.519.3–19.916.3–13.230.8–0.6
SSLSlopeAspectWSSTLandforms
DegreesUnitlessm/s−1UnitlessUnitless
111–8North4.3–3.9CoarseLocal ridges/hills in valleys
28–6Northwest, Northeast 3.9–3.5 Upland drainages
36–4East, West3.5–3.1Medium Midslope ridges/midslope drainages
44–2Southwest, Southeast3.1–2.7 Open slope/Upper slopes, mesas
52–0South, Flat2.7–2.3FinePlains small/U-Shaped valleys
LULC = Land use/land cover, DMR = Distance to main roads, SR = Solar radiation, AMT = Annual mean temperature, VP = Vapor pressure, WS = Wind speed, SSL = Site suitability level, SDV = Sandy desert vegetation, Crp = Cropland, Shr = Shrubland, Grs = Grassland, NAV = No apparent vegetation, ST = Soil texture.
Table 4. Values used in the pair-wise comparison to evaluate the suitability of sites for the development of solar farms [23].
Verbal Judgments of
Preferences between Alternatives
Numerical
Rating
Explanation
Extremely preferred9The evidence favoring one criterion over another is of the highest possible order of affirmation.
Very strongly preferred7A criterion is favored very strongly, and its dominance is demonstrated in practice.
Strongly preferred5Experience and judgment strongly favor one criterion over another.
Moderately preferred3Experience and judgment slightly favor one criterion over another.
Equally preferred1Two criteria contribute equally to the objective.
Intermediate values2, 4, 6, 8When compromise is needed.
Table 5. Values of Random Consistency Index.
Matrix Size12345678910
RI0.00.00.61.01.11.21.31.41.51.5
Table 6. Definition of site-suitability levels for the development of solar farms.
Land-Suitability LevelValueDescription
Very high5Areas without significant limitations for the sustained development of solar farms.
High4Areas with no significant limitations for the sustained development of solar farms. They can even have minor limitations that do not significantly reduce productivity or profits and do not raise inputs above an unacceptable level.
Moderate3Areas of land with limitations that are altogether moderate for the development of solar farms; these limitations will reduce productivity or profits and increase necessary inputs to the extent that the overall advantage to be gained from the use, while still attractive, will be significantly lower than expected in the areas with high suitability.
Low2Areas with limitations that are collectively bad for the sustained development of solar farms. These limitations will reduce productivity or profits or increase necessary inputs.
Very low1The territorial extension has limitations that can be overcome over time; the limitations are severe that prevent the successful and sustained use of this area for the development of solar farms.
Table 7. Pairwise comparison matrix of the adopted criteria influencing site-suitability for the development of solar farms. AHP scenario.
CriteriaLULCDMRSIAMTVPSlopeAspectWSSoil TextureLandform
LULC11/61/71/421/71/91/21/21/4
DMR611/51/221/21/4221/2
SI7512722692
AMT421/21321/2451/3
VP1/21/21/71/311/51/5241/6
Slope72 1/21/2511/3561/2
Aspect941/22531342
Wind21/21/61/41/21/51/3141/7
Soil Texture21/21/91/51/41/61/41/411/5
Landform421/23621/2751
LULC = Land use/land cover, DMR = Distance to main roads, SI = Solar irradiance, AMT = Annual mean temperature, VP = Vapor pressure, WS = Wind speed.
Table 8. Normalized pairwise comparison matrix for the AHP scenario.
CriteriaLULCDMRSIAMTVPSlopeAspectWSSoil TextureLandformWeight (%)CR
LULC0.0240.0090.0380.0250.0630.0130.0200.0160.0120.03520.0904
DMR0.1410.0570.0530.0500.0630.0450.0460.0650.0490.0706
SI0.1650.2830.2660.1990.2200.1780.3650.1950.2220.28223
AMT0.0940.1130.1330.1000.0940.1780.0910.1300.1230.04712
VP0.0120.0280.0380.0330.0310.0180.0370.0650.0990.0234
Slope0.1650.1130.1330.0500.1570.0890.0610.1630.1480.07012
Aspect0.2120.2260.1330.1990.1570.2680.1830.0980.0990.28217
Wind0.0470.0280.0440.0250.0160.0180.0610.0330.0990.0204
Soil Texture0.0470.0280.0300.0200.0080.0150.0460.0080.0250.0283
Landform0.0940.1130.1330.2990.1890.1780.0910.2280.1230.14116
LULC = Land use/land cover, DMR = Distance to main roads, SI = Solar irradiance, AMT = Annual mean temperature, VP = Vapor pressure, WS = Wind speed, CR = Consistency Ratio.
Table 9. Weighting (%) of the criteria influencing the site-suitability for the development of solar farms under the AHP and ranking scenarios.
ScenariosAHPRanking
Criteria
Land use/land cover210
Distance to main roads610
Solar irradiance2310
Annual mean temperature1210
Vapor pressure410
Slope1210
Aspect1710
Wind speed410
Soil texture310
Landforms1610
Total100100
AHP = Analytical hierarchy process.
Table 10. Surface area corresponding to five site-suitability levels for the development of solar farms in the Desert of Chihuahua under the AHP and ranking scenarios.
SSLAHP ScenarioRanking Scenario
Surface (km2)%LSurface (km2)%L
Very low110.0200.00
Low868514.43786713.07
Moderate46,52377.2851,09884.88
High49838.2812372.05
Very high00.0000.00
Total60,20210060,202100
SSL = Site-suitability Level, %L = Percent of land from the study area.
Publisher’s Note: MDPI stays neutral with regard to jurisdictional claims in published maps and institutional affiliations.

