
Response of Land Use Change to the Grain for Green Program and Its Driving Forces in the Loess Hilly-Gully Region


Abstract
1. Introduction
2. Materials and Methods
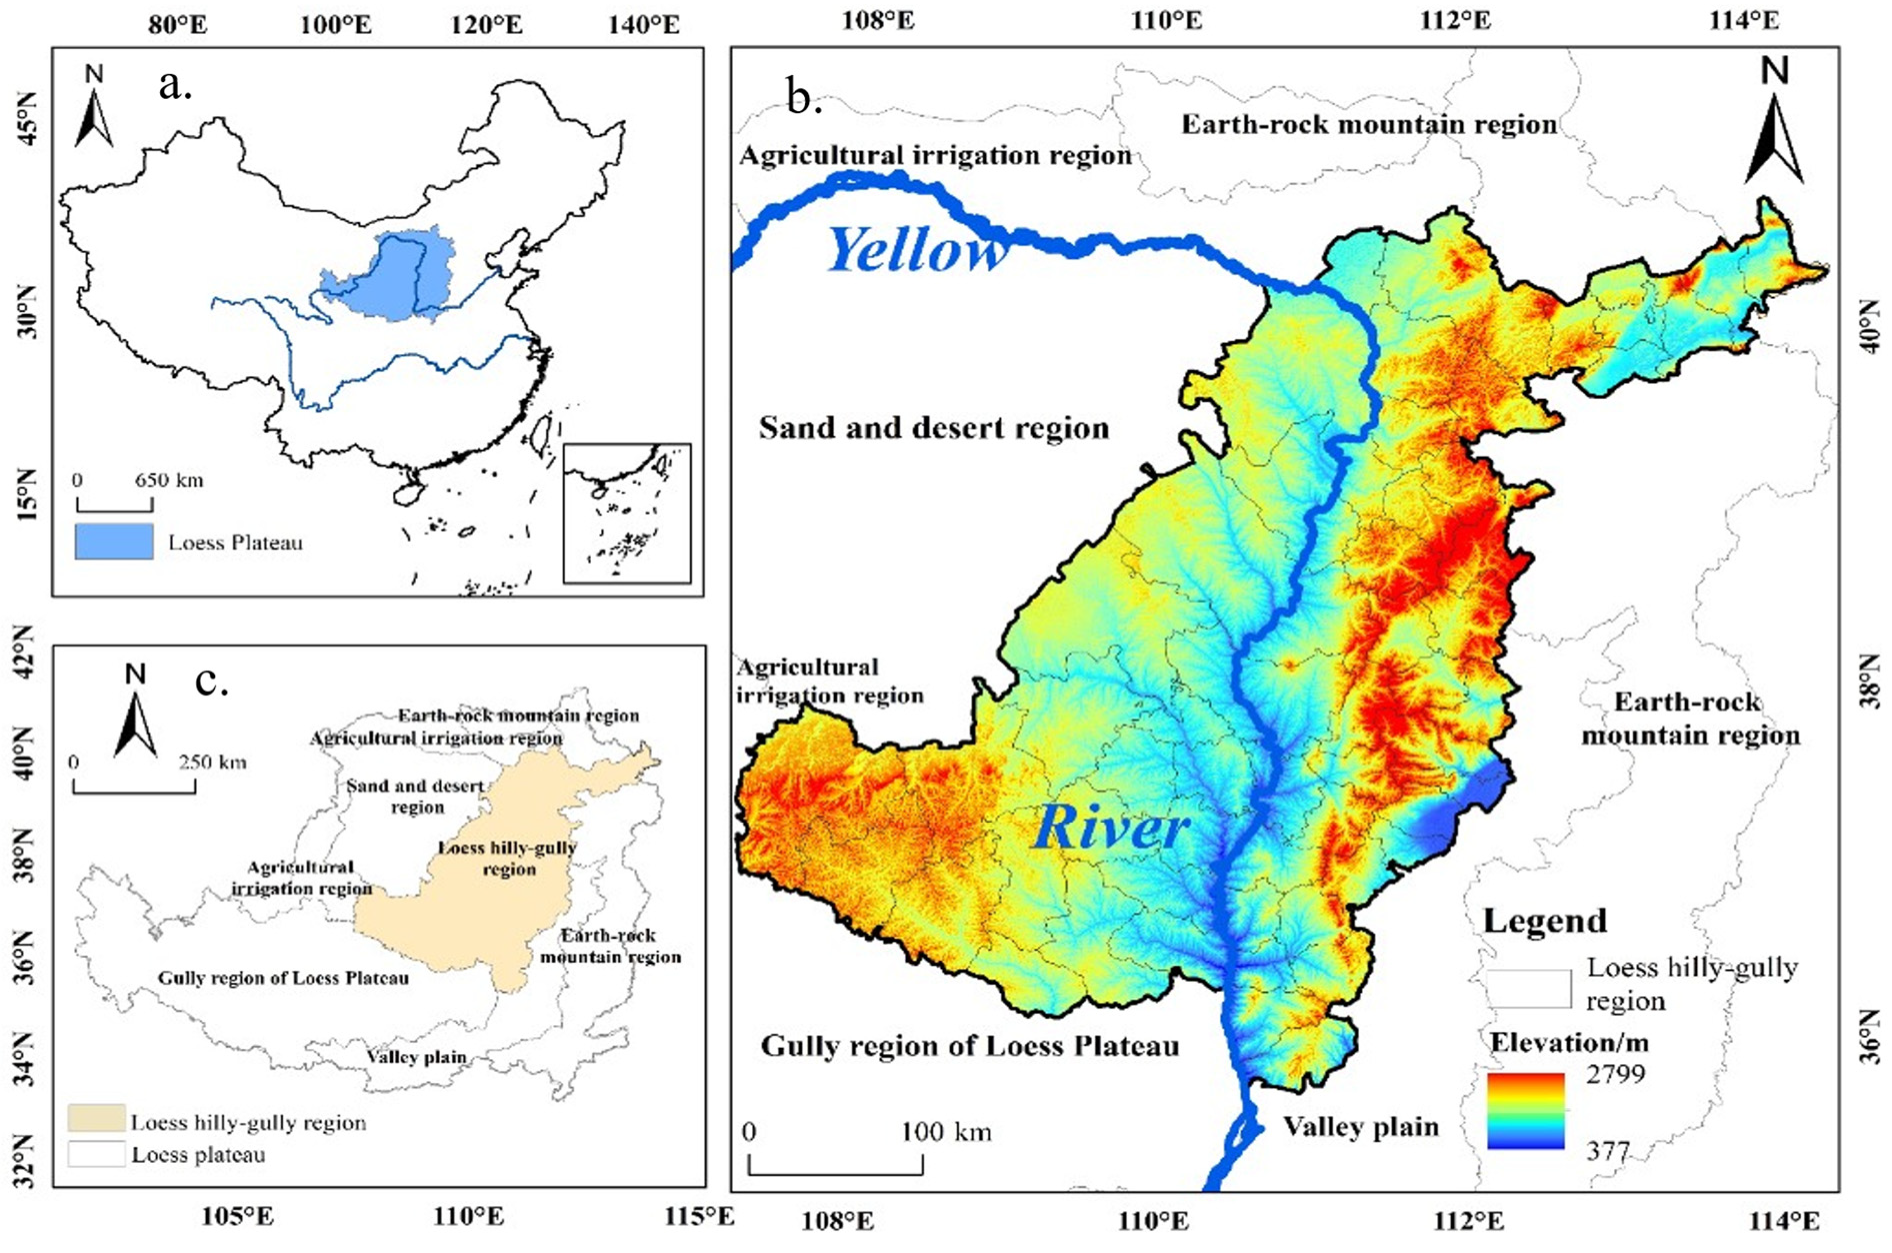
2.1. Study Area
2.2. Data Sources and Preprocessing
2.2.1. Natural Data
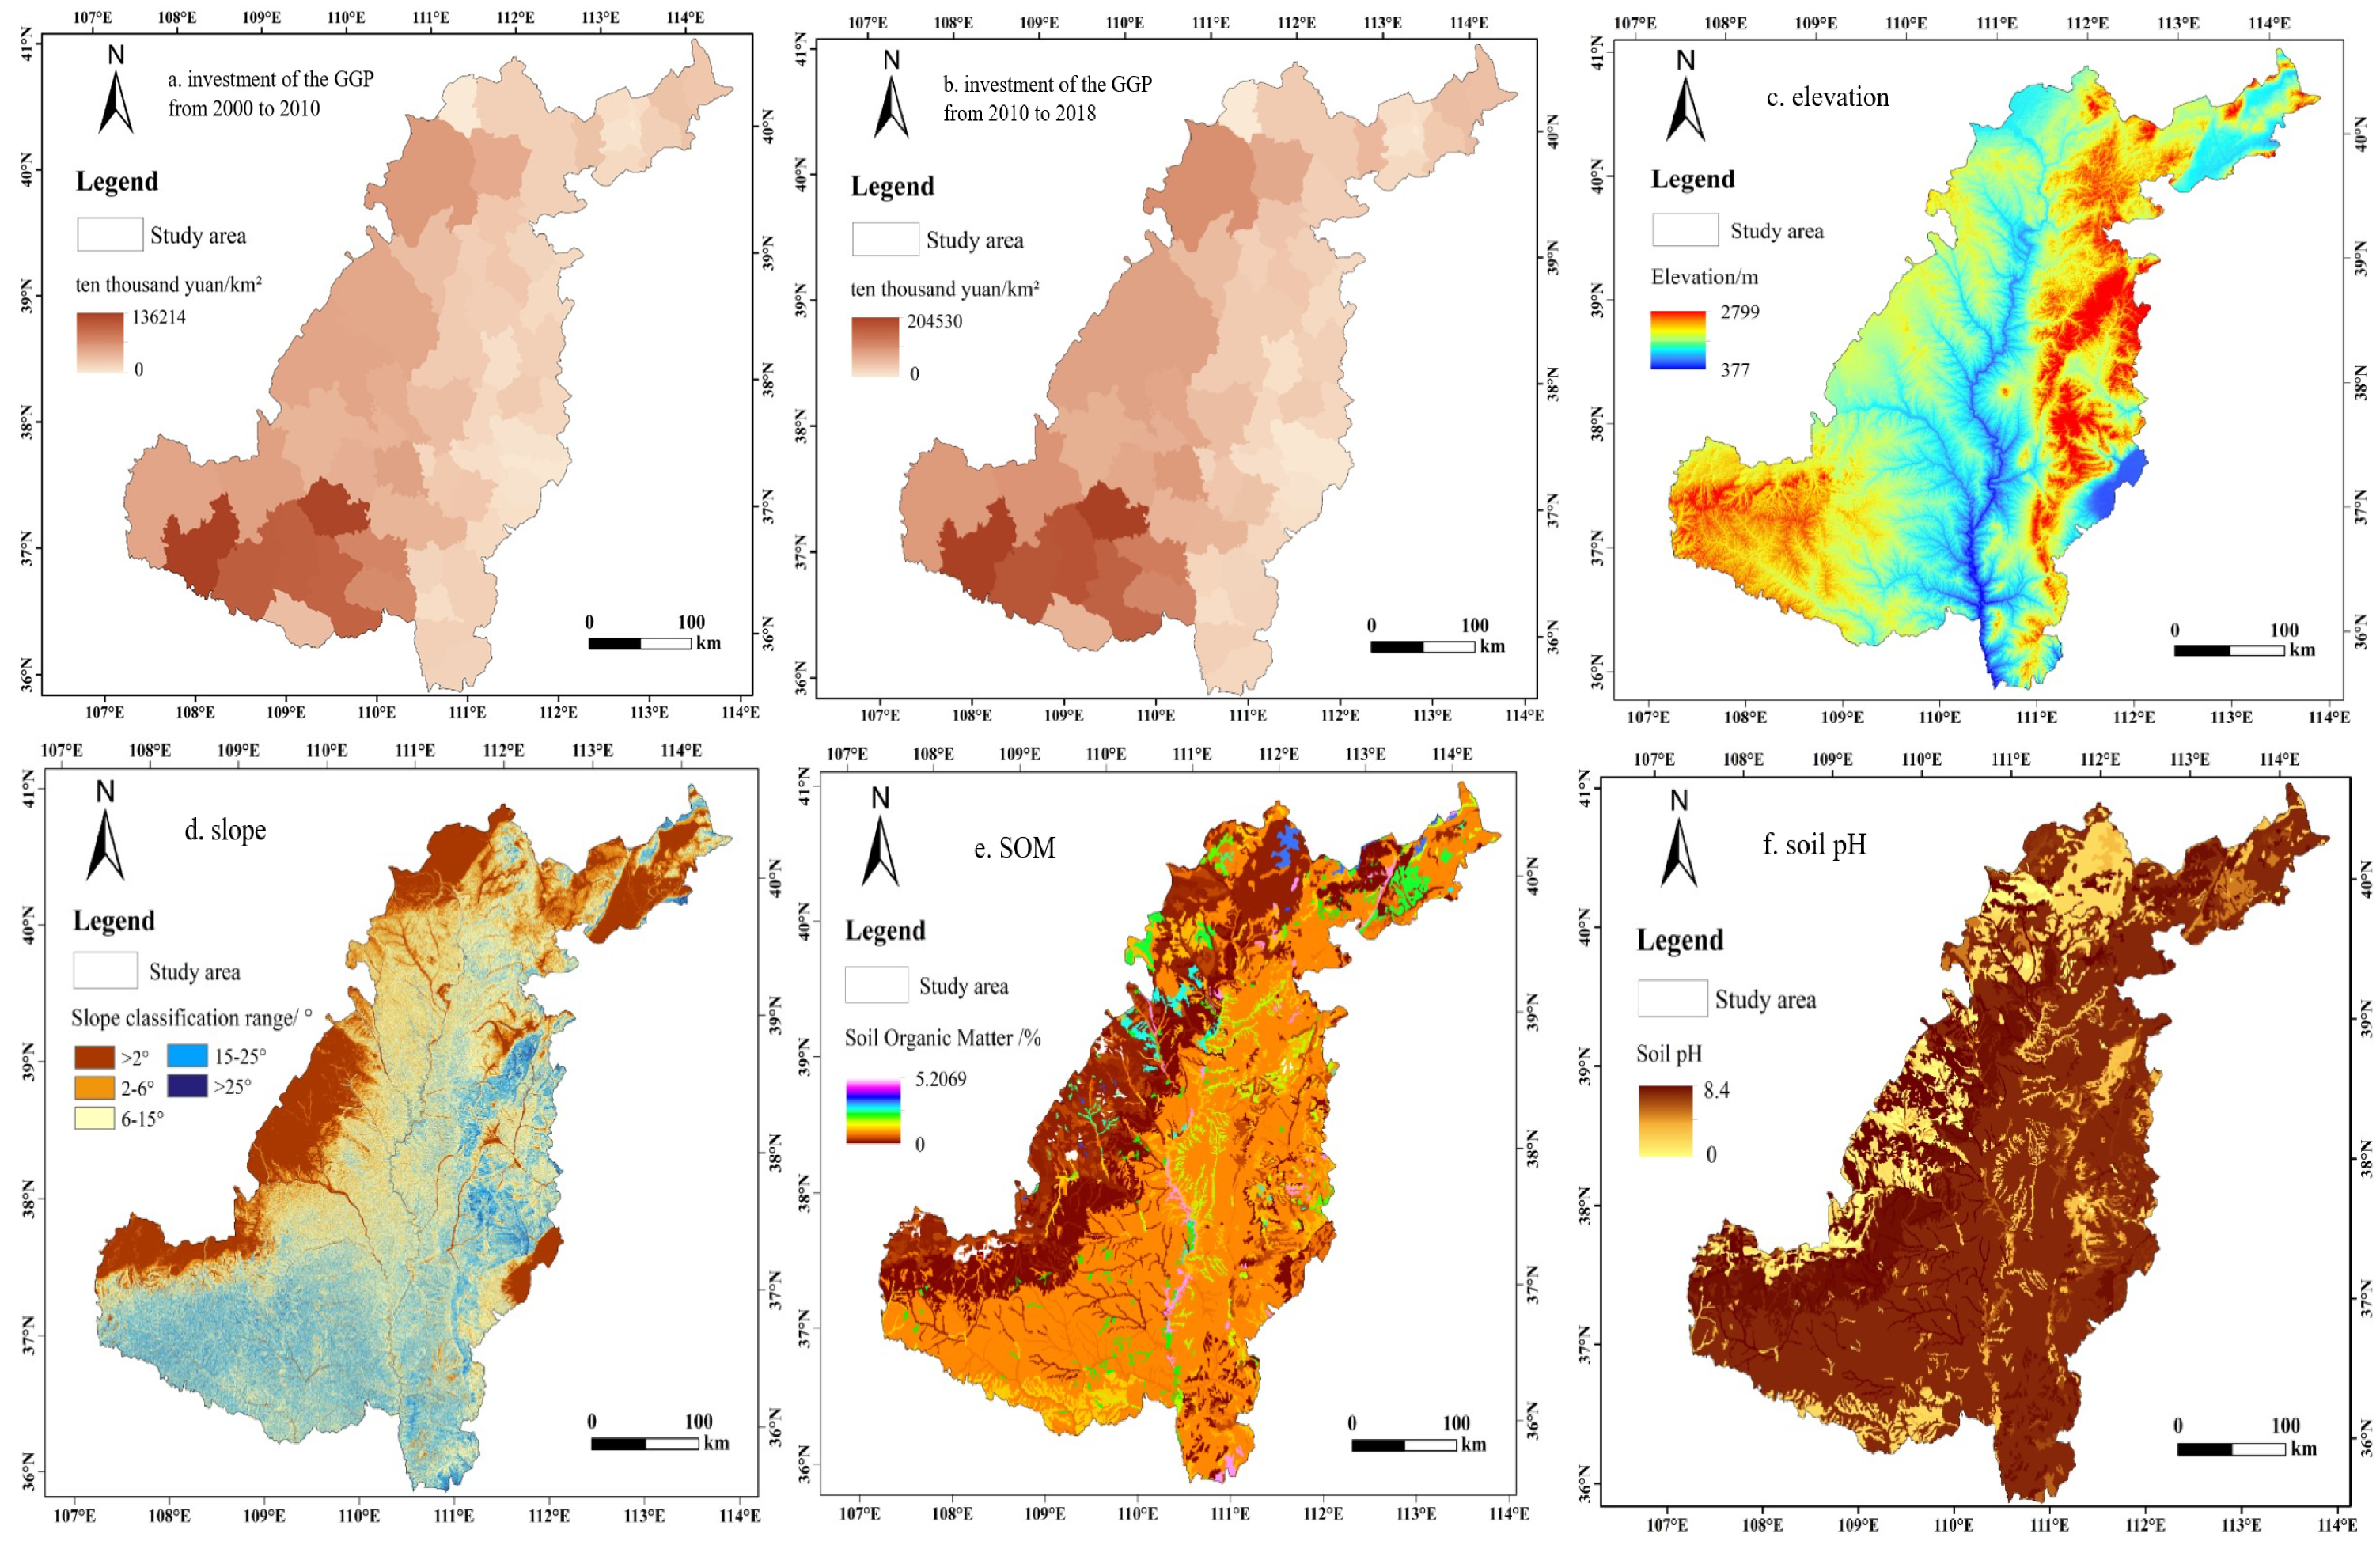
2.2.2. Socio-Economic Data and Investment of the GGP
2.2.3. Geographical Data
2.3. Analytic Tools and Equations
2.3.1. Spatial Calculating Analysis Model
2.3.2. Logistic Regression Model
2.4. Sampling Process
3. Results
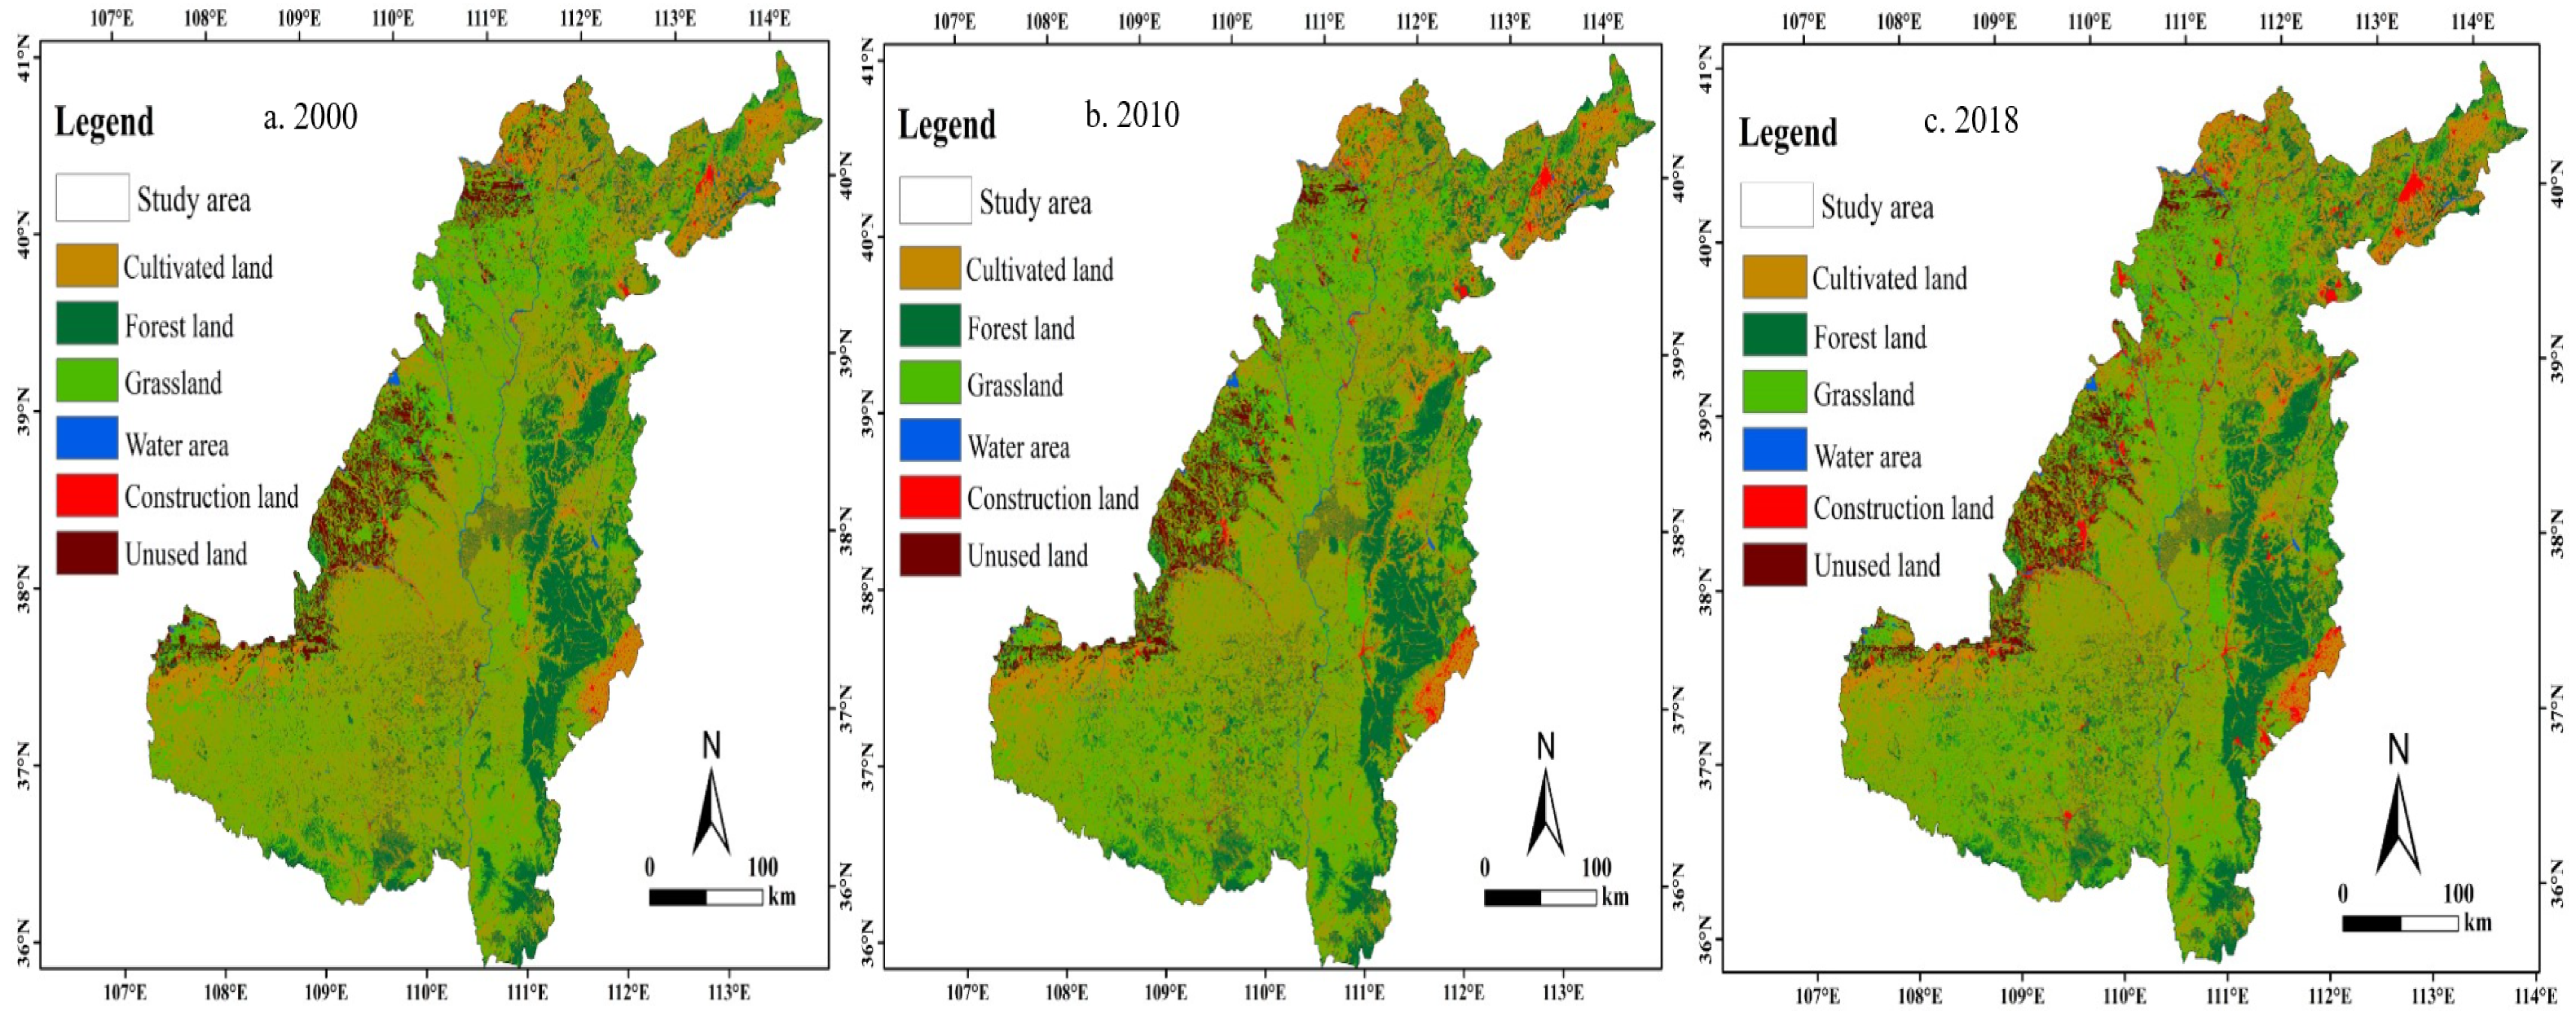
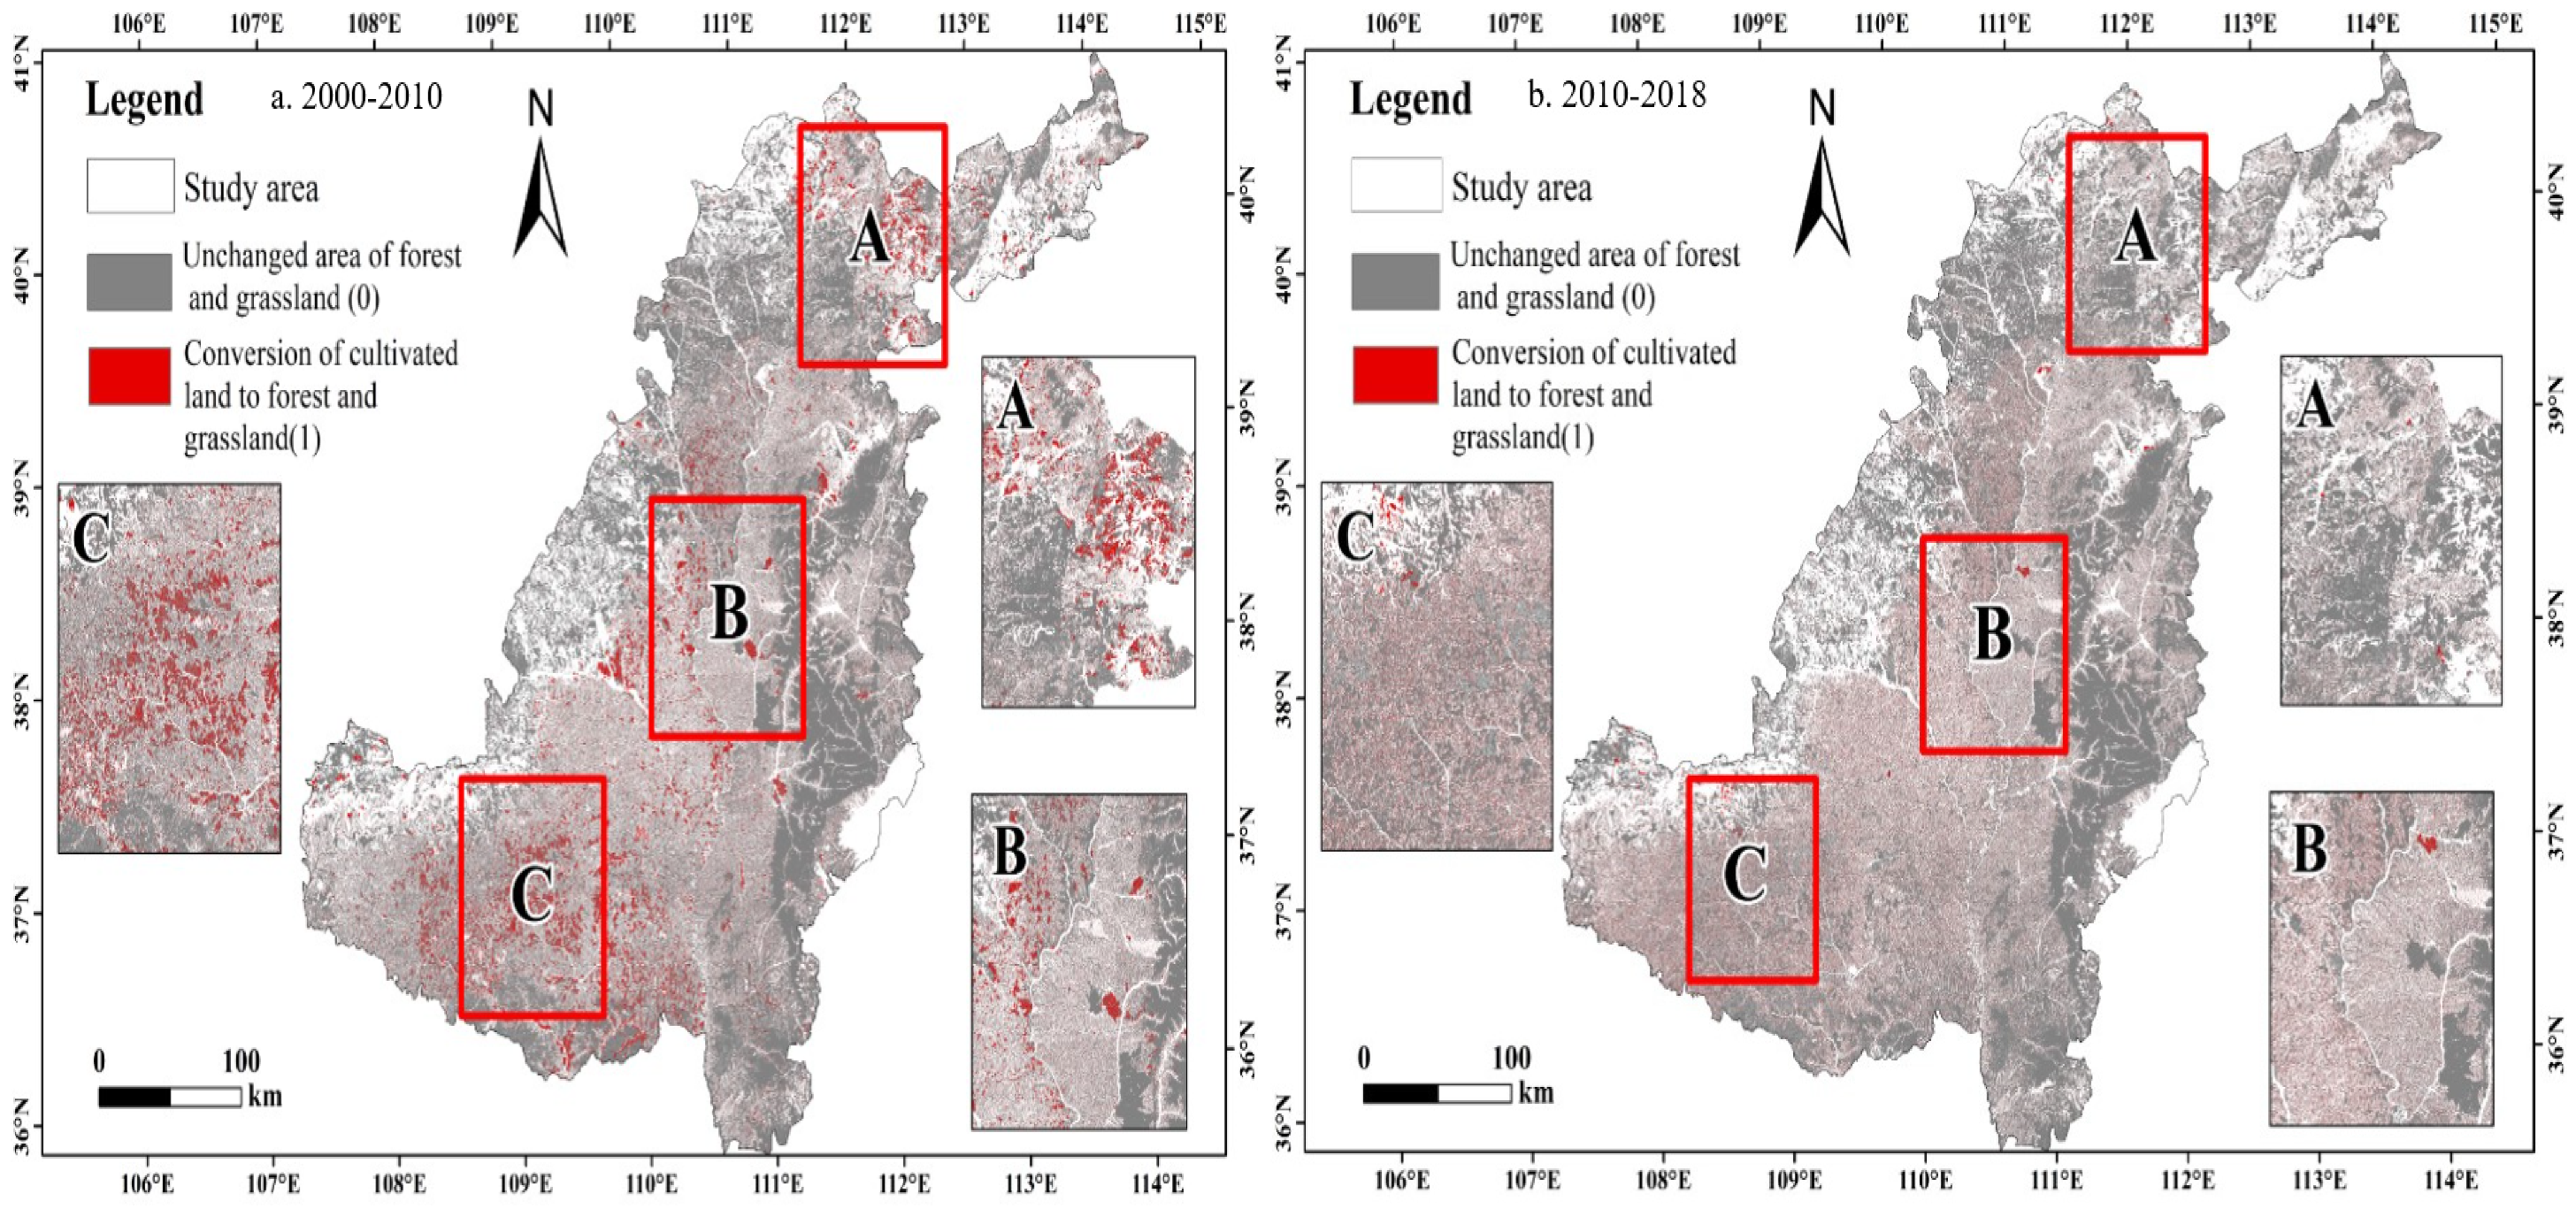
3.1. Land Use Change in the Loess Hilly-Gully Region
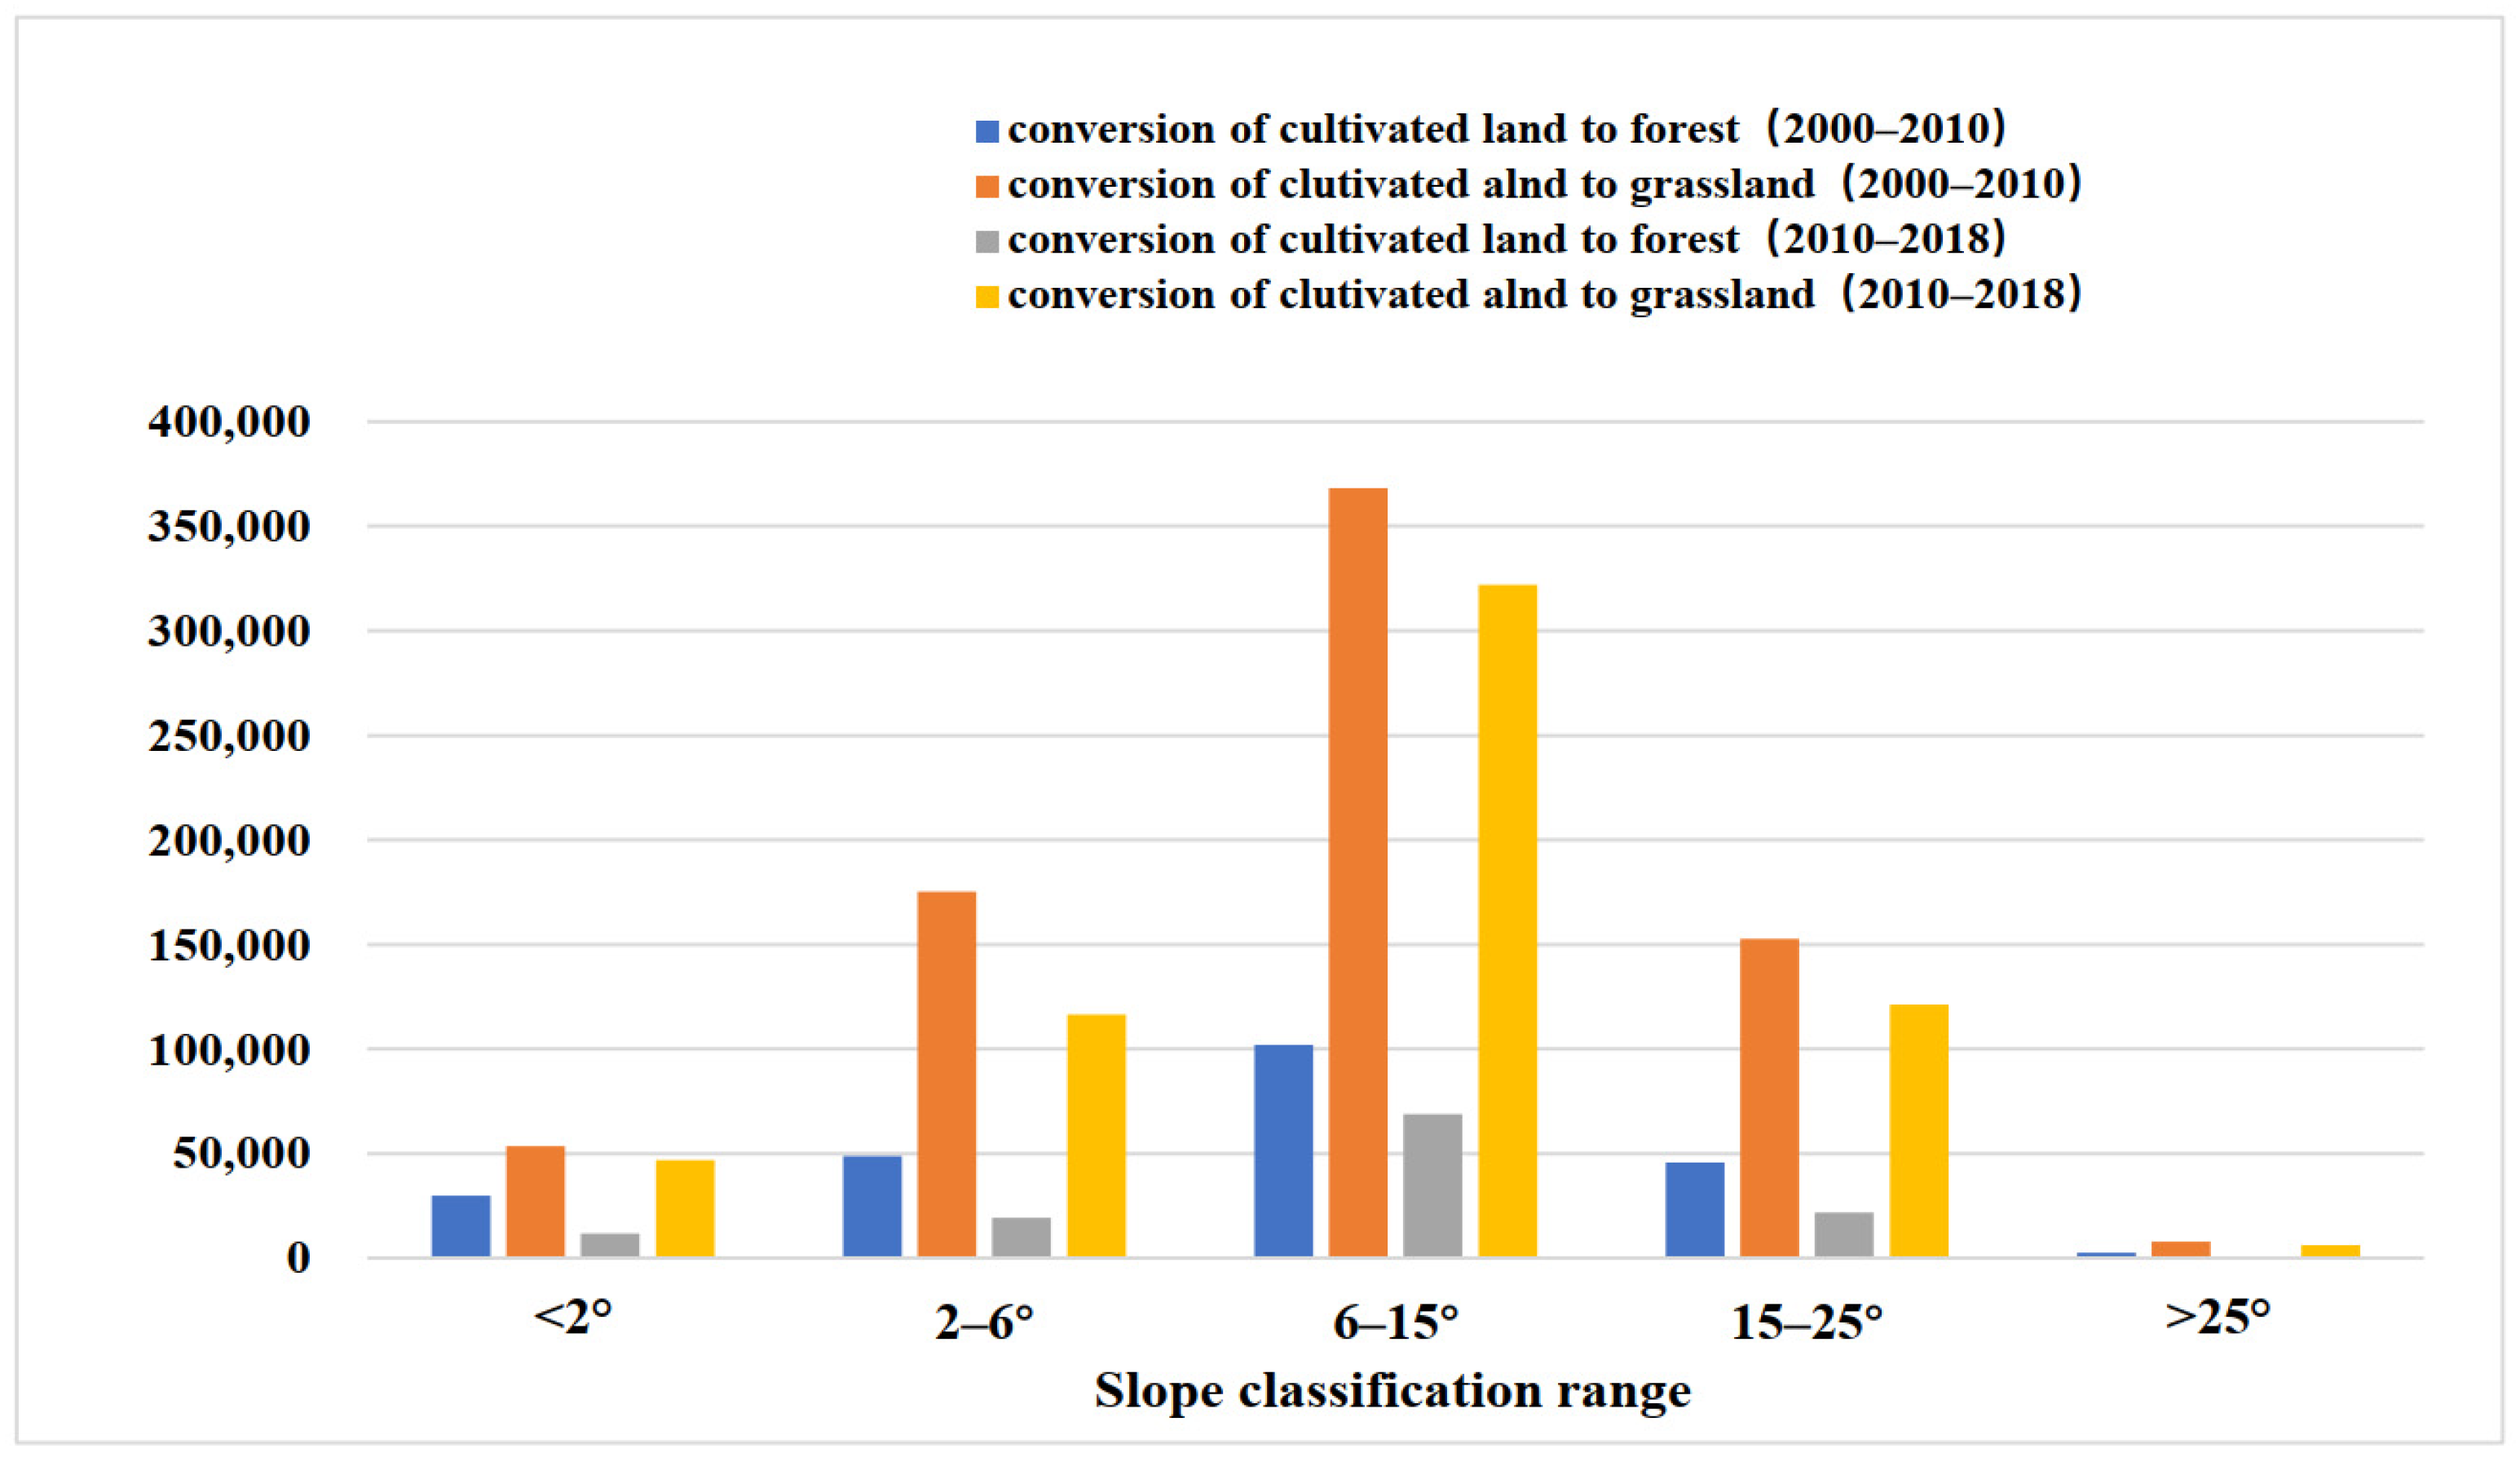
3.1.1. The Characteristics and Topographic Factor of LUCC
3.1.2. Land Use Change Magnitude and Dynamic Degree
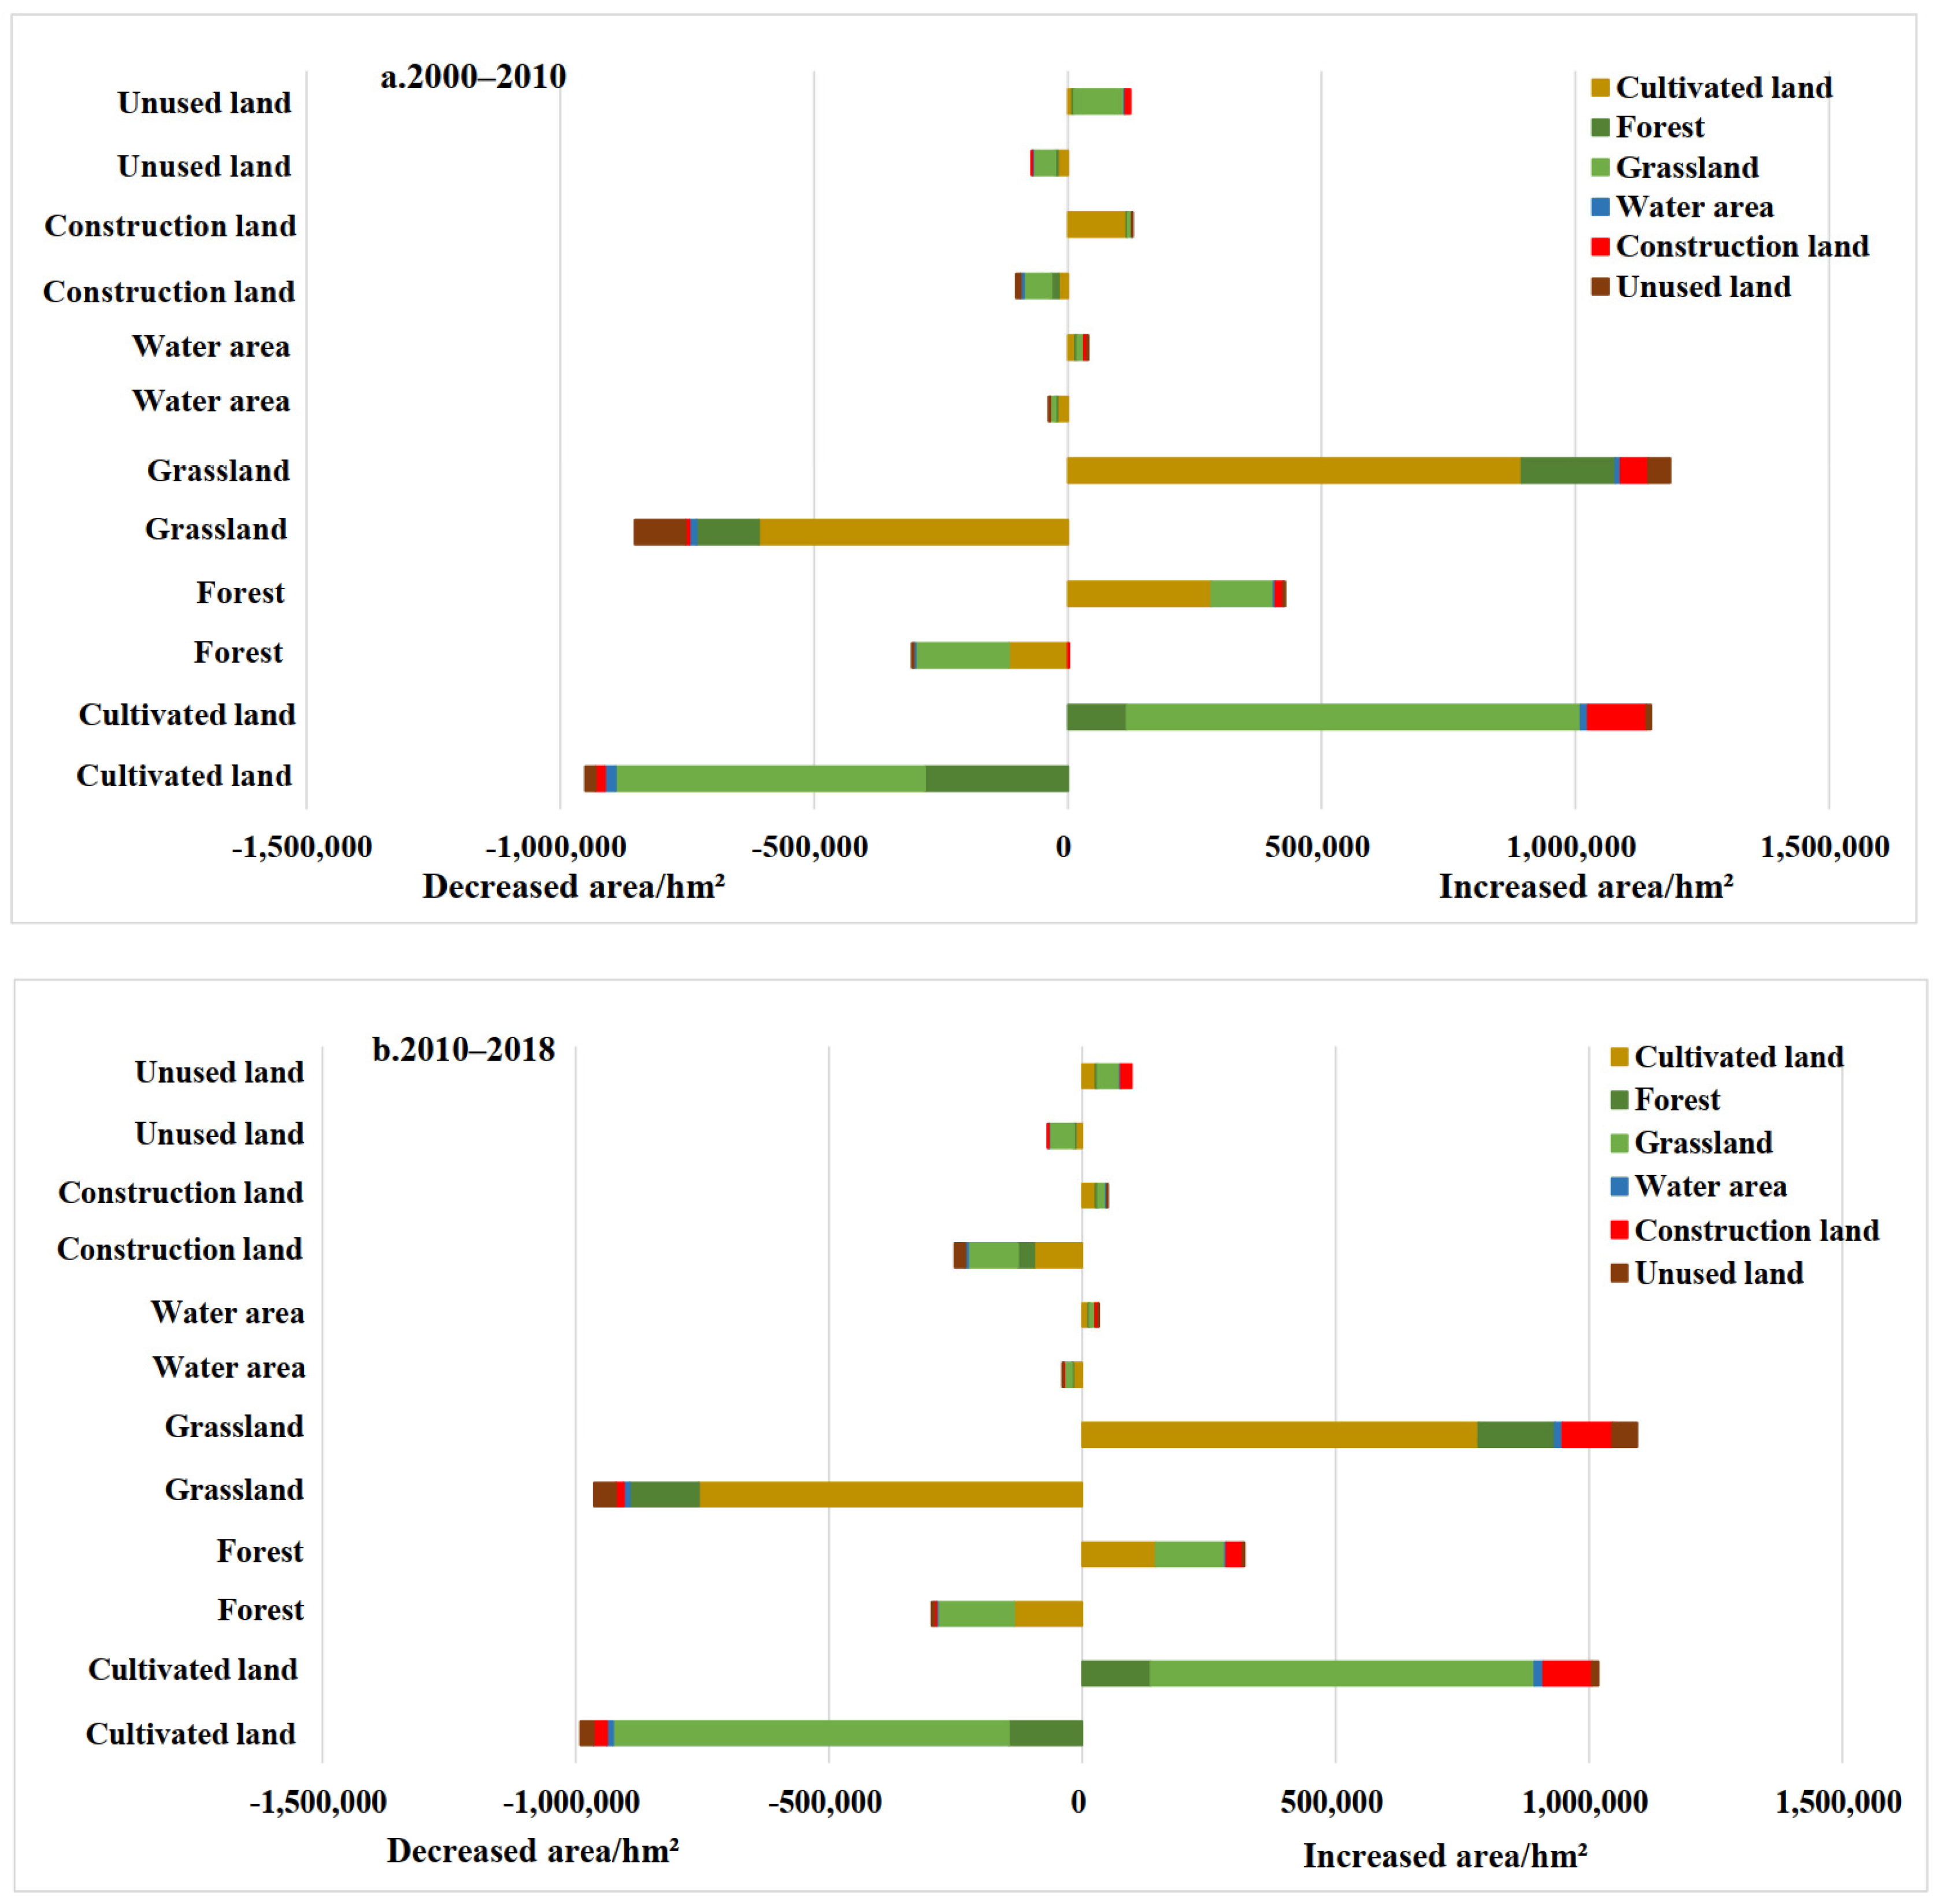
3.1.3. The Land Use Conversion Matrix
3.2. Results of the BLR Models
3.2.1. Results of the BLR Model from 2000 to 2010
3.2.2. Results of the BLR Model from 2010 to 2018
4. Discussion
4.1. The Impact of the Grain for Green Program (GGP) on Land Use Change
4.2. The Impact of the Driving Mechanism on Conversion of Cultivated Land to Forest Land and Grassland
5. Conclusions
Author Contributions
Funding
Institutional Review Board Statement
Informed Consent Statement
Data Availability Statement
Acknowledgments
Conflicts of Interest
Appendix A

Appendix B

Appendix C


References
- Vitousek, P.M.; Mooney, H.A.; Lubchenco, J.; Melillo, J.M. Human Domination of Earth’s Ecosystems. Science 1997, 277, 494–499. [Google Scholar] [CrossRef]
- Liu, J.G.; Diamond, J. China’s environment in a globalizing world. Nature 2005, 435, 1179–1186. [Google Scholar] [CrossRef] [PubMed]
- Yin, R.S.; Liu, C.; Zhao, M.J.; Yao, S.B.; Liu, H. The implementation and impacts of China’s largest payment for ecosystem services program as revealed by longitudinal household data. Land Use Policy 2014, 40, 45–55. [Google Scholar] [CrossRef]
- Xu, J.T.; Yin, R.S.; Li, Z.; Liu, C. China’s ecological rehabilitation: Unprecedented efforts, dramatic impacts, and requisite policies. Ecol. Econ. 2006, 57, 595–607. [Google Scholar] [CrossRef]
- Bryan, B.A.; Gao, L.; Ye, Y.Q.; Sun, X.F.; Connor, J.D.; Crossman, N.D.; Stafford-Smith, M.; Wu, J.; He, C.; Yu, D.; et al. China’s response to a national land-system sustainability emergency. Nature 2018, 559, 193–204. [Google Scholar] [CrossRef]
- Wang, G.Y.; Innes, J.L.; Lei, J.F.; Dai, S.Y.; Wu, S.W. China’s Forestry Reforms. Science 2007, 318, 1556–1557. [Google Scholar] [CrossRef]
- Liu, J.G.; Li, S.X.; Ouyang, Z.Y.; Tam, C.; Chen, X.D. Ecological and socioeconomic effects of China’s policies for ecosystem services. Proc. Natl. Acad. Sci. USA 2008, 105, 9477–9482. [Google Scholar] [CrossRef]
- Cao, S.X.; Chen, L.; Yu, X.X. Impact of China’s Grain for Green Project on the landscape of vulnerable arid and semi-arid agricultural regions: A case study in northern Shaanxi Province. J. Appl. Ecol. 2009, 46, 536–543. [Google Scholar] [CrossRef]
- NFGA (National Forestry and Grassland Administration). China Forestry Statistical Yearbook 2017; China Forestry Press: Beijing, China, 2018. [Google Scholar]
- Peng, H.; Cheng, G.; Xu, Z.; Yin, Y.; Xu, W. Social, economic, and ecological impacts of the ‘‘Grain for Green’’ project in China: A preliminary case in Zhangye, Northwest China. J. Environ. Manag. 2007, 85, 774–784. [Google Scholar] [CrossRef] [PubMed]
- Wang, Y.C.; Zhao, J.; Fu, J.W.; Wei, W. Effects of the Grain for Green Program on the water ecosystem services in an arid area of China—Using the Shiyang River Basin as an example. Ecol. Indic. 2019, 104, 659–668. [Google Scholar] [CrossRef]
- Liang, Y.C.; Li, S.Z.; Feldman, M.W.; Daily, G.C. Does household composition matter? The impact of the Grain for Green Program on rural livelihoods in China. Ecol. Econ. 2012, 75, 152–160. [Google Scholar] [CrossRef]
- Persson, M.; Moberg, J.; Ostwald, M.; Xu, J.T. The Chinese Grain for Green Programme: Assessing the carbon sequestered via land reform. J. Environ. Manag. 2013, 126, 142–146. [Google Scholar] [CrossRef] [PubMed]
- Fan, M.; Xiao, Y.T. Impacts of the grain for Green Program on the spatial pattern of land uses and ecosystem services in mountainous settlements in southwest China. Glob. Ecol. Conserv. 2020, 21, e00806. [Google Scholar] [CrossRef]
- Betru, T.; Tolera, M.; Sahleb, K.; Kassa, H. Trends and drivers of land use/land cover change in Western Ethiopia. Appl. Geogr. 2019, 104, 83–93. [Google Scholar] [CrossRef]
- Lambin, E.F.; Turner, B.L.; Geist, H.J.; Agbola, S.B.; Angelsen, A.; Bruce, J.W.; Coomes, O.T.; Dirzo, R.; Fischer, G.; Folke, C.; et al. The causes of land-use and land-cover change: Moving beyond the myths. Glob. Environ. Chang. 2001, 11, 261–269. [Google Scholar] [CrossRef]
- Tilman, D.; Fargione, J.; Wolff, B.; D’Antonio, C.; Dobson, A.; Howarth, R.; Schindler, D.; Schlesinger, W.H.; Simberloff, D.; Swackhamer, D. Forecasting agriculturally driven global Environmental Change. Science 2001, 292, 281–284. [Google Scholar] [CrossRef]
- Gao, P.; Niu, X.; Wang, B.; Zheng, Y.L. Land use changes and its driving forces in hilly ecological restoration area based on gis and rs of northern china. Sci. Rep. 2015, 5, 11038. [Google Scholar] [CrossRef]
- Bicudo da Silva, R.F.; Millington, J.D.A.; Moran, E.F.; Batistella, M.; Liu, J. Three decades of land-use and land-cover change in mountain regions of the Brazilian Atlantic Forest. Landsc. Urban. Plan. 2020, 204, 103948. [Google Scholar] [CrossRef]
- Wang, J.Y.; Liu, Y.S.; Liu, Z.G. Spatio-Temporal Patterns of Cropland Conversion in Response to the “Grain for Green Project” in China’s Loess Hilly Region of Yanchuan County. Remote Sens. 2013, 5, 5642–5661. [Google Scholar] [CrossRef]
- Zhou, D.C.; Zhao, S.Q.; Liu, S.G.; Zhang, L.X. Modeling the effects of the Sloping Land Conversion Program on terrestrial ecosystem carbon dynamics in the Loess Plateau: A case study with Ansai County, Shaanxi province, China. Ecol. Model. 2014, 288, 47–54. [Google Scholar] [CrossRef]
- Chen, H.; Kenyon, J.M.; Carr, D.L.; Liang, X.Y. Land cover and landscape changes in Shaanxi Province during China’s Grain for Green Program (2000–2010). Environ. Monit. Assess. 2015, 187, 644. [Google Scholar] [CrossRef] [PubMed]
- Wang, B.; Zhang, Z.Q. Land use change driven by Sloping Land Conversion Program in typical watershed on Loess Plateau and its rationality evaluation. Trans. Chin. Soc. Agric. Eng. 2017, 33, 235–245. [Google Scholar]
- Li, S.; Wang, T.; Yan, C.Z. Assessing the Role of Policies on Land-Use/Cover Change from 1965 to 2015 in the Mu Us Sandy Land, Northern China. Sustainability 2017, 9, 1164. [Google Scholar] [CrossRef]
- Wang, C.; Zhen, L.; Du, B.Z. Assessment of the impact of China’s Sloping Land Conservation Program on regional development in a typical hilly region of the loess plateau—A case study in Guyuan. Environ. Dev. 2017, 21, 66–76. [Google Scholar]
- Wang, H.; Liu, G.H.; Li, Z.S.; Ye, X.; Fu, B.J.; Lu, Y.H. Analysis of the Driving Forces in Vegetation Variation in the Grain for Green Program Region, China. Sustainability 2017, 9, 1853. [Google Scholar] [CrossRef]
- Qiu, L.; Wu, Y.; Wang, L.; Lei, X.; Liao, W.; Hui, Y.; Meng, X. Spatiotemporal response of the water cycle to land use conversions in a typical hilly–gully basin on the Loess Plateau, China. Hydrol. Earth Syst. Sci. 2017, 21, 6485–6499. [Google Scholar] [CrossRef]
- Zeng, L.; Li, J.; Zhou, Z.X.; Yu, Y.Y. Optimizing land use patterns for the Grain for Green Project based on the efficiency of ecosystem services under different objectives. Ecol. Indic. 2020, 114, 106347. [Google Scholar] [CrossRef]
- Liu, J.Y.; Wu, Y.; Wang, L.; Lei, X.; Liao, W.; Hui, Y.; Meng, X. Spatial patterns and driving forces of land use change in China during the early 21st century. J. Geogr. Sci. 2010, 20, 483–494. [Google Scholar] [CrossRef]
- Huang, S.L.; Zhou, H.J.; Wang, J.G.; Wang, Y.Y. Driving forces of returning cultivated land to forest and grass in China at different scales. J. Arid Land Resour. Environ. 2010, 2010. 24, 113–116. [Google Scholar]
- Du, Y.; Zhang, D.J.; Yao, S.B. Analysis of the Driving Forces of SLCP Based on the weights of Evidence Model-A Case Study of Wuqi, Shaanxi Province. Res. Soil Water Conserv. 2017, 24, 320–326. [Google Scholar]
- Liu, C.; Huo, Y.W.; Sun, P.L.; Xu, Y.Q.; Lu, L.H.; Huang, A. Changes in Cultivated Land and Influencing Factors before and after the Implementation of Grain for Green Project in Zhangjiakou City. J. Nat. Resour. 2018, 33, 1806–1820. [Google Scholar]
- Yin, R.S.; Xiang, Q.; Xu, J.T.; Deng, X.Z. Modeling the Driving Forces of the Land Use and Land Cover Changes Along the Upper Yangtze River of China. Environ. Manag. 2010, 45, 454–465. [Google Scholar] [CrossRef]
- Shi, M.Y.; Yin, R.S.; Lu, H.D. An empirical analysis of the driving forces of forest cover change in northeast China. For. Policy Econ. 2017, 78, 78–87. [Google Scholar] [CrossRef]
- Liu, Y.S.; Feng, W.L.; Li, Y.R. Modern agricultural geographical engineering and agricultural high-quality development: Case study of loess hilly and gully region. Acta Geogr. Sin. 2020, 75, 2029–2046. [Google Scholar]
- Liu, J.Y.; Ning, J.; Kuang, W.H.; Xu, X.L.; Zhang, S.W.; Yan, C.Z.; Li, R.D.; Wu, S.X.; Hu, Y.F.; Du, G.M.; et al. Temporal and spatial patterns and new features of land use change in China from 2010 to 2015. J. Geogr. Sin. 2018, 73, 789–802. [Google Scholar]
- Liu, J.Y.; Kuang, W.H.; Zhang, Z.X.; Xu, X.L.; Qin, Y.W.; Ning, J.; Zhou, W.C.; Zhang, S.W.; Li, R.D.; Yan, C.Z.; et al. Basic characteristics and spatial pattern of land use change in China since the late 1980s. J. Geogr. Sin. 2014, 69, 3–14. [Google Scholar]
- Liu, J.Y.; Zhang, Z.X.; Xu, X.L.; Kuang, W.H.; Zhou, W.C.; Zhang, S.W.; Li, R.D.; Yan, C.Z.; Yu, D.S.; Wu, S.X.; et al. Analysis of the spatial pattern and driving forces of land use change in China in the early 21st century. J. Geogr. Sin. 2009, 64, 1411–1420. [Google Scholar]
- Liu, J.Y. China Resources and Environment Remote Sensing Macroscopic Survey and Dynamic Research; China Science Technology Press: Beijing, China, 1996. [Google Scholar]
- Wang, X.L.; Bao, Y.H. Study on the methods of land use dynamic change research. Prog. Geogr. 1999, 18, 81–87. [Google Scholar]
- Bell, E.J. Markov analysis of land use change—An application of stochastic processes to remotely sensed data. Socio-Econ. Plan. Sci. 1974, 8, 311–316. [Google Scholar] [CrossRef]
- Zheng, J.K.; Yu, X.X.; Jia, G.D.; Xia, B. Dynamic evolution of the ecological service value based on lucc in miyun reservoir catchment. Trans. Chin. Soc. Agric. Eng. 2010, 26, 315–320. [Google Scholar]
- Draper, N.R.; Smith, H. Applied Regression Analysis; John Wiley and Sons: New York, NY, USA, 1981. [Google Scholar]
- Geoghegan, J.; Villar, S.C.; Klepeis, P.; Mendoza, P.M.; Ogneva-Himmelberger, Y.; Chowdhury, Y.Y.; Turner, B.L., II; Vance, C. Modeling tropical deforestation in the southern Yucatan peninsular region: Comparing survey and satellite data. Agric. Ecosyst. Environ. 2001, 85, 25–46. [Google Scholar] [CrossRef]
- Hosmer, D.W.; Lemeshow, S. Applied Regression Analysis; ohn Wiley and Sons: New York, NY, USA, 1989. [Google Scholar]
- Ludeke, A.K.; Maggio, R.C.; Reid, L.M. An analysis of anthropogenic deforestation using logistic regression and GIS. J. Environ. Manag. 1990, 31, 247–259. [Google Scholar] [CrossRef]
- Zhou, D.C.; Zhao, S.Q.; Zhu, C. The Grain for Green Project induced land cover change in the Loess Plateau: A case study with Ansai County, Shanxi Province, China. Ecol. Indic. 2012, 23, 88–94. [Google Scholar] [CrossRef]
- Xu, J.; Cao, Y. Efficiency and Sustainability of Converting Cropland to Forest and Grassland in The Western Region. In Implementing the Natural Forest Protection Program and the Sloping Land Conversion Program: Lessons and Policy Implications CCICED-WCFGTF; China Forestry Publishing House: Beijing, China, 2002. [Google Scholar]
- Zhao, A.Z.; Zhang, A.L.; Lu, C.Y.; Wang, D.L.; Wang, H.F.; Liu, H.X. Spatiotemporal variation of vegetation coverage before and after implementation of Grain for Green Program in Loess Plateau. China. Ecol. Eng. 2017, 104, 13–22. [Google Scholar] [CrossRef]
- Yang, H.Y.; Zhang, G.G.; Zhang, B.J. Growth Characteristics of Typical Plant Communities on Gully Slopes in the Loess Hilly-Gully Region. Res. Soil Water Conserv. 2019, 26, 62–67. [Google Scholar]
- Zhong, L.N.; Wang, J.; Zhao, W.W. Comparative analysis of the effect of rainfall pattern and land use pattern on soil erosion in different-scale watersheds: A case study in hilly and gully area of the Loess Plateau. Acta Geogr. Sin. 2017, 72, 432–443. [Google Scholar]
- Feng, Z.; Yang, Y.; Zhang, Y.; Zhang, P.; Li, Y. Grain-for-green policy and its impacts on grain supply in West China. Land Use Policy 2005, 22, 301–312. [Google Scholar] [CrossRef]
- Long, H.; Heilig, G.K.; Wang, J.; Li, X.; Luo, M.; Wu, X.; Zhang, M. Land use and soil erosion in the upper reaches of the Yangtze River: Some socio-economic considerations on China’s Grain-for-Green programme. Land. Degrad. Dev. 2006, 17, 589–603. [Google Scholar] [CrossRef]
- Zhao, J. The creation of farmland by gully filling on the Loess Plateau: A double-edged sword. Environ. Sci. Technol. 2014, 48, 883–884. [Google Scholar]
- Zhang, Y.; Xue, J.H.; Zhang, X. The Impact of the Policy of Returning Farmland to Forest on Farmers’ Income and Its Mechanism. Rural Econ. 2019, 6, 130–136. [Google Scholar]
- Hu, C.X.; Fu, B.J.; Chen, L.D.; Gulinck, H. Farmer’s attitudes towards the Grain-for-Green programme in the Loess hilly area, China: A case study in two small catchments. Catena 2003, 54, 303–316. [Google Scholar] [CrossRef]
- Liu, Y.; Dong, Y. Factors Influencing Farmers Willingness to Participate in Grain for Green Project in the Post-program Era. Econ. Geogr. 2014, 34, 131–138. [Google Scholar]
- Yang, L.; Fu, C. Spatial driving Force Analysis of Forest Land change in Ecological Barrier area of South Jiangxi. Geogr. Geo-Inf. Sci. 2018, 34, 58–62. [Google Scholar]
- Cao, Q.W.; Wu, J.S.; Tong, D.; Zhang, X.N.; Lu, Z.Q.; Si, M.L. Drivers of regional agricultural land changes based on spatial autocorrelation in the Pearl River Delta, China. Resour. Sci. 2016, 38, 714–727. [Google Scholar]
- Tang, K.L.; Zhang, K.L.; Lei, A.L. Critical slope gradient for compulsory abandonment of farmland on the hilly Loess Plateau. Chin. Sci. Bull. 1998, 43, 409–412. [Google Scholar] [CrossRef]
- Li, D.C.; Huang, J.; Ma, C.B.; Xue, Y.D.; Gao, J.S.; Wang, B.R.; Zhang, Y.Z.; Liu, K.L.; Han, T.F.; Zhang, H.M. Soil Organic Matter Content and Its Relationship with pH and Bulk Density in Agricultural Areas of China. J. Soil Water Conserv. 2020, 34, 252–258. [Google Scholar]
- Liu, Y.; Lu, Y.H.; Zheng, H.F.; Chen, L.D. Application of regression tree in analyzing the effects of climate factors on NDVI in loess hilly area of Shaanxi Province. Chin. J. Appl. Ecol. 2010, 5, 1153–1158. [Google Scholar]
- Chen, H.; Shi, Y.Y.; Ke, X.L.; Hao, J.M.; Chen, A.Q. Spatial optimization of land use based on the objective of coordinated ecological protection and economic development in Zhengzhou City. Resour. Sci. 2019, 41, 17–728. [Google Scholar]
- Chen, Y.P.; Zhang, Y. Sustainable Model of Rural Vitalization in Hilly and Gully Region on Loess Plateau. S T Soc. 2019, 34, 708–716. [Google Scholar]
- Jiang, N.; Bao, Q.; Song, Y.H. Driving Forces of Arable Land Change in Beijing Based on Logistic Regression Model. Arid Zone Res. 2017, 34, 1402–1409. [Google Scholar]
- Ke, S.F.; Zhao, T.Z. Empirical Analysis on Factors Influencing on Peasant Households’ Willingness of Participation in Conversion of Cultivated Land to Forest Land Program. China Land Sci. 2008, 22, 27–33. [Google Scholar]
- Rahman, S. Environmental impacts of technological change in Bangladesh agriculture: Farmers’ perceptions, determinants, and effects on resource allocation decisions. Agric. Econ. 2005, 33, 107–116. [Google Scholar] [CrossRef]
- Du, G.M.; Sun, X.B.; Liu, Y.S.; Zheng, H.Y.; Ma, R.H. Temporal and spatial-differentiation characteristics of ecological restoration in Loess Plateau. J. Geo-Inf. Sci. 2017, 19, 355–364. [Google Scholar]
- Zhu, J.J.; Shi, X.Y. Analysis of Spatial Autocorrelation Patterns of Land Use and Influence Factors in Loess Hilly Region—A Case Study of Changhe Basin of Jincheng City. Res. Soil Water Conserv. 2018, 25, 234–241. [Google Scholar]
- Mishra, A.K.; El-Osta, H.S.; Morehart, M.J.; Johnson, J.D.; Hopkins, J.W. Income, Wealth, and the Economic Services Programs: Accounting for Participant Heterogeneity. Environ. Econ. Policy 2002, 1, 235–254. [Google Scholar]
- Zhang, H.M.; Zhu, Z.S.; Fan, Y.J. The impact of environmental regulation on the coordinated development of environment and economy in China. Nat. Hazards 2018, 91, 473–489. [Google Scholar] [CrossRef]


| Land Use Type | Specification |
|---|---|
| Cultivated land | Refers to the land for planting crops, including mature cultivated land, newly reclaimed wasteland, recreational land, wheel rest, grassland rotation crops; land for fruit, mulberry, agriculture and forestry mainly planted with crops; and beach and tidal flats for more than three years. |
| Forest land | Refers to forest land used for growing trees, shrubs, bamboos, and coastal mangrove land. Includes natural forest with canopy closure greater than 30%, shrub wood with canopy closure greater than 40%, open woodland with canopy closure of 10–30%, and other forests. |
| Grassland | Refers to all types of grasslands that are dominated by growing herbaceous plants and have a coverage of more than 5%, including shrub grasses dominated by grazing and sparsely forested grasslands with a canopy closure below 10%. |
| Water area | Refers to natural or artificial land and land used for water conservancy facilities, including rivers, lakes, reservoir pits, etc. |
| Construction land | Refers to urban and rural residential areas, industrial and mining, transportation and other land outside the country, including urban, rural residential areas, and other construction land. |
| Unused land | Refers to unused land and hard to use land, including bare rocky gravel and bare land. |
| Variables | Description | Types of Variables | Unit |
|---|---|---|---|
| the GGP | Total Cumulative investment of the GGP from 2000 to 2010 and 2010 to 2018 | Continuous variable | ten thousand yuan |
| Natural variables | |||
| Elevation | Digital elevation model (DEM) | Continuous variable | m |
| Slope | Slope gradient derived from DEM | Dichotomous variable | ° |
| SOM | Soil Organic Matter | Continuous variable | % |
| Soil pH | pH values of soil | Continuous variable | NA |
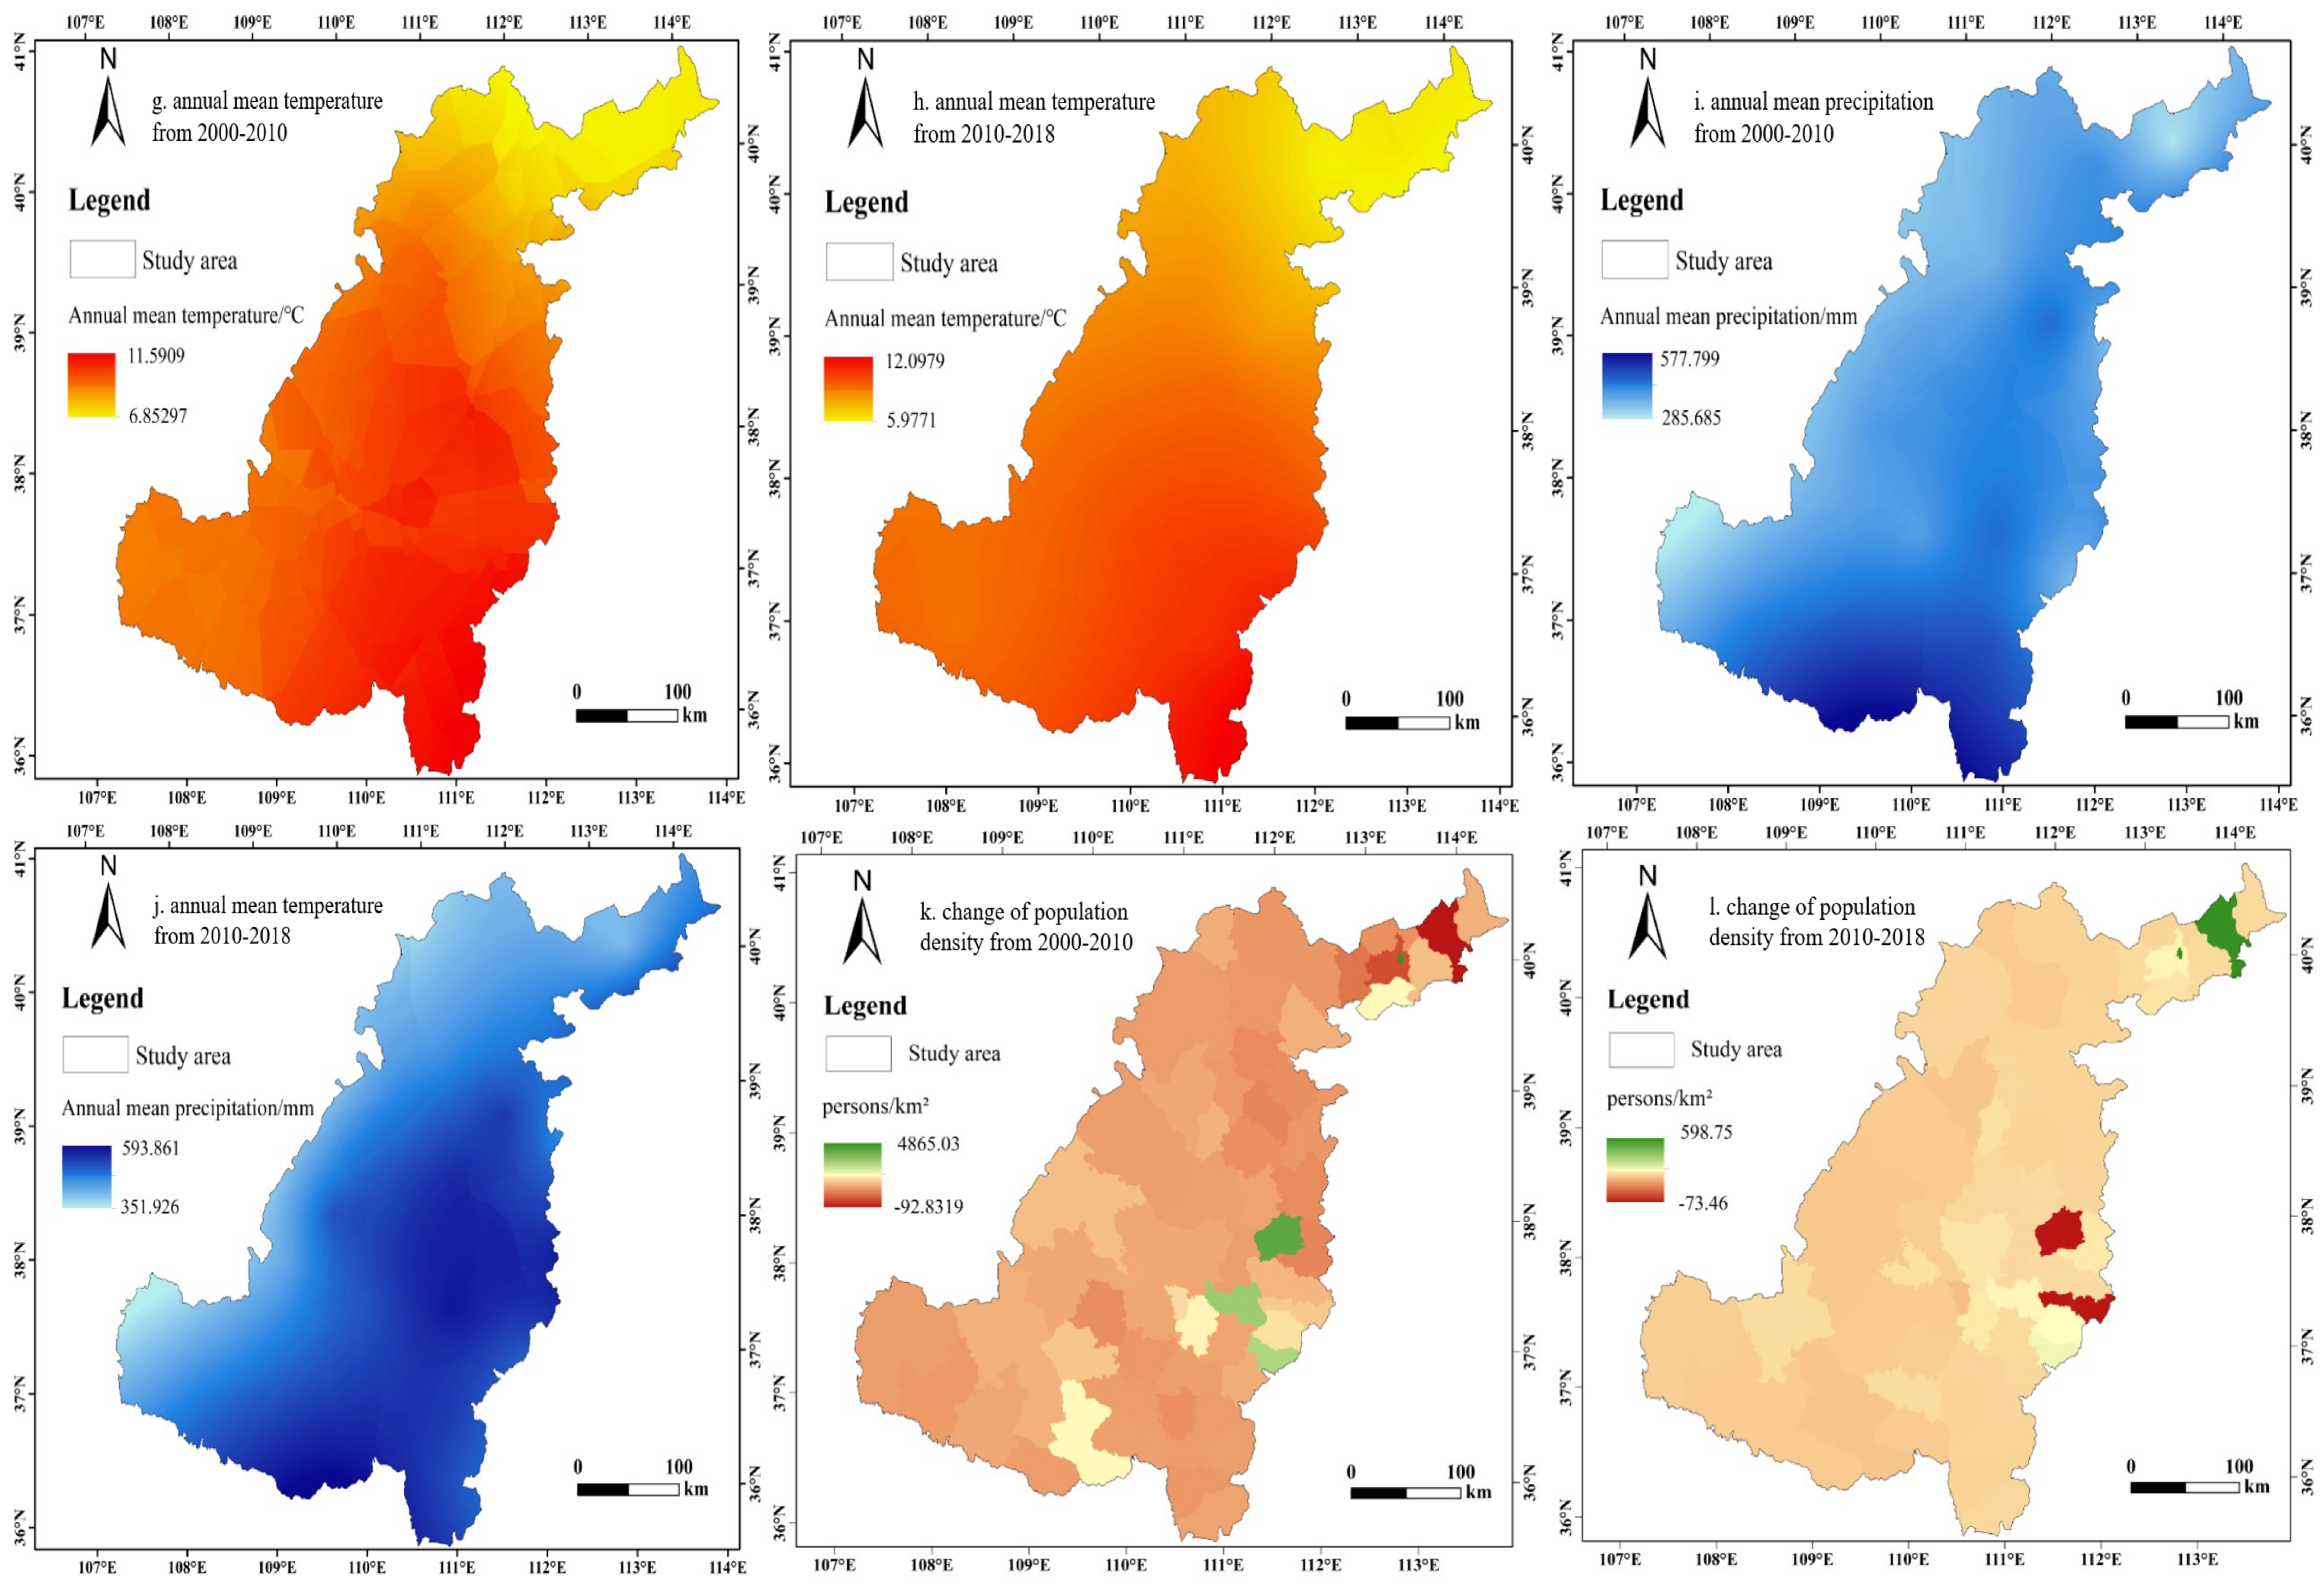
| Annual mean temperature | Average mean temperature from 2000 to 2010 and 2010 to 2018 | Continuous variable | ℃ |
| Annual mean precipitation | Average mean precipitation from 2000 to 2010 and 2010 to 2018 | Continuous variable | mm |
| Socio-economic variables | |||
| Population density | Changes of population density from 2000 to 2010 and 2010 to 2018 | Continuous variable | persons/km² |
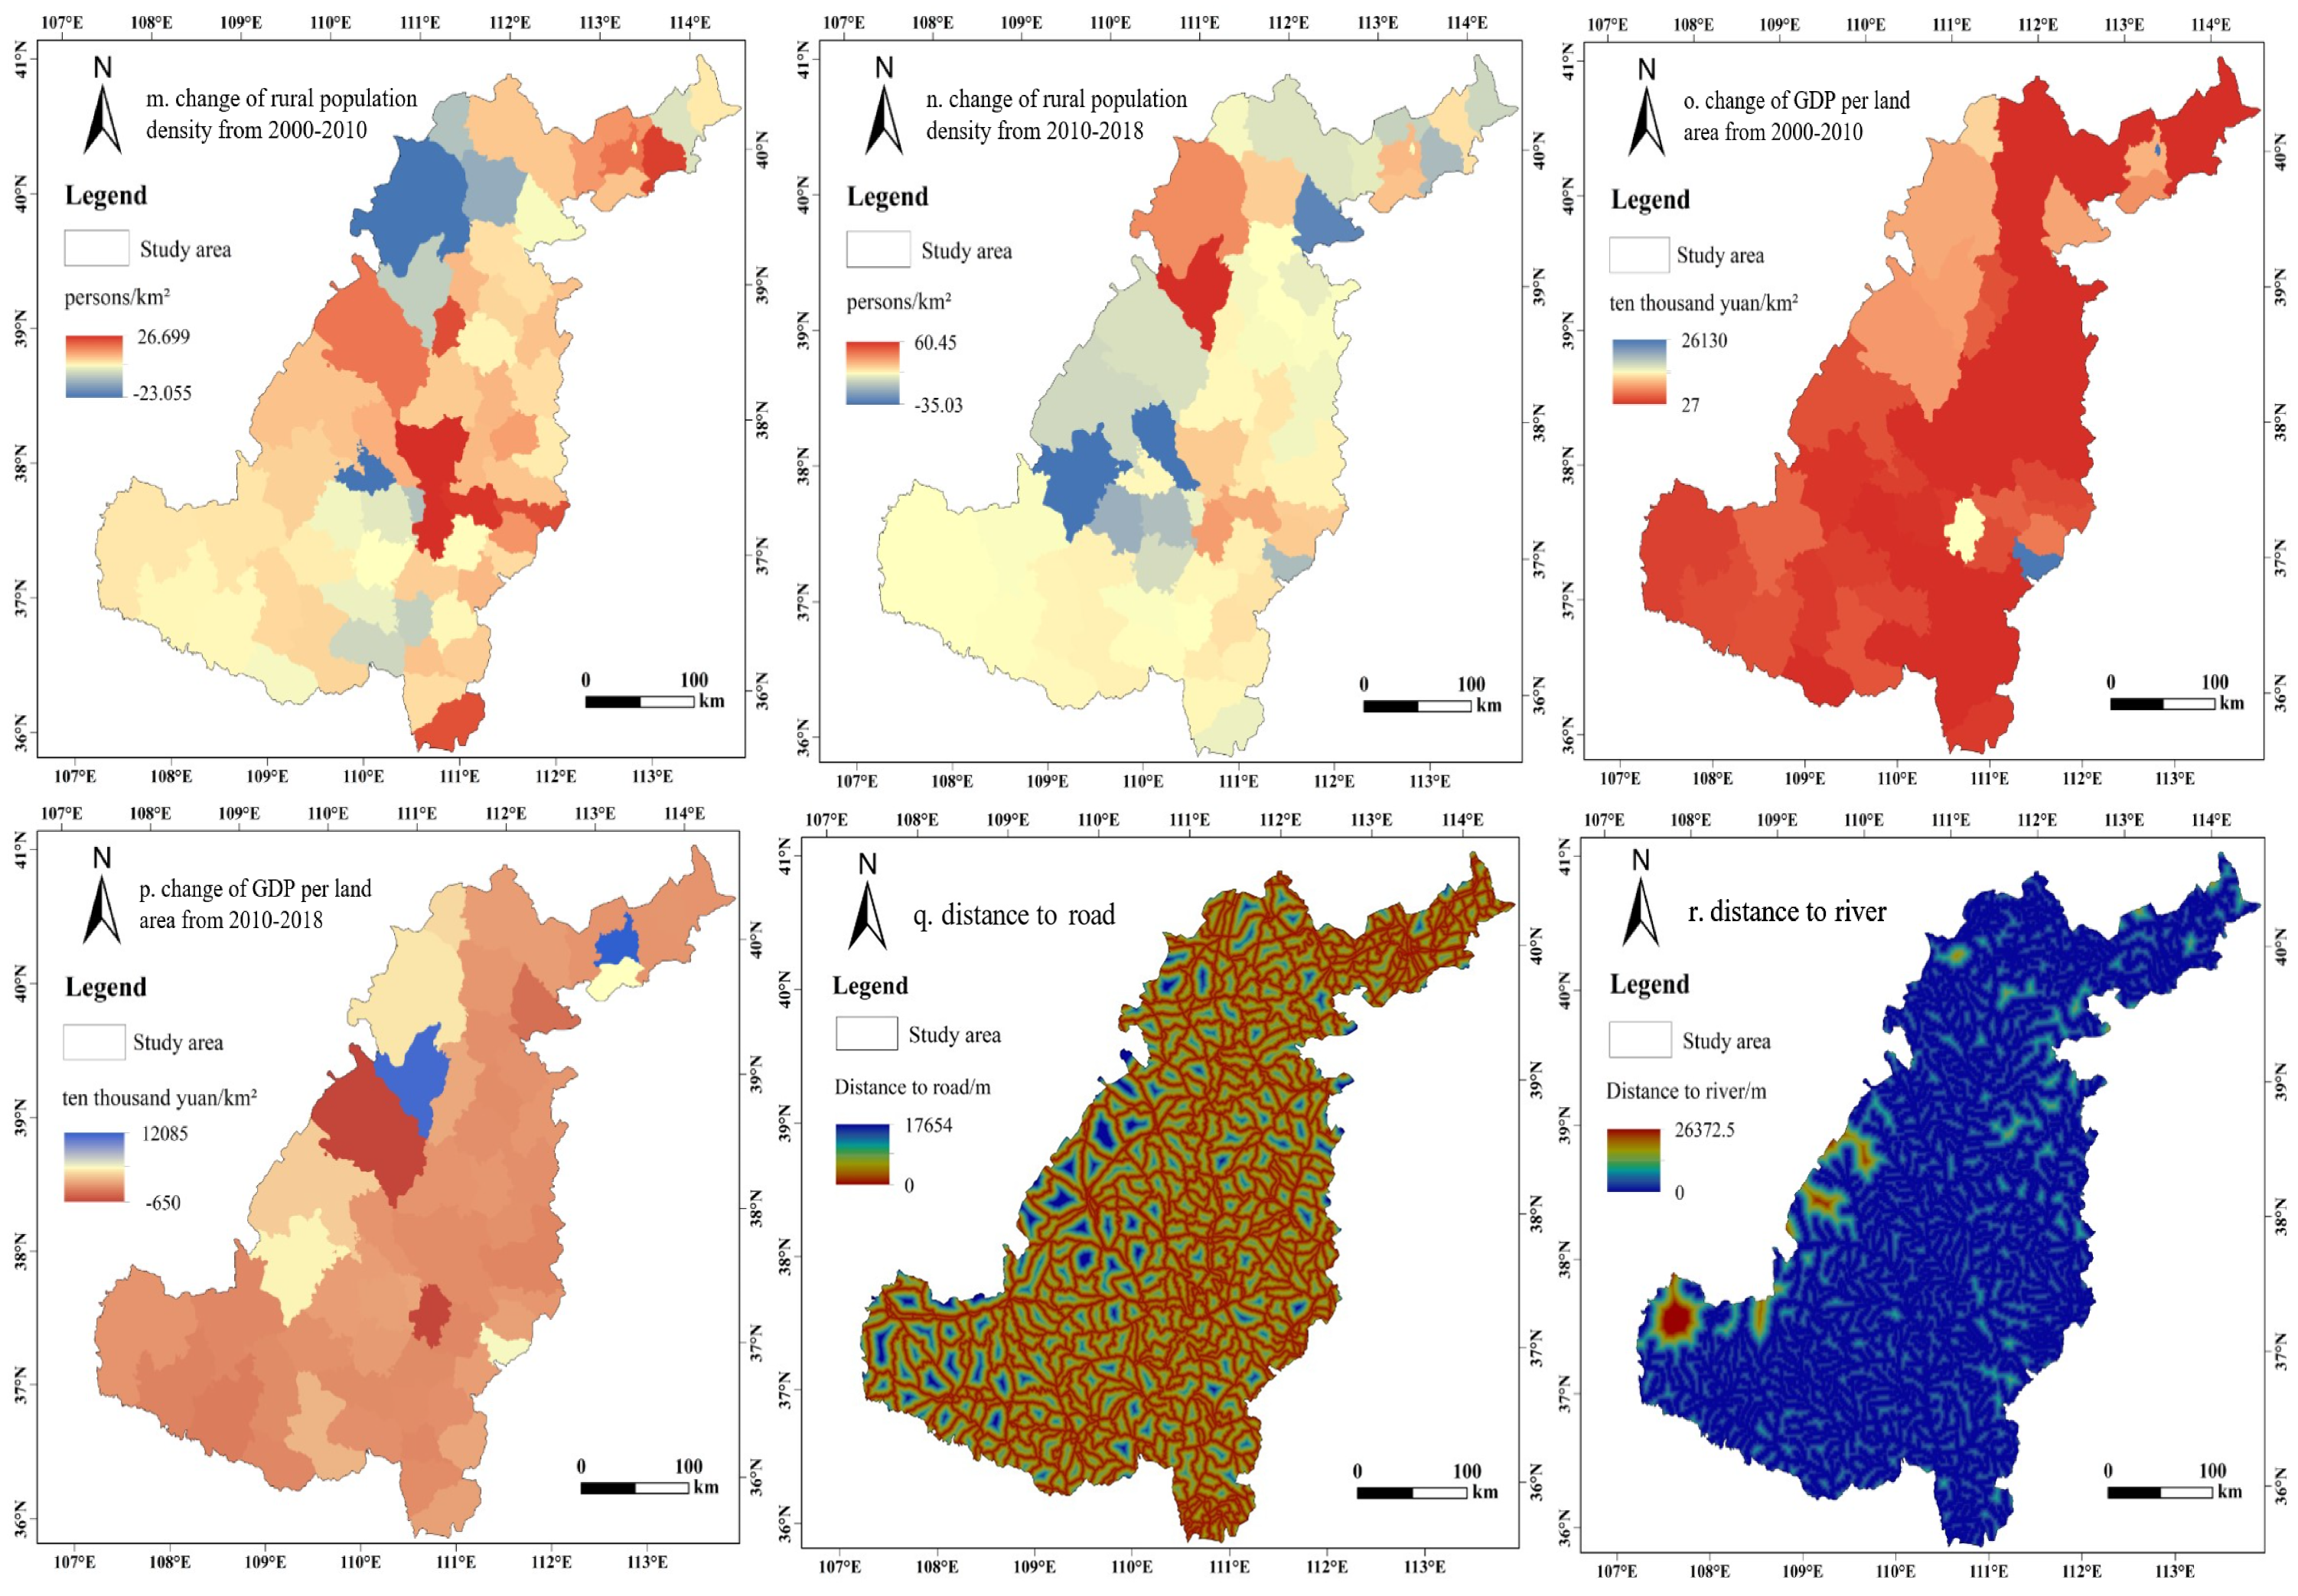
| Rural population density | Changes of rural population density from 2000 to 2010 and 2010 to 2018 | Continuous variable | persons/km² |
| GDP per land area | Changes of GDP per land area of 2000 to 2010 and 2010 to 2018 | Continuous variable | ten thousand yuan |
| Geographical variables | |||
| Dis_ road | Euclidean distance of each pixel to the closest major road | Continuous variable | m |
| Dis_ river | Euclidean distance of each pixel to the closest major river | Continuous variable | m |
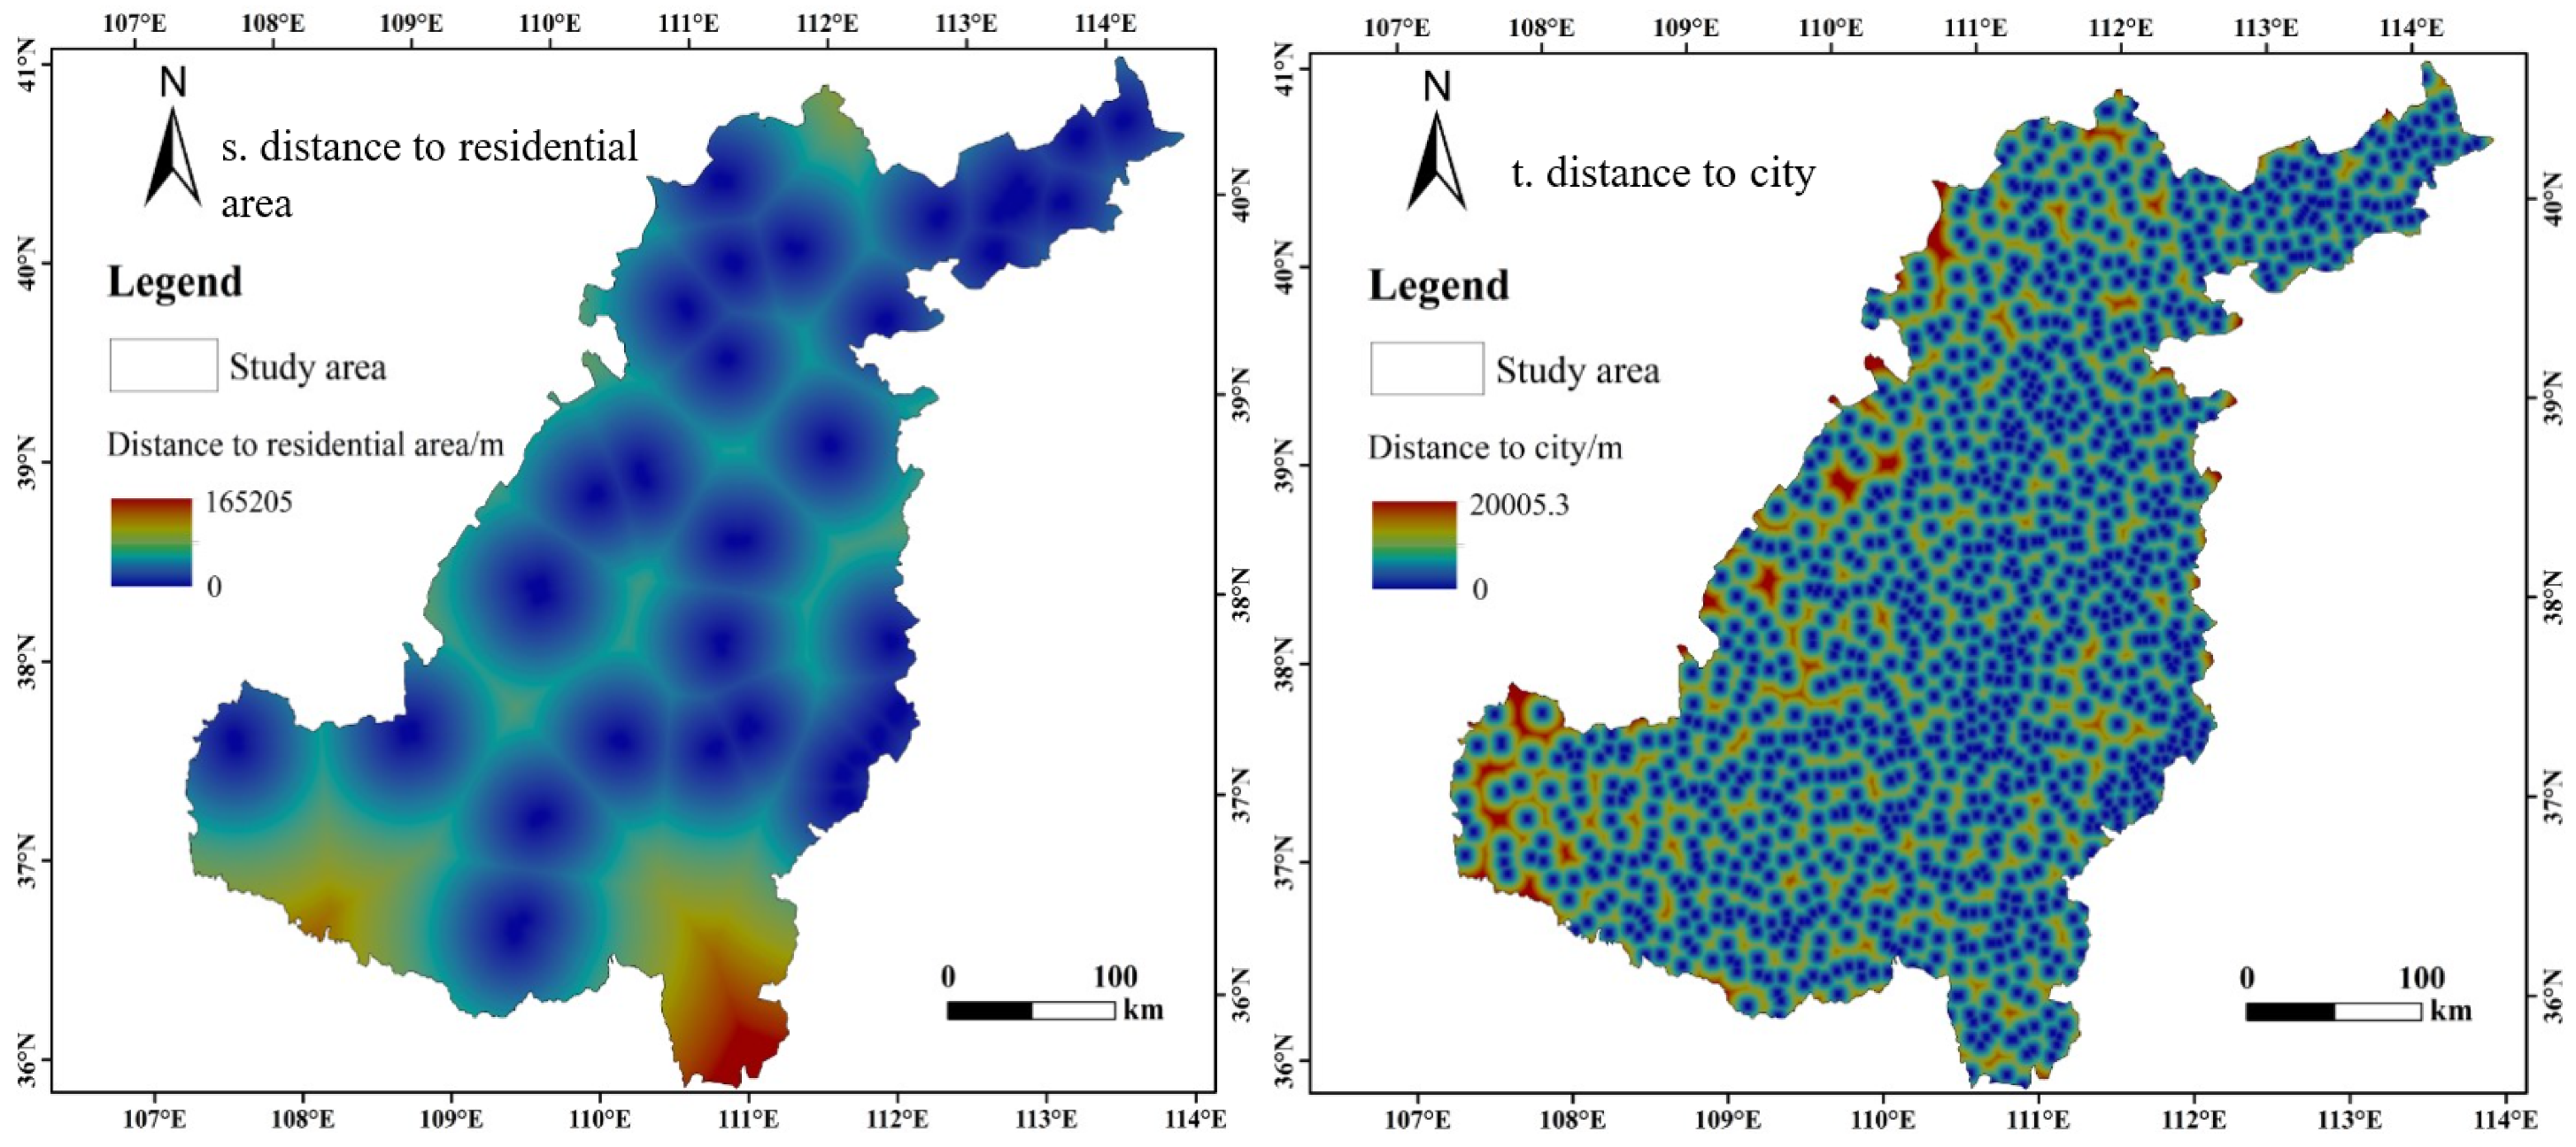
| Dis_ residential area | Euclidean distance of each pixel to the closest residential area | Continuous variable | m |
| Dis_ city | Euclidean distance of each pixel to the closest city | Continuous variable | m |
| Cultivated Land | Forest Land | Grassland | Water Area | Construction Land | Unused Land | ||
|---|---|---|---|---|---|---|---|
| Magnitude of LULC Change | |||||||
| Decreased part/hm² | 2000–2010 | 106,5131.37 | 212,411.16 | 730,227.96 | 38,277 | 25,077 | 109,096 |
| 2010–2018 | 825,070.05 | 259,053.39 | 887,063.4 | 26,116.02 | 40,619.88 | 78,554.61 | |
| Increased part/hm² | 2000–2010 | 784,662 | 386,031.42 | 922,339.71 | 25,730.46 | 161,757 | 47,998.98 |
| 2010–2018 | 802,691.37 | 240,603.21 | 780,929.1 | 32,488.29 | 204,238.26 | 55,527.12 | |
| Annual change rate (%) | 2000–2010 | −0.91% | 0.70% | 0.33% | −0.89% | 4.75% | −1.19% |
| 2010–2018 | −0.05% | −0.08% | −0.19% | 0.40% | 3.61% | −0.46% | |
| LULC total area/hm² | |||||||
| 2000 | 5,150,440.08 | 2,303,072.19 | 5,607,520.65 | 152,960.4 | 152,210.34 | 579,840.93 | |
| 2010 | 4,720,761.81 | 2,477,076.39 | 5,799,495.51 | 140,445.9 | 289,720.8 | 518,361.93 | |
| 2018 | 4,697,968 | 2,457,994 | 5,693,177 | 146,266 | 453,314 | 495,476.19 | |
| Driving Factors | Parameter Estimation (β) | Standard Error (S.E) | Test Statistic Waldχ2 | Significance (p) | Odds Ratio exp(β) |
|---|---|---|---|---|---|
| Constant | 2.358 | 0.703 | 11.245 | 0.001 *** | 10.565 |
| the GGP | 0.000 | 0.000 | 149.330 | 0.000 *** | 1.000 |
| Elevation | −0.002 | 0.000 | 181.567 | 0.000 *** | 0.998 |
| Slope | — | — | 42.862 | 0.000 | — |
| Slope II (2–6°) | 0.784 | 0.324 | 5.870 | 0.015 ** | 2.190 |
| Slope III (6–15°) | 1.297 | 0.314 | 17.115 | 0.000 *** | 3.659 |
| Slope IV (15–25°) | 1.061 | 0.307 | 11.947 | 0.001 *** | 2.889 |
| Slope V (>25°) | 0.821 | 0.310 | 7.025 | 0.008 *** | 2.274 |
| SOM | −0.049 | 0.068 | 0.514 | 0.473 | 0.952 |
| Soil pH | 0.216 | 0.047 | 21.378 | 0.000 *** | 1.241 |
| Annual mean temperature | −0.407 | 0.038 | 114.379 | 0.000 *** | 0.666 |
| Annual mean precipitation | 0.002 | 0.001 | 5.235 | 0.022 ** | 1.002 |
| Pop_ density | 0.004 | 0.002 | 3.514 | 0.061 | 1.004 |
| Rural pop_ density | 0.012 | 0.005 | 5.703 | 0.017 ** | 1.012 |
| GDP per land area | 0.000 | 0.000 | 36.456 | 0.000 *** | 1.000 |
| DIS_ road | 0.000 | 0.000 | 0.119 | 0.730 | 1.000 |
| DIS_ river | 0.000 | 0.000 | 14.401 | 0.000 *** | 1.000 |
| DIS_ residential area | 0.000 | 0.000 | 13.961 | 0.000 *** | 1.000 |
| DIS_ city | 0.000 | 0.000 | 8.611 | 0.003 *** | 1.000 |
| Driving Factors | Parameter Estimation (β) | Standard Error(S.E) | Test Statistic Waldχ2 | Significance (p) | Odds Ratio exp(β) |
|---|---|---|---|---|---|
| Constant | −2.073 | 0.648 | 10.224 | 0.001 *** | 0.126 |
| the GGP | 0.000 | 0.000 | 113.083 | 0.000 *** | 1.000 |
| Elevation | −0.001 | 0.000 | 96.363 | 0.000 *** | 0.999 |
| Slope | 28.763 | 0.000 | |||
| Slope II (2–6°) | −0.035 | 0.140 | 0.064 | 0.801 | 0.965 |
| Slope III (6–15°) | 0.465 | 0.141 | 10.842 | 0.001 *** | 1.591 |
| Slope IV (15–25°) | 0.531 | 0.182 | 8.480 | 0.004 *** | 1.700 |
| Slope V (>25°) | 0.512 | 0.352 | 2.110 | 0.146 | 1.668 |
| SOM | 0.062 | 0.064 | 0.929 | 0.335 | 1.064 |
| Soil pH | 0.191 | 0.049 | 15.255 | 0.000 *** | 1.210 |
| Annual mean temperature | −0.066 | 0.038 | 2.943 | 0.086 | 0.936 |
| Annual mean precipitation | 0.003 | 0.001 | 10.101 | 0.001 *** | 1.003 |
| Pop_ density | 0.000 | 0.002 | 0.019 | 0.891 | 1.000 |
| Rural pop_ density | −0.020 | 0.002 | 67.531 | 0.000 *** | 0.980 |
| GDP per land area | 0.000 | 0.000 | 13.089 | 0.000 *** | 1.000 |
| DIS_ road | 0.000 | 0.000 | 5.495 | 0.019 ** | 1.000 |
| DIS_ river | 0.000 | 0.000 | 0.342 | 0.559 | 1.000 |
| DIS_ residential area | 0.000 | 0.000 | 7.404 | 0.007 ** | 1.000 |
| DIS_ city | 0.000 | 0.000 | 0.008 | 0.929 | 1.000 |
Publisher’s Note: MDPI stays neutral with regard to jurisdictional claims in published maps and institutional affiliations. |
© 2021 by the authors. Licensee MDPI, Basel, Switzerland. This article is an open access article distributed under the terms and conditions of the Creative Commons Attribution (CC BY) license (http://creativecommons.org/licenses/by/4.0/).
Share and Cite
Zhang, X.; Deng, Y.; Hou, M.; Yao, S. Response of Land Use Change to the Grain for Green Program and Its Driving Forces in the Loess Hilly-Gully Region. Land 2021, 10, 194. https://doi.org/10.3390/land10020194
Zhang X, Deng Y, Hou M, Yao S. Response of Land Use Change to the Grain for Green Program and Its Driving Forces in the Loess Hilly-Gully Region. Land. 2021; 10(2):194. https://doi.org/10.3390/land10020194
Chicago/Turabian StyleZhang, Xiao, Yuanjie Deng, Mengyang Hou, and Shunbo Yao. 2021. "Response of Land Use Change to the Grain for Green Program and Its Driving Forces in the Loess Hilly-Gully Region" Land 10, no. 2: 194. https://doi.org/10.3390/land10020194
APA StyleZhang, X., Deng, Y., Hou, M., & Yao, S. (2021). Response of Land Use Change to the Grain for Green Program and Its Driving Forces in the Loess Hilly-Gully Region. Land, 10(2), 194. https://doi.org/10.3390/land10020194