Article

Greenhouse Gas Emissions from Forest Soils Reduced by Straw Biochar and Nitrapyrin Applications

1
Co-Innovation Center for Sustainable Forestry in Southern China, Nanjing Forestry University, Nanjing 210037, China
2
Department of Renewable Resources, University of Alberta, Edmonton, AB T6G 2E3, Canada
3
Department of Rural Construction Engineering, Jeonbuk National University, Jeollabukdo, Jeonju 54896, Korea
4
State Key Joint Laboratory of Environmental Simulation and Pollution Control, School of Environment, Tsinghua University, Beijing 100084, China
*
Author to whom correspondence should be addressed.
Land 2021, 10(2), 189; https://doi.org/10.3390/land10020189
Submission received: 22 January 2021 / Revised: 8 February 2021 / Accepted: 9 February 2021 / Published: 13 February 2021
(This article belongs to the Special Issue Forest Ecosystems: Protection and Restoration)

Abstract

:
Forestlands are widely distributed in the dominantly agricultural landscape in western Canada, and they play important ecological functions; such forestlands (e.g., shelterbelts) accumulate soil organic matter and may receive a substantial amount of nitrogen in the form of surface and subsurface runoff from adjacent croplands and become a significant source of emissions of greenhouse gases (GHGs) such as CO2, N2O, and CH4. Biochar and nitrapyrin applications could potentially mitigate GHG emissions, but their co-application in forest soils has not been studied. We investigated the effect of the application of biochars produced at low (300 °C; BC300) and high temperatures (700 °C; BC700) using canola (Brassica napus L.) straw and the effect of their co-application with nitrapyrin on GHG emissions and soil properties in a 35-day laboratory incubation experiment using forest soils collected from five shelterbelt sites. Results showed no significant interaction effect of biochar and nitrapyrin on the global warming potential (GWP) of the GHG emissions, and the GWP was 15.8% lower in the soil with nitrapyrin than without nitrapyrin application treatments. The GWP was significantly enhanced by BC300 addition due to a 26.9% and 627.1% increase in cumulative CO2 and N2O emissions, respectively, over the 35-day incubation. The GWP significantly decreased by BC700 addition due to a 27.1% decrease in cumulative CO2 emissions. However, biochar addition did not affect CH4 emissions, while nitrapyrin decreased CH4 uptake by 50.5%. With BC300 addition, soil-dissolved organic carbon and microbial biomass carbon increased by 26.5% and 33.9%, respectively, as compared to no biochar addition (CK). Soil pH increased by 0.16 and 0.37 units after the addition of BC300 and BC700, respectively. Overall, the effect of biochar and nitrapyrin was independent in mitigating GHG emissions and was related to the type of biochar applied and changes in soil properties.

Graphical Abstract

1. Introduction

Forestlands such as shelterbelts are widely distributed in the agricultural landscape in western Canada and play critical ecological functions such as protecting crops and enhancing carbon (C) sequestration [1,2]. Soils in these forestlands are little disturbed by human activities, which may store large amounts of C and nitrogen (N) that come from plant debris and runoff from adjacent croplands, and potentially release greenhouse gases (GHGs) such as CO2, N2O, and CH4 that influence climate change [3,4]. Reducing GHG emissions from such soils could help mitigate climate change [5].
Many strategies, such as adding amendments, have been developed to mitigate GHG emissions from soils [6,7,8]. Biochar, usually produced by pyrolysis of biomass, is increasingly being used as an amendment for improving soil quality and C sequestration [6] and for reducing GHG emissions in agricultural systems [6,9,10,11]. Compared to uncharred biomass, biochar could increase soil C stock and reduce atmospheric CO2 due to its slower decomposition and mineralization rates [12]. On the other hand, the biochar’s acid-buffering capacity and its liming effect can promote the last step of denitrification (the reduction of N2O to N2) and decrease N2O emissions [13].
Biochar’s impact on GHG emissions from soils may, however, vary depending on both biochar and soil characteristics [14,15]. The production condition such as pyrolysis temperature is a major factor that influences biochar properties [10,16,17]. For instance, biochars produced at high temperatures (e.g., 550 °C) usually have a greater surface area, pH, and porosity and a lower volatile matter concentration than biochars produced at low temperatures (e.g., 300 °C) when derived from the same feedstock [18,19]. These characteristics make biochars produced at high temperatures more effective in reducing GHG emissions than those produced at low temperatures [20]. Similarly, C and nutrient availabilities to microbes may be greater in biochars produced at low than at high temperatures, releasing more CO2 when added to soils due to enhancement of microbial activities [21,22]. Canola (Brassica napus L.) straw is a by-product from agriculture that can be potentially used to produce biochars that will benefit the agriculture sector and the environment. However, the effect of canola straw biochars on GHG emissions has rarely been studied, especially with biochars that are produced under different pyrolysis temperatures [23].
Nitrification inhibitors such as nitrapyrin are widely used in croplands to increase the effectiveness of N fertilization and reduce N2O emissions by decreasing nitrification rates [24,25]. Compared to cropland soils, forest soils are usually not fertilized. However, compared to natural forests, forestlands in the agricultural landscape may receive N input from surface and subsurface runoff from adjacent croplands that eventually cause more N2O emissions. Furthermore, nitrification inhibitors might interact with biochar when they are co-applied [26]. For instance, Li et al. [27] showed that applying nitrapyrin and wheat straw biochar together increased N2O emissions by 9% as compared with applying nitrapyrin alone, probably due to biochar adsorbing nitrapyrin and lowering the effectiveness of nitrapyrin in reducing nitrification rates. However, we tested the interaction effect of biochar and nitrapyrin on N2O emissions in cropland soils in another study and did not find a significant interaction [23]. On the other hand, nitrapyrin and biochar may also interactively affect the emission of other GHGs, such as CO2 and CH4, which have not been fully investigated in previous studies.
The objectives of this study were (1) to examine the effect of canola straw biochar produced at different temperatures (300 and 700 °C) and nitrapyrin application on soil properties (i.e., pH, dissolved organic C (DOC), microbial biomass C (MBC), and nitrate concentration) and CO2, N2O, and CH4 emissions from forest soils and (2) to examine the effect of biochar and nitrapyrin on the global warming potential (GWP) of GHG emissions to forest soils. We hypothesized that (1) the addition of the biochar produced at a high temperature (700 °C) would be more effective in reducing GHG emissions from the forest soils and that (2) the co-application of biochar and nitrapyrin would decrease more GHG emissions as compared with applying biochar alone.

2. Materials and Methods

2.1. Soil and Biochar

Soil samples were collected from five shelterbelt sites near Edmonton (53°32′0″ N, 113°30′0″ W), Alberta, Canada. The soils at all sites were black chernozemic soils according to the Canadian system of soil classification [28]. The distance between any two shelterbelts was greater than 20 km. At each shelterbelt site, 10 soil cores (0–10 cm layer) were collected at least 5 m apart from each other using an auger with a 5 cm diameter. These 10 soil cores were mixed to form a composite sample for each site; each sample represents one replicate for the lab incubation experiment described below. Soil samples were kept in a cooler with ice bags and transported to the lab right away. Soil properties were determined after litter and plant roots were removed and gently sieved through a 2 mm sieve.
Biochars were produced using canola straw at low (300 °C) and high (700 °C) temperatures. The straw was oven-dried at 60 °C for 24 h and chopped into small pieces (less than 10 mm long) before pyrolysis. The heating rate was 10 °C min−1. The low-temperature biochar had a pH of 7.68, an ash content of 8.1%, a surface area of 2.8 m2 g−1, and C and N contents of 632.5 and 15.8 g kg−1 (on a dry-weight basis), respectively. The high-temperature biochar had a pH of 10.93, an ash content of 15.9%, a surface area of 4.2 m2 g−1, and C and N content of 787.7 and 13.7 g kg−1, respectively, based on data from Kwak et al. [19].

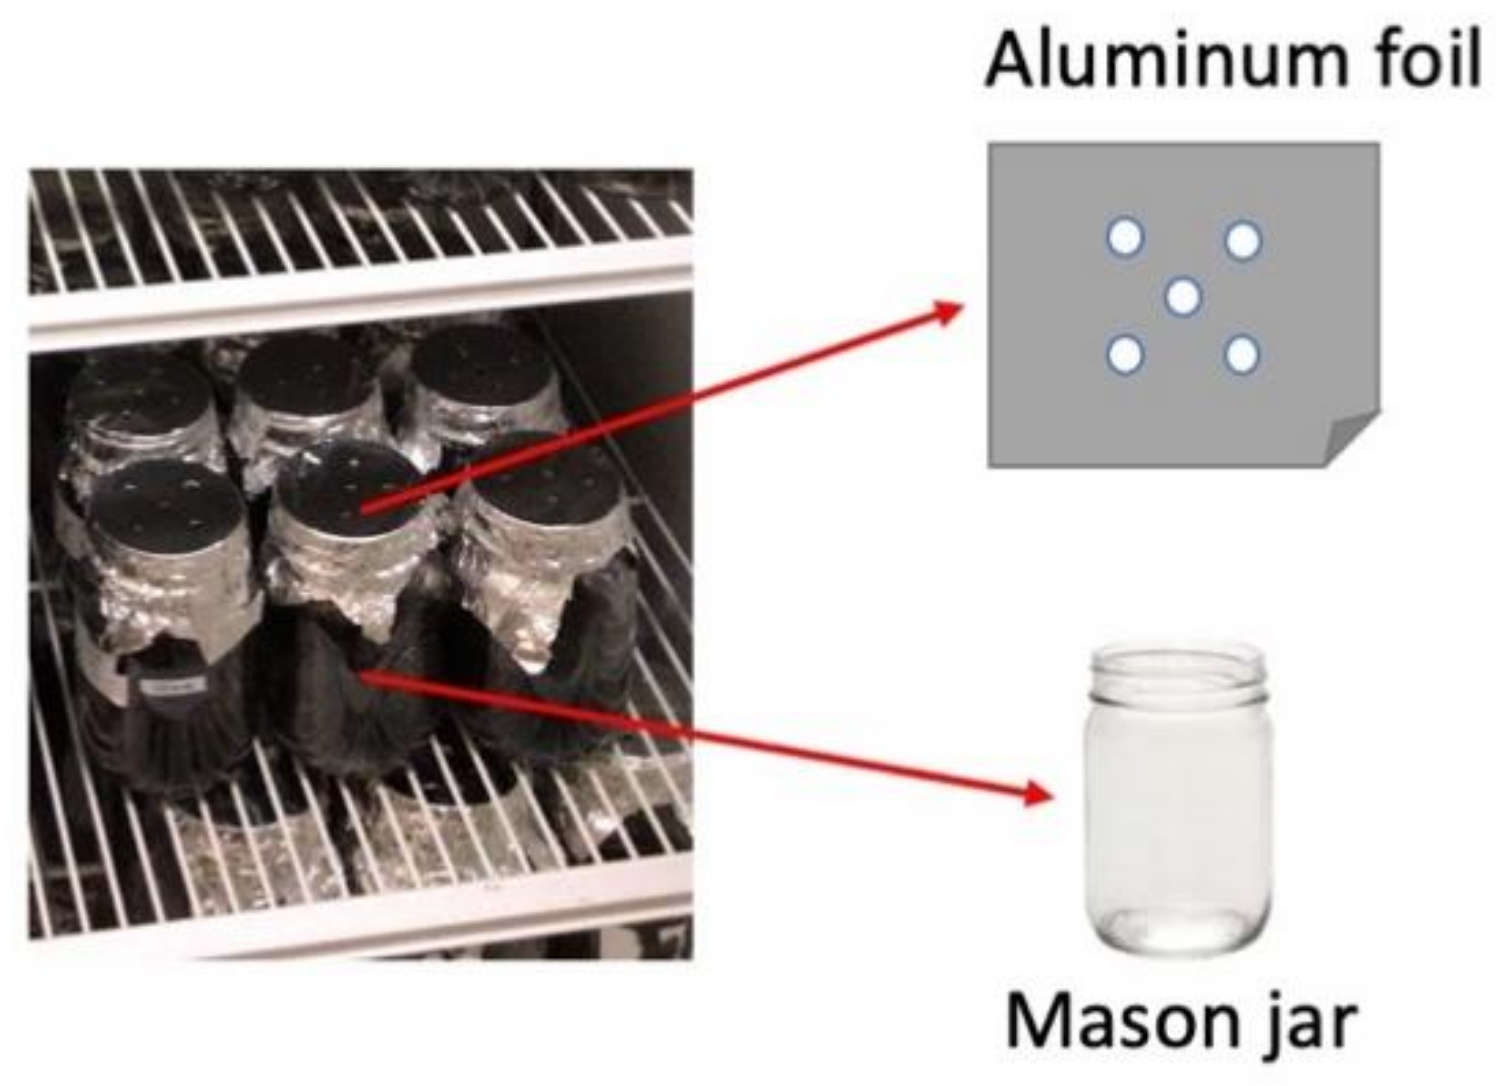
2.2. Experimental Design and Incubation Procedure

A two-factor completely randomized factorial design with five replicates for each treatment was used for the laboratory incubation experiment. One factor is biochar application, which had three levels: untreated soil with no biochar application (CK), low-temperature biochar application (BC300), and high-temperature biochar application (BC700). The other factor is nitrapyrin application, which had two levels: no nitrapyrin application and nitrapyrin application. Thus, there were six treatment combinations in total. The application rate of biochar and nitrapyrin was 2% (w:w; oven-dry-weight basis, equivalent to 4.5 Mg ha−1) [20] and 80 mg kg−1 (w:w, equivalent to 180 kg ha−1) [29], respectively.
For measuring GHG emissions, 100 g (oven-dry equivalent) of fresh soil was mixed with biochar and/or nitrapyrin thoroughly, as needed, and then was placed into a 500 mL Mason jar to measure GHG fluxes. A 3-day pre-incubation was conducted under 40% water-holding capacity (WHC) at 25 °C in the dark to activate microbial activities. The water content was then brought to 60% WHC and maintained at that level throughout the 35-day incubation period by adding deionized water periodically based on weight loss.

2.3. Gas Sampling and Analysis

Gas samples were collected from the headspace of the Mason jars on days 0 (after pre-incubation), 1, 3, 5, 7, 10, 13, 18, 23, 28, and 35. For gas sampling, the Mason jars were sealed tightly for 24 h on those sampling days. After the lid was closed, a 5 mL gas sample was taken using a 10 mL syringe four times: 0, 6, 12, and 24 h. The gas sample was then injected into a pre-evacuated 3 mL Labco exetainer to get a positive pressure for the GHG measurement. The Mason jars were covered with aluminum foils punched with several small holes on non-sampling days to minimize water loss from the jars and to allow the system to be maintained in an aerobic condition (Figure 1). The GHG concentrations were determined using a gas chromatograph (Varian CP-3800, Mississauga, ON, Canada) that was equipped with a thermal conductivity detector (for detecting CO2), an electron capture detector (for detecting N2O), and a flame ionization detector (for detecting CH4). Linear interpolation was used to calculate GHG emissions on non-sampling days. The GWP was calculated after soil GHG units were converted to mg CO2-C equivalent kg−1 of soil based on AR5 100-year GWP values as follows [3]: GWP = (CO2 × 1) + (N2O × 265) + (CH4 × 28).

2.4. Soil Analysis

Soil samples were collected destructively at the end of the incubation from the Mason jars on day 35. Soil pH was determined using a Thermo Scientific pH meter (710A, Beverly, MA, USA) in a 1:5 soil:water (w:v) supernatant. The soil DOC in a 1:5 soil:0.5 mol L−1 K2SO4 solution (w:v) filtrate was determined using a TOC-TNM1 analyzer (Shimadzu Corporation, Kyoto, Japan). For determining the soil MBC, chloroform-fumigated (at 25 °C, in the dark) and non-fumigated fresh soil samples were extracted using a 1:5 soil:0.5 mol L−1 K2SO4 solution (w:v). The extractions were then filtered, and the C in the filtrate was determined using the TOC-TNM1 analyzer described above to calculate the MBC with a coefficient of 0.45 [30,31]. For determining soil net nitrification rates, soil-extractable NO3 before and after the incubation was analyzed colorimetrically using the vanadium oxidation method [32]. The net nitrification rates were calculated by dividing changes in the extractable NO3 pool size by the number of days in the incubation [33].

2.5. Data Analysis

All data analysis was conducted using R software [34]. The assumptions of normality and homogeneity of variance were tested by evaluating the residual plots. Natural log-transform was performed for the cumulative N2O data that were not normally distributed. The effects of the treatments on cumulative GHG emissions, GWP, soil pH, DOC, MBC, and net nitrification rates were tested using a linear mixed-effects model (LMM), with biochar and nitrapyrin as fixed factors and the sampling site (replication) as a random factor. Post hoc comparison of least-square means under different biochar treatments with and without nitrapyrin was conducted using the lsmean function in the emmeans package in R at a significance level of α = 0.05. Tukey’s test was used to conduct multiple comparisons among the biochar treatments.

3. Results

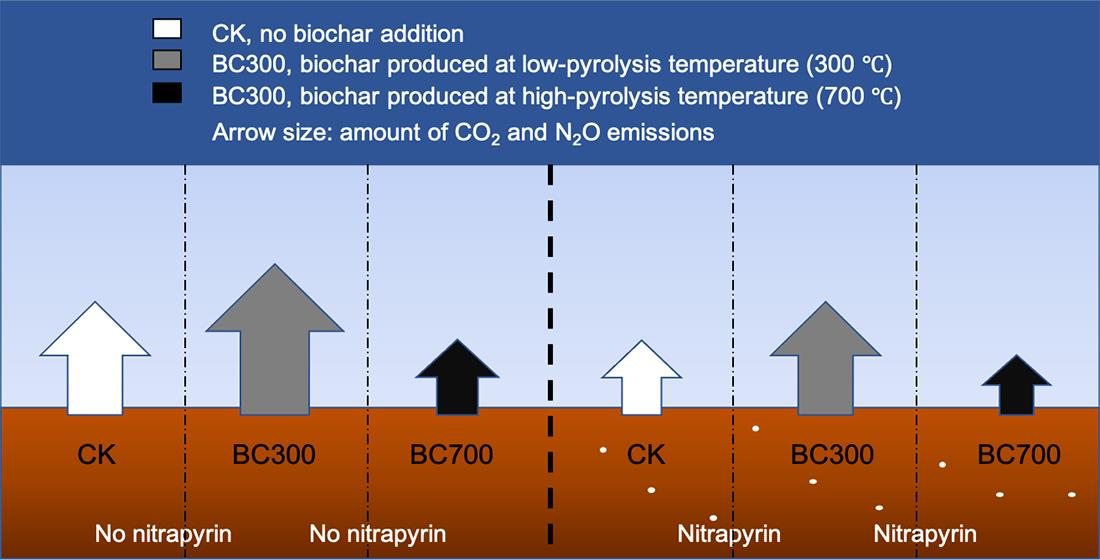
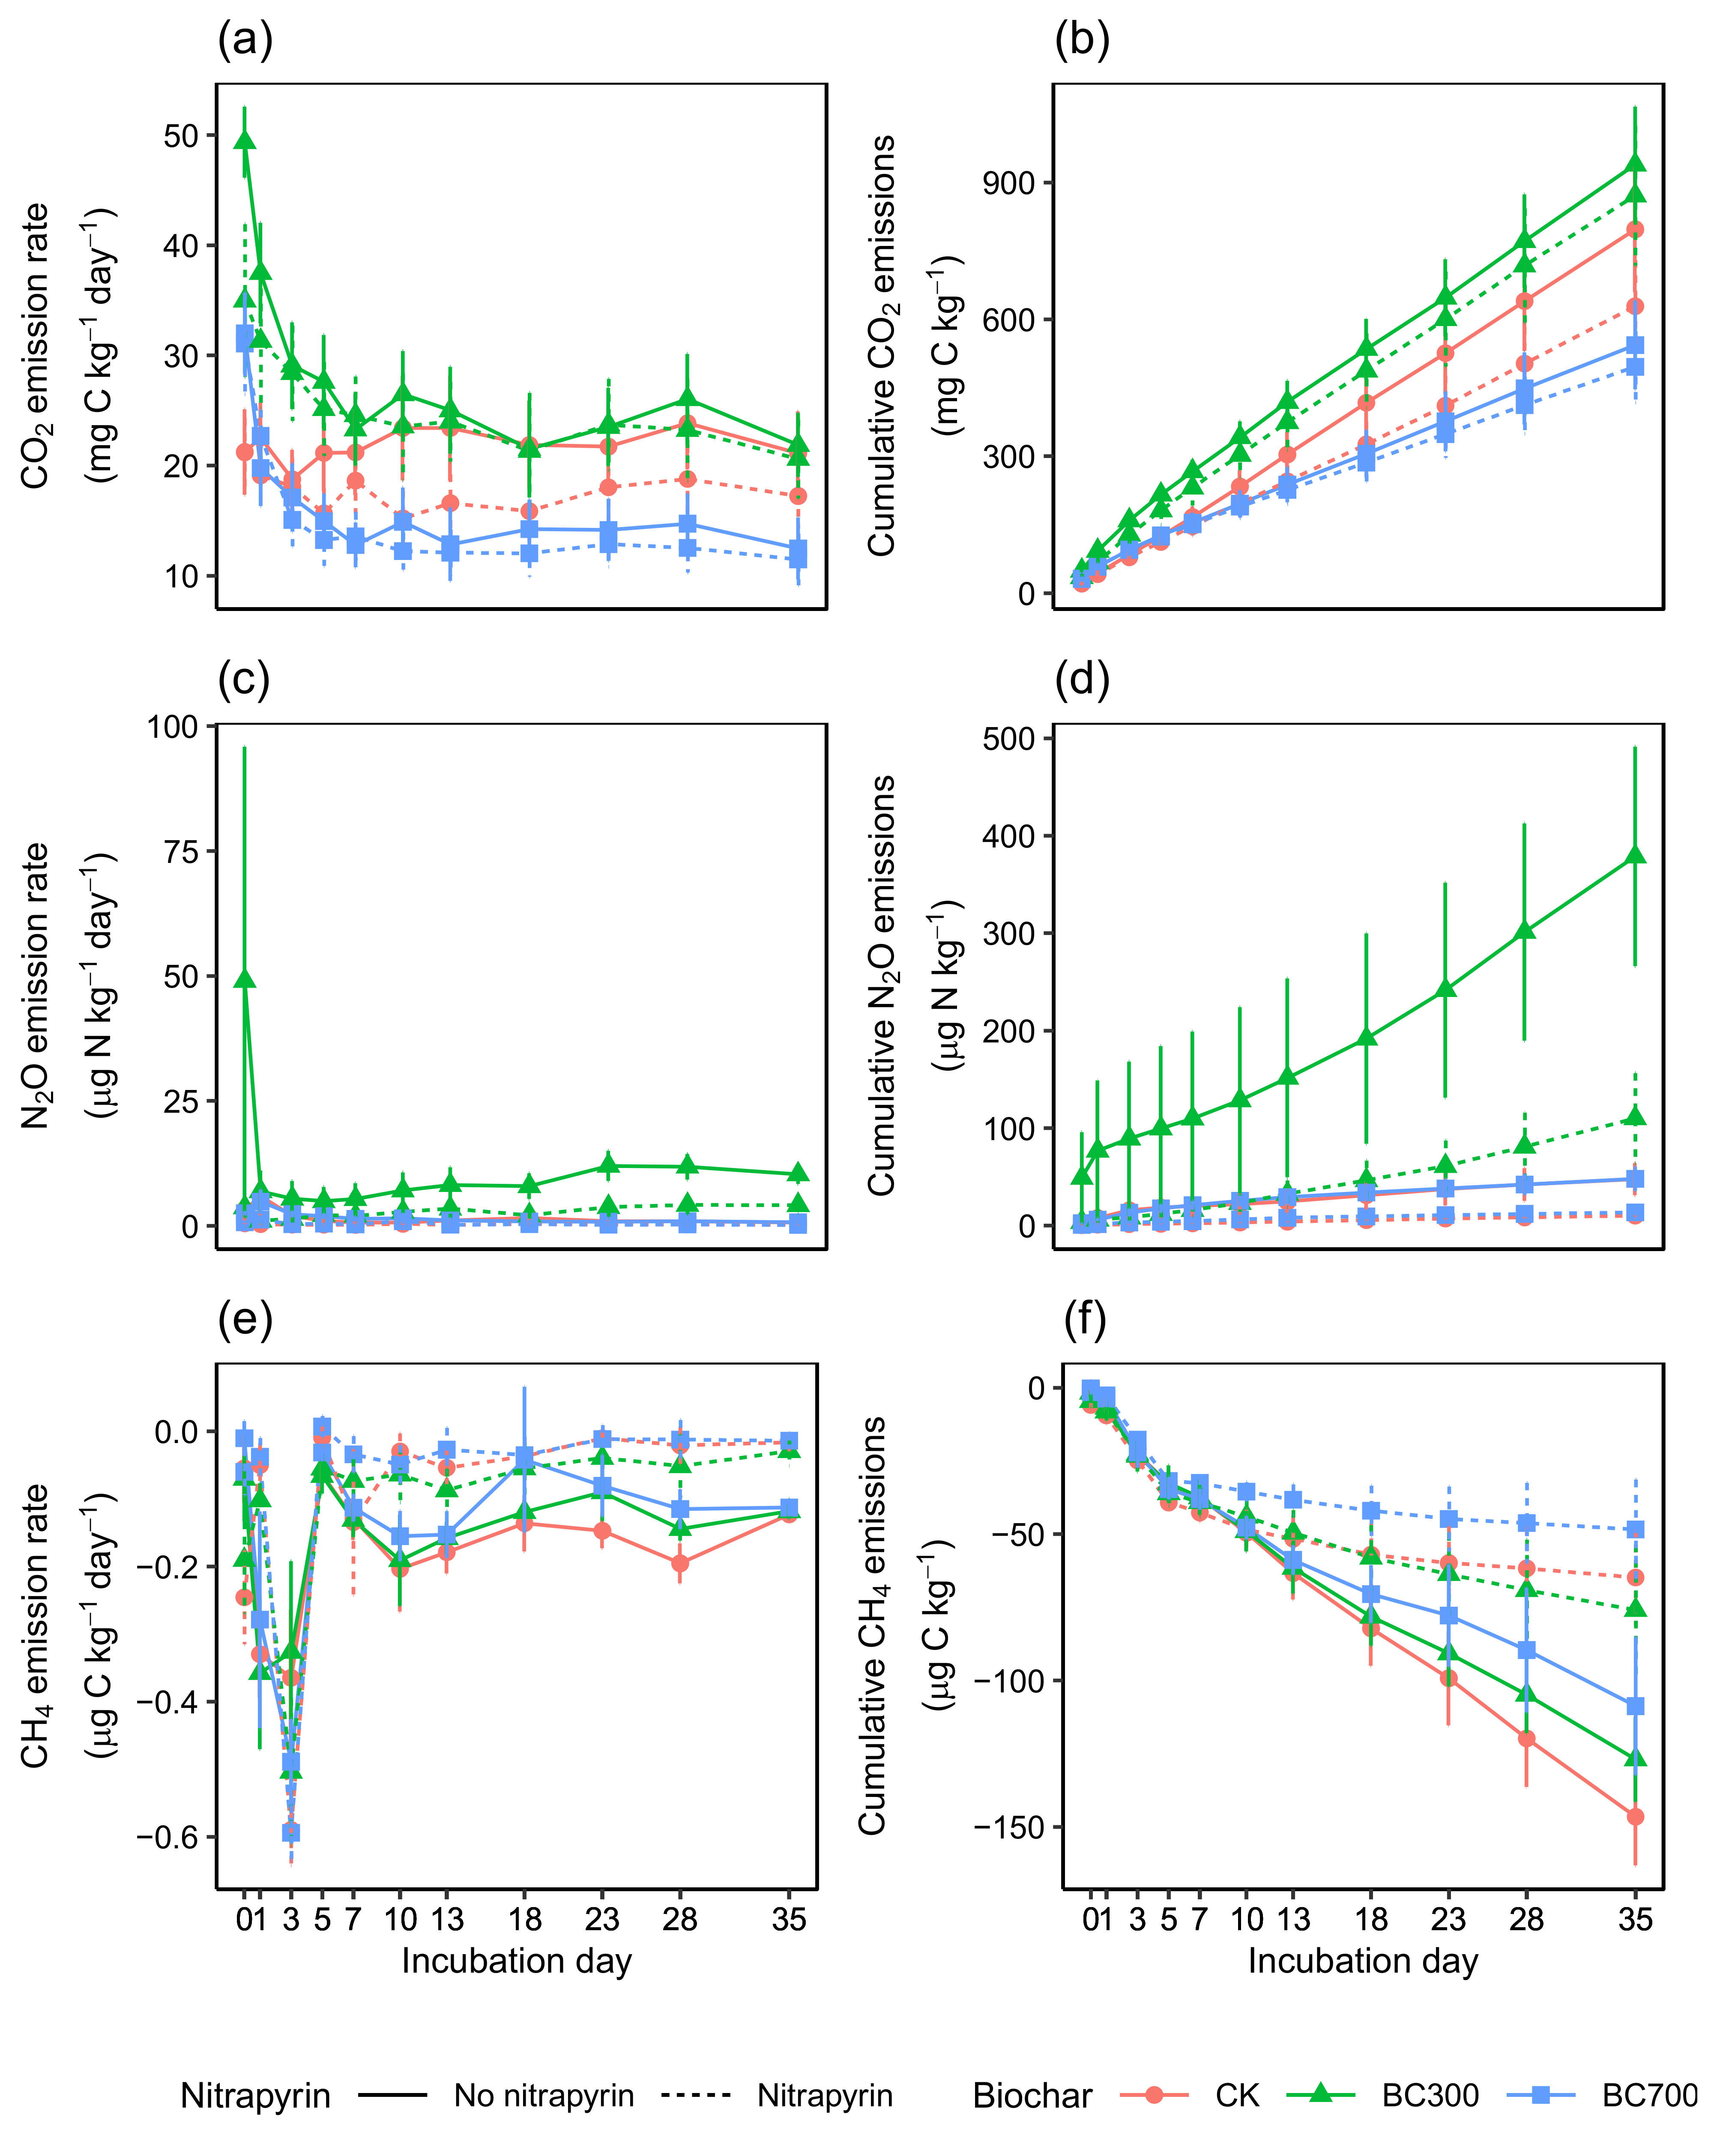
3.1. Biochar and Nitrapyrin Effects on CO2 Emissions

The CO2 emission rates from the treatments with biochar application (regardless of BC300 or BC700) were greater in the first 5 days than in later periods (days 5 to 35) in the incubation (Figure 2a). However, there were no apparent peaks of CO2 emission rates for the CK treatment during the incubation (Figure 2a). Regardless of the biochar treatment, the CO2 emission rates were, on average, higher in treatments without than with nitrapyrin application during the entire incubation (Figure 2a).
There was no statistically significant effect of the interaction between biochar and nitrapyrin on cumulative CO2 emissions (Table 1 and Figure 2b). The main effect of biochar was significant (Table 1), with cumulative CO2 emissions in the BC300 treatment being 1.3 and 1.7 times, on average, greater than those in the CK and BC700 treatments, respectively (Table 2). The main effect of nitrapyrin was also significant (Table 1), with cumulative CO2 emissions being 1.14 times, on average, higher in the treatment without nitrapyrin than that with nitrapyrin application (Table 2).

3.2. Biochar and Nitrapyrin Effects on N2O Emissions

Peaks of N2O emissions were observed on days 1, 0, and 1 in the CK, BC300, and BC700 treatments, respectively, without application of nitrapyrin (Figure 2c). With nitrapyrin application, there were no apparent peaks of N2O emissions for all biochar treatments (Figure 2c).
There was no significant effect of the interaction between biochar and nitrapyrin on cumulative N2O emissions (Table 1 and Figure 2d). The main effect of biochar was significant (Table 1), with the cumulative N2O emissions in the BC300 treatment being 7.3 and 6.1 times, on average, greater than those in the CK and BC700 treatments, respectively (Table 2). The main effect of nitrapyrin was significant as well (Table 1), with the cumulative N2O emissions being 3.9 times, on average, higher in treatment without nitrapyrin than that with nitrapyrin application (Table 2).

3.3. Biochar and Nitrapyrin Effects on CH4 Emissions

Unlike CO2 and N2O emissions, CH4 emission rates were negative, indicating that the soil took up CH4 (Figure 1e,f). The CH4 uptake rates increased (under all treatments) sharply from days 1 to 3 and then decreased sharply from days 3 to 5 (Figure 2e). Furthermore, on day 3, CH4 uptake rates were, on average, higher with nitrapyrin application than without nitrapyrin application (F = 17.52, p < 0.001, Figure 2e). However, from day 7 to the end of the incubation, the CH4 uptake rates were higher in the treatment without nitrapyrin application (Figure 2e).
There was no significant effect of the interaction between biochar and nitrapyrin on cumulative CH4 uptake (Table 1 and Figure 2f). The main effect of biochar was not significant (Table 1). However, the main effect of nitrapyrin was significant (Table 1), with the cumulative CH4 uptake being 2.02 times, on average, higher in the treatment without nitrapyrin than that with nitrapyrin application (Table 2).

3.4. Biochar and Nitrapyrin Effects on Global Warming Potential (GWP)

There was no significant effect of the interaction between biochar and nitrapyrin on the GWP (Table 1). The main effects of biochar and nitrapyrin were significant (Table 1), with the GWP in the BC300 treatment being 1.4 and 1.9 times, on average, greater than that in the CK and BC700 treatments, respectively (Table 2), and 1.2 times, on average, greater in the treatment without nitrapyrin than that with nitrapyrin application (Table 2).

3.5. Biochar and Nitrapyrin Effects on Soil Properties

At the end of the incubation, there was no significant effect of the interaction between biochar and nitrapyrin on soil pH, DOC and MBC concentrations, and net nitrification rates (Table 1). The main effect of biochar was significant on soil pH, DOC concentration, and MBC concentration (Table 1) but not on net nitrification rates. The main effect of nitrapyrin on soil pH and net nitrification rates was significant (Table 1). Soil pH, DOC concentration, and MBC concentration were, on average, higher in the BC300 and BC700 treatments than in the CK treatment at the end of the incubation (Table 2). Furthermore, soil pH was, on average, significantly higher in the BC700 than in the BC300 treatment (Table 2).

4. Discussion

The higher GWP in the BC300 than in the BC700 treatment via increased CO2 and N2O emissions supports our hypothesis that canola straw biochar produced at a high temperature is more effective in reducing GHG emissions and lowering the GWP of GHG emissions from forest soils.
The greater CO2 emissions in the BC300 than in the BC700 treatment is consistent with results reported in a meta-analysis that biochars produced at <600 °C increase, while those produced at ≥600 °C decrease CO2 emissions when applied to soils in laboratory studies [35]. The difference in the effect on CO2 emissions is mainly attributed to the properties of the different biochars. Biochar application is likely to cause a priming effect that contributes to changes in the soil organic C pool [36]. Both positive and negative priming effects have been reported [21,37]. The greater the labile matter concentration in the biochar, the more likely it is to have a positive priming effect when applied to the soil [37,38,39]. Increasing pyrolysis temperature leads to decreased labile matter concentration [38,39,40]. The BC300-amended soils also had higher DOC and MBC concentrations than the BC700-amended soils (Table 2). The high labile C concentration in the BC300 treatment might stimulate microbial activity [41,42] and cause a higher C mineralization rate [37], leading to more CO2 release from the soil, especially in the early phase of the incubation (Figure 2a).
Compared to no biochar addition, the application of BC700 treatment significantly reduced cumulative CO2 emissions (Table 2). Similarly, Pokharel et al. [20] observed a 16.4% reduction in cumulative CO2 emissions in forest soils amended with a sawdust biochar produced at 550 °C. However, this reduction did not occur in BC300-amended soils. However, these studies were all conducted under laboratory conditions, and results may be different under field conditions due to some other important factors such as improvement in soil aeration and structure, changes in soil water availability, and interactions with plants that are difficult to be studied in laboratory experiments [36,43].
The N2O emissions were mainly from denitrification and nitrification in soils [44,45,46]. Many studies have documented that biochar application is one of the strategies to mitigate N2O emissions from soils by affecting these processes [13,47]. However, some also found that biochar increases N2O emissions [48]. In this study, compared to CK, adding BC300 increased the cumulative N2O emissions, while adding BC700 did not affect cumulative N2O emissions (Table 2). One possible mechanism is the positive priming effect caused by BC300 addition leading to more soil organic C decomposition, supplying substrates for denitrifiers and nitrifiers [37]. The increased N2O emissions mainly occurred in the early phase of the incubation, in line with the timing of CO2 emissions. On the other hand, BC700 had a higher pH itself and its application increased soil pH as compared to BC300 application. The increase in soil pH may enrich some denitrification-related genes such as nirK and nosZ [49] and favor the last step of denitrification that produces N2 instead of N2O [13,50,51]. Thus, BC700 has a greater ability to mitigate N2O emissions. Furthermore, the C/N ratio of biochars has been shown to be highly correlated with its function in affecting N2O emissions from soils; a lower C/N ratio will most likely enhance N2O emissions [52]. The C/N of BC300 was 40, which was much lower than that of BC700, which was 57, indicating that the C/N ratio of the biochars most likely affected N2O emissions.
The lack of biochar effect on CH4 emissions was probably due to the incubation being conducted under aerobic conditions, causing no significant change in CH4 oxidation activity [48,53]. Furthermore, methanogens are known as strict anaerobes and do not grow in aerobic conditions [54]. Thus, CH4 uptake was observed in all treatments.
The role of nitrapyrin in inhibiting the activities of nitrifiers and reducing the oxidation of NH4+ to NO3 [24,55,56] is confirmed by the difference in net nitrification rates between treatments with and without nitrapyrin application. Furthermore, nitrapyrin might also affect the denitrification process, as the NO3 produced from the nitrification process could be a substrate for denitrification, which will eventually reduce N2O emissions from both denitrification and nitrification processes [57]. The lack of the effect of the interaction between biochar and nitrapyrin on N2O emissions (Table 1) indicates that the effectiveness of nitrapyrin in reducing N2O emissions is not affected by biochar application; this is consistent with our earlier study on cropland soil [23]. Co-application of biochar and nitrapyrin does emit less N2O than the application of biochar alone, especially for the application of BC300 (Figure 2d). Nitrapyrin can act against the CH4 monooxygenase enzyme system and inhibit CH4 oxidation [58]; thus, the CH4 uptake decreased by nitrapyrin application in the studied soils (Figure 2f and Table 2).
Overall, BC300 application resulted in a greater GWP as compared to BC700 application to the forest soils. Adding nitrapyrin to the biochar-amended forest soils can help to further reduce the GWP of GHG emissions from the soils.

5. Conclusions

Our results highlight that the effect of biochar on the global warming potential of greenhouse gas emissions depends on the properties of biochar that are affected by its production temperature. With the application of the straw biochar produced at low temperature, greater CO2 and N2O emission rates in the early incubation stage caused a greater global warming potential relative to the control and application of straw biochar produced at high temperature, indicating that the greater labile carbon concentration in the low-temperature biochar caused a greater priming effect in the forest soils. However, the CH4 emissions were not significantly affected by different biochar additions as this incubation experiment was conducted under aerobic conditions. Nitrapyrin effectively reduced N2O emissions from the forest soils by inhibiting the nitrification process, as indicated by the significantly reduced net nitrification rates. In addition, the effectiveness of nitrapyrin in reducing N2O emissions was not affected by biochar addition in the forest soils. Thus, we conclude that the application of biochar produced at high temperatures (e.g., 700 °C) and nitrapyrin can be potential techniques to employ to reduce greenhouse gas emissions from forestlands widely distributed across the agricultural landscape.

Author Contributions

Conceptualization, J.L.; data curation, J.L.; funding acquisition, S.X.C.; methodology, J.-H.K.; supervision, S.X.C. and J.C.; validation, S.X.C., X.G., and Z.A.; writing—original draft, J.L.; writing—review and editing, S.X.C. and J.C. All authors have read and agreed to the published version of the manuscript.

Funding

This research was funded by the Natural Science and Engineering Research Council of Canada (NSERC) and the China Scholarship Council (CSC). The first author was also supported by a project funded by the Priority Academic Program Development of Jiangsu Higher Education Institutions (PAPD).

Institutional Review Board Statement

Not applicable.

Informed Consent Statement

Not applicable.

Data Availability Statement

The data presented in this study are available on request from the corresponding author.

Acknowledgments

We thank Cole Gross, Christopher Nzediegwu, Dauren Kaliaskar, Na Chen, Prem Pokharel, Qian Wu, Yanchen Zhang, and Zilong Ma for their assistance in the laboratory.

Conflicts of Interest

The authors declare no conflict of interest. The funders had no role in the design of the study; in the collection, analyses, or interpretation of data; in the writing of the manuscript; or in the decision to publish the results.

References

  1. Amadi, C.C.; van Rees, K.C.J.; Farrell, R.E. Greenhouse gas mitigation potential of shelterbelts: Estimating farm-scale emission reductions using the Holos model. Can. J. Soil Sci. 2016. [Google Scholar] [CrossRef] [Green Version]
  2. Toensmeier, E.; Herren, D.H. The Carbon Farming Solution: A Global Toolkit of Perennial Crops and Regenerative Agriculture Practices for Climate Change Mitigation and Food Security, Illustrated edition; Chelsea Green Publishing: White River Junction, VT, USA, 2016. [Google Scholar]
  3. IPCC. Climate Change and Land: An IPCC Special Report on Chlimate Change, Desertification, Land Degradation, Sustainable Land Management, Food Security, and Greenhouse Gas Fluxes in Terrestrial Ecosystems; IPCC Climate Change and Land: Geneva, Switzerland, 2019. [Google Scholar]
  4. Oertel, C.; Matschullat, J.; Zurba, K.; Zimmermann, F.; Erasmi, S. Greenhouse gas emissions from soils—A review. Geochemistry 2016, 76, 327–352. [Google Scholar] [CrossRef] [Green Version]
  5. Baah-Acheamfour, M.; Carlyle, C.N.; Lim, S.-S.; Bork, E.W.; Chang, S.X. Forest and grassland cover types reduce net greenhouse gas emissions from agricultural soils. Sci. Total Environ. 2016, 571, 1115–1127. [Google Scholar] [CrossRef] [PubMed]
  6. Lehmann, J.; Joseph, S. Biochar for Environmental Management: Science, Technology and Implementation, 2nd ed.; Routledge: London, UK; New York, NY, USA, 2015. [Google Scholar]
  7. Brenzinger, K.; Drost, S.M.; Korthals, G.; Bodelier, P.L.E. Organic residue amendments to modulate greenhouse gas emissions from agricultural soils. Front. Microbiol. 2018, 9. [Google Scholar] [CrossRef] [Green Version]
  8. Shrestha, B.M.; Chang, S.X.; Bork, E.W.; Carlyle, C.N. Enrichment planting and soil amendments enhance carbon sequestration and reduce greenhouse gas emissions in agroforestry systems: A review. Forests 2018, 9, 369. [Google Scholar] [CrossRef] [Green Version]
  9. Singh, B.; Singh, B.P.; Cowie, A.L. Characterisation and evaluation of biochars for their application as a soil amendment. Soil Res. 2010, 48, 516. [Google Scholar] [CrossRef]
  10. Sohi, S.P.; Krull, E.; Lopez-Capel, E.; Bol, R. Chapter 2-A review of biochar and its use and function in soil. Adv. Agron. 2010, 105, 47–82. [Google Scholar]
  11. Hillel, D.; Rosenzweig, C. Handbook of Climate Change and Agroecosystems: Impacts, Adaptation, And Mitigation; Imperial College Press: London, UK, 2010. [Google Scholar]
  12. Paustian, K.; Lehmann, J.; Ogle, S.; Reay, D.; Robertson, G.P.; Smith, P. Climate-smart soils. Nature 2016, 532, 49–57. [Google Scholar] [CrossRef] [PubMed] [Green Version]
  13. Cayuela, M.L.; Sánchez-Monedero, M.A.; Roig, A.; Hanley, K.; Enders, A.; Lehmann, J. Biochar and denitrification in soils: When, how much and why does biochar reduce N2O emissions? Sci. Rep. 2013, 3, 1732. [Google Scholar] [CrossRef] [Green Version]
  14. Spokas, K.A.; Koskinen, W.C.; Baker, J.M.; Reicosky, D.C. Impacts of woodchip biochar additions on greenhouse gas production and sorption/degradation of two herbicides in a Minnesota soil. Chemosphere 2009, 77, 574–581. [Google Scholar] [CrossRef]
  15. Jeffery, S.; Verheijen, F.G.A.; Kammann, C.; Abalos, D. Biochar effects on methane emissions from soils: A meta-analysis. Soil Biol. Biochem. 2016, 101, 251–258. [Google Scholar] [CrossRef]
  16. Lehmann, J. Bio-energy in the black. Front. Ecol. Environ. 2007, 5, 381–387. [Google Scholar] [CrossRef] [Green Version]
  17. Zhao, L.; Cao, X.; Mašek, O.; Zimmerman, A. Heterogeneity of biochar properties as a function of feedstock sources and production temperatures. J. Hazard. Mater. 2013, 256–257, 1–9. [Google Scholar] [CrossRef] [PubMed] [Green Version]
  18. Ahmad, M.; Lee, S.S.; Dou, X.; Mohan, D.; Sung, J.-K.; Yang, J.E.; Ok, Y.S. Effects of pyrolysis temperature on soybean stover- and peanut shell-derived biochar properties and tce adsorption in water. Bioresour. Technol. 2012, 118, 536–544. [Google Scholar] [CrossRef] [PubMed]
  19. Kwak, J.-H.; Islam, M.S.; Wang, S.; Messele, S.A.; Naeth, M.A.; El-Din, M.G.; Chang, S.X. Biochar properties and lead(II) adsorption capacity depend on feedstock type, pyrolysis temperature, and steam activation. Chemosphere 2019, 231, 393–404. [Google Scholar] [CrossRef] [PubMed]
  20. Pokharel, P.; Kwak, J.-H.; Ok, Y.S.; Chang, S.X. Pine sawdust biochar reduces GHG emission by decreasing microbial and enzyme activities in forest and grassland soils in a laboratory experiment. Sci. Total Environ. 2018, 625, 1247–1256. [Google Scholar] [CrossRef] [PubMed]
  21. Novak, J.M.; Busscher, W.J.; Watts, D.W.; Laird, D.A.; Ahmedna, M.A.; Niandou, M.A.S. Short-term CO2 mineralization after additions of biochar and switchgrass to a typic kandiudult. Geoderma 2010, 154, 281–288. [Google Scholar] [CrossRef]
  22. Hale, S.E.; Lehmann, J.; Rutherford, D.; Zimmerman, A.R.; Bachmann, R.T.; Shitumbanuma, V.; O’Toole, A.; Sundqvist, K.L.; Arp, H.P.H.; Cornelissen, G. Quantifying the total and bioavailable polycyclic aromatic hydrocarbons and dioxins in biochars. Environ. Sci. Technol. 2012, 46, 2830–2838. [Google Scholar] [CrossRef]
  23. Li, J.; Kwak, J.-H.; Chen, J.; An, Z.; Gong, X.; Chang, S.X. Canola straw biochars produced under different pyrolysis temperatures and nitrapyrin independently affected cropland soil nitrous oxide emissions. Biol. Fertil. Soils 2021, 57, 319–328. [Google Scholar] [CrossRef]
  24. Fisk, L.M.; Maccarone, L.D.; Barton, L.; Murphy, D.V. Nitrapyrin decreased nitrification of nitrogen released from soil organic matter but not amoA gene abundance at high soil temperature. Soil Biol. Biochem. 2015, 88, 214–223. [Google Scholar] [CrossRef] [Green Version]
  25. Dawar, K.; Khan, H.; Zaman, M.; Muller, C.; Alam, S.S.; Fahad, S.; Alwahibi, M.S.; Alkahtani, J.; Saeed, B.; Saud, S.; et al. The effect of biochar and nitrogen inhibitor on ammonia and nitrous oxide emissions and wheat productivity. J. Plant Growth Regul. 2021. [Google Scholar] [CrossRef]
  26. Sheikhi, J.; Mirsyed, H.H.; Etesami, H.; Majidi, A. Biochar counteracts nitrification inhibitor DMPP–mediated negative effect on Spinach (Spinacia Oleracea, L.) growth. Ecotox. Environ. Safe 2020, 191, 110243. [Google Scholar] [CrossRef]
  27. Li, B.; Fan, C.H.; Xiong, Z.Q.; Li, Q.L.; Zhang, M. The combined effects of nitrification inhibitor and biochar incorporation on yield-scaled N2O emissions from an intensively managed vegetable field in southeastern China. Biogeosciences 2015, 12, 2003–2017. [Google Scholar] [CrossRef] [Green Version]
  28. Soil Classification Working Group. The Canadian System of Soil Classification; NRC Research Press: Ottawa, OT, Canada, 1998; Volume 3. [Google Scholar]
  29. Islam, A.; Chen, D.; White, R.E. Developing a technique to quantify heterotrophic and autotrophic nitrification in acidic pasture soils. Commun. Soil Sci. Plan. 2007, 38, 2309–2321. [Google Scholar] [CrossRef]
  30. Brookes, P.C.; Landman, A.; Pruden, G.; Jenkinson, D.S. Chloroform fumigation and the release of soil nitrogen: A rapid direct extraction method to measure microbial biomass nitrogen in soil. Soil Biol. Biochem 1985, 17, 837–842. [Google Scholar] [CrossRef]
  31. Jenkinson, D.S.; Brookes, P.C.; Powlson, D.S. Measuring soil microbial biomass. Soil Biol. Biochem. 2004, 36, 5–7. [Google Scholar] [CrossRef]
  32. Miranda, K.M.; Espey, M.G.; Wink, D.A. A Rapid, Simple spectrophotometric method for simultaneous detection of nitrate and nitrite. Nitric Oxide 2001, 5, 62–71. [Google Scholar] [CrossRef]
  33. Han, P.W.Y.; Xu, J.M.; Yi, X.Y.; Lin, Y.D. Net and gross nitrification in tea soils of varying productivity and their adjacent forest and vegetable soils. Soil Sci. Plant. Nutr. 2012, 58, 173–182. [Google Scholar] [CrossRef]
  34. R Core Team. A Language and Environment for Statistical Computing. R Foundation for Statistical Computing; R Core Team: Vienna, Austria, 2018. [Google Scholar]
  35. Song, X.; Pan, G.; Zhang, C.; Zhang, L.; Wang, H. Effects of biochar application on fluxes of three biogenic greenhouse gases: A meta-analysis. Ecosyst. Health Sust. 2016, 2, e01202. [Google Scholar] [CrossRef] [Green Version]
  36. Kuzyakov, Y.; Friedel, J.K.; Stahr, K. Review of mechanisms and quantification of priming effects. Soil Biol. Biochem. 2000, 32, 1485–1489. [Google Scholar] [CrossRef]
  37. Zimmerman, A.R.; Gao, B.; Ahn, M.-Y. Positive and negative carbon mineralization priming effects among a variety of biochar-amended soils. Soil Biol. Biochem. 2011, 43, 1169–1179. [Google Scholar] [CrossRef]
  38. Deenik, J.L.; McClellan, T.; Uehara, G.; Antal, M.J.; Campbell, S. Charcoal volatile matter content influences plant growth and soil nitrogen transformations. Soil Sci. Soc. Am. J. 2010, 74, 1259–1270. [Google Scholar] [CrossRef]
  39. Tomczyk, A.; Sokołowska, Z.; Boguta, P. Biochar physicochemical properties: Pyrolysis temperature and feedstock kind effects. Rev. Environ. Sci. Biotechnol. 2020. [Google Scholar] [CrossRef] [Green Version]
  40. Zimmerman, A.R. Abiotic and microbial oxidation of laboratory-produced black carbon (biochar). Environ. Sci. Technol. 2010, 44, 1295–1301. [Google Scholar] [CrossRef] [PubMed]
  41. Shen, Y.; Zhu, L.; Cheng, H.; Yue, S.; Li, S. Effects of biochar application on CO2 emissions from a cultivated soil under semiarid climate conditions in northwest China. Sustainability 2017, 9, 1482. [Google Scholar] [CrossRef] [Green Version]
  42. Gaskin, J.W.; Steiner, C.; Harris, K.; Das, K.C.; Bibens, B. Effect of low-temperature pyrolysis conditions on biochar for agricultural use. Trans. ASABE 2008, 51, 2061–2069. [Google Scholar] [CrossRef]
  43. Yuan, H.; Lu, T.; Wang, Y.; Huang, H.; Chen, Y. Influence of pyrolysis temperature and holding time on properties of biochar derived from medicinal herb (Radix Isatidis) residue and its effect on soil CO2 emission. J. Anal. Appl. Pyrol. 2014, 110, 277–284. [Google Scholar] [CrossRef]
  44. Bremner, J.M. Sources of nitrous oxide in soils. Nutr. Cycl. Agroecosyst. 1997, 49, 7–16. [Google Scholar] [CrossRef]
  45. Groffman, P.M.; Altabet, M.A.; Böhlke, J.K.; Butterbach-Bahl, K.; David, M.B.; Firestone, M.K.; Giblin, A.E.; Kana, T.M.; Nielsen, L.P.; Voytek, M.A. Methods for measuring denitrification: Diverse approaches to a difficult problem. Ecol. Appl. 2006, 16, 2091–2122. [Google Scholar] [CrossRef]
  46. Wrage-Mönnig, N.; Horn, M.A.; Well, R.; Müller, C.; Velthof, G.; Oenema, O. The role of nitrifier denitrification in the production of nitrous oxide revisited. Soil Biol. Biochem. 2018, 123, A3–A16. [Google Scholar] [CrossRef]
  47. Fan, C.; Duan, P.; Zhang, X.; Shen, H.; Chen, M.; Xiong, Z. Mechanisms underlying the mitigation of both N2O and NO emissions with field-aged biochar in an anthrosol. Geoderma 2020, 364, 114178. [Google Scholar] [CrossRef]
  48. Spokas, K.A.; Reicosky, D.C. Impacts of sixteen different biochars on soil greenhouse gas production. Ann. Environ. Sci. 2009, 3, 179–193. [Google Scholar]
  49. Ji, C.; Li, S.; Geng, Y.; Yuan, Y.; Zhi, J.; Yu, K.; Han, Z.; Wu, S.; Liu, S.; Zou, J. Decreased N2O and NO emissions associated with stimulated denitrification following biochar amendment in subtropical tea plantations. Geoderma 2020, 365, 114223. [Google Scholar] [CrossRef]
  50. Xu, X.; He, C.; Yuan, X.; Zhang, Q.; Wang, S.; Wang, B.; Guo, X.; Zhang, L. Rice straw biochar mitigated more N2O emissions from fertilized paddy soil with higher water content than that derived from ex situ biowaste. Environ. Pollut. 2020, 263, 114477. [Google Scholar] [CrossRef] [PubMed]
  51. Weier, K.L.; Doran, J.W.; Power, J.F.; Walters, D.T. Denitrification and the dinitrogen/nitrous oxide ratio as affected by soil water, available carbon, and nitrate. Soil Sc. Soc. Am. J. 1993, 57, 66–72. [Google Scholar] [CrossRef] [Green Version]
  52. Huang, Y.; Zou, J.; Zheng, X.; Wang, Y.; Xu, X. Nitrous oxide emissions as influenced by amendment of plant residues with different C:N ratios. Soil Biol. Biochem. 2004, 36, 973–981. [Google Scholar] [CrossRef]
  53. van Zwieten, L.; Singh, B.; Joseph, S.; Kimber, S.; Cowie, A.; and Chan, K.Y. Biochar and emissions of non-CO2 greenhouse gases from soil. In Biochar Environmental Management Science and Technology; Lehmann, J., Joseph, S., Eds.; Earthscan: London, UK, 2009; pp. 227–250. [Google Scholar]
  54. Lyu, Z.; Shao, N.; Akinyemi, T.; Whitman, W.B. Methanogenesis. Curr. Biol. 2018, 28, R727–R732. [Google Scholar] [CrossRef] [Green Version]
  55. Niu, Y.; Luo, J.; Liu, D.; Müller, C.; Zaman, M.; Lindsey, S.; Ding, W. Effect of biochar and nitrapyrin on nitrous oxide and nitric oxide emissions from a sandy loam soil cropped to maize. Biol. Fertil. Soils 2018, 54, 645–658. [Google Scholar] [CrossRef]
  56. Zhao, Y.; Wang, J.; Cai, Z.; Müller, C.; Zhang, J. Short-term effects of nitrapyrin, rice straw and its biochar application on N transformation in soils of humid subtropical China. Acta Agric. Scand. Sect. B Soil Plant. Sci. 2018, 68, 448–456. [Google Scholar] [CrossRef]
  57. Bremner, J.M.; Yeomans, J.C. Effects of nitrification inhibitors on denitrification of nitrate in soil. Biol. Fert. Soils 1986, 2, 173–179. [Google Scholar] [CrossRef]
  58. Topp, E.; Knowles, R. Effects of nitrapyrin [2-chloro-6-(trichloromethyl) pyridine] on the obligate methanotroph Methylosinus trichosporium OB3b. Appl. Environ. Microbiol. 1984, 47, 258–262. [Google Scholar] [CrossRef] [PubMed] [Green Version]
Figure 1. Schematic diagram of the incubation experiment.
Land 10 00189 g001
Figure 2. The effect of biochar and nitrapyrin applications on (a) CO2 emission rate (mean ± standard error (SE), same below), (b) cumulative CO2 emissions, (c) N2O emission rate, (d) cumulative N2O emissions, (e) CH4 emission rate, and (f) cumulative CH4 emissions from forest soils in a 35-day incubation. CK, no biochar addition; BC300, the application of biochar produced at 300 °C; BC700, the application of biochar produced at 700 °C.
Land 10 00189 g002
Table 1. Main and interaction effects (F-values) of biochar and nitrapyrin on cumulative greenhouse gas (GHG) emissions, global warming potential (GWP), soil pH, dissolved organic C (DOC), microbial biomass C (MBC), and net nitrification rates (NNR) in a 35-day incubation.
FactorCO2N2OCH4GWPpHDOCMBCNNR
Biochar46.2 **30.6 **1.2572.4 **22.9 **10.5 **4.89 *2.27
Nitrapyrin8.36 **34.8 **18.2 **17.2 **31.5 **0.022.4722.3 **
Biochar × nitrapyrin1.300.160.361.410.060.060.780.54
* p < 0.05, ** p < 0.01.
Table 2. Multiple comparisons of the least-square means of the main effects (biochar and nitrapyrin) on cumulative GHG emissions, global warming potential (GWP), soil pH, dissolved organic C (DOC), microbial biomass C (MBC), and net nitrification rates (NNR) in a 35-day incubation.
TreatmentCO2
(mg C kg−1)
N2O
(µg N kg−1)
CH4
(µg C kg−1)
GWP
(mg CO2-C kg−1)
pHDOC
(mg kg−1)
MBC
(mg kg−1)
NNR
(mg N kg−1 day−1)
CK 1713.1 b19.5 2 b−105.7 a718.8 b5.87 c653.1 b739.1 b0.49 a
BC300905.2 a141.9 a−101.4 a975.3 a6.03 b825.9 a989.5 a0.90 a
BC700520.0 c23.2 b−78.6 a526.9 c6.24 a769.8 a810.4 ab0.34 a
No nitrapyrin760.1 A78.8 A−127.4 B803.7 A5.92 B747.5 A899.2 A1.17 A
Nitrapyrin665.5 B20.3 B−63.1 A677.0 B6.17 A751.7 A793.5 A−0.01 B
1 Different lowercase letters (a, b, c) indicate significant differences between different biochar treatments across nitrapyrin application treatments; different uppercase letters (A, B) indicate significant differences between without and with nitrapyrin application treatments across biochar application treatments. 2 Data were back-transformed.
Publisher’s Note: MDPI stays neutral with regard to jurisdictional claims in published maps and institutional affiliations.

