Abstract
Many cities face health issues that result from ineffective urban planning strategies. The chances of doing exercises in sportive venues implicate public health and citizen quality of life. With the advent of the geo-big data era, it is crucial to explore the spatial pattern of sports facilities to reflect urban health issues. This study aims to decode the street-based spatiality of gyms (one prevailing type of sportive venues) from a comprehensive perspective by both geometric methods (i.e., segment streets) and topological analytics in the context of complexity science (i.e., complex network derived from the topology of natural streets). We found that: (1) gyms are spatially clustered and distributed unevenly; (2) community-to-gym walkability fits the power-law with a heavy-tailed distribution at the 10-min and 20-min temporal scales; (3) the model for the street connectivity and the multi-distance reachability of gyms is with high polynomial fitting goodness. This article is conducive to strategies-making of healthy city planning and the further optimization of urban spatial structure.
1. Introduction
Urban planning plays an increasingly fundamental role in various severe global issues involving public health [1,2]. Irrational urban design and planning exert certain adverse impacts on health, e.g., physical inactivity, noise, air pollution, traffic accidents, etc. [3,4]. Smart-growth principles are compelling to eliminate health injustice among neighborhoods with the essence to enhance the walkability of urban communities. Sufficient evidence suggests that upgrading urban planning benefits public health, urban vitality, and sustainability [5,6]. Sports practice plays a significant role as a contributor to health and well-being at a population level [7,8]. Around the world, most health organizations compile guidelines recommending sports practice, including the World Health Organization [9]. In China, people’s awareness of physical fitness has been continuously strengthened in recent years, with an obvious increase in the number of people taking part in physical exercises [10]. Further, plenty of research uncovers that the spatiality of sports facilities (e.g., gyms) is able to determine human well-being and quality of life as well as urban cohesion, vitality, and justice [11,12,13,14,15,16,17,18,19]. In a sense, it is promising to optimize the urban design for healthy city development with a specific focus on spatially characterizing sportive facilities.
In recent years, scholars start to concern with spatializing sportive venues in urban studies. The relationship is explored between spatial accessibility to sports venues (from the residence and workplace, etc.) and sports practice (e.g., racket, swimming, etc.) based on street network distance and multilevel linear probability models in French [20]. The variation is examined concerning the spatial pattern of sportive amenities providing with socioeconomic geography by floating catchment area (FCA) in Wales [21]. The association between sports facility count (i.e., sporting opportunities) and physical activity (i.e., health outcomes) is discovered to be varied by different urbanicity and neighborhood buffer size based on GIS platform [22]. The link between spatial accessibility and sports practice is investigated with a focus on specific types of sportive facilities by multilevel logistic regression [23]. It is found that access to facilities influences individual levels of physical activity based on the enhanced two-step floating catchment area (E2SFCA) [24]. It is demonstrated the spatial pattern of access to physical activity facilities within 10, 20, 30-min travel thresholds by walking and cycling [25]. It is examined the distribution of physical activity facilities in Scotland and concluded that deprived areas owned fewer private facilities than affluent areas but numerous public facilities [26]. The above-mentioned literature has shown that sports facilities’ deprivation or availability consistent with health-related activities or outcomes. Towards healthy city development, as a matter of fact, it is harder to alter individual behaviors, whereas comparatively easier to improve the spatial allocation of sportive venues (e.g., the gyms) to guide humans to take more health-enhancing activities given the strong association between spatial access to sports facilities and health-related outcomes. That is, the essence is to prioritize the spatiality of sports facilities (e.g., gyms) for further promoting public health through optimizing the spatial layout of sporting amenities. Yet, to date, existing research on the spatiality of sports facilities normally adopts traditional GIS-based spatial analysis techniques, e.g., street network distance measured by “segment street”.
“Natural street” could be viewed as the street-street’s dual graph and the skeleton of the city, which itself is a complex network [27,28]. Simply put, a natural street is formed by connecting a set of adjacent segments with good continuity. The resulting street-street topology, i.e., the intersection relationship between streets, is fundamentally different from that of “segment streets” from conventional GIS geometric representations. Specifically, the topology of natural streets can reveal the spatial heterogeneity—the imbalanced ratio of populated-to-unpopulated streets/areas and thereby predicting human activities better. In other words, the topological analysis illustrates urban space better, specifically, natural street rather than segment street. More precisely, traditional GIS-based representation (segment-based network) tends to exhibit a Gaussian or normal-like distribution, whereas the topological representation (e.g., natural streets) is fundamentally a complex-network-oriented model that shows mostly nonlinear or heavy-tailed statistics. The fat-tailed statistics can be further characterized by power-law distributions (also shown as the 80–20 rule). Yet, the topological analysis is not paid its deserved attention to predict human activities in existing literature [29]. Further, topologically analyzing urban space to predict human health-related behaviors remains under-researched. Hence, this article intends to gain better insights into the street-based spatiality of gymnasiums from a comprehensive perspective by not merely GIS-based geometric analysis but also topological analysis or complex-network analysis in the context of complexity science.
This study contributes in two-fold aspects: (1) Theoretically, the street-based spatial regularities of gyms are found, namely, the remarkable power-law distribution concerning the walkability from communities to gyms. (2) Methodologically, for “segment street” analysis, the adopted (i.e., network-based kernel density estimation, Net-KDE) is more advantageous than the traditional (i.e., kernel density estimation, KDE) which has no regard for the street network; Moreover, “natural street” is incorporated due to its predicting human activities better as the topological analytical technique.
The theoretical framework is shown in Figure 1. This research is designed to advance the spatially oriented policy-making of the healthy city with a specific focus on illustrating the spatiality of gymnasiums based on the street network from both the segment street and natural street perspective by the respective geometric analysis (on GIS platform) and topological analysis (by the complexity science method).
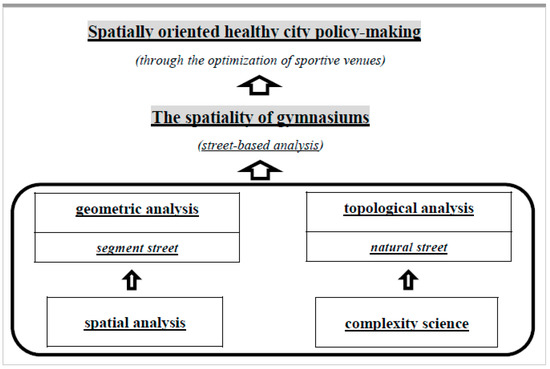
Figure 1.
Theoretical framework.
2. Methodology
2.1. Study Site
Wuhan is the capital city of Hubei province, Central China. It locates in the northeast of the Jianghan Plain (113°410–115°050 E and 29°580–31°220 N) along the Yangtze River Economic Zone (YREZ). This metropolis is the most developing and populous city in Hubei Province. Wuhan comprises thirteen districts (i.e., seven districts in urban centers and six districts in urban suburbs) with an area of 8569.15 km2 and a population of nearly 10.89 million permanent residents according to the Wuhan Statistical Yearbook 2018. The urban center is named “Three Townships of Wuhan” (i.e., Hankou Township, Wuchang Township, and Hanyang Township). These three townships are partitioned due to the confluence of the Yangtze River (the 3rd longest river in the world) and the Han River. As a typical polycentric city, Hankou Township is the economic and financial center; Wuchang Township functions as the political, scientific, and educational center; and Hanyang Township plays the role of the industrial center. Moreover, Wuhan is famous for its title of the City of Hundreds of Lakes, ranking the 1st of water resources per capita with 900,000 m3 globally [30]. In terms of the spatial configuration, the three road loops comprise the skeleton of Wuhan’s urban structure (Figure 2). The 1st road loop is, namely, the inner ring road. The 2nd road loop runs the length of around 48 km (the highway around the 1st street loop). The 3rd road loop approximately divides this city into urban and suburban areas. The case study in this research is the area within the 3rd road loop, that is, the main city zone (MCZ).
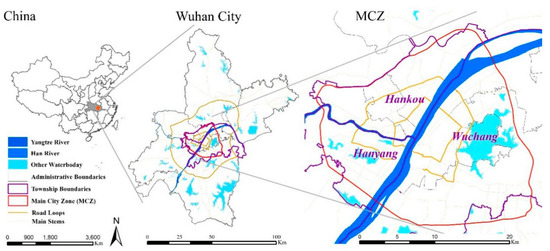
Figure 2.
Study site.
Wuhan is undergoing unprecedented development as a cultural, political and economic center in Central China in light of its geographic location, which is famous as “the traffic hub of nine provinces”. The urban population increased rapidly in the last few years from 5.41 million in 2010 to 9.02 million in 2019. Wuhan’s GDP increased remarkably from 551.57 billion yuan in 2010 to 1622.32 billion yuan in 2019. In addition, the urban per capita disposable income increased from 20.81 thousand yuan in 2010 to 51.71 thousand yuan in 2019. The increasing income of residents creates a higher demand for leisure and fitness. According to the Survey Report on Health Status of Residents in Wuhan, the regular exercise rate of Wuhan residents is increasing, and the average time spent on exercising was 41.2 min per day. Furthermore, the outbreak of the COVID-19 promoted the residents to pay more attention to health. The rapid growth of the urban population and the growing fitting habits generated a huge demand for fitness facilities. The intensive study of the fitness facilities in Wuhan can contribute to the understanding of healthy urban development.
2.2. Data Sources
This study consists of four datasets: (a) fundamental geospatial data: administrative boundaries and geographical features (i.e., the Yangtze River, the Han River, numerous lakes) from the First National Survey of Geographical Conditions (FNSGC) (2013–2015); (b) points of interest (POIs), crawled from Baidu Map (similar to Google Map) in 2017, and POIs of gymnasiums are sorted out; (c) polygons of residential communities (1008) from the Wuhan’s community census in MCZ in 2014 and centroids of these communities are generated; (d) street network in MCZ from the Wuhan Transport Agency (WTA) in 2015, involving expressways, main roads, secondary roads, branch roads, alleys, embankments, tunnels, overpasses, and bridges.
2.3. Methods
2.3.1. Network-Based Kernel Density Estimation (Net-KDE)
The traditional kernel density estimation (KDE) is a commonly used clustering approach for points through computing the density according to the Euclidean distance. Given point-type events are normally led by streets (e.g., traffic injuries, etc.), yet this technique fails to consider the actual travel path. The network-based kernel density estimation (Net-KDE) makes up for this deficiency due to combining the street network [31,32]. The Net-KDE equation is illustrated as below:
where f(x) refers to the network kernel density of the location x; i is the point-type event; r represents the search bandwidth; k() means a kernel function (i.e., the distance decay function). The distance decay effect is measured via the spatial weight k (e.g., Gaussian, Quartic, etc.) [33]. This study adopts the Gaussian function, shown in the following equation set.
The Net-KDE consists of the following steps: (1) to partition all streets into segment unit with the same length; (2) to extract all the segment nodes; (3) to calculate the kernel density values of all nodes; (4) to calculate the average of the two-node KDE values per segment, and to assign the mean to the given segment; (5) to spatially visualize the street KDE values. Moreover, the shorter the segment is, the more details are addressed [31,34].
In this study, the segment length is set as 10 m with a search bandwidth of 1000 m. The spatial scale 10 m is fine enough as the segment length. When the search bandwidth is set as 1000 m, the segments with the “null” values are the fewest through numerous testing. In other words, this search bandwidth yields more segments with non-null kernel density values compared with other search bandwidths (50 m, 100 m, 500 m, 1000 m, 1500 m, 2000 m, etc.).
2.3.2. Segment Street-Based Analysis
Network analysis is applied to measure the accessibility by calculating the origin-destination (OD) distances along with the actual street network on the GIS platform. In this study, we adopt the ArcGIS 10.2 software. The community centroid is defined as the origin (O) as well as the gym as the destination (D). The paper calculates the OD accessibility, respectively, within a 10-min and a 20-min walk and sums up the walkable gyms for each given community. The 5 km/h is adopted as the pedestrian pace [35].
2.3.3. Natural Street-Based Analysis
The first two methods are spatial analytics based on street segments, while this method is on the basis of natural streets, with the complex-network thinking fundamental to the topological perspective of natural streets. A natural street is formed by joining segments with small deflection angles (e.g., less than 45 degrees). Small deflection angles ensure a good continuity between segments. Namely, the joined segments are naturally deemed as a geometrically coherent street. Moreover, the very perspective of natural streets can assist us to notice the scaling structure of far more less-connected streets than well-connected ones. Such a scaling structure is also consistent with the human activities therein [28].
The methodological framework of this study is shown in Figure 3. To decipher the street-based spatial pattern of gyms, three methods are applied. The first method is network-based KDE (Net-KDE) for aggregation analysis to test spatial heterogeneity of gyms. The second method is segmented street-based analysis, namely, network analysis in ArcGIS 10.2 for the walkable accessibility of gyms. The third method is natural street-based analysis in the context of complexity science for calculating street connectivity and exploring its association with gym accessibility.
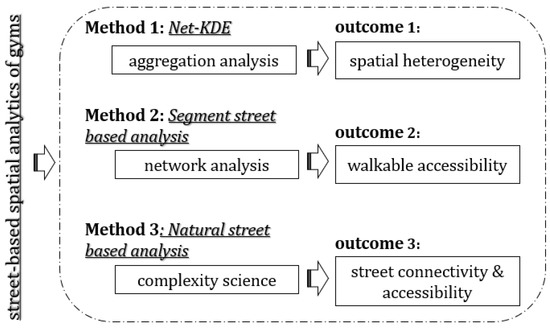
Figure 3.
Methodological framework.
3. Results
Based on big geospatial data, we have adopted geometric methods and topological analytics in the context of complexity science, namely, “segment streets” and complex networks derived from the topology of “natural streets”. Then, the street-based spatiality of gyms is deciphered by spatial statistics, segment street-based analytics and natural street-based analytics. The results of the case study of Wuhan are listed below.
3.1. Spatial Statistics of Gyms
Table 1 statistically depicts the distribution of gyms in Wuhan’s MCZ. The gym density is 0.94 on average, that is, almost one gym per square kilometer. In the Hankou township, the gym density per district is above the mean 0.94, with the highest value 2.72 of the Jianghan district, then 1.25 of the Jiang’an district, and 1.07 of the Qiaokou district. In the Wuchang township, the gym density varies greatly, with the highest is 1.89 of the Wuchang district (higher than 0.94), yet 0.4 of the Hongshan district and 0.8 of the Qingshan district of Wuchang (lower than 0.94). In the Hanyang Township, the gym density of 0.59 is much lower than the average of 0.94 as well. Numerically, this table suggests the uneven spatial distribution of gyms per district in MCZ.

Table 1.
Basic descriptions of the main city zone (MCZ).
Figure 4 further spatializes the distribution of these gymnasiums. Figure 4a presents that Wuhan totally harbors 565 gyms, 83% of which (471 gyms) locate within the main city zone (MCZ). Figure 4b visualizes that gyms are clustered in an imbalanced distribution.
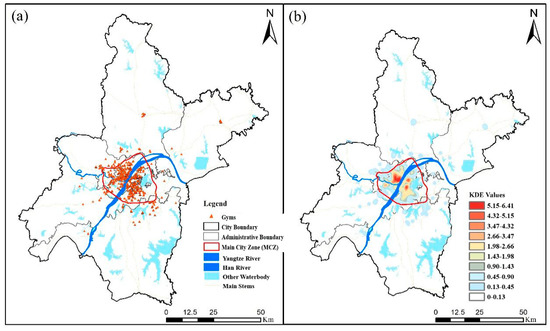
Figure 4.
The spatialization of gyms: (a) spatial distribution; (b) spatial pattern.
3.2. Gym Spatiality Characterized by Segment Street
3.2.1. Spatial Pattern of Gyms Based on Net-KDE
Figure 5 reflects the spatial pattern of gyms through spatializing the Net-KDE values two-dimensionally and three-dimensionally, respectively, in Figure 5a,b. As shown in these two maps, all the Net-KDE values are classified into ten ranks (i.e., 1–10 from the highest to the lowest, i.e., from red to blue) by the natural break function in ArcGIS 10.2. The higher the rank is, the more aggregated gyms are. Given the ranks above 5 in red or orange, gym clusters are clearly identified.
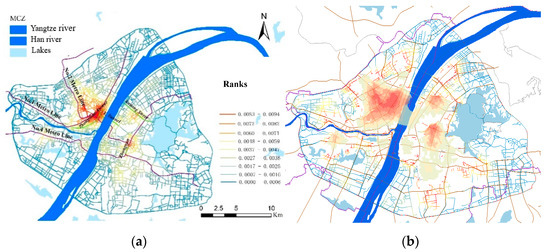
Figure 5.
Gym network-based kernel density estimation (Net-KDE) visualization in the main city zone (MCZ): (a) two-dimensional; (b) three-dimensional.
Table 2 describes the geographic characteristics of these clusters, referring to Baidu Map (similar to Google Map). We observe that clusters are all around the metro stations and commercial centers. This implies that the gym clusters are formed due to traffic and commercial forces.
Table 2.
Geographic characteristics of gym clusters.
3.2.2. The Walkable Accessibility of Gyms by Segment-Based Network Analysis
Figure 6 visualizes the community-to-gym walkable accessibility within 10 and 20 min by the segment-based network analysis function in ArcGIS 10.2. The 471 orange points represent gyms, and the 1008 green points are communities. The purple line embodies the accessibility from one certain community to the reachable gym along the streets. The shorter the line is, the less time will be spent walking to the gym. Moreover, the communities covered by aggregated purple lines could be deemed as the easily walkable communities to sportive venues, namely the communities with higher gym accessibility. Figure 6a uncovers that more communities are with higher gym accessibility within a 10-min walk in the Hankou township than the two other townships. Figure 6b illustrates the communities reachable to the gym within a 20 min walk. The aggregated purple lines reveal the communities with higher gym accessibility as well.
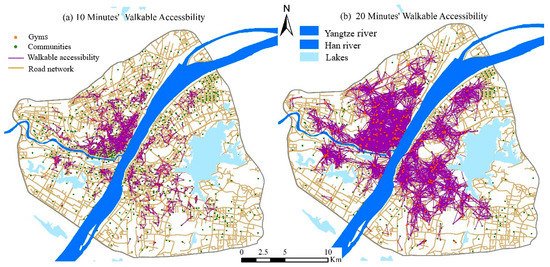
Figure 6.
Community-to-gym accessibility: (a) 10-min walk; (b) 20-min walk.
Further, we totalize the number of communities that possess the same number of accessible gyms within 10 min and 20 min walk, respectively shown in Figure 7 (panels a,b), and the power-law spatial distribution regularity is discovered in Figure 7 (panels c,d). The power-law detection method is based on the minimum likelihood by which the power-law exponent and the goodness-of-fit index (p-value) are accurately examined [36]. Data characterized as a power-law distribution should satisfy two conditions: The exponent ranges between the value 1 to 3 and p-value 0.01. In this work, exponents for two data sets are 2.77 and 2.49, and the p-values are 0.14 and 0.59, respectively. In the histograms of Figure 7, the X-axis represents the number of accessibility gyms (NAG) per community within a 10-min walk, while the Y-axis the summation of communities per x-axis value (NAG). Taking Figure 7a, for instance, the NAG (2) with the NC value (129) represents there are a total of 129 communities that are reachable merely 2 gyms within a 10-min walk. Communities with more NAG imply higher accessibility to gyms. The smallest NAG (1) with the largest NC (200) addresses there are 200 communities covering only one gym within a 10-min walk, while the largest NAG (16) with the smallest NC (200) means that there exists just one community reachable to at most 16 gyms within a 10-min walk. It is interesting to discover that the y-axis values decrease with the increment of the x-axis values. This suggests most communities are with lower accessibility of gyms, while a few possess higher accessibility.
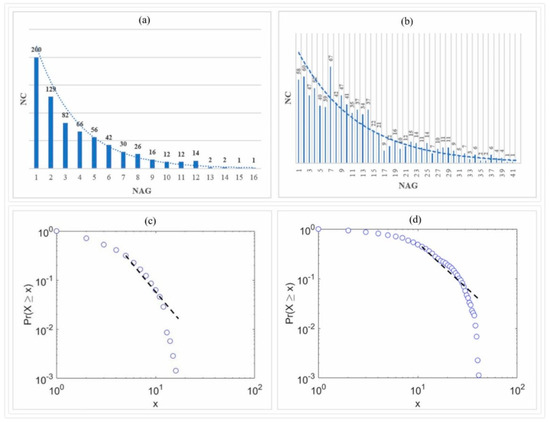
Figure 7.
Power-law distribution of community-to-gym accessibility: (a) the histogram of 10-min walk; (b) the histogram of 20-min walk; (c) the power-law distribution of 10-min walk; (d) the power-low distribution of 20-min walk
Likewise, the largest NAG (41) with the smallest NC (1) in Figure 7b means that there is only one community covering up to 41 gyms within a 20-min walk. Meanwhile, this community is with the highest gym accessibility. The largest NC (67) with the NAG (7) shows that there are 67 communities with 7 reachable gyms through a 20-min walk. The smallest NAG (1) with the NC (58) refers to there are a total of 58 communities that reach merely one gym within a 20-min walk. The downtrend of the y-axis values is also apparent with the increment of the x-values. Given the computed averages of NAG within 10-min and 20-min walk are, respectively, 2.5 and 10, this table numerically reflects that the communities are imbalanced in terms of their gym accessibility.
3.3. Gym Spatiality Characterized by Natural Street
Figure 8 displays the street network of MCZ in Wuhan, respectively, from the perspective of segment street and natural street. Panels a and b show the segment street. Panels c and d visualize the natural street. Obviously, the natural street is organic and holds the scaling pattern; namely, there are a great many less-connected streets (in blue), while only a few well-connected ones (in red or orange). By contrast, segment street is merely a mechanistic structure lacking a scaling pattern because the connectivity of all segments shows little difference among each other.
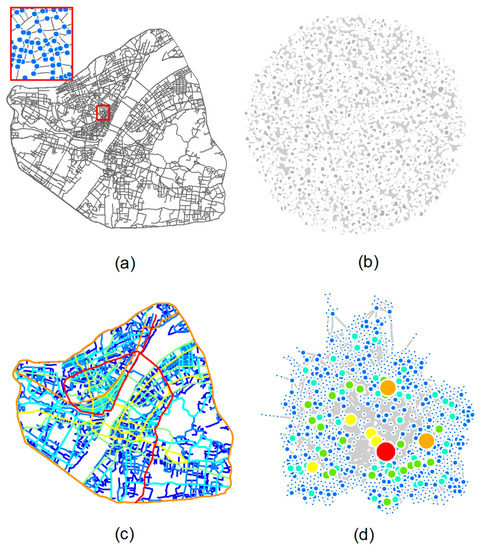
Figure 8.
The transformation from segment street (panels a and b) to the natural street (panels c and d). Note: The enlarged inset in panel (a) shows the segments that are chopped at the road junctions, whereas their street counterparts in panel (c) are continuous without chopping.
Figure 9a–f visualizes the association between the street connectivity and the accessibility of gyms along each natural street within 50 m, 100 m, 200 m, 500 m, 800 m, and 1000 m, respectively. Specifically, the x-axis represents the connectivity of each natural street. The higher the value is, the higher the connectivity is. The y-axis shows the number of accessible gyms along each natural street within multiple reachable distances (i.e., 50 m, 100 m, 200 m, 500 m, 800 m, and 1000 m). This figure reveals the polynomial curve fitting with high goodness exists between the street connectivity and the multi-distance accessibility of gyms. The R2 values are 0.968, 0.943, 0.942, 0.870, 0.769 and 0.992, respectively for Figure 9a–f. The main trend of this figure is that the higher the street connectivity is, the more gyms there are. Yet when the street connectivity increases to around 100, the number of accessible gyms decreases. This suggests that the street connectivity positively correlates with the accessibility of gyms in most instances. Yet the turning point of the x-axis (around 100) means that it is always the higher connectivity the street is, the higher the accessibility of the gyms is. That is, an underlying threshold of the street connectivity may exist for the optimum access to gyms.
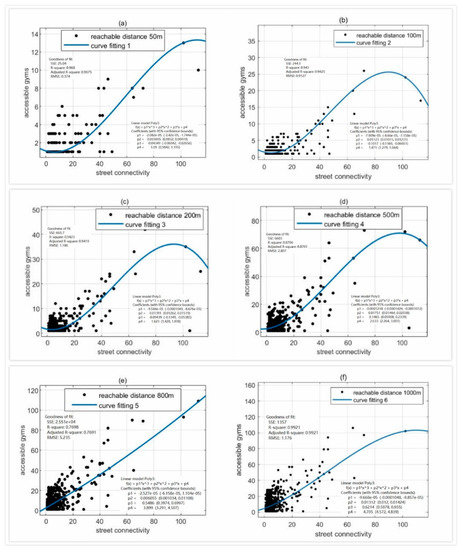
Figure 9.
The association of street connectivity and multi-distance gym accessibility: (a) 50 m; (b) 100 m; (c) 200 m; (d) 500 m; (e) 800 m; (f) 1000 m.
4. Discussion
4.1. Research Findings
The spatiality of gyms is very heterogenous and shown in the following aspects: (1) The spatial pattern of gyms is clustered and distributed unevenly. Four clusters are detected, the largest one in Hankou Township, two in Wuchang Township, and the smallest one in Hanyang Township. (2) The spatial accessibility of gyms is characterized by imbalanced distribution as well at the community scale. Moreover, the heterogeneity of walkable access to gyms shows remarkable power-law characteristics within both 10 and 20-min walks. Given that the highly heterogeneous statistics are normally discovered in urban functional or morphological quantities, following striking scaling laws includes “a great many small things, a few large things, and some things in between, all of which results in the great heterogeneity of human urban movements” [37,38,39]. This indicates that a minority of communities account for a majority of accessible gyms. Alternatively, most communities hardly get access to gyms within 10 and 20 min walk. This further verifies that “human activities on an urban scale tend to follow a heavy-tailed distribution rather than a normal or uniform one” [28]. (3) The polynomial fitting is found between street connectivity and the reachable gyms at multiple distances, and the fitting goodness is fairly high. That is, where the street connectivity is high, where the reachable gyms are normally more.
4.2. Research Strengths and Limitations
4.2.1. Strengths
For identifying the spatial pattern of gyms, Net-KDE is adopted for identifying the spatial distribution based on segment streets instead of the traditional KDE without considering street network. Given that segment streets, natural street representation is adopted as the topologically analytical technique in complexity science, which predicts human activities better. This article examines the street-based spatiality of gymnasiums from a comprehensive perspective by not merely GIS-based geometric analysis but also topological analysis in the context of complexity science. Based on the segment streets, the spatial regularities of gymnasiums are found, namely, the remarkable power-law distribution concerning the walkability from communities to gyms. From the natural street perspective, the polynomial fitting is revealed concerning the relationship between the accessibility of gyms and the street connectivity. In a nutshell, this study enriches the theory of sports geography by the revealed spatial regularities of gyms (i.e., the power-law distribution concerning the walkable gyms and the polynomial fitting between gym accessibility and street connectivity) and enriches the methods (Net-KDE and natural street-based analytics) besides the classical KDE and segment street-based analytics.
4.2.2. Limitations
The limitations are: (1) More sportive venues (e.g., dancing halls, martial arts centers, tennis courts, natatoriums) should be involved in the future; (2) a measure of accessibility from just the residence, not multiple other potential places (e.g., the workplace, all visited locations, etc.); (3) merely spatial accessibility of gyms is combined, the personal preferences of gym choices are not involved; (4) how to optimize the spatial pattern of gyms remains to be combined in further studies; (5) besides static geo-big data, more dynamic spatial data (e.g., traffic flows, etc.) should be involved for discovering more spatial regularities towards healthy city development; (6) this study mainly focuses on the spatiality of gyms from the street-based accessibility perspective, the utility of gyms, the interaction between spatial pattern and other socioeconomic factors (e.g., customer gender, income, job, even weather, etc.) remains to be further explored. (7) Even though physical activities (e.g., fitness in gyms) benefit public health to some extent [40,41], yet it is worth noticing that healthier life or healthier city is not mainly decided on exercises in gyms, and that other common physical activities (e.g., natural movement, etc.) make even greater contributions to public health and need more attention paid by both people and the authorities [42]. This study mainly focuses on joining gyms; other types of physical activities for a healthy city should be further researched.
4.2.3. Policy Implications
The policy implications of this study are as follows: (1) For the reallocation of sportive venues. Sports participation effectively prevents diseases like diabetes, obesity, several cancers, etc. [43,44]. The built environmental characteristics (e.g., the proximity to sports venues) contribute to sports participation [45,46]. To enhance public health, it is actually hard to alter the individual health-related activities, whereas to optimize the location of sportive venues, e.g., allocating more sports facilities in deprived regions by restructuring the configuration to eliminate health inequalities. (2) For the communities with low gym accessibility, authorities may take measures to supply more sports facilities or take further social investigations to identify whether they are health-deprived communities or not. (3) For improving traffic planning towards easier health access concerning the healthy city. The higher the street connectivity is, the easier people get access to gyms. In this sense, the street connectivity should be enhanced. On the other hand, the underlying threshold of the street connectivity (around 100) must be considered. The traffic authorities may evaluate and quantify the status quo of the street connectivity, strengthen the streets with low connectivity values, and meanwhile diagnose those with higher connectivity values compared with the threshold for avoiding the excessive reinforcement of the street connectivity.
5. Conclusions
Urban spatial structure influences the chances of human participation in sports to some extent. For sportive venues, to discover their spatial regularities has the potential to improve public health through optimizing their allocation towards healthy city development. To date, the geometric analysis is normally adopted to explore the spatiality of sportive venues. Nevertheless, the topological analysis in complexity science is hardly concerned, despite it is more consistent with the actual status quo of urban space. This study is motivated by combining these two aspects (both geometric methods and complexity science) to examine the street-based spatiality of sportive venues with a specific focus on gyms. This study has found: first, the heterogeneity of gyms exists with four clusters, implying the health inequality; second, the community-to-gym walkability fits the power-law distribution, suggesting that the distribution of human activities in cities tends to be heavy-tailed; third, the polynomial curve fitting is revealed with fair goodness for the association between the street connectivity and the gyms’ multi-distance accessibility. This study contributes to spatially oriented strategies-making towards healthy city planning.
Author Contributions
Conceptualization, Y.J. and J.C.; methodology, J.C. and D.M.; formal analysis, Y.J. and D.M.; resources, Y.L. and J.C.; writing—original draft preparation, Y.J.; writing—review and editing, Y.J. and Y.C.; visualization, Y.J. and D.M.; supervision, J.C.; project administration, S.Z. All authors have read and agreed to the published version of the manuscript.
Funding
This research was funded by National Natural Science Foundation of China, grant number 41901201, the Fundamental Research Funds for the Central Universities, grant number CCNU20QN034, and China Postdoctoral Science Foundation [Grant No. 2019M663038].
Institutional Review Board Statement
Not applicable.
Informed Consent Statement
Not applicable.
Data Availability Statement
The data presented in this study are available on request from the corresponding author. The data are not publicly available.
Conflicts of Interest
The authors declare no conflict of interest.
References
- Ewing, R.; Cervero, R. Travel and the built environment: A meta-analysis. J. Am. Plan. Assoc. 2010, 76, 265–294. [Google Scholar] [CrossRef]
- Giles-Corti, B.; Vernez Moudon, A.; Reis, R.; Turrell, G.; Dannenberg, A.L.; Badland, H.; Foster, S.; Lowe, M.; Sallis, J.F. City planning and population health: A global challenge. Lancet 2016, 388, 2912–2924. [Google Scholar] [CrossRef]
- Woodcock, J.; Edwards, P.; Tonne, C.; Armstrong, B.G.; Ashiru, O.; Banister, D.; Beevers, S.; Chalabi, Z.; Chowdhury, Z.; Cohen, A.; et al. Public health benefits of strategies to reduce greenhouse emissions: Urban land transport. Lancet 2009, 374, 1930–1943. [Google Scholar] [CrossRef]
- Roberts, I.; Edwards, P. The Energy Glut: The Politics of Fatness in an Overheating World; Zed Books Limited: London, UK, 2010. [Google Scholar]
- Sallis, J.; Spoon, C.; Cavill, N.; Engelberg, J.K.; Gebel, K.; Parker, M.; Thornton, C.M.; Lou, D.; Wilson, A.L.; Cutter, C.L.; et al. Co-benefits of designing communities for active living: An exploration of literature. Int. J. Behav. Nutr. Phys. Act. 2015, 12. [Google Scholar] [CrossRef]
- Sallis, J.; Bull, F.; Burdett, R.; Frank, L.D.; Griffiths, P.; Giles-Corti, B.; Stevenson, M. Use of science to guide city planning policy and practice: How to achieve healthy and sustainable future cities. Lancet 2016, 388, 2936–2947. [Google Scholar] [CrossRef]
- Khan, K.M.; Thompson, A.M.; Blair, S.N.; Sallis, J.F.; Powell, K.E.; Bull, F.C.; Bauman, A.E. Sport and exercise as contributors to the health of nations. Lancet 2012, 380, 59–64. [Google Scholar] [CrossRef]
- Stenner, B.J.; Buckley, J.D.; Mosewich, A.D. Reasons why older adults play sport: A systematic review. J. Sport Health Sci. 2020, 9, 530–541. [Google Scholar] [CrossRef]
- World Health Organization. Global Recommendations on Physical Activity for Health; 65 Years and Above; World Health Organization: Geneva, Switzerland, 2011. [Google Scholar]
- China State Council. China’s New National Fitness Plan and Opportunities in the Sports Industry (2016–2020); China State Council: Briefing, China, 2016. [Google Scholar]
- Isoaholo, S.E.; Weissinger, E. Leisure and well-being: Is there a connection? Aust. Parks Recreat. 1984, 19, 40–44. [Google Scholar]
- Kania, A. Hospital-health and fitness centers promote wellness. Health Care Strateg. Manag. 1993, 11, 18–23. [Google Scholar]
- Ravenscroft, N. The vitality and viability of town centers. Urban. Stud. 2000, 37, 2533–2549. [Google Scholar] [CrossRef]
- Peters, K.B.M. Leisure in Public Spaces: Does It Contribute to Social Cohesion in Dutch Neighborhoods; ISA World Congress of Sociology, International Sociological Association: Gothenburg, Sweden, 2010. [Google Scholar]
- King, H.; Gierisch, J.; Williams, J.W., Jr.; Maciejewski, M.L. Effects Of Health Plan-Sponsored Fitness Center Benefits On Physical Activity, Health Outcomes, And Health Care Costs And Utilization: A Systematic Review; Department of Veterans Affairs: Washington, DC, USA, 2012. [Google Scholar]
- Schwab, K.; Dustin, D. Just Leisure: Things that We Believe in; Sagamore: Urbana, IL, USA, 2013. [Google Scholar]
- Floyd, M.E. Social justice as an integrating force for leisure research. Leis. Sci. 2014, 36, 379–387. [Google Scholar] [CrossRef]
- Liu, Y.L.; Jing, Y.; Cai, E.; Cui, J.; Zhang, Y.; Chen, Y. How leisure venues are and why? A geospatial perspective in Wuhan, Central China. Sustainability 2017, 9, 1865. [Google Scholar] [CrossRef]
- Jing, Y.; Liu, Y.; Cai, E.; Liu, Y.; Zhang, Y. Quantifying the spatiality of urban leisure venues in Wuhan, Central China—GIS-based spatial pattern metrics. Sustain. Cities Soc. 2018, 40, 638–647. [Google Scholar] [CrossRef]
- Shrestha, S.; Kestens, Y.; Thomas, F.; El Aarbaoui, T.; Chaix, B. Spatial access to sport facilities from the multiple places visited and sport practice: Assessing and correcting biases related to selective daily mobility. Soc. Sci. Med. 2019, 236, 112406. [Google Scholar] [CrossRef]
- Higgs, G.; Langford, M.; Norman, P. Accessibility to sport facilities in Wales: A GIS-based analysis of socio-economic variations in provision. Geoforum 2015, 62, 105–120. [Google Scholar] [CrossRef]
- Boone-Heinonen, J.; Popkin, B.M.; Song, Y.; Gordon-Larsen, P. What neighborhood area captures built environment features related to adolescent physical activity? Health Place 2010, 16, 1280–1286. [Google Scholar] [CrossRef]
- Karusisi, N.; Thomas, F.; Méline, J.; Chaix, B. Spatial accessibility to specific sport facilities and corresponding sport practice: The Record Study. Int. J. Behav. Nutr. Phys. Act. 2013, 48, 1–10. [Google Scholar] [CrossRef]
- Cutumisu, N.; Spence, J. Sport Fields as Potential Catalysts for Physical Activity in the Neighborhood. Int. J. Environ. Res. Public Health 2012, 9, 294–314. [Google Scholar] [CrossRef]
- Ogilvie, D.; Lamb, K.E.; Ferguson, N.S.; Ellaway, A. Recreational physical activity facilities within walking and cycling distance: Sociospatial patterning of access in Scotland. Health Place 2011, 17, 1015–1022. [Google Scholar] [CrossRef]
- Lamb, K.E.; Ferguson, N.S.; Wang, Y.; Ogilvie, D.; Ellaway, A. Distribution of physical activity facilities in Scotland by small area measures of deprivation and urbanicity. Int. J. Behav. Nutr. Phys. Act. 2010, 7, 76. [Google Scholar] [CrossRef]
- Jiang, B.; Zhao, S.; Yin, J. Self-organized natural roads for predicting traffic flow: A sensitivity study. J. Stat. Mech. Theory Exp. 2008, 2008, P07008. [Google Scholar] [CrossRef]
- Ma, D.; Osaragi, T.; Oki, T.; Jiang, B. Exploring the heterogeneity of human urban movements using geo-tagged tweets. Int. J. Geogr. Inf. Sci. 2020, 34, 2475–2496. [Google Scholar] [CrossRef]
- Ma, D.; Omer, I.; Osaragi, T.; Sandberg, M.; Jiang, B. Why topology matters in predicting human activities. Environ. Plan. B Urban Anal. City Sci. 2018, 46, 1–17. [Google Scholar] [CrossRef]
- Tu, W.; Liu, Q. Illustrating the History of Wuhan; Wuhan Press: Wuhan, China, 2010. [Google Scholar]
- Okabe, S.; Satoh, T.; Sugihara, K. A kernel density estimation method for networks, its computational method and a GIS-based tool. Int. J. Geogr. Inf. Sci. 2009, 23, 1365–8816. [Google Scholar] [CrossRef]
- Ni, J.; Qian, T.; Xi, C.; Rui, Y.; Wang, J. Spatial distribution characteristics of healthcare facilities in Nanjing: Network point pattern analysis and correlation analysis. Int. J. Environ. Res. Public Health 2016, 13, 833. [Google Scholar] [CrossRef]
- Levine, N. CrimeStat III: A Spatial Statistics Program for the Analysis of Crime Incident Locations; Ned Levine & Associates: Houston, TX, USA, 2004. [Google Scholar]
- Xie, Z.; Yan, J. Kernel density estimation of traffic accidents in a network space. Comput. Environ. Urban. Syst. 2008, 32, 396–406. [Google Scholar] [CrossRef]
- Millward, H.; Spinney, J.; Scott, D. Active-transport walking behavior: Destinations, durations, distances. J. Transport. Geogr. 2013, 28, 101–110. [Google Scholar] [CrossRef]
- Clauset, A.; Shalizi, C.R.; Newman, M.E.J. Power-law distributions in empirical data. SIAM Rev. 2009, 51, 661–703. [Google Scholar] [CrossRef]
- Bettencourt, L.; Lobo, J.; Helbing, D.; Kühnert, C.; West, G.B. Growth, innovation, scaling and the pace of life in cities. Proc. Natl. Acad. Sci. USA 2007, 104, 7301. [Google Scholar] [CrossRef]
- Batty, M. The size, scale, and shape of cities. Science 2008, 319, 769. [Google Scholar] [CrossRef]
- Bettencourt, L. The origins of scaling in cities. Science 2013, 340, 1438. [Google Scholar] [CrossRef] [PubMed]
- Pate, R.R.; Mclver, K.; Colabianchi, N.; Troiano, R.P.; Reis, J.P.; Carroll, D.D.; Fulton, J.E. Physical Activity Measures in the Healthy Communities Study. Am. J. Pre Med. 2015, 49, 653–659. [Google Scholar] [CrossRef][Green Version]
- Silva, M.; Cashman, S.; Kunte, P.; Candib, L.M. Improving Population Health Through Integration of Primary Care and Public Health: Providing Access to Physical Activity for Community Health Center Patients. Am. J. Public Health 2012, 102, e56–e61. [Google Scholar] [CrossRef] [PubMed]
- Merie, A. The healthiest people in the world don’t go to the gym. Quartz Blue Zones. 7 November 2018. Available online: https://qz.com/quartzy/1452630/the-healthiest-people-in-the-world-dont-go-to-the-gym/ (accessed on 12 January 2021).
- Wannamethee, S.G.; Shaper, A.G. Physical activity in the prevention of cardiovascular disease: An epidemiological perspective. Sports Med. 2001, 31, 101–114. [Google Scholar] [CrossRef]
- Warburton, D.E.; Nicol, C.W.; Bredin, S.S. Health benefits of physical activity: The evidence. CMAJ 2006, 174, 801–809. [Google Scholar] [CrossRef]
- Beenackes, M.A.; Kamphuis, C.B.; Burdorf, A.; Mackenbach, J.P.; van Lenthe, F.J. Sports participation, perceived neighborhood safety, and individual cognitions: How do they interact? Int. J. Behav. Nutr. Phys. Act. 2011, 8, 76. [Google Scholar] [CrossRef]
- Kamphuis, C.B.; Van Lenthe, F.J.; Giskes, K.; Huisman, M.; Brug, J.; Mackenbach, J.P. Socioeconomic status, environmental and individual factors, and sports participation. Med. Sci. Sports Exerc. 2008, 40, 71–81. [Google Scholar] [CrossRef]


Publisher’s Note: MDPI stays neutral with regard to jurisdictional claims in published maps and institutional affiliations. |
© 2021 by the authors. Licensee MDPI, Basel, Switzerland. This article is an open access article distributed under the terms and conditions of the Creative Commons Attribution (CC BY) license (http://creativecommons.org/licenses/by/4.0/).