Abstract
Net Primary Productivity (NPP) can effectively reflect the characteristics and strength of the response to external disturbances on estuarine alluvial island ecosystems, which can provide evidence for regulating human development and utilization activities and improving blue carbon capacity. However, there are a few studies on NPP of estuarine alluvial islands. We established a model based on a Carnegie–Ames–Stanford Approach (CASA) to estimate NPP on Chongming Island, a typical estuarine alluvial island, by considering the actual ecological characteristics of the island. The NPP of different land-cover types and protected areas in different years and seasons were estimated using Remote Sensing and Geographic Information System as the main tools. Correlations between NPP and Remote Sensing-based spatially heterogeneous factors were then conducted. In the last 30 years, the mean NPP of Chongming Island initially increased and then slowly decreased, while total NPP gradually increased. In 2016–2017, Chongming Island total NPP was 422.32 Gg C·a−1, and mean NPP was 287.84 g C·m−2·a−1, showing significant seasonal differences. NPP showed obvious spatial differentiation in both land-cover and protected area types, resulting from joint influences of natural and human activities. Chongming Island vegetation growth status and cover were the main factors that positively affected NPP. Soil surface humidity increased NPP, while soil salinity, surface temperature, and surface aridity were important NPP limiting factors.
1. Introduction
Estuarine alluvial islands have unique ecosystem characteristics due to the impact of nature and human activities [1,2,3]. Intense land–sea interactions [4,5] include morphological changes to islands, and are dominated by sedimentation and supplemented by erosion [3,6,7,8,9,10], seawater intrusion and soil salinization [2,11], sea level rise [4,12,13], and coastal erosion [14]. Interference caused by complex human activities [15], such as urban and rural construction, land reclamation, farmland expansion, coastal engineering, and aquaculture, have jointly caused spatiotemporal changes in the surface characteristics of estuarine alluvial islands [9,16,17,18,19]. Moreover, they have caused environmental, economic, and social vulnerabilities to be more obvious than on rocky islands [2,20,21,22,23].
Net primary productivity (NPP) represents the net accumulation of organic matter by plants under the influence of external factors such as temperature, precipitation, solar radiation, CO2 concentration, and nitrogen deposition [24,25]. It is calculated by subtracting autotrophic respiration from gross primary productivity fixed through photosynthesis per unit time and unit area. NPP reflects the productive capacity of vegetation under natural environmental conditions and characterizes ecosystem quality. It is an important indicator of ecosystem vitality and sustainable development [25], and can reflect the characteristics and strength of an estuarine alluvial island ecosystem response to different external disturbances.
Additionally, NPP represents the ecosystem carbon budget [24,26]. Therefore, accurately assessing NPP status and spatiotemporal distribution characteristics of a typical blue carbon ecosystem such as an estuarine alluvial island is highly significant because it can provide evidence for regulating human development and utilization activities and improving the blue carbon capacity of islands according to their potential and changing patterns.
Sampling surveys, fixed-site observations, and model simulations have been used in NPP research worldwide [27]. However, approaches for estimation have changed from traditional ecological measurement to modern approaches supported by remote sensing (RS), geographic information system (GIS), and global navigation satellite system (GNSS). Data sources have also changed from simple field measurements to comprehensive technological application of massive RS, GIS, and flux observational data. Related research has involved grassland [28,29,30], forest [31,32], mangroves [33,34,35], bamboo forest [36], and farmland [37]. Furthermore, research has been conducted at different spatial scales from individual [38], landscape [39], regional [40,41], and even global [42,43]. Regional and global ecosystem NPP is difficult to measure directly and comprehensively, so it is often evaluated through model estimation. RS-based light energy utilization models, such as the CASA [44,45], GLO-PEM [32,46], and C-Fix [47], are effective research tools with good potential [30]. Among them, the CASA model has been widely used in regional and global NPP estimation due to its simplicity, comprehensive calculation environment and parameters, possibility of estimating different degradation types, and flexibility in space and time [30,48]. Therefore, many NPP studies have been conducted for different ecosystem types in different regions at different spatiotemporal scales and the research methods are relatively mature. A few studies have investigated vegetation NPP on rocky islands [34,49,50], but NPP studies on estuarine alluvial islands are scarce.
Chongming Island is the largest estuarine alluvial island in the world and is a representative coastal blue carbon ecosystem in China [2]. With a unique geographic location and massive sediment sources, the island ecosystem is composed of rich and intact wetland vegetation and has become a habitat for many endangered bird species [51]. However, as an estuarine alluvial island, Chongming Island is characterized by the ecological vulnerability. The island is in an unstable state of continuous siltation from the river and sea, so it is greatly affected by global climate change, sea level rise, and seawater intrusion. Therefore, the overall island ecological condition and carrying capacity are relatively fragile [17,20,23,52]. Furthermore, as agricultural activities, urban construction, and coastal reclamation have directly occupied and divided natural landscapes and habitats, various human activities have greatly changed the ecological characteristics of the island [2]. Some water bodies exhibit eutrophication, and soil heavy metal exceeds the safe standard at some sites [51]. Invasion of alien species such as Spartina alterniflora Lois. and Solidago canadensis Linn. as well as vegetation restoration measures are also significantly affecting island plant diversity [52]. Since the beginning of the 21st century, the ecological value of Chongming Island has become a focus of attention. In 2001, the Shanghai Municipal Government proposed the ideology of “ecological island construction” for Chongming [53]. Chongming’s 13th Five-Year Plan included the development goal of becoming a “world-class ecological island” [54]. To maintain the island ecosystem, a wide range of ecological measures were taken for environmental protection, pollution prevention, circular economy, and green living, along with institutional reforms for ecological island construction [51]. The abovementioned factors have caused drastic spatiotemporal variations in island land-cover types, thereby affecting NPP and its spatial distribution.
Using Landsat 5/8 Multi-Band Remote Sensing images and meteorological data, this paper applied the CASA model to characterize NPP spatiotemporal variations on Chongming Island over the past 30 years, with a time interval of approximately 10 years. Then, the correlations between NPP and spatial heterogeneity factors based on Remote Sensing, including normalized difference vegetation index (NDVI), salinity index (SI), land surface wetness (LSW), index-based built-up index (IBI), bare soil index (BSI), and land surface temperature (LST) were analyzed in different years and seasons, as well as the correlation between these factors (Figure 1). This study aims to answer the following three scientific questions: (1) How is vegetation NPP measured on an estuarine alluvial island across different years and different seasons, based on Remote Sensing? (2) What are the spatiotemporal characteristics of vegetation NPP under the multiple influences of intensive land–sea interactions and human activities? (3) Which factors control the spatiotemporal variations of vegetation NPP on an estuarine alluvial island?
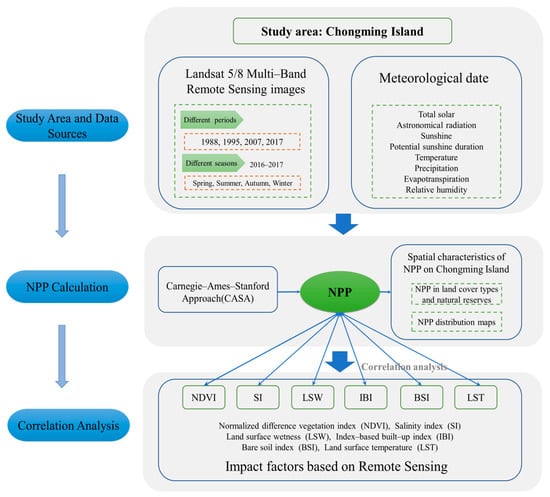
Figure 1.
Research framework.
2. Materials and Methods
2.1. Study Area
Chongming Island is the largest estuarine alluvial island in the world and the third largest island in China. It is located in the Yangtze River estuary, Chongming District, Shanghai [9,14]. The island is approximately 80 km east–west and 13–18 km north–south [2,21]. Due to continuous sediment accumulation from the Yangtze River, the island’s area is increasing at a rate of approximately 7.39 km2 annually during 1988–2017. Chongming Island is in the northern subtropical marine monsoon climate zone and has a mild and humid climate with four distinct seasons, adequate sunshine, and abundant precipitation [55]. The annual average temperature is 15.3 °C [21,56], and the annual average rainfall is 1022 mm [56]. Both temperature and rainfall change seasonally. The average temperature and precipitation are the highest in summer (26.0 °C and 486.6 mm, respectively) and the lowest in winter (4.7 °C and 146.6 mm, respectively) [57].
The island has a flat terrain, with 90% of the land between 3.21 m and 4.20 m altitude (Wusong Benchmark) [2,21]. The central and northeast portions of the island are higher than in the southwest and east. As a typical plain basin, the island has a dense river network consisting of 1119 rivers totaling 2028 km [20]. The main ecosystems of Chongming Island are agricultural land and natural wetland. Agricultural land dominates, and includes activities such as farming, planting, and pond farming. Chongming Island has long been regarded as the “granary” of Shanghai [2,26].
Chongming Island is an important estuarine wetland ecosystem which is widely distributed along the coastline and provides important habitats for migratory birds and many aquatic species [51,58]. Island bird species account for approximately 1/3 of the bird species in China. To protect migratory birds, estuarine wetland, and forest resources, a number of natural ecological protection areas have been established, including Chongming Dongtan Nature Reserve, Xisha Wetland, Beihu Wetland, and Dongping National Forest Park [17,51]. Nature reserves include core and ordinary protected areas: Dongtan National Nature Reserve is a core protected area, while the others are ordinary protected areas.
2.2. Data Sources
2.2.1. RS Images
Seven periods of cloud-free or low-cloud cover RS images with a resolution of 30 m × 30 m were taken by the LANDSAT 5 satellite in the summers of 1988, 1995, and 2007 and the LANDSAT 8 satellite in the spring, summer, autumn, and winter of 2016–2017. The cloud cover values of these remote sensing images were 0, 0, 0, 7.36%, 8.55%, 5.13%, and 15.59%, respectively. These values indicated the cloud covers in the entire images, but, for the study area, the cloud cover values are much lower, which could be observed in Figure 2. These images were used to represent spatiotemporal variation on Chongming Island over the past 30 years and to draw the four-year outlines of Chongming Island using the visual interpretation method based on fusion image. The shortwave infrared 2, near infrared, and red bands, which refer to bands 7, 4, and 3, respectively, in Landsat 5 data and bands 7, 5, and 4, respectively, in Landsat 8 data were fused and shown in Figure 2. The normalized difference vegetation index (NDVI) of the study area in different periods was obtained after image clipping, radiometric calibration, and band calculation within ENVI 5.3 software.
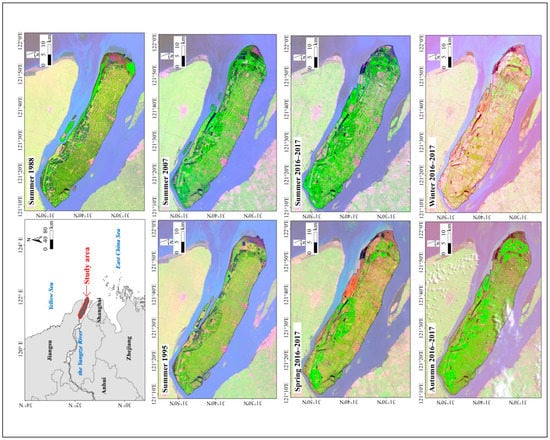
Figure 2.
Location, RS images, and outlines of the study area. The outlines in different years and location map were sourced from Chi et al. [59].
Using the RS images collected in the summers of 1988, 1995, 2007, and 2017, the land-cover types of the study area were classified into nine categories: wetland vegetation, mudflat, woodland, farmland, water area, pond, building land, traffic land, and industrial land, according to Chi et al. [59] (Figure 3). Wetland vegetation that is mainly distributed in the coastal area of the island and is composed of mainly Phragmites australis (Cav.) Trin, Scirpus mariqueter Tang et Wang, and Spartina alterniflora. Mudflat is bare wetland closer to the sea than regular wetland vegetation. Woodland refers to land cover of trees and shrubs. Because of the short land-forming history of Chongming Island, woodland is mostly planted secondary forests distributed throughout the entire island. Farmland, the landscape matrix of the island, is distributed the most broadly and over the largest area, and the main crops are wheat, rice, watermelon, and a variety of vegetable species. Water area includes the densely distributed rivers and lakes on the island, including main and secondary river channels, reservoirs, and lakes. Pond refers to regular-shaped man-made aquaculture water bodies. Building land includes urban construction, and rural residential lands. Urban construction land is mainly distributed in the densely populated central areas of townships, while rural residential land is mainly distributed on both sides of farm fields and small roads and consists mostly of local farmer villages [51]. Traffic land is composed of roads and ports. Industrial land, which is mainly used for industrial storage and industrial parks, is relatively scarce and is in the south of the island.
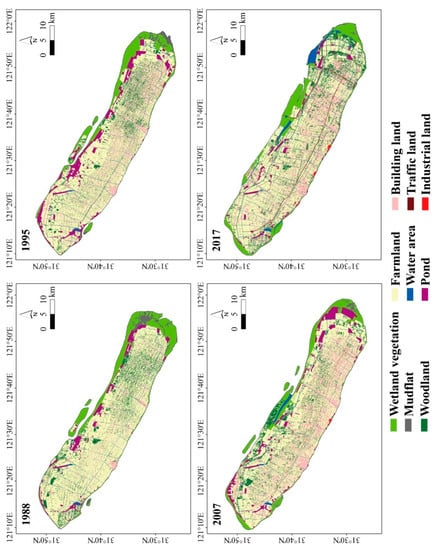
Figure 3.
Land-cover types of the study area in different years [59].
2.2.2. Meteorological Data
The meteorological data used were the long-term observational data of meteorological stations on Chongming Island and its surrounding areas. Data included total solar and astronomical radiation data obtained from He et al. [60], sunshine, and potential sunshine duration from Jin [61] and the Bureau of Statistics of Chongming District of Shanghai [62], and temperature, precipitation, evapotranspiration, and relative humidity from Gu [57] and the Bureau of Statistics of Chongming District in Shanghai [62].
2.3. Establishment of the Evaluation Model
2.3.1. NPP Calculation
By applying the CASA [44], the RS and meteorological data were used to estimate NPP in the study area. The calculation formulae are as follows:
where is the NPP at point x in month t (g C·m−2·month−1); is the photosynthetically active radiation absorbed by plants at point x in month t (MJ·m−2·month−1); is the actual light utilization rate at point x in month t (g C·MJ−1); is the photosynthetically active radiation at point x in month t (MJ·m−2·month−1), which can be taken as 50% of the total solar radiation; is the fraction of photosynthetically active radiation absorbed at point x in month t (%); and are the temperature stress factor and water stress factor (%) in month t in the study area, respectively; and is the maximum light-use efficiency of vegetation (g C·MJ−1).
(1) FPAR calculation
FPAR has significant linear relationships with NDVI and the simple ratio vegetation index (SRVI). FPAR1 and FPAR2 can be calculated using NDVI and SRVI, respectively, following the formulae given below:
where is the NDVI value at point x in month t; and and are 0.95 and 0.001, respectively. To eliminate outliers and reduce the influence of extreme values, and are set equal to the 95th- and 5th-percentile values of all NDVI values, respectively; is the SRVI at point x in month t, which is calculated using Formula (6); and are the 95th- and 5th-percentile values of all SRVI values, respectively. The formula for is
The FPAR value is more accurate when it is obtained by combining FPAR1 and FPAR2 following the formula
(2) ft and fw calculation
The ft calculation formula is
The value reflects the restriction on photosynthesis due to the plant’s intrinsic biochemical process under extreme temperature, which further affects NPP. The calculation formula of is
where is the optimal temperature, which is the mean monthly temperature in the month with the highest average NDVI (August).
The value indicates the effect on the light-use efficiency when the actual temperature is higher or lower than the optimal temperature. It is calculated as
where T is the actual average temperature of the month. When the average temperature T of a month is 10 °C higher or 13 °C lower than the optimal temperature , the value of in that month is equal to half of the value of in the month with the optimal temperature.
The variable fw reflects the impact of plant-available water conditions on the light-use efficiency of plants and is calculated following the formula
where E is the actual regional evapotranspiration obtained from the existing meteorological data and is the potential regional evapotranspiration. The latter can be calculated with the formula
where r is precipitation (mm) and is net radiation (MJ·m−2·d−1). can be obtained from the Compilation Group of Sprinkler Irrigation Engineering Design Manual [63]:
where is the reflectance, taken as 23%; n is the sunshine duration (h), N is the potential sunshine duration (h) at the given latitude, is the astronomical radiation (MJ·m−2); is the Stefan–Boltzmann constant, taken as 2 × 10⁻⁹ mm d−1K−4; is the average temperature of the month (K); and is the water vapor pressure (hPa), which can be calculated from the relative humidity and saturation vapor pressure of water at different temperatures.
(3) Calculation of
The maximum light-use efficiency () has a direct and significant impact on NPP estimation, and the value varies markedly between different plants. The P. australis plant community is distributed widely and occupies the largest area in the coastal wetland vegetation of Chongming Island [64]. There are few studies specifically on the maximum light-use efficiency of wetland vegetation, however, as reported by Chi et al. [65] in the Yellow River Delta with P. australis as the dominant species, the wetland vegetation was set at 1.257 g C/MJ. The values of other land-cover types were also chosen based on existing studies, especially the widely applied Running et al. and Zhu et al. studies [66,67]. Running et al. simulated 10 vegetation types using an ecological physiological process model and reported values in the range of 0.604–1.259 g C/MJ [66], while the simulations of Zhu et al. derived values of different Chinese vegetation types in the range of 0.389–0.985 g C/MJ according to forestry census data and the CASA model [67]. We treat woodland as mixed forest, and its was 0.942 g C/MJ, which was the average value of the evergreen and deciduous broad-leaved mixed forests derived from the results in the above two studies. The of farmland was 0.573 g C/MJ, which was the average for cultivated land vegetation in the above two studies. The maximum light-use efficiency of surface-cover types in non-vegetated areas such as mudflats, waters, ponds, building land, traffic land, and industrial land is theoretically 0. However, because the spatial resolution of RS was 30 m, vegetation appeared in these land-cover types due to unavoidable problems such as interpretation errors and mixed pixels. Therefore, we used the lowest of 0.389 g C/MJ reported by Zhu et al. [67] for these land-cover types (Table 1).

Table 1.
Maximum light use efficiency (ξmax).
2.3.2. Analysis of NPP Spatiotemporal Characteristics
NPP in the summers of 1988, 1995, and 2007 and the different seasons of 2016–2017 were each calculated. The whole-year NPP of 2016–2017 was calculated from the NPP of each season in 2016–2017.
Based on the results of NPP estimation in the summer of 1988, 1995, 2007, and 2017, the temporal changes of NPP in the study area in summer were analyzed at 10-year intervals, which can approximately represent the variation trend of NPP over the past 30 years. By comparing the NPP of spring, summer, autumn, and winter in 2016–2017, the seasonal differences of NPP in the study area were analyzed. Subsequently, the characteristics and differences of NPP were analyzed among different land-cover types by using wetland vegetation, mudflat, woodland, farmland, water area, pond, building land, traffic land, and industrial land as the study units. Similarly, the characteristics and differences in NPP were analyzed among different protection area types by using core protected areas, ordinary protected areas, and unprotected areas as the study units. Based on the estimated annual NPP (g C·m−2·a−1) of 2016–2017, the study area was divided into extremely high—(NPP > 400), high—(300 < NPP ≤ 400), moderate—(200 < NPP ≤ 300), low—(100 < NPP ≤ 200), and extremely low-productivity (NPP ≤ 100) areas.
2.3.3. Correlation Analysis of Main Influencing Factors
NPP and its spatial distribution are often affected by external environmental factors such as radiation, temperature, precipitation, vegetation, soil, and terrain [24,25]. The climatic (e.g., radiation, temperature, and precipitation) and terrain factors are spatially homogeneous in the study area. Therefore, this paper mainly considered other spatially heterogeneous factors and discuss in depth the ecological significance of RS. NDVI, salinity Index (SI), land surface wetness (LSW), index-based built-up index (IBI), bare soil index (BSI), and land surface temperature (LST) were used to analyze the correlations between spatial heterogeneity factors and NPP and among each other.
NDVI is the best indicator for comprehensively reflecting vegetation type, vegetation cover degree, and vegetation growth status [68,69,70]. SI is a basic factor to characterize soil salt content, which directly affects soil quality in estuarine areas [70,71]. LSW and LST, which are basic physical quantities of the land surface, play significant roles in the land–atmosphere interaction [72,73] and are closely related to soil salinity [74,75]. IBI and BSI, which reflect the conditions of impermeable land and bare land, respectively, can indicate the degree of surface aridity [59].
NDVI, SI, LSW, IBI, BSI, and LST were all obtained from band calculations on RS data using the following formulae [59,70,72,76,77,78,79]:
The LANDSAT 8 satellite has 11 bands, named B1–B11 [80]. Rex is the spectral reflectance of Bx, which was obtained through radiometric calibration using the metadata. The serial numbers (x) of bands in the above formulae are for LANDSAT 8 data, from which 1 is subtracted to obtain the number in the LANDSAT 5 data [59]. C2, C3, C4, C5, C6, and C7 are 0.1511, 0.1973, 0.3283, 0.3407, −0.7117, and −0.4559, respectively [72]. T10 and T11 are the at-satellite brightness temperatures (K) of the thermal infrared bands B10 and B11, which can be calculated from metadata. A and B are parameters. The detailed LST calculation method was described by Chi et al. [81].
IBM SPSS 18 software was used to analyze the simple correlations between NPP and NDVI, SI, LSW, IBI, BSI, and LST, to reveal the correlations between NPP and various RS-based impact factors in different years and seasons. A correlation was defined as weak, moderate, or strong when the absolute value of the correlation coefficient was ≤0.3, >0.3 and ≤0.6, and >0.6, respectively.
3. Results
3.1. NPP Temporal Variation Characteristics
Based on NPP estimation (Figure 4), mean NPP in the study area showed a characteristic trend over the last 30 years of an initial rise and then a slow decline, while the total NPP tended to gradually increase. Mean NPP increased significantly between 1995 and 2007. In the summers of 1988, 1995, 2007, and 2017, mean NPP was 50.44, 51.07, 58.40, and 57.30 g C·m−2·month−1, and total NPP was 63.11, 67.20, 80.94, and 84.06 Gg C·month−1, respectively. In 2016–2017, mean and total NPP showed significant seasonal differences. They were much higher in the summer than in other seasons, as shown by total summer NPP accounting for approximately 60% of the annual NPP, followed by autumn (26.11%) and spring (10.78%). In the winter, mean and total NPP were lowest, accounting for only 3.39%.
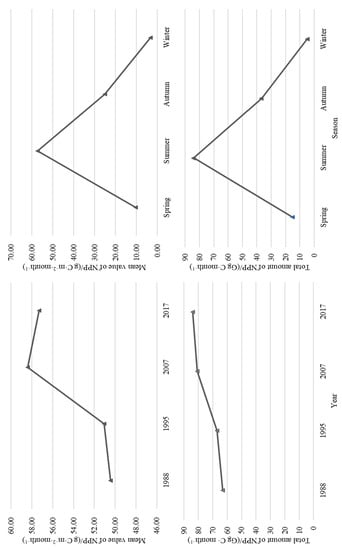
Figure 4.
Temporal variation of NPP in the whole study area.
3.2. Characteristics and Changing Trends of NPP Spatial Distribution
NPP showed significant spatial heterogeneity in all years and seasons (Figure 5 and Figure 6). In 2016–2017, among the different land-cover types (Table 2 and Table 3), mean NPP was highest in wetland vegetation, followed by farmland and woodland, while it was significantly lower in other land-cover types. Farmland had the highest total NPP, followed by woodland and wetland vegetation, and total NPP of other land-cover types was relatively low. In the last 30 years, mean and total NPP initially decreased and then increased in wetland and gradually increased in farmland, while they decreased, increased, and decreased again in woodland. NPP of wetland, farmland, and woodland varied greatly between different seasons; in summer, it was much higher than in other seasons. Furthermore, wetland vegetation mean NPP seasonal differences were more significant than other land-cover types.
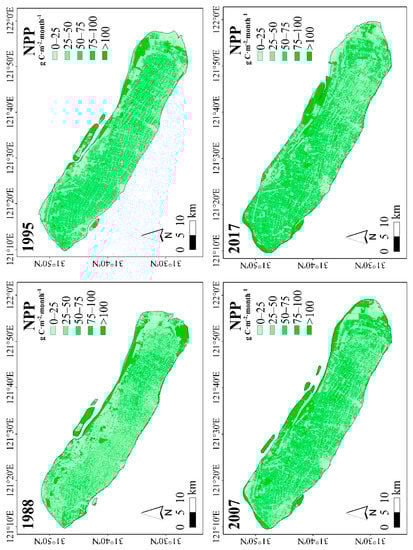
Figure 5.
Spatiotemporal characteristics of vegetation NPP in different years.
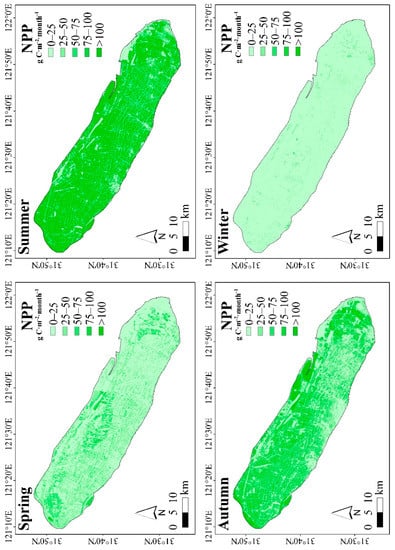
Figure 6.
Spatiotemporal characteristics of vegetation NPP in different seasons of 2016–2017.
Table 2.
NPP results of different land-cover and protected area types in the last 30 years.
Table 3.
NPP results of different land-cover and protected area types in different seasons and the whole year in 2016–2017.
NPP estimation of both protected and unprotected areas (Table 2 and Table 3) revealed that, except for 1988, when mean NPP of the core protected areas was significantly higher than in the ordinary protected areas and unprotected areas, mean NPP of the core protected areas was lower overall than in those areas from 1995 to 2017. In the last 30 years, mean NPP in core protected and ordinary protected areas showed a change pattern of falling, rising, and then falling again. NPP decline in core protected areas was more drastic than in ordinary protected areas during 1988–1995. Moreover, mean NPP in the unprotected areas increased steadily. In the different seasons of 2016 to 2017, mean NPP of core protected areas were significantly lower than ordinary protected areas and unprotected areas; however, mean NPP in protected and unprotected areas showed basically the same change patterns, although differences were more significant in summer. Due to the large difference in area covered, total NPP in unprotected areas was much higher than that in ordinary protected and core protected areas. In the last 30 years, total NPP maintained the same basic change trend as mean NPP in both protected and unprotected areas and continuously increased in the unprotected areas.
Mean annual NPP was 287.84 g C·m−2·a−1, and total NPP was 422.32 Gg C·a−1 in the study area from 2016 to 2017. Total farmland NPP accounted for 53.75%, followed by woodland, wetland, and building land, which accounted for 17.09%, 16.93%, and 9.85%, respectively. The study area was divided into five categories based on the NPP level (Figure 7), and their sizes ranked in the order: high-productivity areas (25.90%), extremely high-productivity areas (21.74%), low-productivity areas (18.68%), moderate-productivity areas (17.87%), and extremely low-productivity areas (15.80%) (Figure 6). Among the different land-cover types, wetland vegetation was mostly distributed in extremely high- and high-productivity areas, and some of the newly developed wetlands in Dongtan were located in the extremely low-productivity areas. Most of the farmland and woodland were located in high- and moderate-productivity areas. The remaining types were mostly distributed in low- and extremely low-productivity areas.
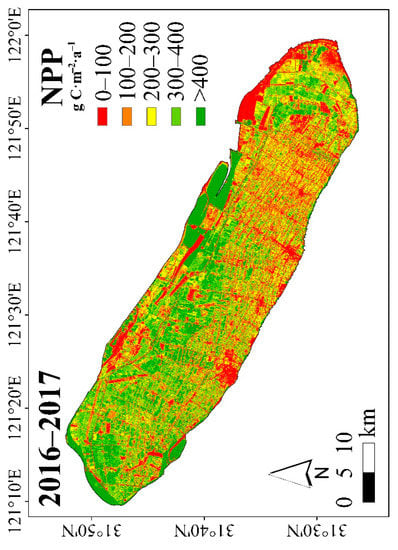
Figure 7.
Spatial characteristics of annual vegetation NPP in 2016–2017.
3.3. Correlation Analysis of Main Influencing Factors
Simple correlation analysis showed that NPP and NDVI were strongly positively correlated (p < 0.01), as evidenced by correlation coefficients >0.7 in all study years and seasons (Table 4). The correlation between NPP and LSW increased overall from weak in 1988–2007 to moderate in 2016–2017 (except for the winter). NPP was strongly negatively correlated with SI (p < 0.01), weakly or moderately negatively correlated with IBI and LST, and moderately or strongly negatively correlated with BSI, indicating that NPP was lower when soil salinity, aridity, and temperature were higher.
Table 4.
Correlation coefficients of NPP with NDVI, SI, LSW, IBI, BSI, and LST.
NDVI was moderately or strongly negatively correlated with SI; its correlation with BSI was moderately negative in summer, slightly negative in winter, and strongly negative in spring and autumn (Table 5). Moreover, the correlation between NDVI and IBI was overall weakly negative but strongly negative in the spring of 2016–2017 and moderately negative in the autumn of 2016–2017. Overall, NDVI was weakly correlated with LST and LSW.
Table 5.
Correlations between NPP, NDVI, SI, LSW, IBI, BSI, and LST.
SI was moderately positively correlated or strongly positively correlated with IBI and LST and extremely positively correlated with BSI, as evidenced by correlation coefficients >0.6 in all study years and seasons and even reached 0.8 or higher in some years and seasons. Additionally, SI was moderately negatively correlated with LSW overall, with a correlation coefficient <−0.4 in all study years and seasons.
LSW was strongly negatively correlated with IBI and BSI. LSW and LST were strongly negatively correlated in summer and autumn, and moderately negatively correlated in spring and winter.
IBI was strongly positively correlated with BSI, with a correlation coefficient >0.8. IBI and LST were strongly positively correlated in summer and autumn, and moderately positively correlated in spring and winter. BSI and LST were strongly or moderately positively correlated.
4. Discussion
4.1. NPP Estimation Results
4.1.1. The Driving Factors for the Temporal Variations of NPP
First stage (1988–1995): Before 1995, Chongming Island development was oriented toward building an “agricultural island” characterized by industrial development based on its unique resource advantages. Therefore, the government focused on the construction of eight large farms and developed many offshore aquaculture ponds and much inner island farmland, resulting in the decline of wetland vegetation and woodland area [51]. Additionally, intense agricultural activities along with massive building and infrastructure construction intensified landscape fragmentation. Meanwhile, the island area increased by approximately 63.20 km2 from 1988 to 1995, an average annual expansion of 9.03 km2, and new mudflats and wetlands formed on the island’s east and north shores, which improved the ecological conditions. Under the impacts of human activities and natural scouring and siltation processes, Chongming Island mean NPP increased slowly, and the total NPP also showed a certain increase.
Second stage (1995–2007): After 1995, Chongming Island gradually explored different paths for ecological development and reoriented its development to building an “ecological island”. In 1998, Shanghai established Chongming Dongtan Nature Reserve in the Chongming Dongtan area, which was upgraded to a National Nature Reserve in 2005. In 2001, the Shanghai Municipal Government defined the functional orientation of Chongming “ecological island” and implemented a series of ecological restoration measures, including wetland vegetation restoration, optimization of plantation species, green energy utilization, and soil salinization control in both protected and unprotected areas [82]. The 2005 edition of the “2005–2020 Overall Plan for Chongming Three Island” clarified the development goal as making a “modern ecological island zone”, further accelerating the pace of ecological construction [51]. From 1995 to 2007, Chongming Island area increased by approximately 71.89 km2, with an average annual expansion of 5.99 km2. This growth was slower than in the first stage, but it was still fast, as the construction of reservoirs in the upper reaches of the Yangtze River and the return of cultivated land to forest and grassland reduced the amount of muddy and sandy sediments in the rivers entering the sea [83,84]. However, to prevent erosion, resist flooding, and increase cultivated land area, much cultivated land was reclaimed, and embankments and dams were built in the rivers, lakes and wetlands along the shoreline [83,85]. Ecological construction and island contour changes promoted a rapid and substantial increase in mean and total NPP in this stage.
Third stage (2007–2017): After 2007, Chongming Island strengthened its measures for ecological protection, pollution treatment, and ecological habitat conservation. Nature reserves, including Xisha Wetland and Dongtan Wetland Park, were built, and two core water sources, the Qingcaosha Reservoir and Dongfeng Xisha Reservoir, became operational, which significantly strengthened the ecological foundation of Chongming Island [86]. Meanwhile, an ecological concept was introduced into agricultural activities and urban construction. After 2016, the construction of the island was transformed and promoted in a comprehensive way, and the development goal of making it a “world-class ecological island” was formally proposed in the Chongming District 13th Five-Year Plan. During this period, the expansion of the Shanghai metropolitan region to the suburbs began to have a negative impact on the ecology and natural resources of Chongming Island. Some water bodies became eutrophic, and soil metal content at some sites exceeded safe limits. To limit the negative impact of Shanghai’s expansion on Chongming Island, the new “Master Plan and General Land-use Plan of Chongming District, Shanghai, 2017–2035” emphasized the overall goal of negative growth of planned construction land and called for strict adherence to the bottom lines of population size, land resources, ecological environment, and urban security to achieve sustainable development. It required a slowdown of traffic developmental scale, narrowing of roads, and widening of road greenbelts. Additionally, it proposed the goal of building an ecological industrial system on Chongming Island based on modern agriculture, guided by tourism services, dominated by an innovative economy, and supported by green and intelligent manufacturing [51]. In 2007–2017, due to an increase in sediments from the Yangtze River and human factors such as reservoir construction, reclaiming coastal land for farmland, reclaiming land from the sea, and port construction, the total island area increased by 79.20 km2, an average annual increase of 7.92 km2. The marked change in the area occurred mostly in the Dongtan area and north bank of Chongming Island [83]. During this stage, large-scale afforestation generated a large amount of new forest that had a low NPP, causing the mean NPP of Chongming Island to slightly decrease. However, under the joint impact of various factors, including island area change, land-cover type changes, and vegetation growth status, Chongming Island total NPP increased during this stage.
4.1.2. Seasonal Differences in NPP between Chongming Island and Other Areas
The calculations show that NPP varied significantly between different seasons, as evidenced by total summer NPP approximately 17 times higher than in winter. These seasonal differences on Chongming Island were similar to those of the Yellow River Delta [65] but significantly smaller than those of the Miaodao Archipelago (rocky islands), where the total NPP in summer was approximately 60 times that in winter [49]. NPP seasonal difference is mainly related to land-cover characteristics, climate, and geographical attributes. On Chongming Island and the Yellow River Delta, farmland accounts for the largest proportion and even determines the overall characteristics and NPP seasonal variation to some extent. Furthermore, crops are planted on farmland even in winter, which can reduce the seasonal differences to some extent. In Miaodao Archipelago, planted forest is the main land-cover type, with Pinus thunbergii Parl. and Robinia pseudoacacia Linn. as the main dominant species, and a considerable number of deciduous forests are also included [49,50]. Therefore, winter productivity is low, thus increasing seasonal differences. Additionally, both Miaodao Archipelago and the Yellow River Delta have a warm-temperate continental monsoon climate with an annual average temperature near 12 °C and annual average precipitation of only half that of Chongming Island. Vegetation growth depends mainly on rainfall because there is almost no external water source or runoff in Miaodao Archipelago [50], while the Yellow River Delta receives some water from the Yellow River. Chongming Island has a northern subtropical oceanic monsoon climate, and its average temperature and rainfall were higher than those of Miaodao Archipelago and the Yellow River Delta. Although the temperature and rainfall change seasonally [21,54], Chongming Island, a typical alluvial island, receives water from the Yangtze River. Therefore, NPP seasonal difference on Chongming Island is significantly less than the Miaodao Archipelago but similar to the Yellow River Delta.
4.1.3. Comparison of Mean NPP between Chongming Island and Other Areas
We compared the mean Chongming Island NPP calculated in this paper with other studies in China using the same method (Table 6) [30,49,50,65,67,87,88,89,90,91,92,93,94,95,96]. Mean Chongming Island NPP was 287.84 g C·m−2·a−1, slightly lower than the estimated value of 294.38 g C·m−2·a−1 of the Yellow River Delta wetland, where P. australis is also the dominant species. In the Yellow River Delta, wetland vegetation accounted for up to 25.1% of the land area [65] and improved the overall mean NPP in 2016. On Chongming Island, farmland accounted for the highest proportion and wetland vegetation accounted for only 9.91% in 2016, which, combined with more extensive urbanization, led to a lower mean NPP than the Yellow River Delta. Compared to rocky islands, Chongming Island had a lower mean NPP than the five northern (399.34 g C·m−2·a−1), and five southern Miaodao Archipelago islands (340.19 g C·m−2·a−1). This difference can be attributed to differences in human development intensity between the different types of islands. In the rocky islands of the Miaodao Archipelago, where the terrain is uneven and complex, human activities are concentrated in some areas that have a flat terrain and are next to the sea. The landscape type is mainly woodland, and various planted forests, especially those of Pinus thunbergii Parl., have higher NPP [49,50]. On Chongming Island, flat terrain and fertile soil make the island highly suitable for development, leading to relatively high proportions of farmland and construction land. According to our results, the natural wetland vegetation area of Chongming Island had a higher NPP, and the artificial landscapes, such as farmland and planted forests, had a lower NPP than natural areas. Overall, human activity has lowered Chongming Island NPP. Compared to the continental ecosystems of China, the mean NPP on Chongming was lower than national mean values of 324 g C·m−2·a−1, 342 g C·m−2·a−1, and 393.75 g C·m−2·a−1 reported in different studies. Using Yangtze River Basin area as an example, the mean NPP on Chongming was higher than in Qinghai and Tibet but lower than in Sichuan and Chongqing in the upper basin; it was also lower than in Hubei, Anhui, and Jiangsu in the middle and lower basin areas.
Table 6.
NPP estimation results in different areas.
4.1.4. Analysis of the Spatiotemporal Characteristics of NPP of Different Vegetation Cover Types
Phragmites australis is the most common species of the island’s wetland vegetation, and it is generally distributed above the high-tide zone where it has become the dominant community. Scirpus mariqueter, also a native species, forms the main community below the high-tide zone. Additionally, the alien species Spartina alterniflora is also relatively common in the study area and is mixed with the above two native species or is dominantly distributed and expands rapidly in the mudflats outside the embankment [64,85]. In the last 30 years, mean wetland vegetation summer NPP was close to 110 g C·m−2·month−1 in most years. However, it was at a low level of 75.52 g C·m−2·month−1 in the 1995 summer because abundant water and sediment from the Yangtze River led to a rapid expansion of the study area, and the poor environment limited the growth and development of new wetland vegetation on the coastal side of the newly formed land during 1988–1995. In 2016–2017, mean wetland vegetation NPP in the study area was 491.11 g C·m−2·a−1 and showed significant seasonal differences because of high solar radiation and suitable water and temperature conditions for summer vegetation growth, which increased the level of vegetation photosynthesis and respiration and raised the contribution of the summer NPP to 67% of the annual NPP. These findings indicate the high carbon sequestration capacity of wetland vegetation and confirm the important value of wetland vegetation on Chongming Island as a blue carbon source in coastal zones. However, the mean wetland vegetation NPP was still lower than in similar areas (570.28 g C·m−2·a−1) obtained by using the same method [65]. This difference may be attributed to the high diversity of habitat types and significant spatial variations of wetland vegetation in the Yellow River Delta. In habitats distant from the coast and close to the banks of the Yellow River, relatively abundant freshwater supply and low soil salinity result in concentrated and wide-ranging mesophytic and hydrophytic vegetation [97]. However, in areas close to the low-lying beach, only a few salt-tolerant plants, such as Suaeda salsa, can survive under the strong impact of sea water and resulting high soil salinity [98,99]. Relatively speaking, wetland vegetation such as Phragmites australis mostly grows in the area below the embankments on Chongming Island and is strongly affected by oceanic factors, thereby reducing the productivity of wetland vegetation to a certain extent.
Mean farmland NPP was 312.24 g C·m−2·a−1, lower than that of wetland vegetation. However, we believe that Chongming Island farmland already possesses a considerable carbon sequestration capacity for various reasons. First, soil salinization has become a common issue on Chongming Island. Second, the mean and total NPP of farmland in the study area have been increasing in the last 30 years, and total farmland NPP accounted for 53.75% of total NPP in the study area in 2016–2017. Nevertheless, due to the destruction of the original wetland ecosystem, farmland reclamation has resulted in destruction of wetland vegetation, loss of biological habitats, and fragmentation of natural landscapes. Therefore, it is not a typical blue carbon sink in a strict sense. Overall, farmland can be considered a “secondary blue carbon sink” because it has a high carbon sequestration capacity and carbon sink potential and can play an important role in balancing ecological protection and land development/utilization [65,100].
On Chongming Island, native forests are poorly developed, and existing forests are mostly planted. At the end of the 1950s, in response to the call to prioritize forestry construction in the first Five-Year Plan of the state, extensive planting and afforestation projects were initiated on Chongming Island. The construction of island-sheltering forest belts and forests on both sides of the backbone rivers, which mostly included thriving local tree species such as Metasequoia glyptostroboides Hu et W. C. Cheng, Cryptomeria japonica var. sinensis Miquel and Ulmus pumila Linn., increased forest cover rapidly. Overall, however, Chongming Island has only scattered woodland and lacks large-scale woodland areas except for Dongping Forest Park [101]. The coming of the 21st century brought new historical opportunities for the island. In accordance with the overall plan for developing an ecological island, Chongming County has taken a series of measures since 2003 to accelerate the “leap-forward” development of forestry. It initiated engineered afforestation and issued a number of policies to encourage the development of forestry and motivate people to participate in afforestation and greening. Consequently, the total amount of forest resources increased significantly, which effectively improved the ecology, conserved water resources, and beautified the environment on Chongming Island [101]. Nevertheless, Chongming is an agricultural island where the growth of forest resources has been dominated mostly by the development of economic forests for a long time, bringing a certain amount of wealth to farmers. However, the development of economic forest is easily affected by the market, which has poor stability, leading to the growth and decline of forest resources [101,102]. We confirmed this finding, showing that total woodland NPP fluctuated significantly between 1988 and 2007 and mean woodland NPP overall was lower than wetland vegetation but significantly higher than farmland. Recently, as the government further emphasized the importance of the ecological environment and clarified the direction of its developmental strategy, a near-natural way starting from small areas, multiple species, and multiple scales has been adopted to build ecological public-welfare forests. Much effort was therefore devoted to the goal of building Chongming Island into an ecological island. Afforestation measures have focused on forming large-scale forest groups and have used roads, water systems, and coastal forest belts as a framework to further improve the structure of the forest ecosystem [51]. However, large-scale planting has created a large amount of young forest, causing the mean woodland summer NPP and during the whole 2016–2017 year to be 58.87 g C·m−2·month−1 and 310.07 g C·m−2·a−1, respectively, lower than farmland.
Building, traffic, and industrial lands are mostly hardened surfaces, but they also generate a certain amount of NPP because they are mostly mixed with farmland, woodland, and wetland and are under an increasingly strict requirement of building and road greening as ecological island development is promoted. For various reasons, such as the improvement of rural housing conditions and adjustment of land and economic policies [103], rural residential areas have become more scattered and widespread on Chongming Island over the last 30 years. The idea of dismantling villages and merging and relocating rural populations toward cities/towns was not really promoted [51]. Consequently, building land has been expanding on the island, and its total NPP increased overall. The mean and total NPP of traffic land have also been greatly improved in recent years because both the transportation system toward the outside of the island and the backbone road network inside the island was continuously improved and roads became more organically integrated with ecological landscapes. Because traditional industrial development is not aligned with the direction of ecological development, the expansion of industrial land has been strictly controlled in the last 30 years [51], leading to low or even negligible mean and total NPP.
In 1988–1995, artificial dams and embankments transformed a large area of tidal flats in the east and north of the island into aquaculture ponds and cultivated land. Pond area increased significantly and expanded on a large scale. This change also reflected the adjustment of the island’s first industrial structure, i.e., increasing the proportion of high-value-added agricultural products to ensure income for local residents and to promote economic development [103]. From 1995 to 2007, aquaculture ponds increased due to embankment in the eastern portion and decreased from the original scale in the northern portion of the island, while, in the central portion, the ponds were distributed in a sporadic, patchy pattern and showed a developmental trend from large- to small-scale ponds. In 2007–2017, as the “Three, One, and Two” ideology for Chongming industrial development was implemented, the area of aquaculture ponds decreased significantly [103], leading to a changed pattern of an increase followed by a decrease in total pond NPP in the last 30 years.
Mudflats were mainly distributed in the Dongtan area of Chongming Island in the last 30 years. The shore area increased at a certain rate every year in this area, due to sediment deposition from the Yangtze River estuary, but the area of mudflat decreased year by year under the influence of artificial siltation-promoting enclosures [104], resulting in a decline in total NPP. However, the amount of water area gradually increased in the last 30 years, which raised the total NPP in the waters. The main reason for this increase was that Chongming Island focused on protecting and restoring lakes and rivers, strengthened the measures for water improvement, and promoted ecological restoration. Moreover, it comprehensively improved river values in multiple respects, including flood control and drainage, ecological landscape, sightseeing and leisure, and agricultural irrigation [51].
4.1.5. Comparison of the Spatiotemporal Pattern of NPP between Protected and Unprotected Areas
Some differences in NPP occurred between the protected and unprotected portions of the study area, which were determined by the type of surface coverage and vegetation growth status under the impacts of natural and human factors. The core protected areas, which are closer to the sea, include a high proportion of waters and mudflats. Additionally, the supporting projects for wetland restoration areas were launched in the core protected areas. Although the core protected areas had a much lower mean vegetation NPP than the ordinary protected areas, they played a significant role in maintaining the stability of the wetland ecosystem in the protected area. The ordinary protected areas had more wetland vegetation, so had higher NPP than the core protected areas and unprotected areas. In the last 30 years, under the combined impacts of sediment input from the Yangtze River, island expansion, protected area establishment, and artificial ecological restoration measures, mean NPP of the core protected areas and ordinary protected areas initially fell, then rose, then fell again. The unprotected areas included mostly farmland and woodland, and their mean and total NPP continuously increased with the progression of ecological island construction.
4.2. Intrinsic Correlations of NPP with Spatial Heterogeneity Parameters
NDVI, which reflects vegetation growth status and cover, is the most important factor influencing NPP [50]. NDVI is also the main parameter for calculating NPP in the CASA model. Hence, NDVI is highly positively correlated with NPP [50]. Due to the ease of its acquisition from RS data, NDVI can be used as an important indicator for long-term NPP monitoring on islands.
In addition to vegetation coverage, land surface humidity and heat reflect ground conditions to a certain extent and have a significant impact on the formation of the regional climate, which is most closely related to plant growth [52,76]. LSW and LST represent the soil water and thermal conditions, respectively, which can affect NPP. In different regions, periods, and ecological conditions, NPP responds differently to land surface humidity and temperature. NPP and the humidity indicator LSW were weakly positively correlated from 1988 to 2007 and more strongly correlated afterwards. The correlation coefficient was >0.3 in the spring, summer, and autumn of 2016–2017. Generally, the main meteorological factors affecting surface humidity are precipitation, temperature, air humidity, and ground wind speed, and, among them, precipitation is the most important. In the 1980s, and late 1990s, Chongming Island experienced abundant rainfall and high surface humidity, which was conducive to plant growth [57]. After 2000, due to a decrease in precipitation and the decline of inflow water from the Yangtze River caused by the construction of upstream reservoirs [83,84], soil humidity gradually became a limiting factor for vegetation growth, thus showing an increasingly closer correlation with NPP. Overall, NPP was negatively correlated with LST, and the correlation was generally enhanced in the summer. This indicates that the LST increase might increase evaporation or affect soil bioactivity [105,106], which is not conducive to vegetation growth. However, the increasing correlation between LST and NPP indirectly shows that the average temperature on Chongming was rising under the influence of global warming [57]. Furthermore, continuously intensified urbanization led to an expansion of impermeable ground surface and an increase in LST spatial heterogeneity. Conversely, vegetation can prevent water evaporation and play a positive role in maintaining the distribution patterns of regional soil temperature and humidity [107].
Soil salinization, a significant ecological problem commonly seen in estuarine areas, seriously affects soil quality, plant communities, and crop yield, thereby threatening the health of estuarine ecosystems [108,109]. The results of this study showed that NPP and NDVI were strongly negatively correlated with soil salinity, indicating that soil factors were closely related to vegetation status, while good vegetation conditions usually suggested lower soil salinity. Our results showed that soil salinity was affected by both soil water content and temperature, which was consistent with the results of related studies [110]. LSW and LST were moderately negatively and strongly positively correlated with soil salinity, respectively. In particular, soil factors affected vegetation growth more significantly and caused stronger spatial differences in vegetation growth due to the higher requirements of soil quality in spring and summer growing seasons. Therefore, the negative correlation between NPP and soil salinity was stronger on Chongming Island in the spring and summer.
NPP was negatively correlated with IBI and BSI, the negative correlation with BSI being more significant. This finding indicated that human development activities, such as salt field reclamation, urban construction, and industrial development, damaged vegetation cover, increased the LST, caused soil water loss, and increased soil salinity, overall decreasing NPP. BSI and IBI characterize the degree of soil aridity, which not only directly affects vegetation photosynthetic performance but also indirectly affects ecosystem structure and function through other forms of disturbance. Therefore, soil aridity is an important influence on vegetation NPP [111,112].
5. Conclusions
An estimation model for NPP on Chongming Island, a typical estuarine alluvial island, was established based on CASA and the actual ecological characteristics of the island. NPP of different land-cover and protected area types in different years and different seasons in the study area were estimated using RS and GIS as the main tools. The results showed that the NPP calculation method constructed in this paper had good applicability in Chongming Island; affected by natural and human activities, NPP on Chongming Island had annual fluctuation, seasonal differences, and obvious spatial differentiation. Furthermore, the correlations of NPP with RS-based ecological indices such as NDVI, SI, LSW, IBI, BSI, and LST were analyzed. The results indicated that human development activities generally lead to the decrease of NPP. The specific conclusions are as follows:
- (1)
- In the last 30 years, Chongming Island mean NPP initially increased and then slowly decreased, while total NPP gradually increased. In 2016–2017, Chongming Island total NPP was 422.32 Gg C·a−1, with an average density of 287.84 g C·m−2·a−1, respectively, which was lower than the national average. Among areas in the Yangtze River Basin, mean NPP of the study area was higher than in Qinghai and Tibet in the upper reaches but lower than those of Sichuan and Chongqing in the upper reaches, and Hubei, Anhui, and Jiangsu in the middle and lower reaches. Total NPP in spring, summer, autumn, and winter accounted for 10.78%, 59.71%, 26.11%, and 3.39%, respectively, of the annual NPP. These results corresponded to the first scientific question of this study.
- (2)
- Under multiple influences of strong sea–land interactions and various human activities, Chongming Island NPP showed the following spatiotemporal characteristics: (1) Land-cover types ranked by mean NPP from high to low were in the order: wetland vegetation, farmland, woodland, traffic land, building land, waters, ponds, industrial land, and mudflats. (2) Total NPP was highest in farmland, followed by woodland, wetland vegetation, and building land, while other land-cover types accounted for only a small proportion. (3) Among the different types of protected areas, mean NPP of core protected areas was generally lower than unprotected areas and ordinary protected areas. The ordinary protected areas had more wetland vegetation, thus they had a higher NPP than the core protected areas and unprotected areas. In the last 30 years, mean NPP of both core and ordinary protected areas fluctuated, first decreasing, then increasing, and finally decreasing again. The mean and total NPP of unprotected areas continuously increased, indicating the beneficial effects of ecological construction over the island. These results corresponded to the second scientific question of this study.
- (3)
- Chongming Island vegetation growth status and vegetation cover were the main factors that positively affected NPP. The effect of soil surface humidity on NPP increased, and soil salinity, surface temperature, and surface aridity were important NPP limiting factors. These results corresponded to the third scientific question of this study.
Author Contributions
Conceptualization, W.X. and Y.C.; methodology, W.X. and Y.C.; software, Y.C.; validation, W.X., Y.C. and X.M.; formal analysis, W.X.; investigation, W.X., Y.C. and X.M.; resources, W.X. and Y.C.; data curation, Y.C.; writing—original draft preparation, W.X.; writing—review and editing, W.X. and Y.C.; visualization, W.X. and Y.C.; supervision, D.L.; project administration, D.L.; funding acquisition, Y.C. All authors have read and agreed to the published version of the manuscript.
Funding
This research was funded by the National Natural Science Foundation of China (No. 42071116) and the Key Laboratory of Coastal Zone Exploitation and Protection, Ministry of Natural Resources of China (No. 2019CZEPK08). We also thank NASA and USGS for the open source LANDSAT data.
Institutional Review Board Statement
Not applicable.
Informed Consent Statement
Not applicable.
Data Availability Statement
Not applicable.
Conflicts of Interest
The authors declare no conflict of interest.
References
- Syvitski, J.P.M.; Kettner, A.J.; Overeem, I.; Hutton, E.W.H.; Hannon, M.T.; Brakenridge, R.G.; Day, J.; Vörösmarty, C.; Saito, Y.; Giosan, L.; et al. Sinking deltasdue to human activities. Nat. Geosci. 2009, 2, 681–686. [Google Scholar] [CrossRef]
- Huang, B.; Ouyang, Z.; Zheng, H.; Zhang, H.; Wang, X. Construction of an ecoisland: A case study of Chongming Island, China. Ocean. Coast. Manag. 2008, 51, 575–588. [Google Scholar] [CrossRef]
- Chi, Y.; Zheng, W.; Shi, H.; Sun, J.; Fu, Z. Spatial heterogeneity of estuarine wetland ecosystem health influenced by complex natural and anthro-pogenic factors. Sci. Total Environ. 2018, 634, 1445–1462. [Google Scholar] [CrossRef]
- Brückner, H.; Herda, A.; Kerschner, M.; Müllenhoff, M.; Stock, F. Life cycle of estuarine islands—From the formation to the landlocking of former islands in the environs of Miletos and Ephesos in western Asia Minor (Turkey). J. Archaeol. Sci. 2017, 12, 876–894. [Google Scholar] [CrossRef]
- Carvalho, R.C.; Woodroffe, C.D. Evolution from estuary to delta: Alluvial plain morphology and sedimentary characteristics of the Shoalhaven River mouth, southeastern Australia. Estuar. Coast. Shelf Sci. 2020, 242, 106857. [Google Scholar] [CrossRef]
- Zhang, Q.; Xu, C.; Becker, S.; Jiang, T. Sediment and runoff changes in the Yangtze River basin during past 50 years. J. Hydrol. 2006, 331, 511–523. [Google Scholar] [CrossRef]
- Ghosh, M.K.; Kumar, L.; Roy, C. Monitoring the coastline change of Hatiya Island in Bangladesh using remote sensing techniques. ISPRS J. Photogramm. 2014, 101, 137–144. [Google Scholar] [CrossRef]
- Shen, G.; Abdoul, N.I.; Zhu, Y.; Wang, Z.; Gong, J. Remote sensing of urban growth and landscape pattern changes in response to the expansion of Chongming Island in Shanghai, China. Geocarto Int. 2017, 32, 488–502. [Google Scholar] [CrossRef]
- Qiao, G.; Mi, H.; Wang, W.; Tong, X.; Li, Z.; Li, T.; Liu, S.; Hong, Y. 55-year (1960–2015) spatiotemporal shoreline change analysis using historical DISP and Landsat time series data in Shanghai. Int. J. Appl. Earth Obs. 2018, 68, 238–251. [Google Scholar]
- Kabir, M.A.; Salauddin, M.; Hossain, K.T.; Tanim, I.A.; Saddam, M.M.H.; Ahmad, A.U. Assessing the shoreline dynamics of Hatiya Island of Meghna estuary in Bangladesh using multiband satellite imageries and hydro-meteorological data. Reg. Stud. Mar. Sci. 2020, 35, 101167. [Google Scholar]
- Qiu, C.; Zhu, J.R. Influence of seasonal runoff regulation by the Three Gorges Reservoir on saltwater intrusion in the Changjiang River Estuary. Cont. Shelf Res. 2013, 71, 16–26. [Google Scholar] [CrossRef]
- Arkema, K.; Guannel, G.; Verutes, G.; Wood, S.A.; Guerry, A.; Ruckelshaus, M.; Kareiva, P.; Lacayo, M.; Silver, J.M. Coastal habitats shield people and property from sea-level rise and storms. Nat. Clim. Change 2013, 3, 913–918. [Google Scholar] [CrossRef]
- Johnston, A.; Slovinsky, P.; Yates, K.L. Assessing the vulnerability of coastal infrastructure to sea level rise using multi-criteria analysis in Scarborough, Maine (USA). Ocean. Coast. Manag. 2014, 95, 176–188. [Google Scholar] [CrossRef]
- Du, Q.; Zhong, Q.C.; Wang, K.Y. Root Effect of Three Vegetation Types on Shoreline Stabilization of Chongming Island, Shanghai. Pedosphere 2010, 20, 692–701. [Google Scholar] [CrossRef]
- Wu, S.; Cheng, H.; Xu, Y.J.; Li, J.; Zheng, S. Decadal changes in bathymetry of the Yangtze River Estuary: Human impacts and potential saltwater intrusion. Estuar. Coast. Shelf Sci. 2016, 182, 158–169. [Google Scholar] [CrossRef]
- Chen, Y.; Dong, J.; Xiao, X.; Zhang, M.; Tian, B.; Zhou, Y.; Li, B.; Ma, Z. Land claim and loss of tidal flats in the Yangtze Estuary. Sci. Rep. 2016, 6, 24018. [Google Scholar] [CrossRef]
- Sun, N.; Zhu, W.; Cheng, Q. GF-1 and Landsat observed a 40-year wetland spatiotemporal variation and its coupled environmental factors in Yangtze River estuary. Estuar. Coast. Shelf Sci. 2018, 207, 30–39. [Google Scholar] [CrossRef]
- Allison, M.A.; Weathers, H.D.; Meselhe, E.A. Bottom morphology in the Song Hau distributary channel, Mekong River Delta, Vietnam. Cont. Shelf Res. 2017, 147, 51–61. [Google Scholar] [CrossRef]
- Chi, Y.; Zhao, M.; Sun, J.; Xie, Z.; Wang, E. Mapping soil total nitrogen in an estuarine area with high landscape fragmentation using a multiple-scale approach. Geoderma 2019, 339, 70–84. [Google Scholar] [CrossRef]
- Fang, J.; Liu, M.; Liu, W.; Pathak, S.; Li, S.; Tang, X.; Zhou, L.; Sun, F. Piloting a capital-based approach for characterizing and evaluating drivers of island sustainability- An application in Chongming Island. J. Clean. Prod. 2020, 261, 121123. [Google Scholar] [CrossRef]
- Yan, B.; Wang, J.; Li, S.; Cui, L.; Ge, Z.; Zhang, L. Assessment of socio-economic vulnerability under sea level rise coupled with storm surge in the Chongming County, Shanghai. Acta Ecol. Sin. 2016, 36, 91–98. [Google Scholar]
- Chi, Y.; Shi, H.; Guo, Z.; Ding, D. Connotation, features and causes of islandecological vulnerability. Acta Oceanol. Sin. 2015, 12, 93–105. [Google Scholar]
- Ding, D.; Jiang, Y.; Wu, Y.; Shi, T. Landscape character assessment of water-land ecotone in an island area for landscape environment promotion. J. Clean. Prod. 2020, 259, 120934. [Google Scholar]
- Gang, C.; Zhou, W.; Wang, Z.; Chen, Y.; Li, J.; Chen, J.; Qi, J.; Odeh, I.; Groisman, P.Y. Comparative assessmentof grassland NPP dynamics in response to climate change in China, North America, Europe and Australia from 1981 to 2010. J. Agron. Crop. Sci. 2015, 201, 57–68. [Google Scholar] [CrossRef]
- Taylor, P.G.; Cleveland, C.C.; Wieder, W.R.; Sullivan, B.W.; Doughty, C.E.; Dobrowski, S.Z.; Townsend, A.R. Temperature and rainfall interact to control carbon cycling in tropical forests. Ecol. Lett. 2017, 20, 779–788. [Google Scholar]
- Chen, Y.; Tao, Y.; Cheng, Y.; Ju, W.; Ye, J.; Hickler, T.; Liao, C.; Feng, L.; Ruan, H. Great uncertainties in modeling grazing impact on carbon sequestration: A multi-model inter-comparison in temperate Eurasian Steppe. Environ. Res. Lett. 2018, 13, 075005. [Google Scholar] [CrossRef]
- Jia, Y.; Niu, B.; Qian, J. Estimation of ecosystem NPP in Haizhou Bay based on CASA. Geospat. Inform. 2020, 18, 41–44. [Google Scholar]
- Gang, C.; Zhao, W.; Zhao, T.; Zhang, Y.; Gao, X.; Wen, Z. The impacts of land conversion and management measures on the grassland net primary productivity over the Loess Plateau, Northern China. Sci. Total Environ. 2018, 645, 827–836. [Google Scholar] [CrossRef]
- Chen, H.; Zhao, X.; Lin, Q.; Li, G.; Kong, W. Spring watering interactively improves aboveground net primary productivity and soil microbial biomass in a semi-arid grassland of China. Catena 2020, 189, 104478. [Google Scholar] [CrossRef]
- Zheng, Z.; Zhu, W.; Zhang, Y. Seasonally and spatially varied controls of climatic factors on net primary productivity in alpine grasslands on the Tibetan Plateau. Glob. Ecol. Conserv. 2020, 21, e00814. [Google Scholar] [CrossRef]
- Clark, D.A.; Brown, S.; Kicklighter, D.W.; Chambers, J.Q.; Thomlinson, J.R.; Ni, J. Measuring net primary production in forests: Concepts and field methods. Ecol. Appl. 2001, 11, 356–370. [Google Scholar] [CrossRef]
- Wang, C.; Jiang, Q.; Engel, B.; Mercado, J.A.V.; Zhang, Z. Analysis on net primary productivity change of forests and its multi–level driving mechanism—A case study in Changbai Mountains in Northeast China. Technol. Forecast. Soc. Chang. 2020, 153, 119939. [Google Scholar] [CrossRef]
- Komiyama, A.; Ong, J.E.; Poungparn, S. Allometry, biomass, and productivity of mangrove forests: A review. Aquat. Bot. 2008, 89, 128–137. [Google Scholar] [CrossRef]
- Kamruzzaman, M.; Osawa, A.; Deshar, R.; Sharma, S.; Mouctar, K. Species composition, biomass, and net primary productivity of mangrove forest in Okukubi River, Okinawa Island, Japan. Reg. Stud. Mar. Sci. 2017, 12, 19–27. [Google Scholar] [CrossRef]
- Ohtsuka, T.; Tomotsune, M.; Suchewaboripont, V.; Iimura, Y.; Kida, M.; Yoshitake, S.; Kondo, M.; Kinjo, K. Stand dynamics and aboveground net primary productivity of a mature subtropical mangrove forest on Ishigaki Island, southwestern Japan. Reg. Stud. Mar. Sci. 2019, 27, 100516. [Google Scholar] [CrossRef]
- Mao, F.; Du, H.; Li, X.; Ge, H.; Cui, L.; Zhou, G. Spatiotemporal dynamics of bamboo forest net primary productivity with climate variations in Southeast China. Ecol. Indic. 2020, 116, 106505. [Google Scholar]
- Koga, N.; Smith, P.; Yeluripati, J.B.; Shirato, Y.; Kimura, S.D.; Nemoto, M. Estimating net primary production and annual plant carbon inputs and modeling future changes in soil carbon stocks in arable farmlands of northern Japan. Agr. Ecosyst. Environ. 2011, 144, 51–60. [Google Scholar]
- Artacho, P.; Bonomelli, C. Net primary productivity and allocation to fine-root production in field-grown sweet cherry trees under different soil nitrogen regimes. Sci. Hortic. 2017, 219, 207–215. [Google Scholar] [CrossRef]
- Peng, H.; Jia, Y.; Zhan, C.; Xu, W. Topographic controls on ecosystem evapotranspiration and net primary productivity under climate warming in the Taihang Mountains, China. J. Hydrol. 2020, 581, 124394. [Google Scholar]
- Wu, Y.; Wang, P.; Liu, X.; Chen, J.; Song, M. Analysis of regional carbon allocation and carbon trading based on net primary productivity in China. China Econ. Rev. 2020, 60, 101401. [Google Scholar] [CrossRef]
- Li, J.; Wang, Z.; Lai, C. Severe drought events inducing large decrease of net primary productivity in mainland China during 1982–2015. Sci. Total Environ. 2020, 703, 135541. [Google Scholar] [CrossRef] [PubMed]
- Mohamed, M.A.A.; Babiker, I.S.; Chen, Z.M.; Ikeda, K.; Ohta, K.; Kato, K. The role of climate variability in the inter-annual variation of terrestrial net primary production (NPP). Sci. Total Environ. 2004, 332, 123–137. [Google Scholar] [CrossRef] [PubMed]
- Du, E.; Vries, W. Nitrogen-induced new net primary production and carbon sequestration in global forests. Environ. Pollut. 2018, 242, 1476–1487. [Google Scholar] [CrossRef] [PubMed]
- Potter, C.S.; Randerson, J.T.; Field, C.B.; Matson, P.A.; Vitousek, P.M.; Mooney, H.A.; Klooster, S.A. Terrestrial ecosystem production: A process model based on global satellite and surface data. Glob. Biogeochem. Cycles 1993, 7, 811–841. [Google Scholar] [CrossRef]
- Field, C.B.; Randerson, J.T.; Malmström, C.M. Global net primary production: Combining ecology and remote sensing. Remote Sens. Environ. 1995, 51, 74–88. [Google Scholar] [CrossRef]
- Prince, S.D. A model of regional primary production for use with coarse resolution satellite data. Int. J. Remote Sens. 1991, 12, 1313–1330. [Google Scholar] [CrossRef]
- Veroustraete, F.; Sabbe, H.; Eerens, H. Estimation of carbon mass fluxes over Europe using the C-Fix model and Euroflux data. Remote Sens. Environ. 2002, 83, 376–399. [Google Scholar]
- Tang, Z.; Wang, H.; Li, X.; Chi, D.; Li, X. Variation of vegetation net primary productivity and its influential factors in Xilingol League from 2006 to 2015. Pratacultural 2018, 35, 2812–2821. [Google Scholar]
- Chi, Y.; Shi, H.; Wang, X.; Li, J.; Feng, A. The spatial distribution and impact factors of net primary productivity in the island ecosystem of five southern islands of Miaodao Archipelago. Acta Ecol. Sin. 2015, 35, 8094–8106. [Google Scholar]
- Yin, L.; Zheng, W.; Gao, M.; Lu, J. Spatial and temporal heterogeneity of net primary productivity and landscape patterns on five northern islands of Miaodao Archipelago. Acta Oceanol. Sin. 2020, 42, 110–118. [Google Scholar]
- Bureau of Planning, Land and Resources of Shanghai. Master Plan. and General Land-Use Plan. of Chongming Disrtice, Shanghai, 2017–2035; People’s Government of Chongming District: Shanghai, China, 2018.
- Chi, Y.; Wang, E.; Wang, J. Identifying the anthropogenic influence on the spatial distuibution of plant diversity in an estuarine island through multiple gradients. Glob. Ecol. Conserv. 2020, 21, e00833. [Google Scholar] [CrossRef]
- Cai, W.; Song, X.; Zhang, P.; Xin, Z.; Zhou, Y.; Wang, Y.; Wei, W. Carbon emissions and driving forces of an island economy: A case study of Chongming Island, China. J. Clean. Prod. 2020, 254, 120028. [Google Scholar] [CrossRef]
- Shanghai Municipal People’s Government. Chongming’s 13th Five-Year Plan. for World-Class. Eco-Island Development; Shanghai Municipal People’s Government: Shanghai, China, 2016.
- Luo, P.; Yang, Y.; Wang, H.; Gu, Y.; Xu, J.; Li, Y. Water footprint and scenario analysis in the transformation of Chongming into an international eco-island. Resour. Conserv. Recy. 2018, 132, 376–385. [Google Scholar] [CrossRef]
- Wang, Y.; Yang, C.; Li, J.; Shen, S. The chemical composition and source identification of soil dissolved organic matter in riparian buffer zones from Chongming Island, China. Chemosphere 2014, 111, 505–512. [Google Scholar] [CrossRef]
- Gu, W. Climate change characteristics of Chongming Island in recent 35 years. In Proceedings of the 26th Annual Meeting of Chinese Meteorological Society, Hangzhou, China, 14 October 2009; pp. 1147–1152. [Google Scholar]
- Huang, K.; Lin, K.; Guo, J.; Zhou, X.; Wang, J.; Zhao, J.; Zhou, P.; Xu, F.; Liu, L.; Zhang, W. Polybrominated diphenyl ethers in birds from Chongming Island, Yangtze estuary, China: Insight into migratory behavior. Chemosphere 2013, 91, 1416–1425. [Google Scholar] [CrossRef]
- Chi, Y.; Zhang, Z.; Gao, J.; Xie, Z.; Zhao, M.; Wang, E. Evaluating landscape ecological sensitivity of an estuarine island based on landscape pattern across temporal and spatial scales. Ecol. Indic. 2019, 101, 221–237. [Google Scholar] [CrossRef]
- He, F.; Xue, J.; Mu, H. Estimation of total solar radiation and its temporal distributions over Shanghai Area. Resour. Sci. 2010, 32, 693–700. [Google Scholar]
- Jin, L. Variation characteristics of sunshine duration and its influencing factors in Shanghai inrecent 50 years. Meteorol. Sci. Technol. 2012, 40, 293–298. [Google Scholar]
- Bureau of Statistics of Chongming District. Statistical Yearbook of Chongming District in Shanghai (2010–2017); Bureau of Statistics of Chongming District: Shanghai, China, 2018.
- Compilation group of sprinkler irrigation engineering design manual. In Sprinkler Irrigation Engineering Design Manual; China Water Power Press: Beijing, China, 1989.
- Wang, S.; Wang, H.; Fang, Y.; Li, K. Ability of plant carbon fixation in the coastal wetland of Chongming Island. Chin. J. Ecol. 2014, 33, 915–921. [Google Scholar]
- Chi, Y.; Shi, H.; Sun, J.; Li, J.; Yang, F.; Fu, Z. Spatio-temporal characteristics and main influencing factors of vegetation net primary productivity in the Yellow River Delta in recent 30 years. Acta Ecol. Sin. 2018, 38, 2683–2697. [Google Scholar]
- Running, S.W.; Thornton, P.E.; Nemani, R.; Glassy, J.M. Global terrestrial gross and net primary productivity from the earth observing system. In Methods in Ecosystem Science; Sala, O.E., Jackson, R.B., Mooney, H.A., Howarth, R.W., Eds.; Springer: New York, NY, USA, 2000. [Google Scholar]
- Zhu, W.; Pan, Y.; Zhang, J. Estimation of net primary productivity of Chinese terrestrial vegetation based on remote sensing. Chin. J. Plant. Ecol. 2007, 31, 413–424. [Google Scholar]
- Xu, H. A remote sensing urban ecological index and its application. Acta Ecol. Sin. 2013, 33, 7853–7862. [Google Scholar]
- Douaoui, A.E.K.; Nicolas, H.; Walter, C. Detecting salinity hazards within a semiarid context by means of combining soil and remote-sensing data. Geoderma 2006, 134, 217–230. [Google Scholar] [CrossRef]
- Chi, Y.; Sun, J.; Liu, W.; Wang, J.; Zhao, M. Mapping coastal wetland soil salinity in different seasons using an improved comprehensive land surface factor system. Ecol. Indic. 2019, 107, 105517. [Google Scholar] [CrossRef]
- Wang, Y.; Deng, C.; Liu, Y.; Niu, Z.; Li, Y. Identifying change in spatial accumulation of soil salinity in an inland river watershed, China. Sci. Total Environ. 2018, 621, 177–185. [Google Scholar] [CrossRef]
- Liu, Q.; Liu, G.; Huang, C.; Xie, C. Comparison of tasselled cap transformations based on the selective bands of Landsat 8 OLI TOA reflectance images. Int. J. Remote Sens. 2015, 36, 417–441. [Google Scholar] [CrossRef]
- Hu, X.; Xu, H. A new remote sensing index for assessing the spatial heterogeneity in urban ecological quality: A case from Fuzhou City, China. Ecol. Indicat. 2018, 89, 11–21. [Google Scholar] [CrossRef]
- Ma, L.; Ma, F.; Li, J.; Gu, Q.; Yang, S.; Wu, D.; Feng, J.; Ding, J. Characterizing and modeling regional-scale variations in soil salinity in the arid oasis of Tarim Basin, China. Geoderma 2017, 305, 1–11. [Google Scholar] [CrossRef]
- Emami, H.; Mojaradi, B.; Safari, A. The effect of soil salinity on the use of the universal triangle method to estimate saline soil moisture from Landsat data: Application to the SMAPEx-2 and SMAPEx-3 campaigns. Int. J. Remote Sens. 2017, 38, 6623–6652. [Google Scholar]
- Chi, Y.; Shi, H.; Zheng, W.; Sun, J. Simulating spatial distribution of coastal soil carbon content using a comprehensive land surface factor system based on remote sensing. Sci. Total Environ. 2018, 628-629, 384–399. [Google Scholar] [CrossRef]
- Allbed, A.; Kumar, L.; Aldakheel, Y.Y. Assessing soil salinity using soil salinity and vegetation indices derived from IKONOS high-spatial resolution imageries: Applications in a date palm dominated region. Geoderma 2014, 230–231, 1–8. [Google Scholar] [CrossRef]
- Sobrino, J.A.; Coll, C.; Caselles, V. Atmospheric correction for land surface temperature using NOAA-11 AVHRR channels 4 and 5. Remote Sens. Environ. 1991, 38, 19–34. [Google Scholar] [CrossRef]
- Xu, H. A new index for delineating built-up land features in satellite imagery. Int. J. Remote Sens. 2008, 29, 4269–4276. [Google Scholar] [CrossRef]
- Xu, H.; Tang, F. Analysis of new characteristics of the first Landsat 8 image and their eco-environmental significance. Acta Ecol. Sin. 2013, 33, 3249–3257. [Google Scholar]
- Chi, Y.; Sun, J.; Sun, Y.; Liu, S.; Fu, Z. Multi-temporal characterization of land surface temperature and its relationships with normalized difference vegetation index and soil moisture content in the Yellow River Delta, China. Glob. Ecol. Conserv. 2020, 23, e01092. [Google Scholar] [CrossRef]
- Yang, T.; Zhang, X. Benchmarking the building energy consumption and solar energy trade-offs of residential neighborhoods on Chongming Eco-Island, China. Appl. Energ. 2016, 180, 792–799. [Google Scholar] [CrossRef]
- Li, J. Study on the dynamic changes of water front in Chongming Island area at the Yangtze Delta. J. Gansu Sci. 2020, 32, 17–21. [Google Scholar]
- Hu, H.; Hu, G.; Cheng, H. GIS-based visualized analysis of shoals evolution around alluvial islands in the Changjiang estuary for the recent 120 years. Geogr. Geo-Inf. Sci. 2007, 23, 85–88. [Google Scholar]
- Ren, L.; Li, X.; Yang, S.; Yan, Z.; Huang, X. The impact of salt marsh change on sediment accumulation and wave attenuation at the East Chongming Island. Acta Ecol. Sin. 2014, 34, 3350–3358. [Google Scholar]
- Cao, M. The experience and revelation of the governance by law from the construction of world-class eco-islands. J. Peking Univ. 2019, 56, 149–160. [Google Scholar]
- Tao, B.; Li, K.; Shao, X.; Cao, M. Temporal and spatial pattern of net primary production of terrestrial ecosystems in China. Acta Geogr. Sin. 2003, 58, 372–380. [Google Scholar]
- Gu, J.; Li, X.; Huang, C.; Zhang, X.; Jin, X. Simulating net primary productivity of Chinese terrestrial vegetation during 2002-2010. J. Lanzou Univ. (Nat. Sci.) 2013, 49, 203–213. [Google Scholar]
- Wei, Y.; Wang, L.; Shi, Y.; Li, L. Net primary productivity of grassland resources monitoring based on remote data in Qinghai province. Sci. Geogr. Sin. 2012, 32, 621–627. [Google Scholar]
- Han, W.; Zhang, C.; Zeng, Y.; Liu, G. Spatio-temporal changes and driving factors in the net primary productivity of Lhasa River Basin from 2000 to 2015. Acta Ecol. Sin. 2018, 38, 8787–8798. [Google Scholar]
- Zhang, Y.; Qi, W.; Zhou, C.; Ding, M.; Liu, L.; Gao, J.; Bai, W.; Wang, Z.; Zheng, D. Spatial and temporal variability in the net primary production of alpine grassland on the Tibetan Plateau since 1982. J. Geogr. Sci. 2014, 24, 269–287. [Google Scholar]
- Liu, S.; Lu, T.; Tang, B.; Wu, Y.; Wu, N. Spatial-temporal variations of net primary productivity of Sichuan Vegetation based on CASA model. J. Sichuan Agr. Univ. 2013, 31, 269–282. [Google Scholar]
- Zhang, R.; Luo, H.; Zhang, R.; Liu, G.; Zheng, H.; Yang, T. Estimation of vegetation net primary productivity in Chongqing and evaluation of its ecological services value. J. Southwest Univ. 2015, 37, 40–46. [Google Scholar]
- Kong, C.; Yue, Y.; Xu, K. Spatial-temporal variation of vegetation net primary productivity and its response to climate change in Jianghan plain from 2000 to 2015. Resour. Environ. Yangtze Basin 2019, 28, 1460–1469. [Google Scholar]
- Yuan, J.; Shen, F.; Wang, T.; Luo, X. Impact of land use/cover change on regional net primary productivity in Wanjiang city belt during the period from 2000 to 2010. Res. Soil Water Conserv. 2016, 23, 245–250. [Google Scholar]
- Wang, S.; Liu, Z. Analysis of spatiotemporal distribution characteristics of vegetation NPP in Jiangsu province. J. Nanjing Univ. Inf. Sci. Tech. 2012, 4, 321–325. [Google Scholar]
- Liu, L.; Han, M.; Liu, Y.; Pan, B. Spatial distribution of wetland vegetation biomass and its influencing factors in the Yellow River Delta Nature Reserve. Acta Ecol. Sin. 2017, 37, 4346–4355. [Google Scholar]
- Mou, X.; Sun, Z.; Liu, X. Biomass spatial fractal characteristics and phosphorus nutrient dynamics of Suaeda salsa under different growth conditions of the intertidal zone in the Yellow River estuary. Acta Prataculturae Sin. 2012, 21, 45–53. [Google Scholar]
- Song, H.; Mou, X.; Liu, X. Anthropogenic effect on wetland vegetation growth in the yellow river delta. Ecol. Environ. Sci. 2019, 28, 2307–2314. [Google Scholar]
- West, T.O.; Marland, G. A synthesis of carbon sequestration, carbon emissions, and net carbon flux in agriculture: Comparing tillage practices in the United States. Agric. Ecosyst. Environ. 2002, 91, 217–232. [Google Scholar]
- Shi, Z. The Survey and Analysis of Urban. Forestry and Its Development Trend in Chongming Country; Nanjing Agricultural University: Nanjing, China, 2010. [Google Scholar]
- Yan, R.; Ke, S. The impact of cultivation of tree crops on timber supply capacity of planted forests: Inhibition and promotion? An analysis based on forest inventory panel data in 12 provinces of south China. Chin. Rural Econ. 2019, 5, 38–53. [Google Scholar]
- Wang, L. Analysis on the change of land use and landscape spatial pattern of eastern Chongming Island. Territory Nat. Resour. Study 2011, 2, 19–21. [Google Scholar]
- Zhu, Y.; Li, J.; Meng, C.; Wu, T.; Zhang, T. Land use change in the eastern part of Chongming Island in Shanghai in recent two decades. Chin. J. Appl. Ecol. 2007, 18, 2040–2044. [Google Scholar]
- Liski, J.; Nissinen, A.; Erhard, M.; Taskinen, O. Climatic effects on litter decomposition from arctic tundra to tropical rainforest. Glob. Chang. Biol. 2003, 9, 575–584. [Google Scholar] [CrossRef]
- Gao, Y.; Qi, Z.; Zhong, Q.; Fan, T.; Li, S.; Wang, K.; Zhu, H.; Zhou, T. Responses of soil microbial biomass to long-term simulated warming in Eastern Chongming Island wetlands, China. Acta Ecol. Sin. 2018, 38, 711–720. [Google Scholar]
- Tan, K.; Chen, J.; Zhang, W.; Liu, K.; Tao, P.; Cheng, X. Estimation of soil surface water contents for intertidal mudflats using a near-infrared long-range terrestrial laser scanner. ISPRS J. Photogramm. 2019, 159, 129–139. [Google Scholar] [CrossRef]
- Aragüés, R.; Medina, E.T.; Zribi, W.; Clavería, I.; Álvaro-Fuentes, J.; Faci, J. Soil salinization as a threat to the sustainability of deficit irrigation under present and expected climate change scenarios. Irrig. Sci. 2014, 33, 67–79. [Google Scholar]
- Cassel, F.; Goorahoo, D.; Sharmasarkar, S. Salinization and yield potential of a salt-laden Californian soil: An in situ geophysical analysis. Water Air Soil Poll. 2015, 226, 422. [Google Scholar] [CrossRef]
- Cui, L.; Li, G.; Ou, Y.; Chen, J.; Liao, H.; Zhao, G. Response of variation of net primary productivity to edaphic factors in the coastal salt marshes. Acta Ecol. Sin. 2020, 19, 1–12. [Google Scholar]
- Tian, H.; Xu, X.; Song, X. Drought impacts on terrestrial ecosystem productivity. J. Plant. Ecol. 2007, 31, 231–241. [Google Scholar]
- Rikimaru, A.; Roy, P.S.; Miyatake, S. Tropical forest cover density mapping. Trop. Ecol. 2002, 43, 39–47. [Google Scholar]


Publisher’s Note: MDPI stays neutral with regard to jurisdictional claims in published maps and institutional affiliations. |
© 2021 by the authors. Licensee MDPI, Basel, Switzerland. This article is an open access article distributed under the terms and conditions of the Creative Commons Attribution (CC BY) license (http://creativecommons.org/licenses/by/4.0/).