Article

Understanding the Impact of a Major Hydro-Agricultural Project in Low Mondego Area (Portugal)

1
INESC Coimbra, Department of Civil Engineering, University of Coimbra, Polo 2, 3030-788 Coimbra, Portugal
2
Department of Earth Sciences, CGEO, University of Coimbra, 3030-790 Coimbra, Portugal
*
Author to whom correspondence should be addressed.
Land 2021, 10(2), 114; https://doi.org/10.3390/land10020114
Submission received: 3 December 2020 / Revised: 19 January 2021 / Accepted: 20 January 2021 / Published: 25 January 2021

Abstract

:
The Low Mondego (Baixo Mondego, in Portuguese) river basin has been considerably modified by human interventions to prevent floods and to improve agricultural conditions over recent decades. This work analyzes the main impacts arising from those interventions and the socio-economic context in which they occurred. The development and application of a framework to compute the variation of the nitrogen surplus between 1986 and 2018 in the Low Mondego watershed in the central part Portugal is presented. The nitrogen mass balances take into consideration different land use types, inputs and outputs, thereby making it possible to understand how human interventions have impacted the variation of the surplus. It is noticeable that the major nitrogen sources are related to the agricultural sector. However, factors such as the implementation of the Code of Good Agricultural Practices, as well as social conditions, and regulations to reduce nitrogen emissions to the atmosphere helped to cut the nitrogen surplus. This work shows how improving the agricultural conditions has served to increase the crop productivity in improved areas. Very particular social circumstances led to the reduction in anthropogenic nitrogen sources, which has been accompanied by a decline in the nitrogen that is exported at the river outlet.

1. Introduction

The Mondego watershed, located in the central region of Portugal, has been significantly modified by human interventions in recent decades, mainly to prevent floods, to generate electricity, and to improve agricultural conditions. In fact, the upper part of the river basin is very hilly, with slopes of around 25% in 40% of this area. This characteristic gives rise to a torrential flow regime that aggravates erosion and subsequent sediment accumulation in the lower part of the river basin, where instead slopes are low. Frequent floods were then part of the history that shaped life in this part of the watershed, the Low Mondego. In the 1960s, a Mondego Watershed Hydraulic Master Plan (Aproveitamento Hidráulico da Bacia do Mondego: plano geral [1]) was designed to improve the conditions in the watershed by constructing dams in the upper Mondego to control floods and electricity production, and through additional measures to regularize river banks on the Lower Mondego and create conditions to improve farming on their very fertile land (under water during a part of the year, until then). The plan was approved in 1962, but its implementation only began 10 years later with the construction of the Aguieira, Raiva and Açude Dams that were inaugurated in 1981. This last is in Coimbra and can be considered the starting point for the Low Mondego area. The agriculture improvement measures consisted of an irrigation and drainage system, as well as a road network to provide access to land plots, but their implementation was initiated only in the 1980s and is not yet completed. The analysis of the effects of such delay and of the very particular social and economic context in Portugal in the seventies and eighties are important factors for helping to explain the present situation in the Low Mondego.
It is of paramount importance to evaluate the Low Mondego in the same way as other river basins. In fact, the literature shows the changes that have occurred in the past few decades all over the world, and how they can harm environmental, social and economic conditions.
According to Han et al. [2], there has been a 10-fold increase in reactive N across the globe since the 19th century, which completely altered the N cycle. In fact, it is human actions, mainly the use of inorganic fertilizers in agriculture to increase crop production and the cultivation of leguminous crops with high rates of N fixation that enlarge the amount of available reactive N [3], that have altered the N cycle. This had severe consequences in terms of greenhouse warming, ozone depletion in the stratosphere, acid rain, nitrate pollution of water bodies and eutrophication, and coastal hypoxic zones. The contamination of water bodies can be a serious health threat to humans and animals. In addition, excess N deposition leads to increased soil and water acidity that can damage plants and lead to loss of biodiversity in ecosystems [4]. These are just some of the consequences of the change in the N natural cycle.
Numerous studies can be found where the evolution of the anthropogenic N across the globe, continents, countries or regions has been quantified. Various models of N mass balance have been used for this purpose: (i) SPAtially Referenced Regressions On Watershed (SPARROW), developed by the U.S. Geological Survey (USGS) and described in [5], relates the nutrient inputs, land-surface and stream channel characteristics with the riverine exports using nonlinear statistical regressions; (ii) Soil and Water Assessment Tool (SWAT), developed by the USDA Agricultural Research Service, is a physically based simulation model of water basins that has been widely applied by numerous researchers [6]; (iii) Nutrient Export from Watersheds (NEWS), developed by the UNESCO-IOC (Intergovernmental Oceanographic Commission), is a spatially explicit basin scale model to quantify the sources and the riverine export of nutrients [7]; (iv) Net Anthropogenic Nitrogen Input (NANI), proposed in the seminal work by [8], is a mass balance approach that is recognized as an effective tool to compute nitrogen inputs and has been applied in many water basins. In particular, and to mention only a few cases, NANI was applied by [9] to the Baltic region, by [10] to a large Mediterranean watershed, by [11] to a set of U.S. watersheds, by [12] to an east Africa basin; it has been applied, more recently, by [13] to a China water basin, and by [2] to the whole world between 1961 and 2009. A NANI-based approach is used in this paper (described in Section 2) revisited by [14].
In Portugal, studies on N mass balances are relatively scarce. The work by [15] proposes a methodology to compute the nutrient mass balance of cropland in Portugal in the 1950s, to infer that this was the moment in time that agriculture started to change from organic to inorganic fertilization. The work by [16] uses an adapted Driver–Pressure–State–Impact–Response (DPSIR) approach [17] to estimate the N surplus of Portugal and compares it to Denmark. Cameira et al. [18] studied the nitrogen budgets between 1989 and 2016 in an area localized in the east and northeast of Lisbon (Portugal) of the Tagus river basin. These nutrient budgets were computed using a methodology proposed by the Organization for Economic Co-operation and Development (OECD), described in [19,20]. They analyzed the effectiveness of the mitigation measures that were employed after that area of the Tagus river basin was designated as a nitrate vulnerable zone, in 2004. This was related to the implementation in that year of the European Community Nitrates Directive (Council Directive (1991), 1991/676/EEC) to this stretch of the Tagus basin.
In [21], the authors consider that N mass balances such as the ones obtained through the NANI approach are very useful to determine the dominant N contributors and can be applied to large areas without the use of complex N models. They argue that these balances are not only good indicators of the anthropogenic N loads in a basin, but they also relate to, or estimate, riverine N export. Howarth et al. [22] estimate that in the USA and Europe, 25% of the NANI contribution values of a basin are exported into the respective river.
The European Union has implemented programs and directives to reduce N loads in water bodies. They include the Water Framework Directive [23] and the already mentioned European Nitrates Directive (1991/676/EEC), which both aimed to improve and control water quality. Codes of good practice were implemented in the agricultural sector, with rules such as forbidding the application of chemical and organic fertilizers in some months of the year. In Portugal, the European Nitrates Directive was transposed into Portuguese legislation in 1997 (Decree-Law—DL 235/97, 3 September), updated by DL 68/99, 11 March, which constitutes the basic legislation underlying the Codes of Good Agricultural Practices “Código de Boas Práticas Agrícolas” [24] approved in DL 25/2018, 2 February. The N mass balances are important to understanding the evolution of N sources after the application of these measures, as studied by [18] in a Tagus basin.
The main objective of this work is to improve our understanding of how the interventions in the Low Mondego area influenced environmental conditions in the region and also the factors that created an unexpected context for the fulfilment of the objectives of the Mondego Watershed Hydraulic Master Plan (Aproveitamento Hidráulico da Bacia do Mondego: plano geral [1]). Environmental evaluation is focused on the variation of nitrogen (N) anthropogenic sources and its consequences. A framework to compute the N surplus in this area is proposed to make possible a thorough interpretation of the effects of the mentioned interventions. This work has been developed under Project LEAP (Legacies of Agricultural Pollutants (Leap): Integrated Assessment of Biophysical and Socioeconomic Controls on Water Quality in Agroecosystems (Era-Net Cofund Waterworks 2015 (WATERJPI/005/2016)), aiming at determining agricultural nutrient legacies and identifying adaptive management strategies to protect water resources.

2. Methodology to Estimate N Surplus

The N surplus is estimated in this work following the methodology proposed by [14]. This methodology is based on the annual surface N balance approach of [25], wherein N surplus is defined as the difference between N inputs and N outputs. The inputs considered were the biological N fixation, the atmospheric N deposition, the application of inorganic fertilizer and the manure excreted by animals. Outputs included the N from crops harvested and the grass consumed by animals. Van Meter et al. [14] add to the inputs considered by [25] the contribution of human waste N inputs, which are also seen as relevant N inputs. Additionally, in [14], computing these annual surface balances separately for different types of land use is proposed. It is thus possible to disaggregate the mass balance results by land cover types and obtain supplementary information that can be very useful for decision-making purposes.
The temporal and spatial variation of the anthropogenic N in the Low Mondego area is estimated using a surface N balance that considers inputs and outputs for three kinds of land use: cropland—Equation (1), pastureland—Equation (2), and non-agricultural land—Equation (3):
Nsa = BNFa + FERTa + MANa + DEPCULT
Nsp = BNFp + FERTp + MANp + DEPPAST
Nso = BNFo + DEP
The term Nsa represents the N surplus in cropland, Nsp the surplus in pastureland, and Nso the surplus in non-agricultural land. Nsa is the sum of four terms: the biological fixation of atmospheric N in the cropland (BNFa) by microorganisms, which allows a symbiotic relationship with some types of leguminous plants; FERTa, which includes the application of inorganic fertilization to cropland; MANa, which considers the manure applied to the cropland; DEP, which considers the atmospheric deposition. The term CULT represents the N incorporated in crops that moves out the system, thus subtracted to the previous ones. Nsp also consists of the sum of four terms given by the sum of BNFp, FERTp, MANp, and DEP that are, respectively, the biological fixation, the inorganic fertilization, the manure application and the atmospheric deposition to the pastureland, minus the term PAST that takes grazing into account. Nso is given by the sum of BNFo and DEP that are, respectively, the biological fixation and the atmospheric deposition in non-agricultural land.
The total N surplus, NsT, given in Equation (4), is the sum of the contributions of agricultural areas, pastureland, and non-agricultural land with the contribution of human waste produced by the residents in the area (WHb):
NsT = Nsa + Nsp + Nso + WHb
All the terms presented in Equations (1)–(4) are expressed in kg N per hectare of Low Mondego area per year, and are computed as the mean annual values for time intervals [26] defined as a function of the databases available, e.g., the Agricultural Census from Statistics Portugal, (Instituto Nacional de Estatística (INE) [27], in Portuguese).

3. Case Study

3.1. Intervention in the Low Mondego Area
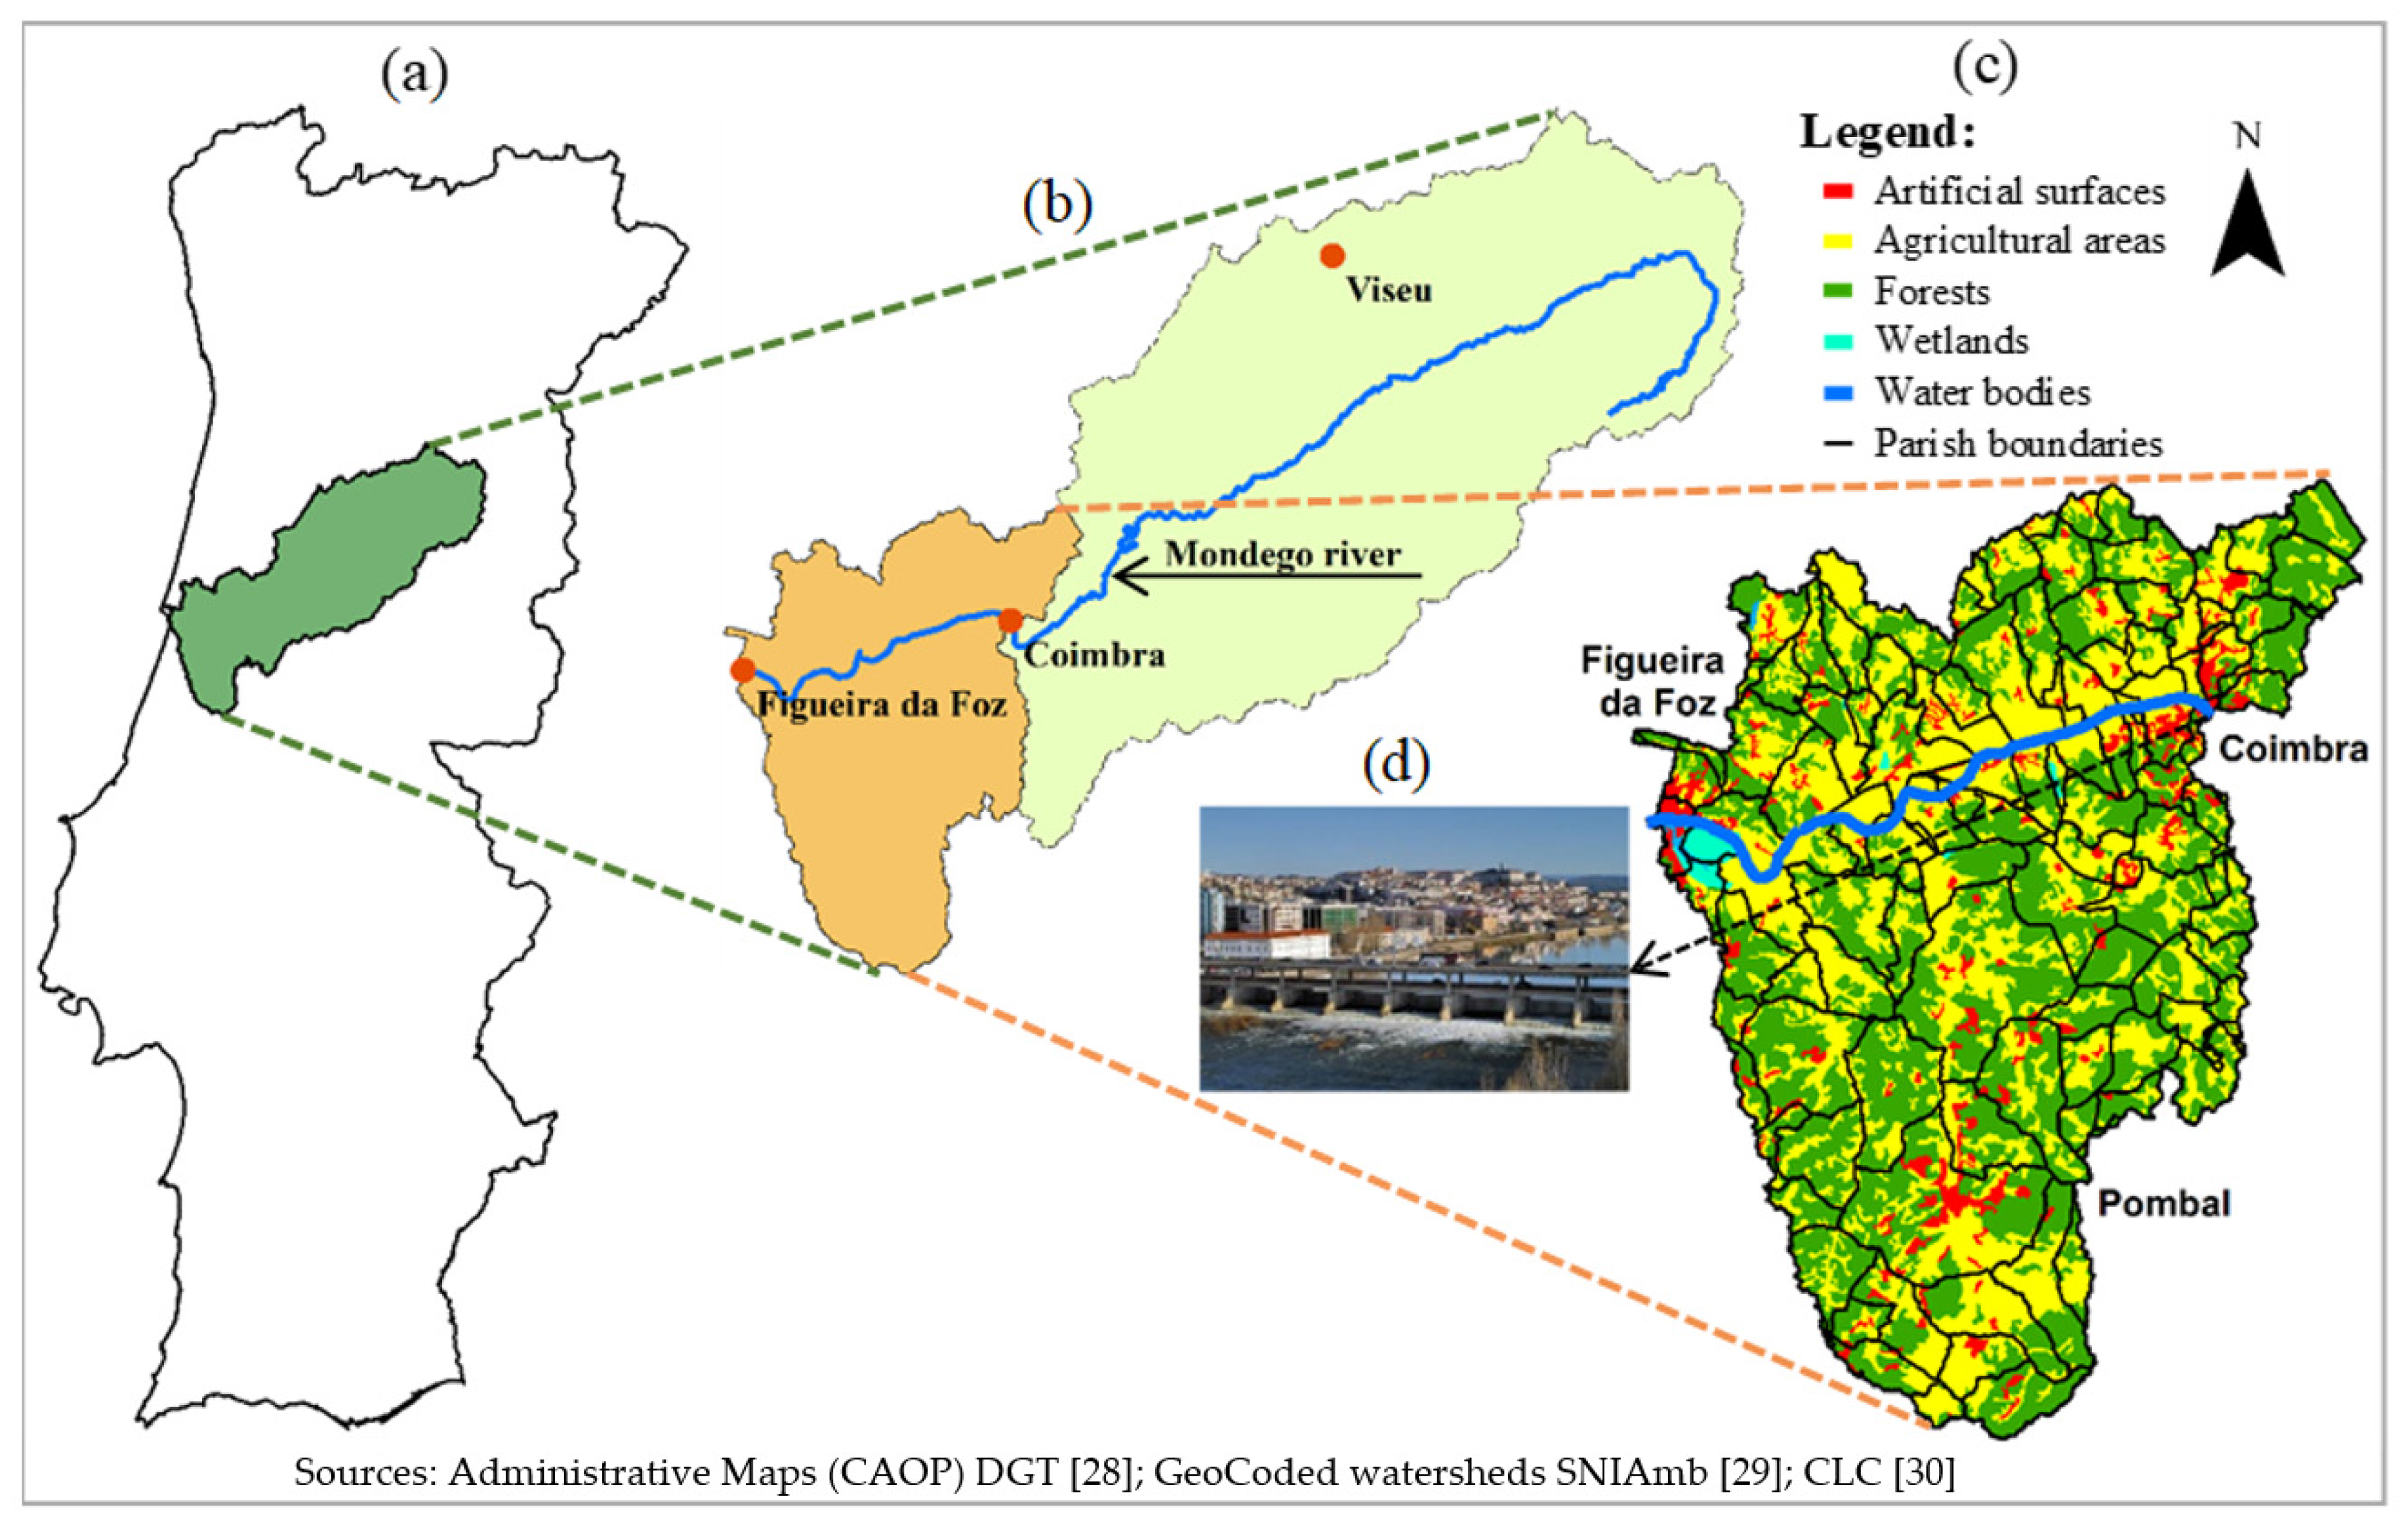
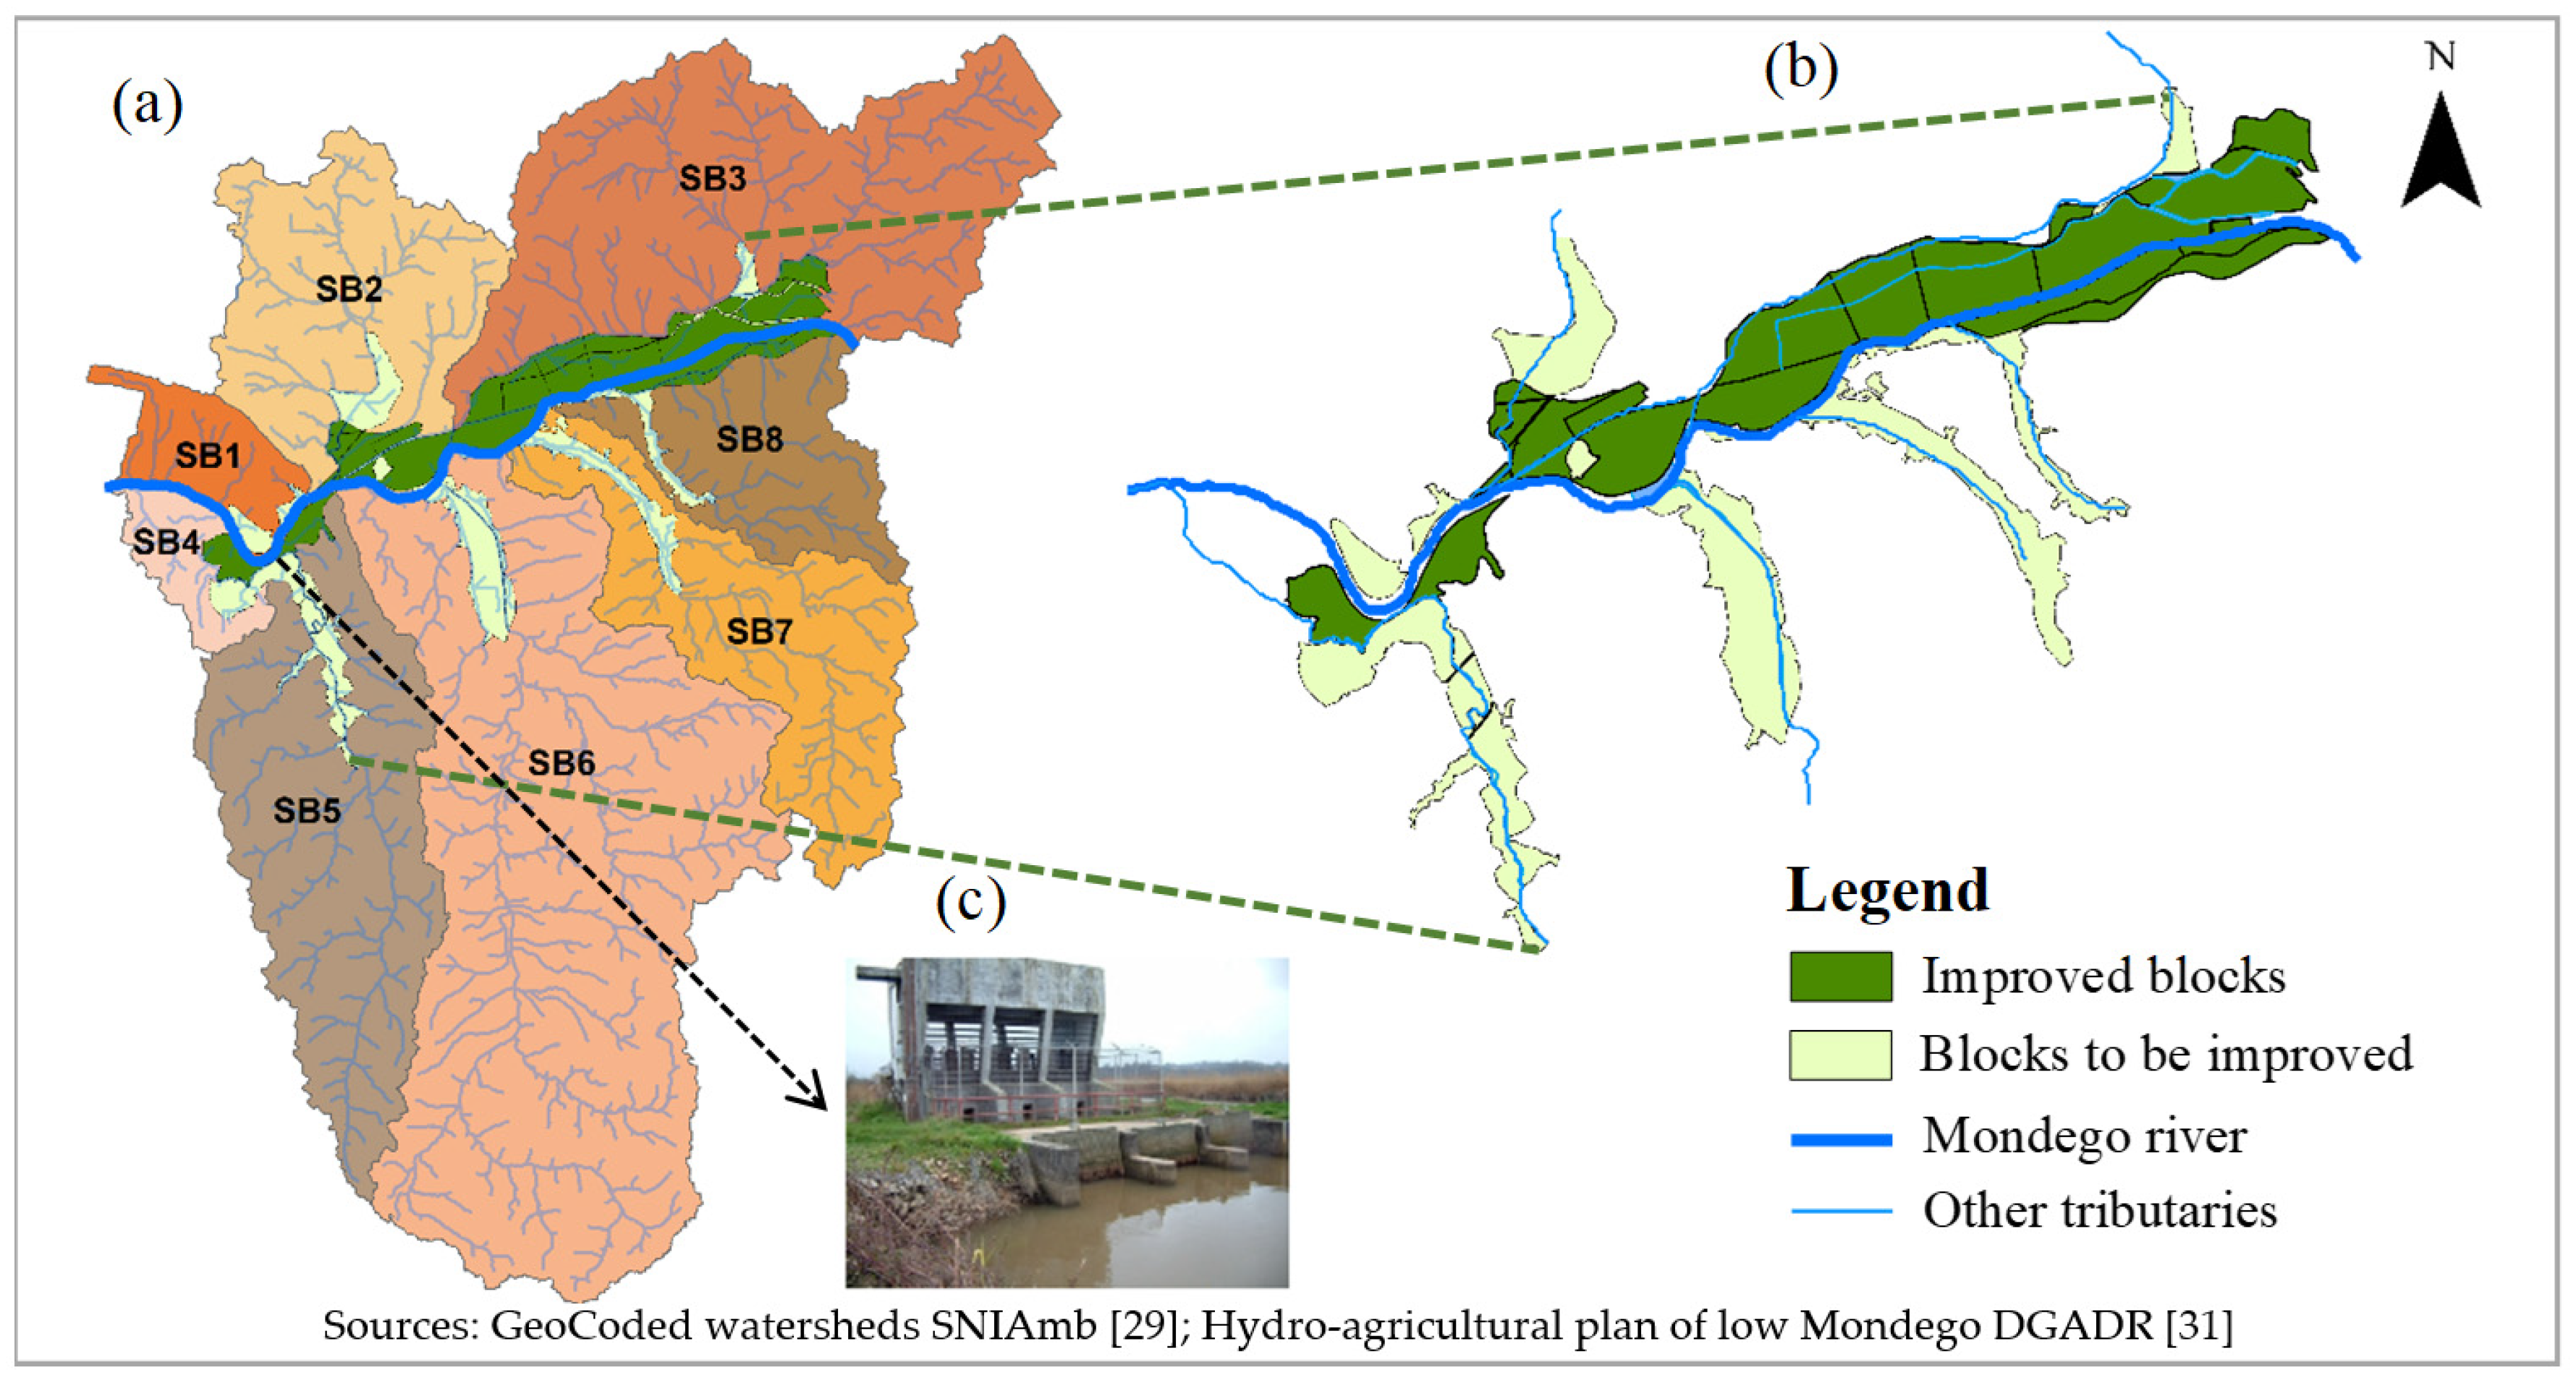
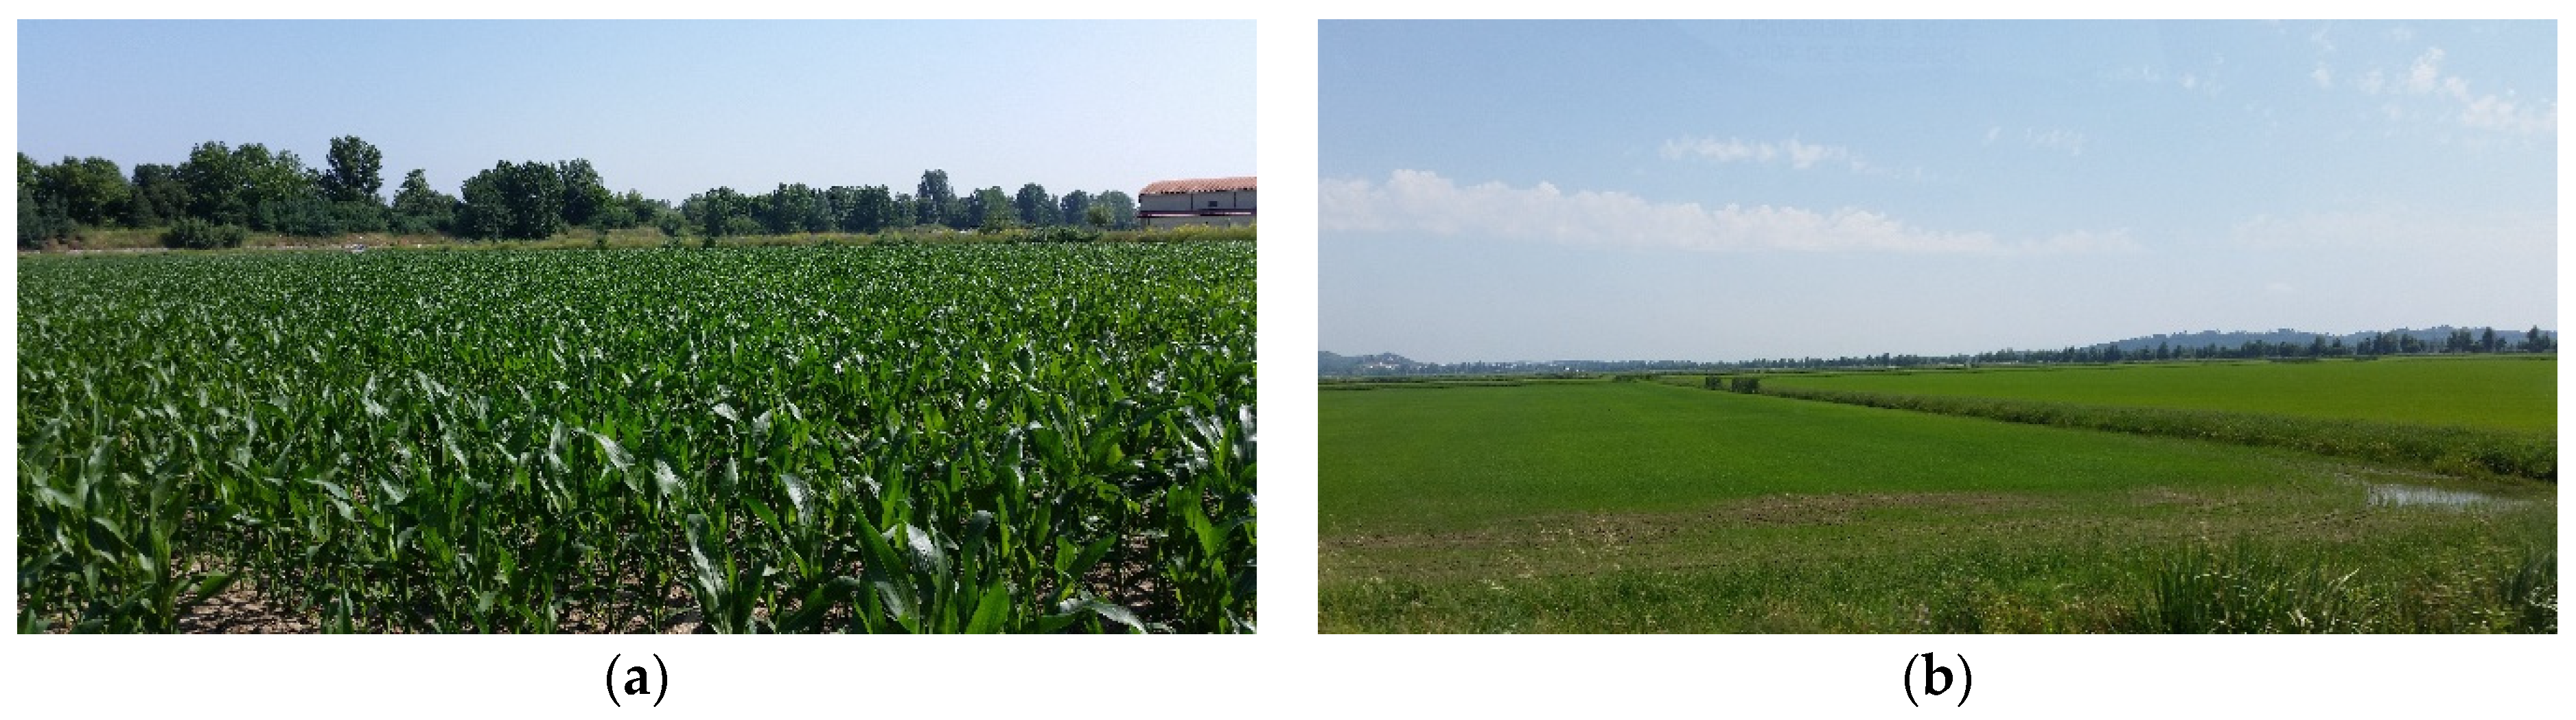
3.1.1. Study Area

The Mondego River is the longest river located wholly in Portugal. The total area of its basin is 6659 km2 (dark green area in Figure 1a). The source of the Mondego is in Serra da Estrela (highest mountain range in mainland Portugal, with the highest point being nearly 2000 m above sea level), and the course of the river runs 258 km until it reaches the Atlantic Ocean at Figueira da Foz.
This river flows through three districts in the central region of Portugal, namely, Guarda, Viseu and Coimbra. It is a narrow river in the upper part (light green in Figure 1b) and widens in the lower part (light brown in Figure 1b) after crossing the city of Coimbra (where the Açude-Dam/Bridge is installed—Figure 1d). The 139 civil parishes in the 1740 km2 of the Lower Mondego basin area are delimited by black lines in Figure 1c (the civil parish, freguesia in Portuguese, is the country’s smallest administrative unit and was used for the calculation of N inputs and outputs). Land use in the Low Mondego (Figure 1c), a flat area, shows a strong occupation by forests (green), and close to the main river and its larger tributaries there are important agricultural areas (yellow). The artificial areas (red) represent the main cities Coimbra, Figueira da Foz and Pombal and some scattered settlements. Swamps (cyan) and water bodies (blue) represent a small portion of the watershed area.
In this study, the Low Mondego is divided into eight main sub-basins (SBs), based on the main GeoCoded watersheds from [29]. On the right bank (Figure 2a), the sub-basins are SB1 (including a group of streams) covering 47 km2, SB2 (Foja stream) covering 182 km2, and SB3 (Ançã stream) covering 54 km2. On the left bank, they are SB4 (low Pranto river) covering 39 km2, SB5 (high Pranto river) covering 252 km2, SB6 (Arunca river) covering 573 km2, SB7 (Ega river) covering 175 km2, and SB8 (Cernache stream) covering 118 km2. There is a structure on the Pranto river built in 1995 (Figure 2c), equipped with three independent modules each containing a submersible pump and a set of locks. It was developed to allow irrigation during the summer and to serve as a drainage and mopping system in rainy seasons (that is why two sub-basins are considered). Figure 2b will be used for the presentation of interventions in Low Mondego area.
In the Low Mondego, there is a kind of homogeneity across the sub-basins with regard to the ecology of the main streams. The riparian margins of streams are occupied by a great diversity of vegetation. According to Barbosa et al. [32], 150 different plant species can be found and a small number of exotic species (10% of the total flora) are recorded. In terms of the most common vegetation in the riparian zones, there are widespread communities of ash (Fraxinus angustifolia subsp. Angustifolia) and Tamarix (African Tamarix) located mainly downstream of the tributaries and in the main river, and there are occasionally riparian alders (Alnus glutinosa) and willows (Salix atrocinerea and Salix alba subsp. Alba). Associated with these species, there are helophytic communities of rooted aquatic plants (Typha spp. and Phragmites australis), mesophilic communities associated with watercourses, riverside communities of rupicolous species in rocky outcrops and downstream of the tributaries, and the river shrub communities (Flueggea tintoria) that play an important role in the regulation of erosive processes [33]. Some flora examples are shown in Figure 3.
Marques et al. [34] describe the Low Mondego ecology (in non-cultivated areas) as rich fauna and flora with biological reservoirs in drainage streams across all the valley. The same authors state that the main small streams are heterotrophic because their energy main source comes from the organic matter rather than benthic algae. In terms of macroinvertebrates, Marques et al. [34] highlight the importance of the crayfish (Procambarus clarkia) that feed on other animals and have an impact on the economy of local residents. The fish communities are mainly allis shad (Alosa alosa L.), yellowtail (Alosa fallax), European eel (Anguilla anguilla L.), barbel (Luciobarbus bocagei), Iberian nase (Pseudochondrostoma polylepis) trout (Salmo trutta) [35]. An important species for local people is the lamprey (Petromyzon marinus L.), which is a highly appreciated dish. The mosquito fish (Gombusio offinis) can be found in large numbers in the rice fields of the Mondego.
In relation to mammals, Marques et al. [34] mention the otter Lutra lutra, a highly protected species in the European Union, that can be found among the vegetation of the riverbanks. Some examples of the fauna are shown in Figure 4.
The Low Mondego region includes an alluvial plain of approximately 15,000 ha (Figure 2b) of very fertile farming land [34], producing mainly maize and rice (see Figure 5 for crops cultivated in these areas). However, this land was underused in the past because of the frequent floods that ruined crops and damaged infrastructure. In fact, before the construction of the dams on the upper Mondego, there was a great accumulation of sediments in the Low Mondego valley, and this contributed to frequent heavy floods. The first attempt to control floods dates to the year 1461. Many other attempts have been attempted since then, but mostly without success.

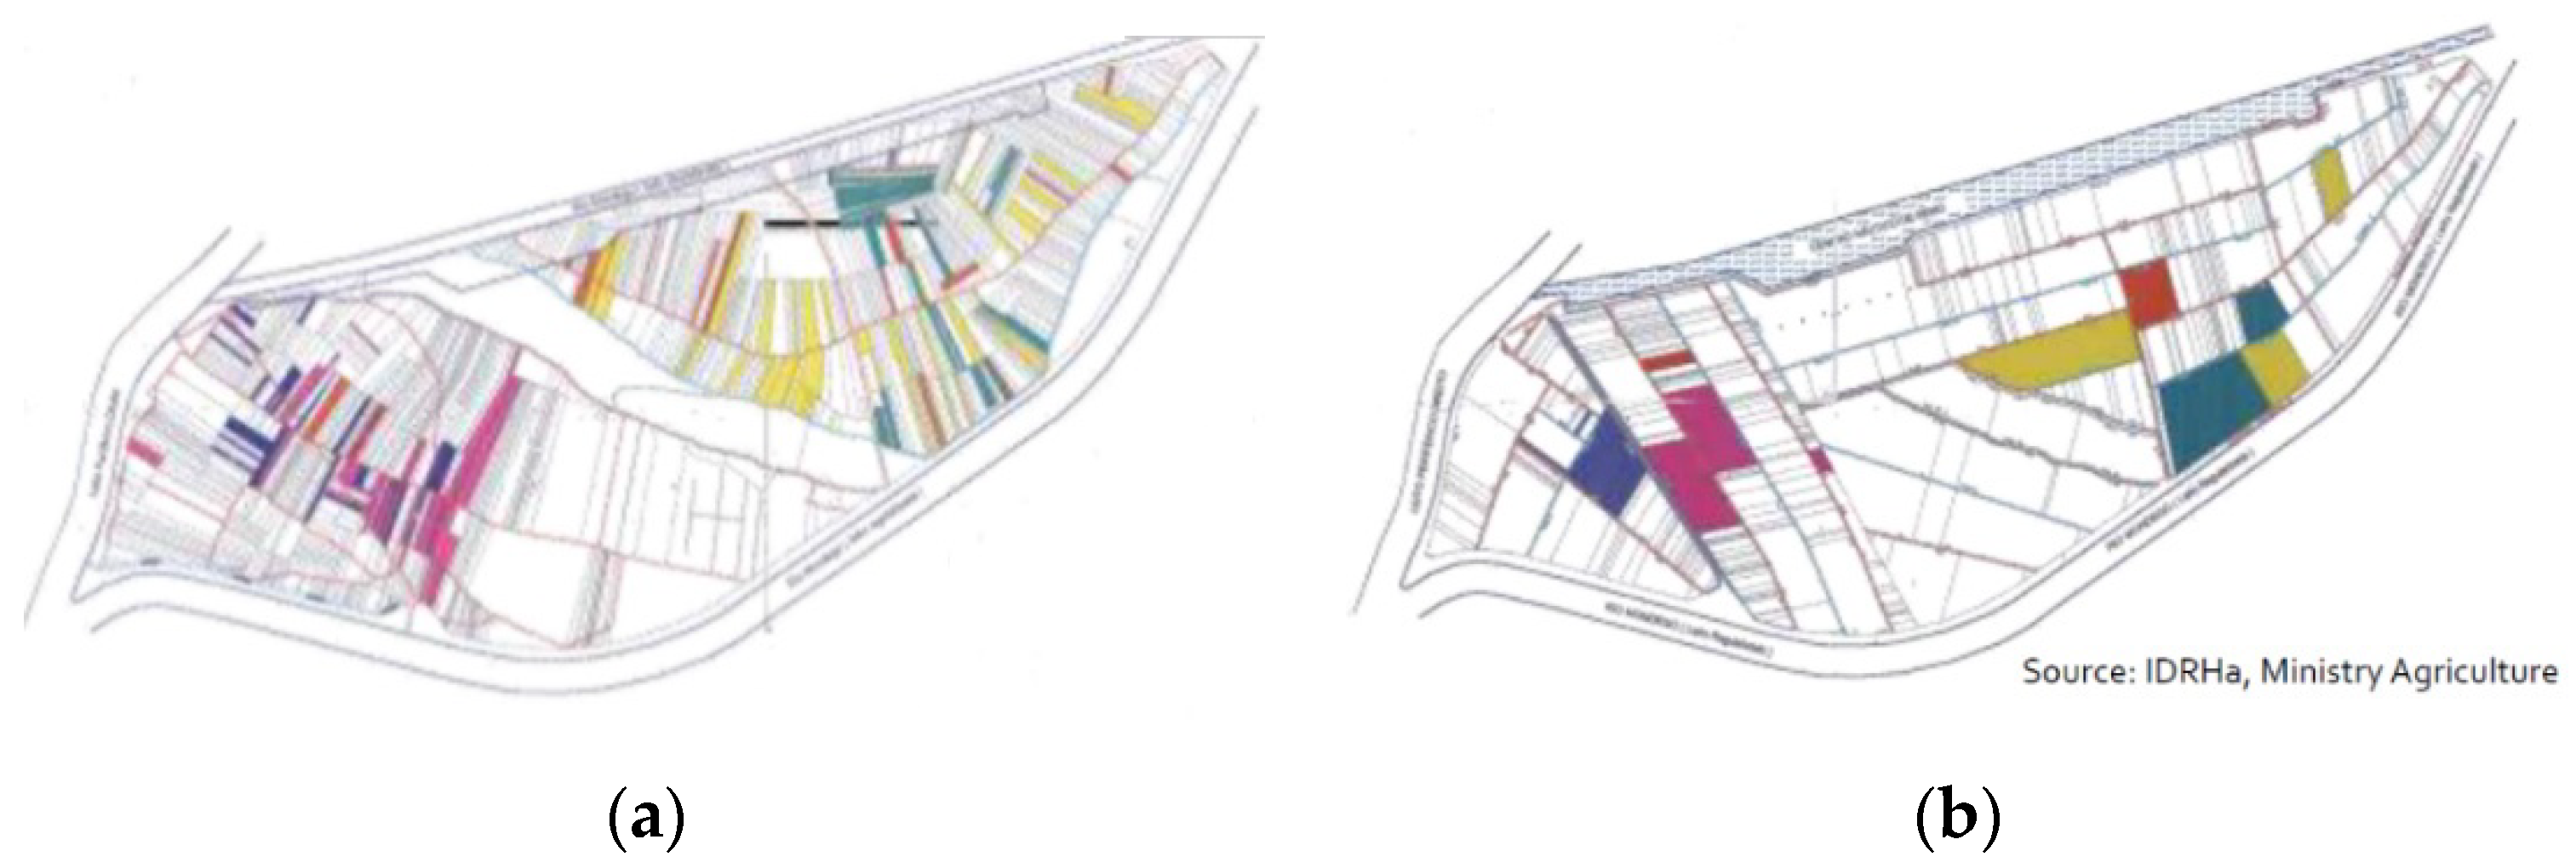
3.1.2. Project for Agricultural Development in the Lower Mondego River Valley

The implementation of the Mondego Watershed Hydraulic Master Plan (Aproveitamento Hidráulico da Bacia do Mondego: plano geral [1]) helped to improve the conditions in the watershed by constructing dams on the upper Mondego to control floods. There were also additional measures to regularize the riverbanks on the Lower Mondego and to create conditions to improve farming on their very fertile land (under water during for part of the year, until then).
The Project for Agricultural Development in the Lower Mondego River Valley (Projecto de Desenvolvimento Agrícola do Baixo Mondego [36]) set out the means for developing a strategy for social-economic development that contemplates improving agriculture conditions by consolidating the land and constructing infrastructure for irrigation, drainage, and providing access to the land parcels. It was designed so that the existing traditional farming would be replaced by a more specialized, and better coordinated activity. Creating a new, modern irrigation and drainage system to enable a more intensified agricultural production was the priority.
For this purpose, the area shown in Figure 2b was divided into different blocks. Blocks were defined [36], more or less uniformly, so that hydraulic structures could be drawn according to soil characteristics, groundwater levels and quality, topography and community borders. This area was characterized by very small land plots, with a very fragmented agrarian structure. A significant challenge was to try to consolidate the land so that more technological and productive methods could be implemented. In fact, there were four farming systems in the 1980s [36]: (i) subsistence farming with mean areas of 0.75 ha of land plots; (ii) part-time farmers with plots having average areas of 0.97 ha and who did not live exclusively from farming activities; (iii) family farms having plots of 2.5 ha that provide the full income for the family; (iv) commercial farms with 12.95 ha of land plots that provided a high income for owners. The subsistence and part-time farms represent 65% of the farmers but only 1/3 of the land area; family and commercial farmers control the remaining 2/3 of the area. In the early 1980s, 61% of the farmers were more than 50 years old and 16% were older than 65 years. The average number of plots per farm was 3.6, with an average area of 3.5 ha. As many as 61% of the farms had less than 1 ha. The valley accommodated about 7600 farms and 1300 landowners, including plots (mostly long and narrow) of less than 0.1 ha [36]. Figure 6 shows an example of a plot area with 482 ha before and after the consolidation process concluded in 2004 and located in SB3 (Alfarelos block [37]). Figure 7 shows the overlapping (black lines) of the previous sizes of the plots and the structure after the consolidation in an area located at SB2 (Ereira/Montemor block [37]) developed in 2002.
Land consolidation was a highly contested process at first [40], because most farmers had a very strong sense of possession of their small plots of land with only pedestrian access. With the land consolidation, these small plots were aggregated and transformed into a network served by agricultural roads that delimited the plots and which allowed the circulation of agricultural machines. Throughout this process of land consolidation, the number of landowners has remained practically unchanged, but the number of plots has been substantially reduced. One example is the case of the Tentugal Block in which, before the land consolidation process, there were 739 owners and 2063 plots. At the end of the process, the number of landowners was the same (739) and the number of plots reduced to 767. This work had a huge impact on increasing farmers’ income and reducing unproductive areas, and also served to solve social conflicts and disputes over property [40].
Before the implementation of [36], the agricultural activity involved very little mechanization and most farmers made use of animals for agricultural activities. Only the larger commercial farmers had machines that did all the work. The Project for Agricultural Development in the Lower Mondego River Valley [36], includes a detailed characterization of the agricultural sector in the Low Mondego area: in the 1980s cattle were kept for milk production, meat production and working (as for centuries) on farms; more than 40% of cattle were used for agricultural work in soil preparation and for transport; large-scale milk production started in 1976 with the use of Friesian cattle. Additionally it is mentioned that sheep and goats were grazed on fallow land and sheep were normally a source of meat and milk, which was used for direct consumption and for cheese production; many small farms had only one or two sheeps and one or two cows; pigs, poultry and rabbits were also part of these farms. The number of animals has fallen drastically in recent decades. The animal work force has been replaced by machinery, and today, most animals are concentrated in intensive animal farms with almost no predomination of animals in small farms, except for some poultry, in a few instances.
A detailed study was carried out about the irrigation and drainage needs of the Low Mondego crops to determine the total water volumes required for irrigation and for parts that need to be drained [36]. These volumes were calculated, and different solutions were proposed, taking into account the specific characteristic of the different blocks, such as soil types, groundwater levels and topography. For the blocks in areas with high groundwater levels, rice culture is preferable and there is the need to construct adequate irrigation and drainage systems for this crop. For the other blocks, crops such as maize are proposed, which need different drainage and irrigation systems. The irrigation network [36], consists of the main irrigation channel (raised 2 to 3 m above the fields) shown in Figure 8, which starts its course in Coimbra. This channel distributes (Figure 9) water to a secondary system of buried reinforced concrete pipes. This secondary system delivers water to a perpendicular tertiary system to irrigate each 6 ha of land plots. The drainage channels follow the natural slope of the Low Mondego valley and each of the land plot units includes small channels to drain any excess water in winter conditions or caused by over-irrigation. All land plots can be accessed thanks to the construction of new roads.
Following its implementation of the Project for Agricultural Development in the Lower Mondego River Valley, some measures for the rehabilitation and conservation of streams and riverside areas were defined, with the main objectives of the hydrological regulation to minimize the risk of flooding, to prevent erosion of the edges, and to recover and enhance the ecological aspects of the water courses and surrounding spaces. The measures range from consolidating and cleaning the bed and banks of water courses, and planting native species, to building hydraulic infrastructure, and improving the heterogeneity of habitats. These measures have been implemented through a number of interventions over recent decades [33]. For rehabilitation of the habitat of the diadromous species, required after some river artificialization, a fish ladder was constructed in 2011 in the Açude-Dam/Bridge. This made it possible to reestablish 51 km of streams of the habitat of these species [35]. In fact, between 1981 and 2011, these species only had 15 km of stream available between the estuary and the Açude-Dam/Bridge.
The intervention, foreseen in the Project for Agricultural Development in the Lower Mondego River Valley, was expected to cover an area of about 12,200 ha, divided into several blocks (Figure 2b). The blocks depicted in dark green were improved between 1990 and 2015, and those depicted in light green are currently under study or waiting to be financed. In fact, this intervention is taking too long to implement. The first blocks to be implemented were in SB4 and SB5 (Pranto river) with 691 ha and were completed in 1990, where two farms were already established. Then, in the 1990s, an area of 3347 ha of blocks in SB3 was executed. In the following decade, an area of 835 ha (dark green) in SB2 and an area of 482 ha in SB3 were concluded. The last areas to be prepared were the blocks in SB8, with an area of 571 ha, one 316 ha block in the north of SB3, and the 464 ha block in SB2 in 2015. At present, of the 12,200 ha that was planned to be improved, only 6706 ha (55%) has so far been accomplished [42].
The consequences of taking such an excessively long time to improve the agricultural land conditions are discussed in this work.

3.2. Data Collected and Sources for N Surplus Estimation

The total nitrogen surplus was calculated in 139 parish-level administrative units (Figure 1c) based on ArcGIS shapefiles from Portuguese Official Administrative Maps, CAOP (Carta Administrativa Oficial de Portugal) of DGT (Direção-Geral do Territorio) [28], grouped into eight sub-basins (Figure 2a). The N surplus is calculated between 1986 and 2018 for ten periods of 3 years or 4 years: 1986–1989, 1990–1992, 1993–1995, 1996–1999, 2000–2002, 2003–2005, 2006–2009, 2010–2012, 2013–2015 and 2016–2018 by a mean annual value for each of these periods. The INE (Statistics Portugal) National Agricultural Census (INE-NAC) includes some detailed information at parish level in terms of crops and livestock [27]. These data are available for the years 1989, 1999 and 2009 (census years). The year 2018 is the last to be considered because, at the current date, this is the last year with available data given by the INE-AS, published in the second half of 2019. The 2019 census is not available yet and has been delayed by the current COVID-19 pandemic situation. INE Agricultural Statistics (INE-AS) corresponding to the Agrarian Region level [27] allowed the collection of data that has been converted to parish level for the years 1986, 1992, 1995, 2002, 2005, 2012, 2015 and 2018. The longer periods of 4 years are those before INE-NAC of 1989, 1999 and 2009.
To obtain the N surplus, it is necessary to determine the biological nitrogen fixation, the inorganic fertilizers and the manure applied on cropland and pastures, the atmospheric deposition, crop and pastures produced for all the Low Mondego area, and its population contribution.

3.2.1. Biological N Fixation

The biological N fixation is promoted by some leguminous species and is the process by which the nitrogen gas (N2) present in the atmosphere is incorporated into plant roots in structures known as nodules. Figure 10 shows these nodules in broad bean roots sown in the Low Mondego region.
The values for the biological fixation in crop land (BNFa) are computed based on the areas of leguminous plants in the Low Mondego. The crops considered are beans, chickpeas, broad beans, and peas. The cultivation areas are given by INE-NAC and INE-AS [27] databases. The biological N fixation coefficient of each crop is based on [24]. Figure 11a includes the total areas of these crops for all time periods and for all sub-basins.
The areas with leguminous plants have been decreasing considerably since the first period under analysis (1986–1989). In the 1980s and early 1990s, the Arunca sub-basin (SB6) had by far the largest area of leguminous plants, but it was reduced, until 2018, to areas similar to those practiced in SB3 (the Ançã sub-basin). In fact, it seems that most of these crops are mainly grown by subsistence farmers to meet their family needs. According to [43], one of the main drivers for giving up farming at the turn of the millennium was related to the aging of the farmers who gave up and had no younger successors to maintain the farms.
The areas considered to compute the biological fixation of N in pastureland (BNFp) are shown in Figure 11b and are supported by the INE-NAC and INE-AS [27] data. These areas are multiplied by the pasture biological N fixation coefficient (15 kg N/ha/yr) proposed by [44] to compute the BNFp.
The same kind of trajectory as that of leguminous crops can be seen in pasture areas in SB6 (Figure 11), but in the other sub-basins the pasture areas were maintained or slightly increased, as in SB3. In the Low Mondego, these areas have low expression (around 2% of the total area of the sub-basin) as there is no extensive pastureland for grazing animals (as mentioned above the number of animals has fallen drastically in recent decades (see Figure 12). The animal work force was replaced by machinery).
The remaining contribution for biological N fixation is that occurring in the non-agricultural areas (BNFo) and that which is proportional to the remaining area of the sub-basin (forest, abandoned cultivated areas that became wasteland—barren or overgrown, urban areas and facilities), which is increasing over time as crop and pasture areas decrease according to INE-NAC and INE-AS [27] databases. BNFo is given by these areas multiplied by a biological N fixation coefficient (0.75 kg N/ha/yr) proposed by [14].

3.2.2. Organic and Inorganic N Fertilization

The amount of organic N fertilization applied to crops, (MANa) and pastures (MANp), was determined by the number of animals from different species of INE-NAC and INE-AS [27] multiplied by the respective N coefficient excretion of [24]. The categories of livestock considered were cattle, pigs, goats, sheep, equine, poultry, and rabbits. Figure 12 includes the number of animals for these species for each sub-basin of Low Mondego.
The number of animals has decreased for almost all species except for poultry, for which a trajectory of augmentation may be noticed. Rabbits, which increased from the period 1986–1989 to 1996–1999, in some sub-basins, then started to decrease. Regarding poultry, some big poultry farms were built in the Low Mondego region to rear many thousands of chickens. Poultry were not considered in the calculations as the residues from these farms are moved out of the basin to be processed in other regions of the country. Therefore, only the livestock that effectively contribute to N inputs in the basin was taken into account.
The largest number of cattle can be found in SB2. In the Foja sub-basin, there was an important cattle industry, but it has been declining, as well as the number of head of cattle in the basin. The sub-basins SB5 and SB6 on the left bank of the Mondego have the most pig and rabbit farms, and SB6 also has a high number of sheep, goats and equine livestock. In fact, this is the sub-basin with the most pastureland areas for grazing these kinds of animals (Figure 11b). SB3 on the right bank is an important supplier of poultry livestock.
The application of inorganic fertilizer in cropland FERTa was determined using the following information: (i) agricultural crop areas (Table 1 and more detailed information in the Supplementary Materials Tables S1 and S2) available in INE-NAC and INE-AS [27]; (ii) data about the inorganic crop fertilization included in the European Union (EU) directory https://water.jrc.ec.europa.eu/. This database was developed by the EC Joint Research Centre and was based on the Common Agricultural Policy Regionalized Impact (CAPRI) model [45] and on the Corine Land Cover (CLC) information [46]. In the present work, it is considered that no N inorganic fertilization FERTp is applied to pastureland as this is not a current practice in the Low Mondego, thus it is defined as zero N input.
According to the aforementioned database (https://water.jrc.ec.europa.eu/), there was a progressive reduction in the use of inorganic nitrogen fertilizer that started in 1990. The restrictive EU policies to protect water bodies, such as the Water Framework Directive and the European Community Nitrates Directive, contribute to this reduction, as do technological innovations in this sector. Innovations, such as precision agriculture technologies, led to lower environmental pollution and improvements in crop yields. This reduction in inorganic fertilization use continued until the end of the first decade of the new millennium, since which there has been a tiny increase in chemical fertilization until today.
The N values generated by organic and inorganic fertilization are represented by FERTG in the figures of the next sections as an overall N input to the water balance of the Low Mondego basin.

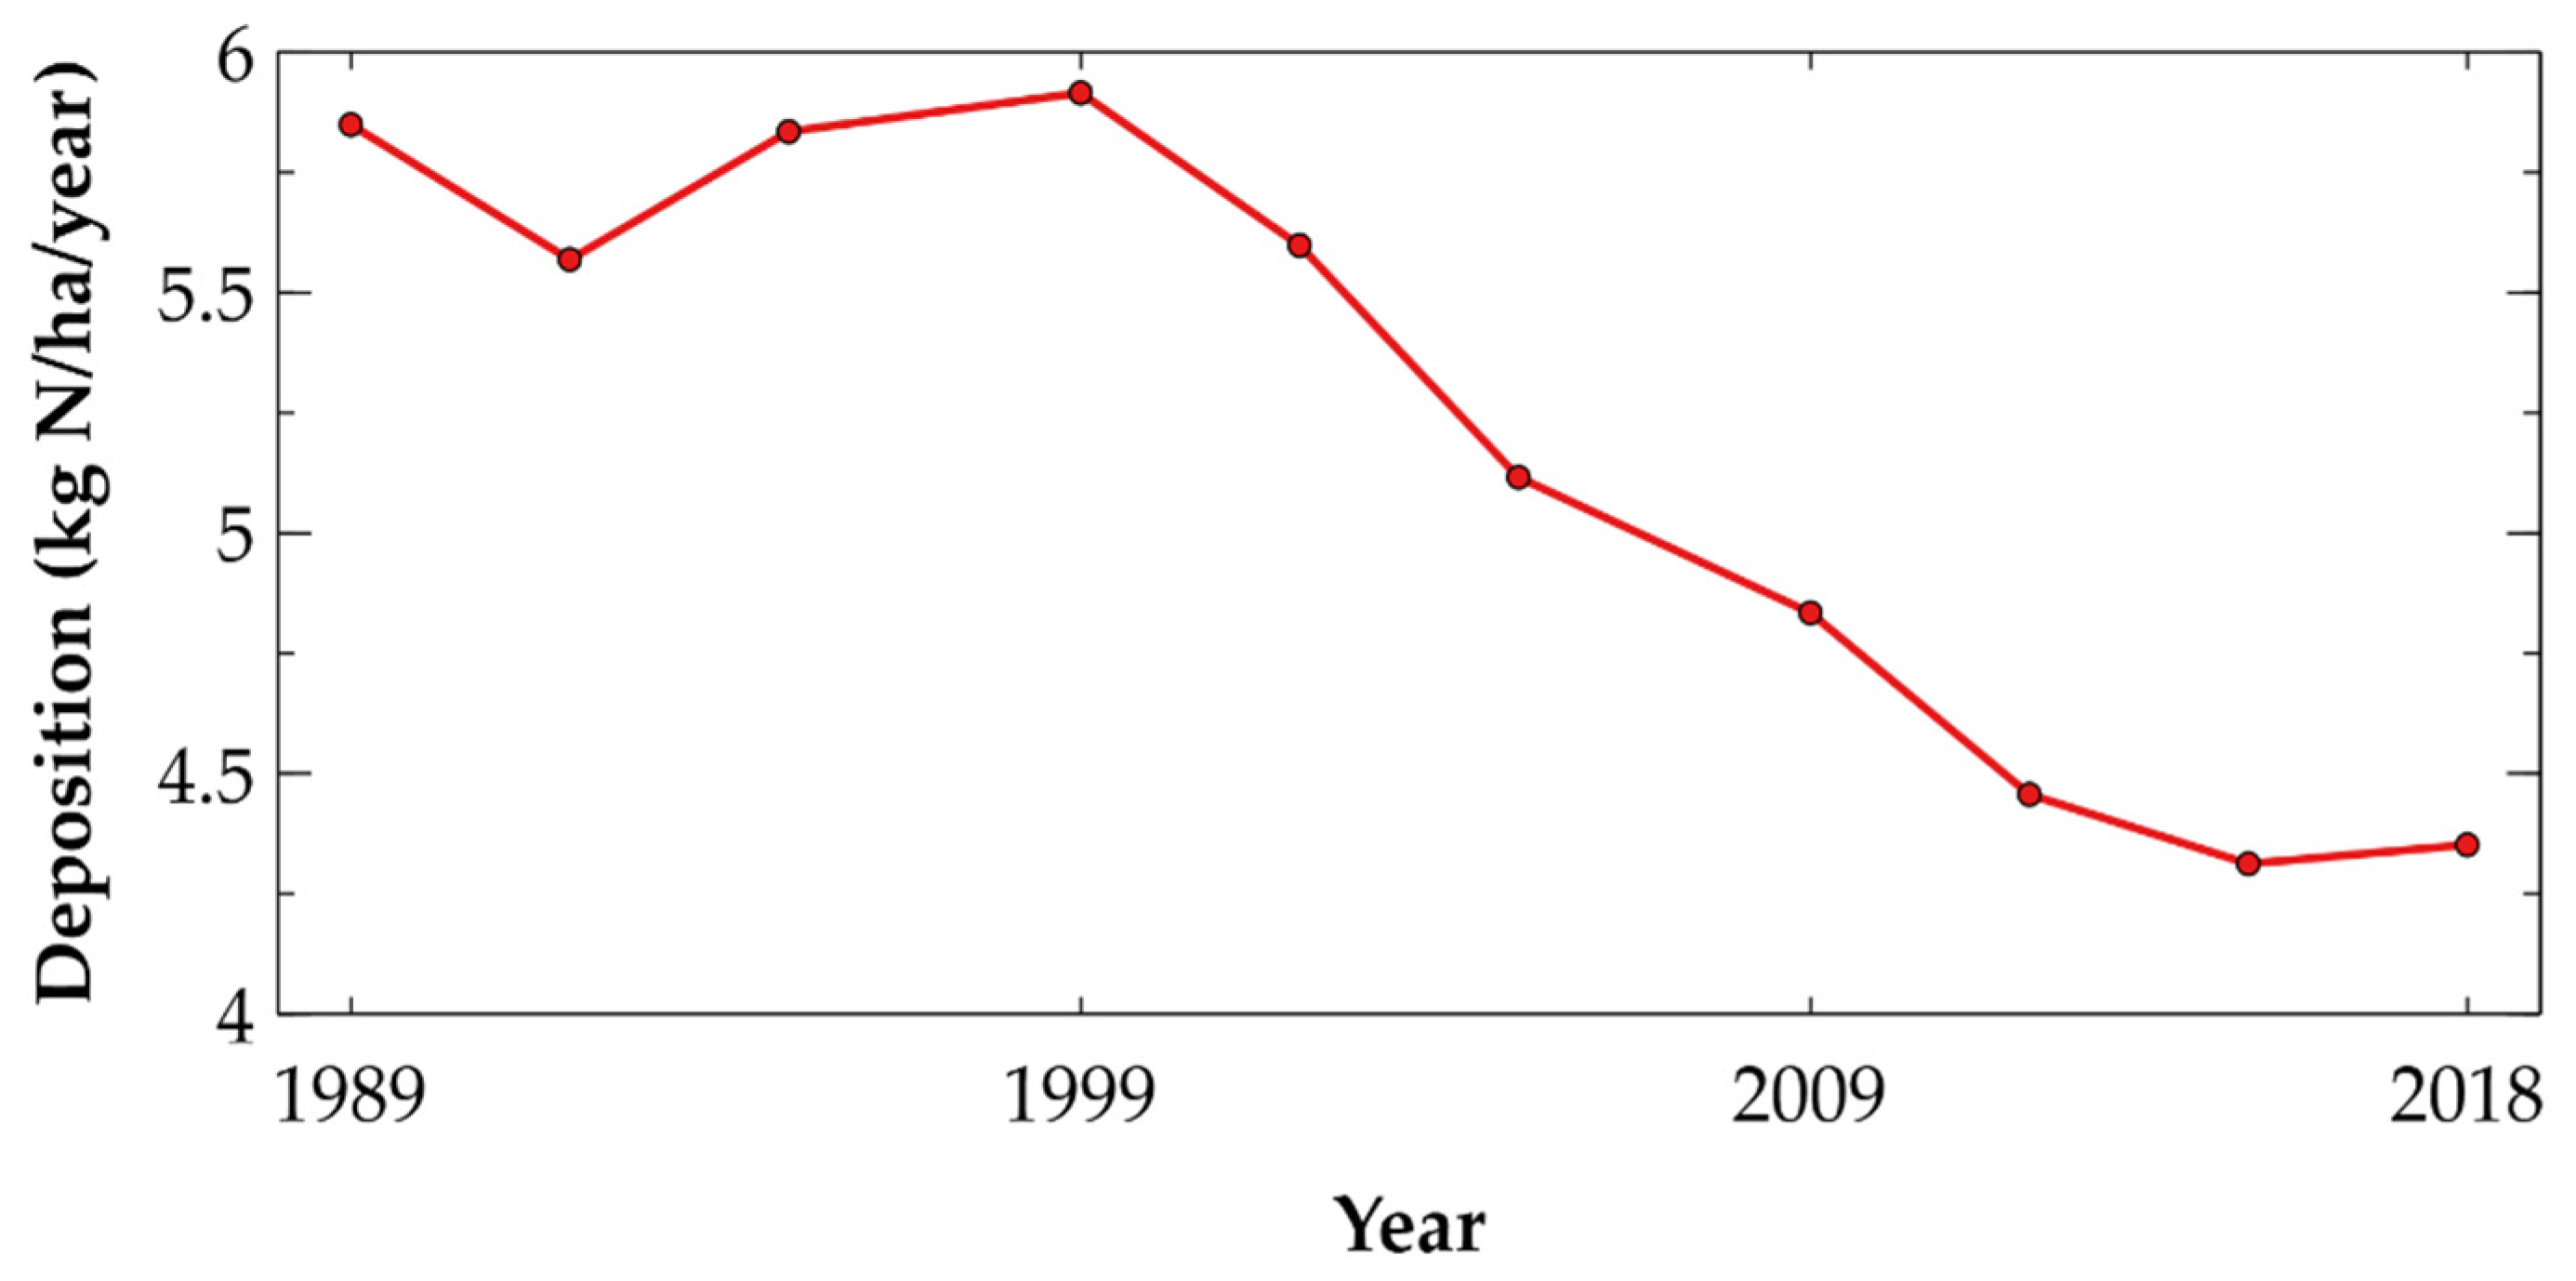
3.2.3. Atmospheric N Deposition

The atmospheric deposition DEP was computed in all land use types considering the corresponding areas multiplied by the N deposition coefficients taken from the European Monitoring and Evaluation Program (EMEP) (www.emep.int). The deposition coefficients were considered constant across all the Low Mondego basin and are presented in Figure 13. The N deposition has been decreasing in the last few decades, mainly due to regulatory measures that led to a fall in N emissions to the atmosphere.

3.2.4. Crops and Pastures

All the previous data collected represent the inputs of N in the sub-basin. The outputs are the removal of nitrogen by the culture productions (CULT) and by the grass consumption (PAST) of animals by grazing. The CULT term is given by the culture production multiplied by the N incorporated in cultures. The quantities of cultures produced in each year are specified by the crop areas multiplied by the productivity of each culture both from INE-NAC and INE-AS [27] databases. The productivity of some cultures is based on [24] when there is a lack of data from INE. The N incorporated in the different cultures is based on the works of [9,25]. The pasture (PAST) term is computed by the methodology proposed by [14] that considers N from pastures characterized by a percentage of N from the application of FERTp (considered equal to zero in the Low Mondego) and MANp (see Section 3.2.2).
The evolution of the total crop areas during the time periods for the different sub-basins is depicted in Figure 14. The crop areas have been decreasing in all sub-basins as the green bar of the graphs decreases in size with time. Sub-basins SB2 and SB3 on the right side of the river have a large percentage of crop areas, and in fact are those where land improvements have already been made (Figure 2b). Land use as pasture is indeed very low and only had some importance in SB6 and SB7 in time periods 1986–1989 and 1996–1999, decreasing since then until more recent periods.
The Project for Agricultural Development in the Lower Mondego River Valley [36] was designed aiming at improving the agricultural land conditions, but it took too long to be finalized and be beneficial for the expectations created. This is one of the factors that contributed to the abandonment of farming areas. In SB6, the main valley of the Arunca river (left bank) is characterized by a very high agricultural potential [43] associated with low slopes, rich soils, available water for irrigation and drainage capacity via the main river. However, there were no agricultural improvements in SB6, and problems such as small land parcels with high dispersion, the lack of irrigation and drainage systems have led to the decrease in farming activities. These problems associated with others indicated by [43], such as the low income from crops, the difficulty finding labor for agriculture and the higher income from other areas of activity drove the land use by crops and pastures in the Arunca basin down to just 12% of the total area of the basin in the last period, despite it having such high potential for agriculture.
The most important cultures in the Low Mondego region are maize and rice. These two crops occupy almost all the implemented agricultural blocks in Figure 2b. Figure 15 shows the variation in time of these cultures in terms of the total Low Mondego areas and in terms of the areas cultivated in the parishes that are included in the agricultural blocks.
As stated, the Project for Agricultural Development in the Lower Mondego River Valley divided the intervention area into several blocks (Figure 2b) with a total area of 12,200 ha. At the end of the 1980s, the whole area still had to be improved (12,200 ha), in 1999, 4038 ha had been done, in 2009, 5355 ha, and in 2018 the area completed was equal to 6706 ha [42]. These areas are represented in Figure 15 by the brown and blue columns. In fact, it was just in the last period under evaluation that the already enhanced area of blocks became larger than the area to be completed. From the figure, the area of maize in the Low Mondego has been decreasing since 1989 (yellow line in Figure 15). The area of rice also decreases from 1989 to 2009 but stabilizes in 2018 (green line in Figure 15). In terms of maize, these areas were practically the same across all the periods and in 2018 represent the larger proportion of the maize produced in the Low Mondego (comparing the yellow line with the yellow column in 2018). In the 1989 period, the total area of maize was much larger than the area in the agricultural blocks (comparing the yellow line with the yellow column in 1989) and this means that the reduction in the total maize area occurs outside the blocks. In the case of rice, it can be concluded that the area of this culture is practically all included in the blocks (comparing the green line with the green columns across all periods). The rice culture decreases from 1989 to 1999 in the block areas (green columns) but then recovers in 2009 and 2018, and this can be associated with the improvement in the agricultural conditions in some blocks during this period.

3.2.5. Residents

The contribution of residents to the N surplus (WHb) is obtained by the number of residents in each sub-basin (Table 2) given the decadal INE Population Census (INE-PC) at a parish level [27] and for the other years by the INE Population Estimates (INE-PE) at a district level converted to parish level [27]. The number of residents is multiplied by a human N consumption coefficient. This coefficient is determined based on values reported by [9] and [47] and taking into account the evolution of the wastewater treatment plants implemented in this area. There has been a large investment in wastewater systems in Portugal in recent decades, and specifically in the Low Mondego region, according to the [27,48,49] the coverage level of residents’ wastewater systems has increased from 50% in 1993–1995 to 81% in 2016–2018. The information included in Table 2 shows a slight variation in the residents during the four periods under analysis.

4. Results and Discussion

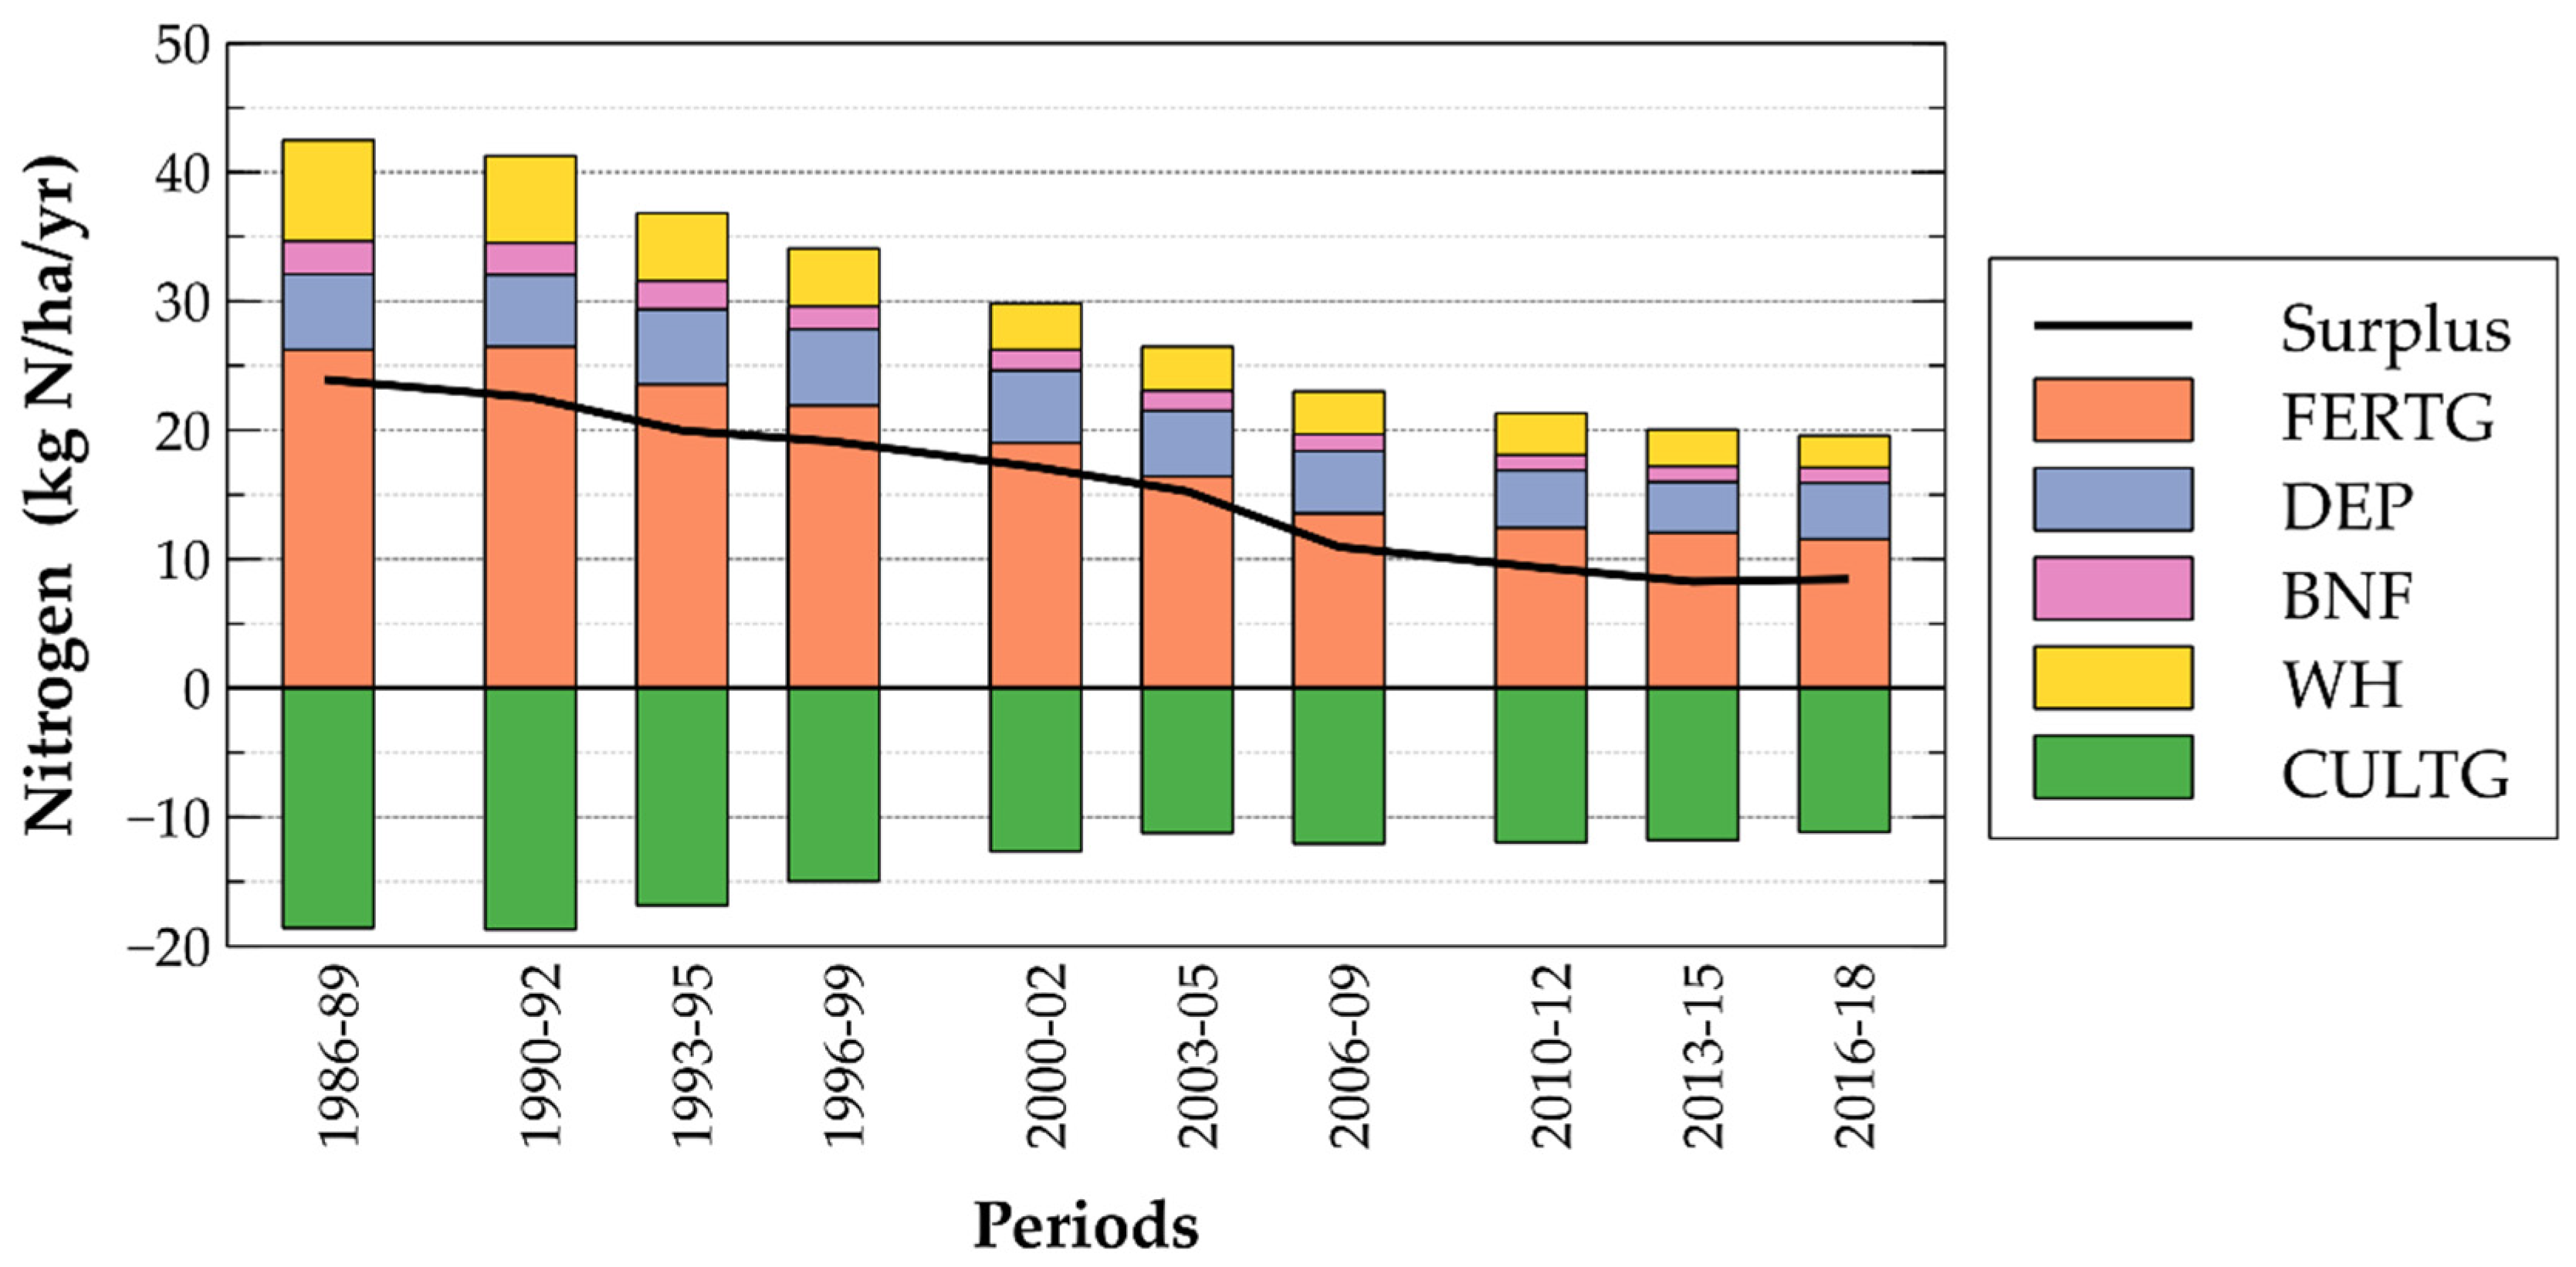
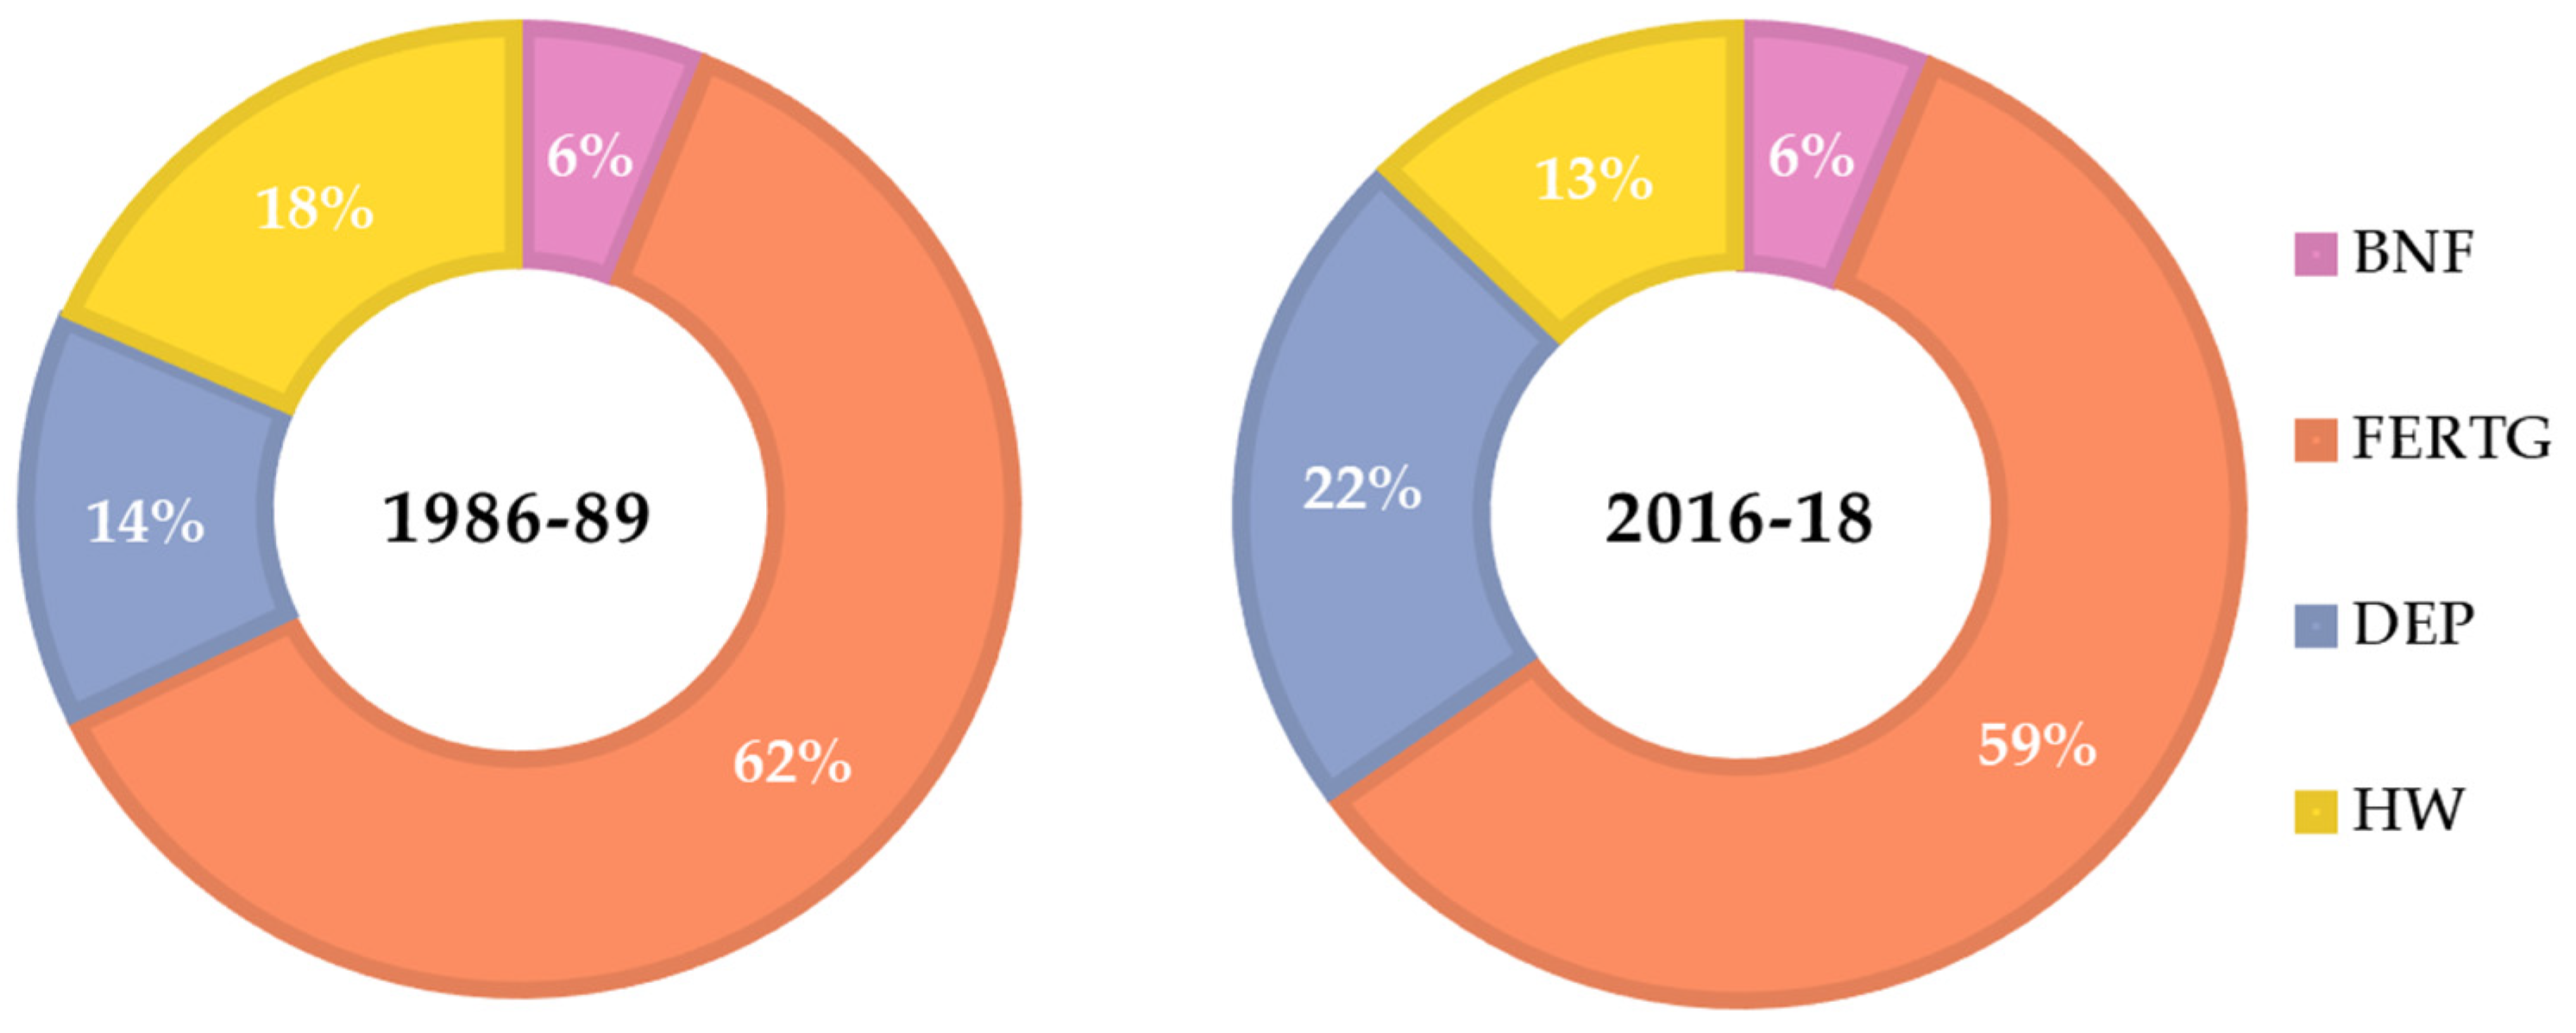
4.1. Contribution of Different Sources to N Surplus in Low Mondego

Figure 16 presents the contribution of the inputs and outputs to the N surplus (black line) in the Low Mondego. Some terms of the mass balance surplus equations (Equations (1)–(4)) were aggregated. BNF aggregates the terms computed for the three land uses (BNFa, BNFp and BNFo); FERTG aggregates the global fertilization by the manure terms MANa and MANp and the FERTa term; CULTG aggregates the outputs of CULT and PAST. These terms were aggregated to facilitate the graphical representation of the information.
Overall, the N surplus in the Low Mondego decreases from 23.9 kg N/ha/yr in the first period to 8.44 kg N/ha/yr in the last period (black line). This decrease is influenced by the reduction in all input components. The BNF is the one with the lowest contribution and the FERTG represents a major contribution to the inputs of N surplus with mean percentages of 62% of the total N inputs (Figure 17). The FERTG contributions to the total N inputs of the Low Mondego confirms that the agriculture sector is the main source of N. This was also the main driver of the N surplus reductions. The work by [18] found a mean value of 75% for the FERTG (including manure and inorganic fertilization) for the Portuguese Tagus river sub-basin. This may be associated with higher agricultural sector activity, with agricultural areas of 52% (relatively to the total basin area) on average in terms of the studied period, which compares with the average area of 23% of Low Mondego. The CULTG (green bars in the Figure 16) also decreased from 18.6 to 11.1 kg N/ha (a 40% decrease), but this fall was lower than the decrease of 48% in the crop land use in the Low Mondego (Figure 14), and this means there was an increase in crop productivity in those areas that retained agriculture, mainly in the agricultural blocks. This crop productivity increase also contributes to the reduction in the N surplus in the Low Mondego to values that are quite lower than those estimated by [16] with values of 15 and 30 kg N/ha/yr between 1995 and 2015 for the whole country of Portugal.
The contribution in percentage of terms to the N input for years 1986–1989 and 2016–2018 is displayed in Figure 17. This is thirty-two years where drastic changes happened not only due to measures related to new environmental legislation (DEP and HW), but also to changes in agricultural practices, to changes in social context and to the decrease in importance of the agricultural sector in the Low Mondego area (BNF and FERTG).
The left side of this figure details the inputs of the first column of Figure 16 and the right side details those of the last column of the same figure. The analysis of the BNF term indicates that it maintains the same importance of 6% of the total inputs between the first and the last period under analysis. In fact, there was a reduction in the BNF terms of 46% over the periods, but approximately the same level of decrease in the total N inputs was observed. As stated, applying fertilizer was the main contributor to N input in the 1986–1989 period with 62% of the total inputs; this was slightly reduced to 59% in 2018, associated with the reduction in cropland area. In contrast, the atmospheric N deposition increases its importance from 1989 from 14% to 22%, but this is associated with the severe decrease in other N inputs as the DEP quantities per hectare of the basin of N have also decreased (Figure 13), associated with the decrease in pollutant emissions. The N inputs by residents (WH) also reduce from 7.8 kg N/ha/yr (18% of N inputs in the first period) to 2.5 kg N/ha/yr (13% of the N inputs in the last period) related to the improvements in terms the percentage of the residents connected to wastewater treatment facilities [27].

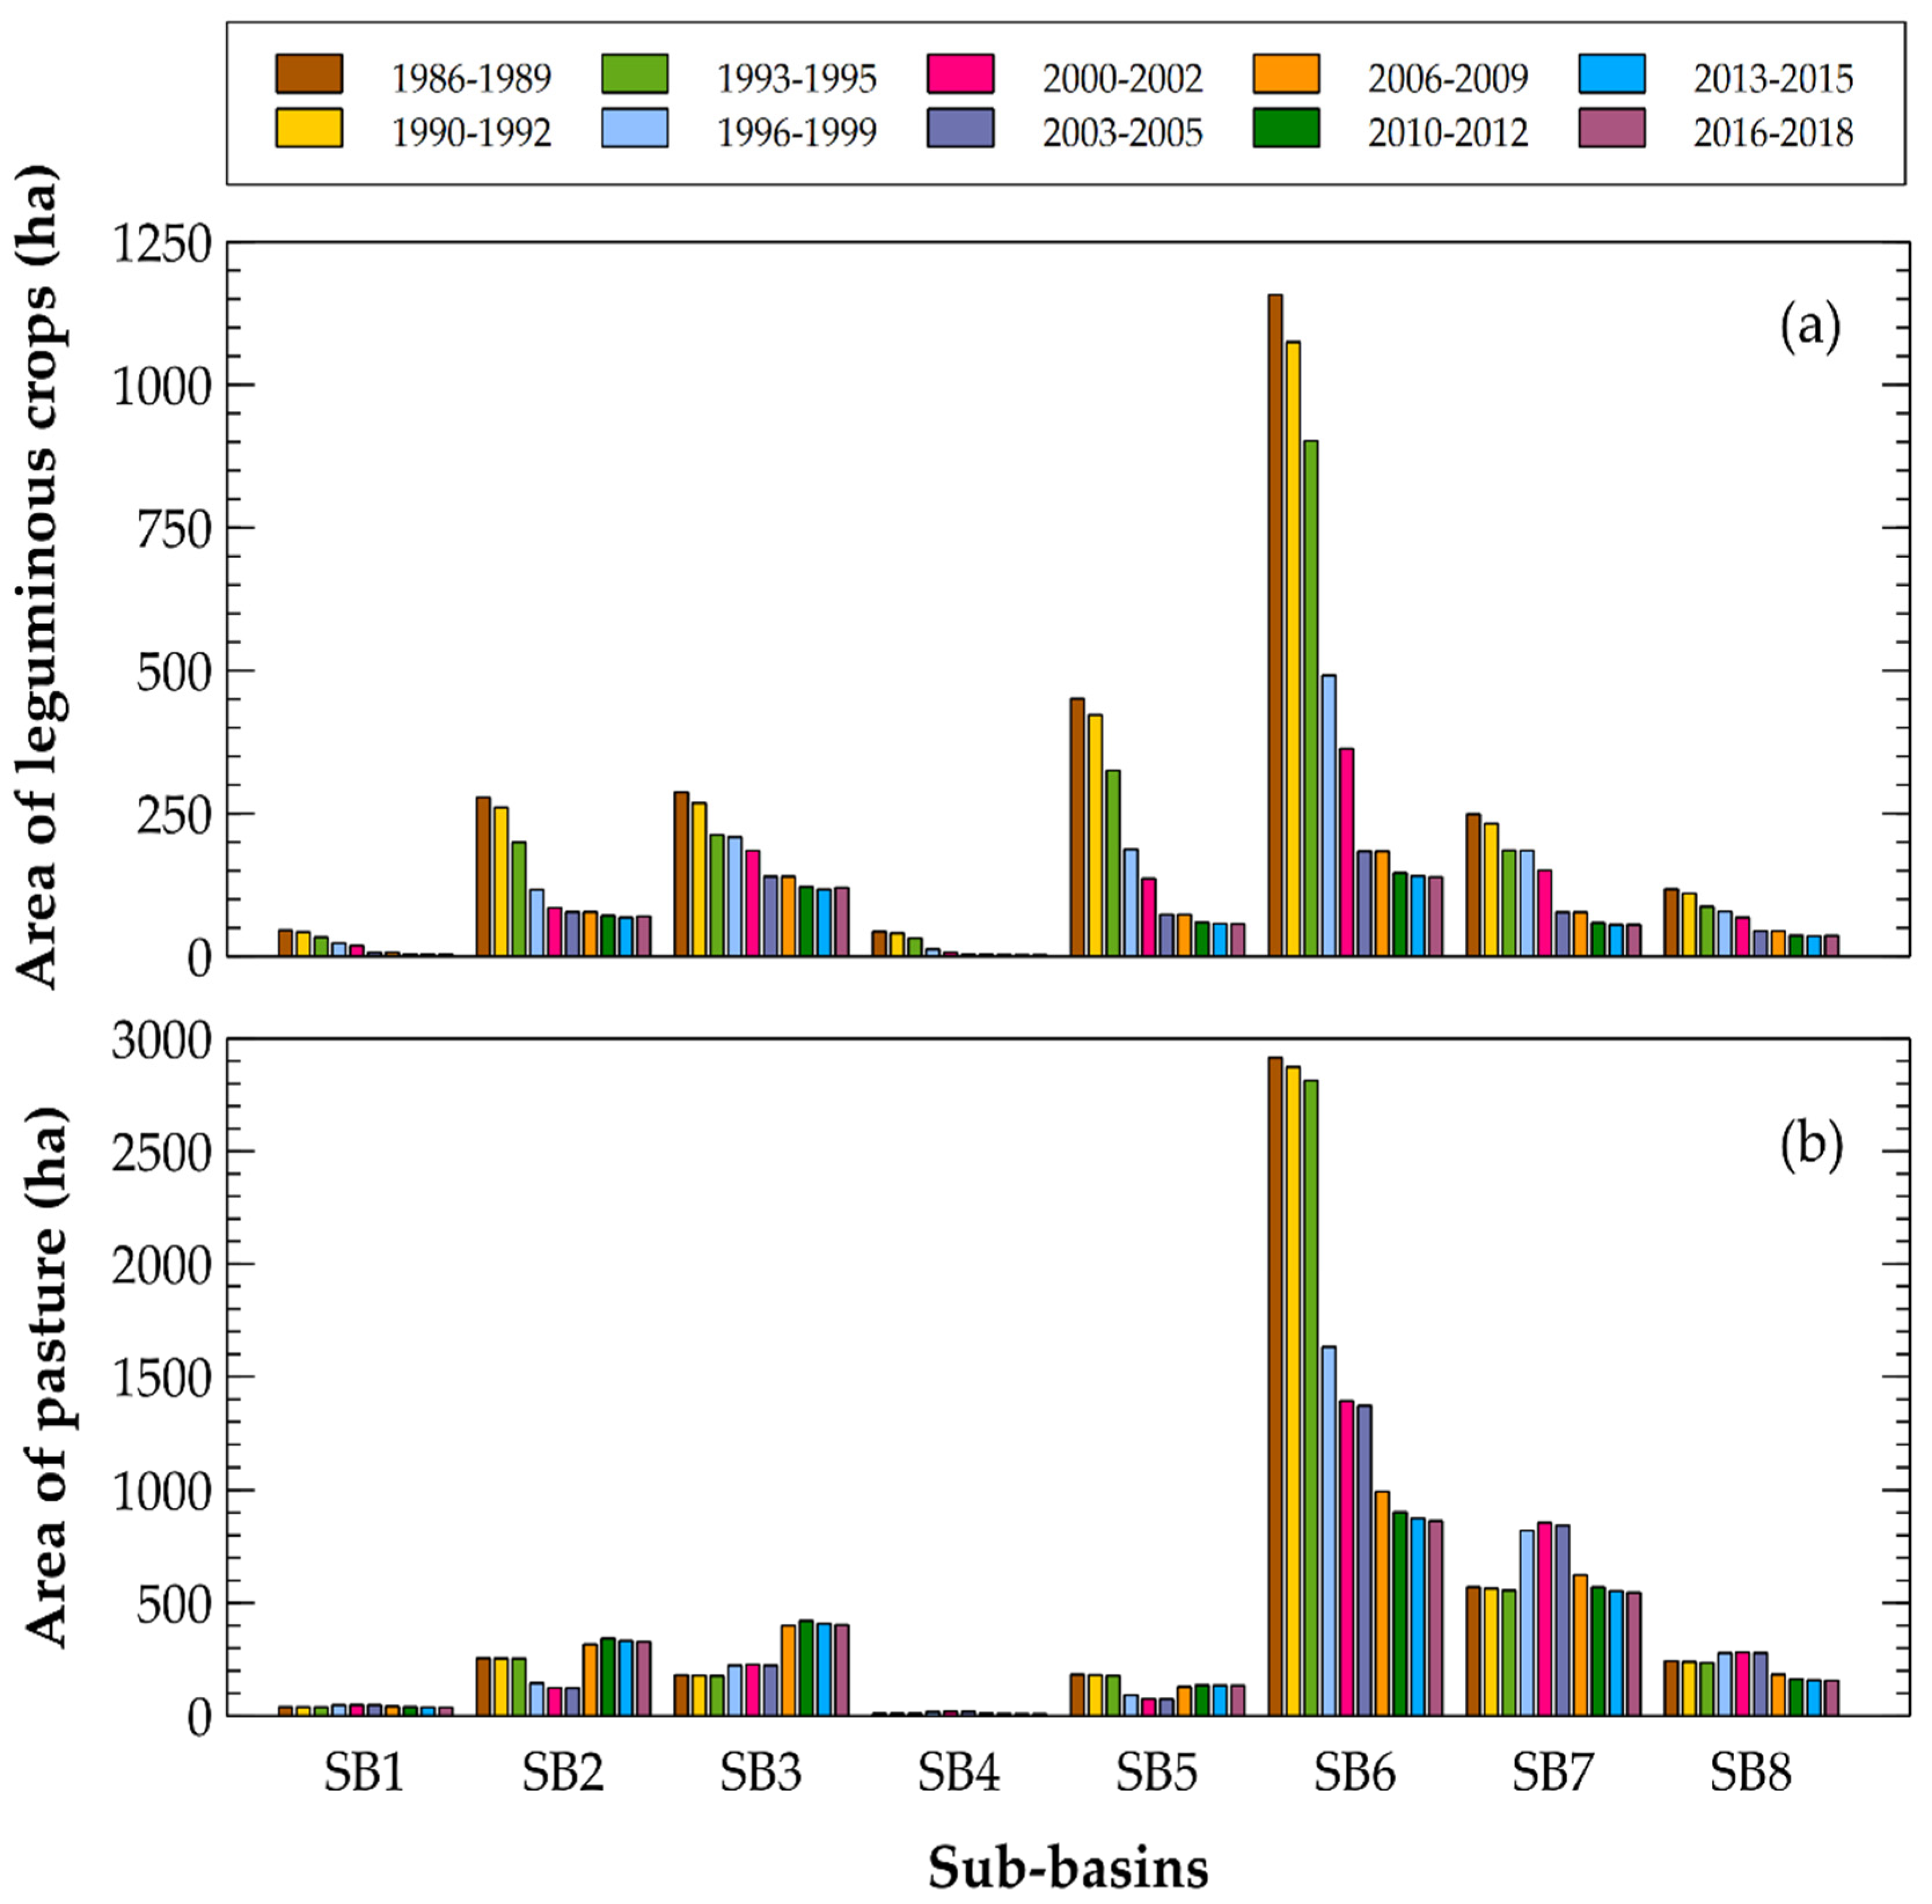
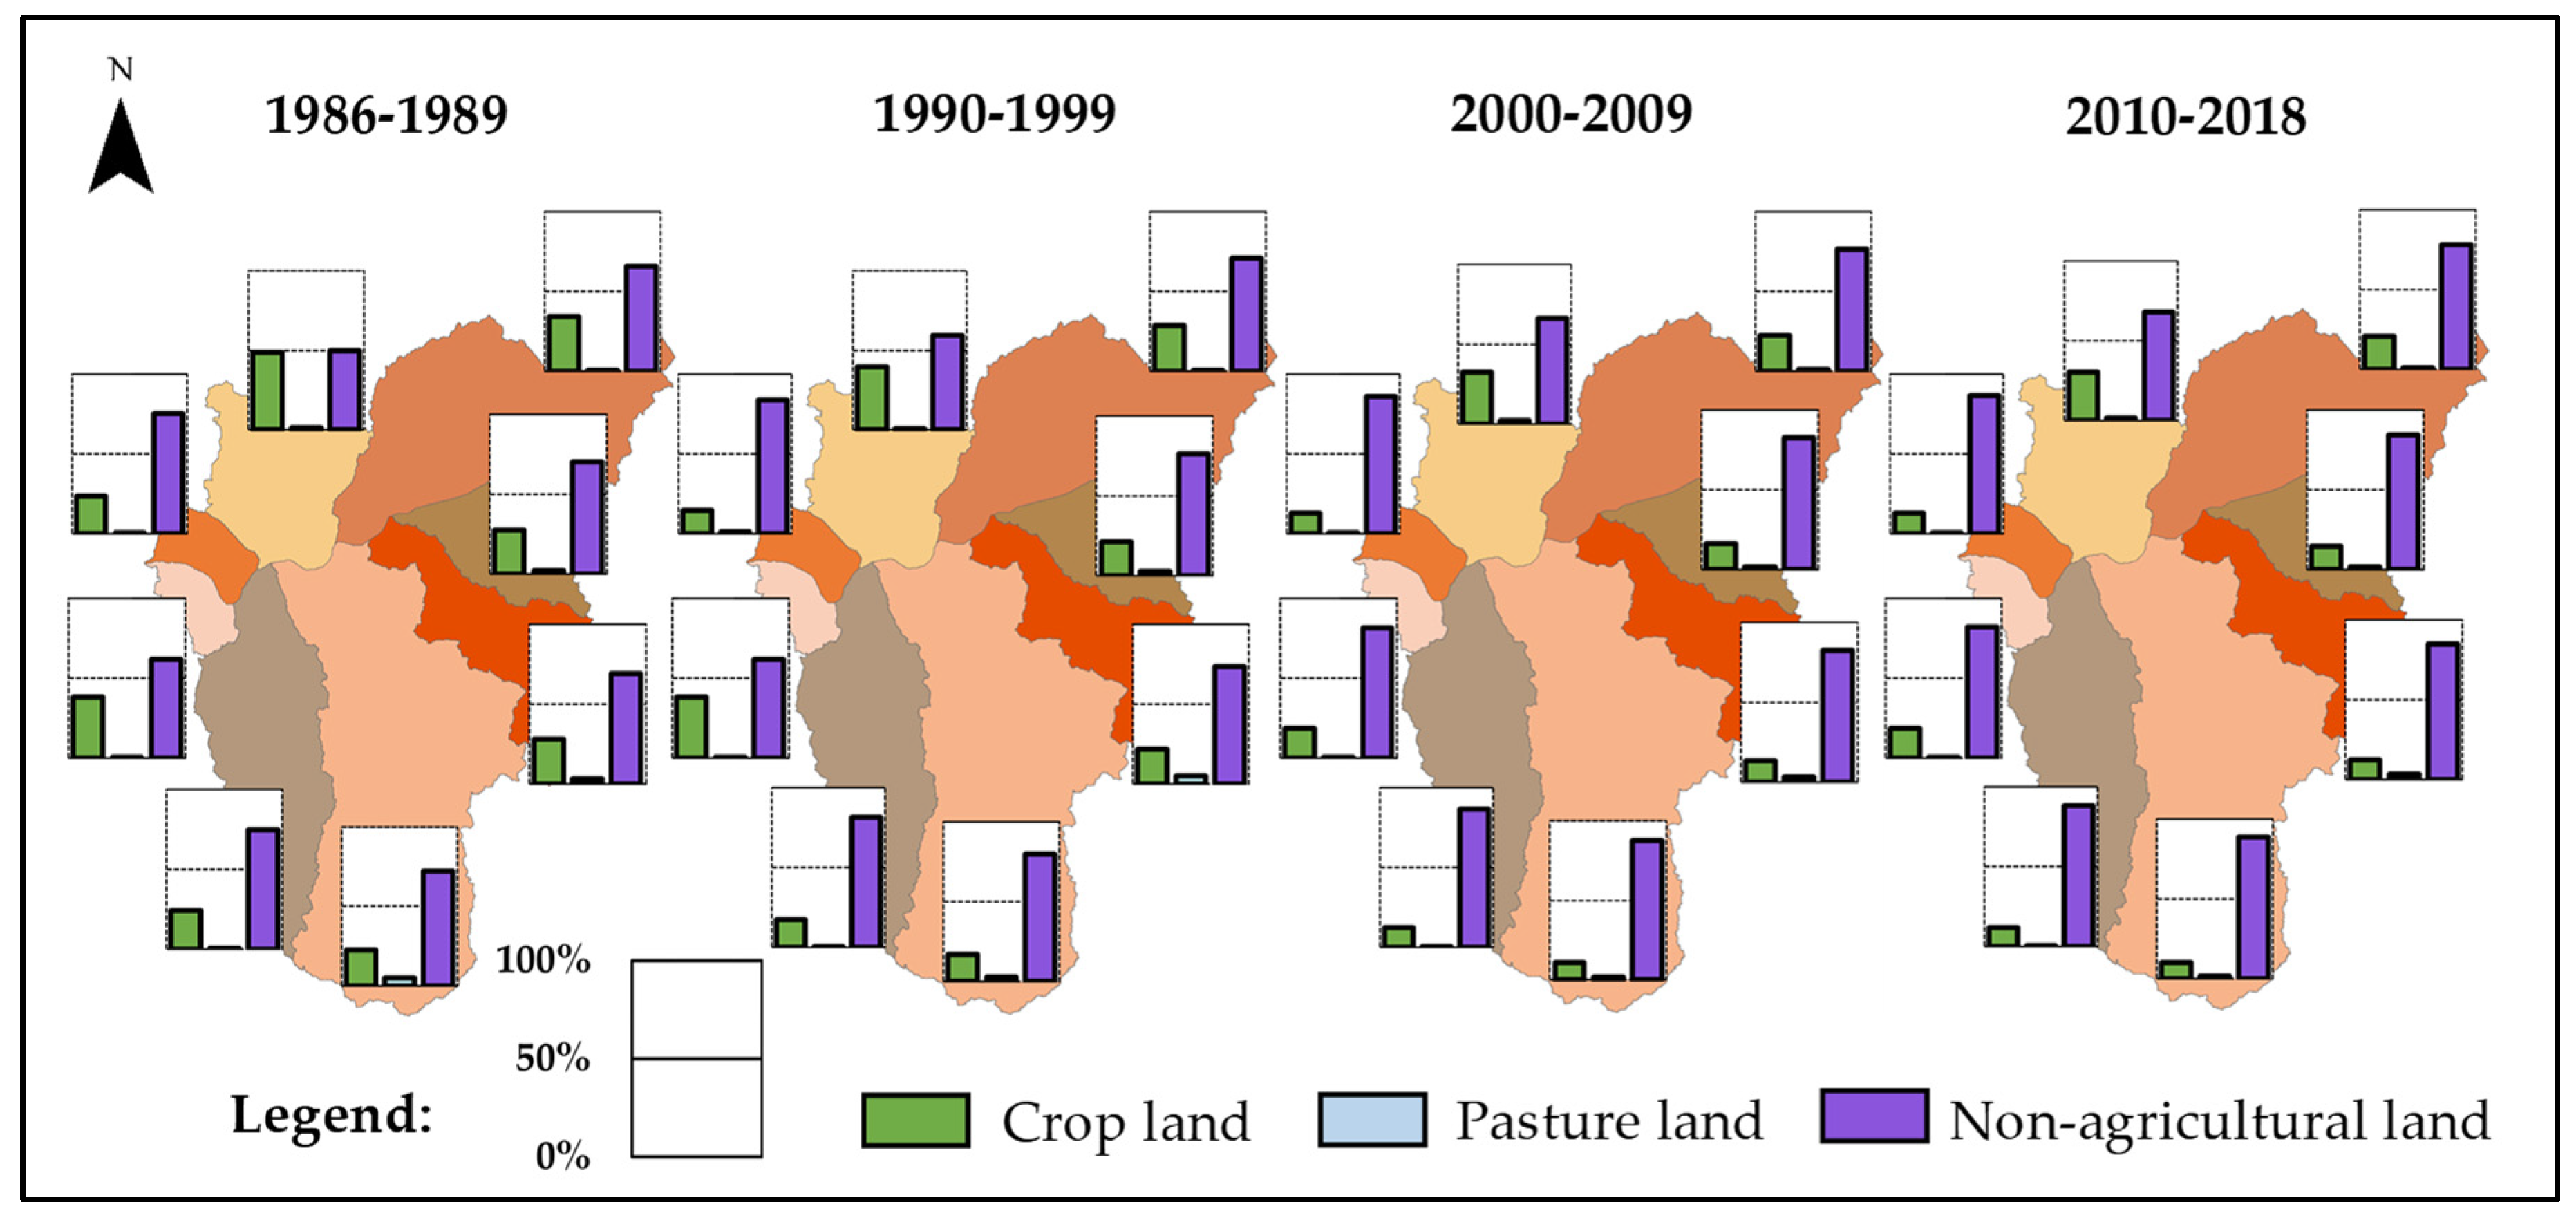
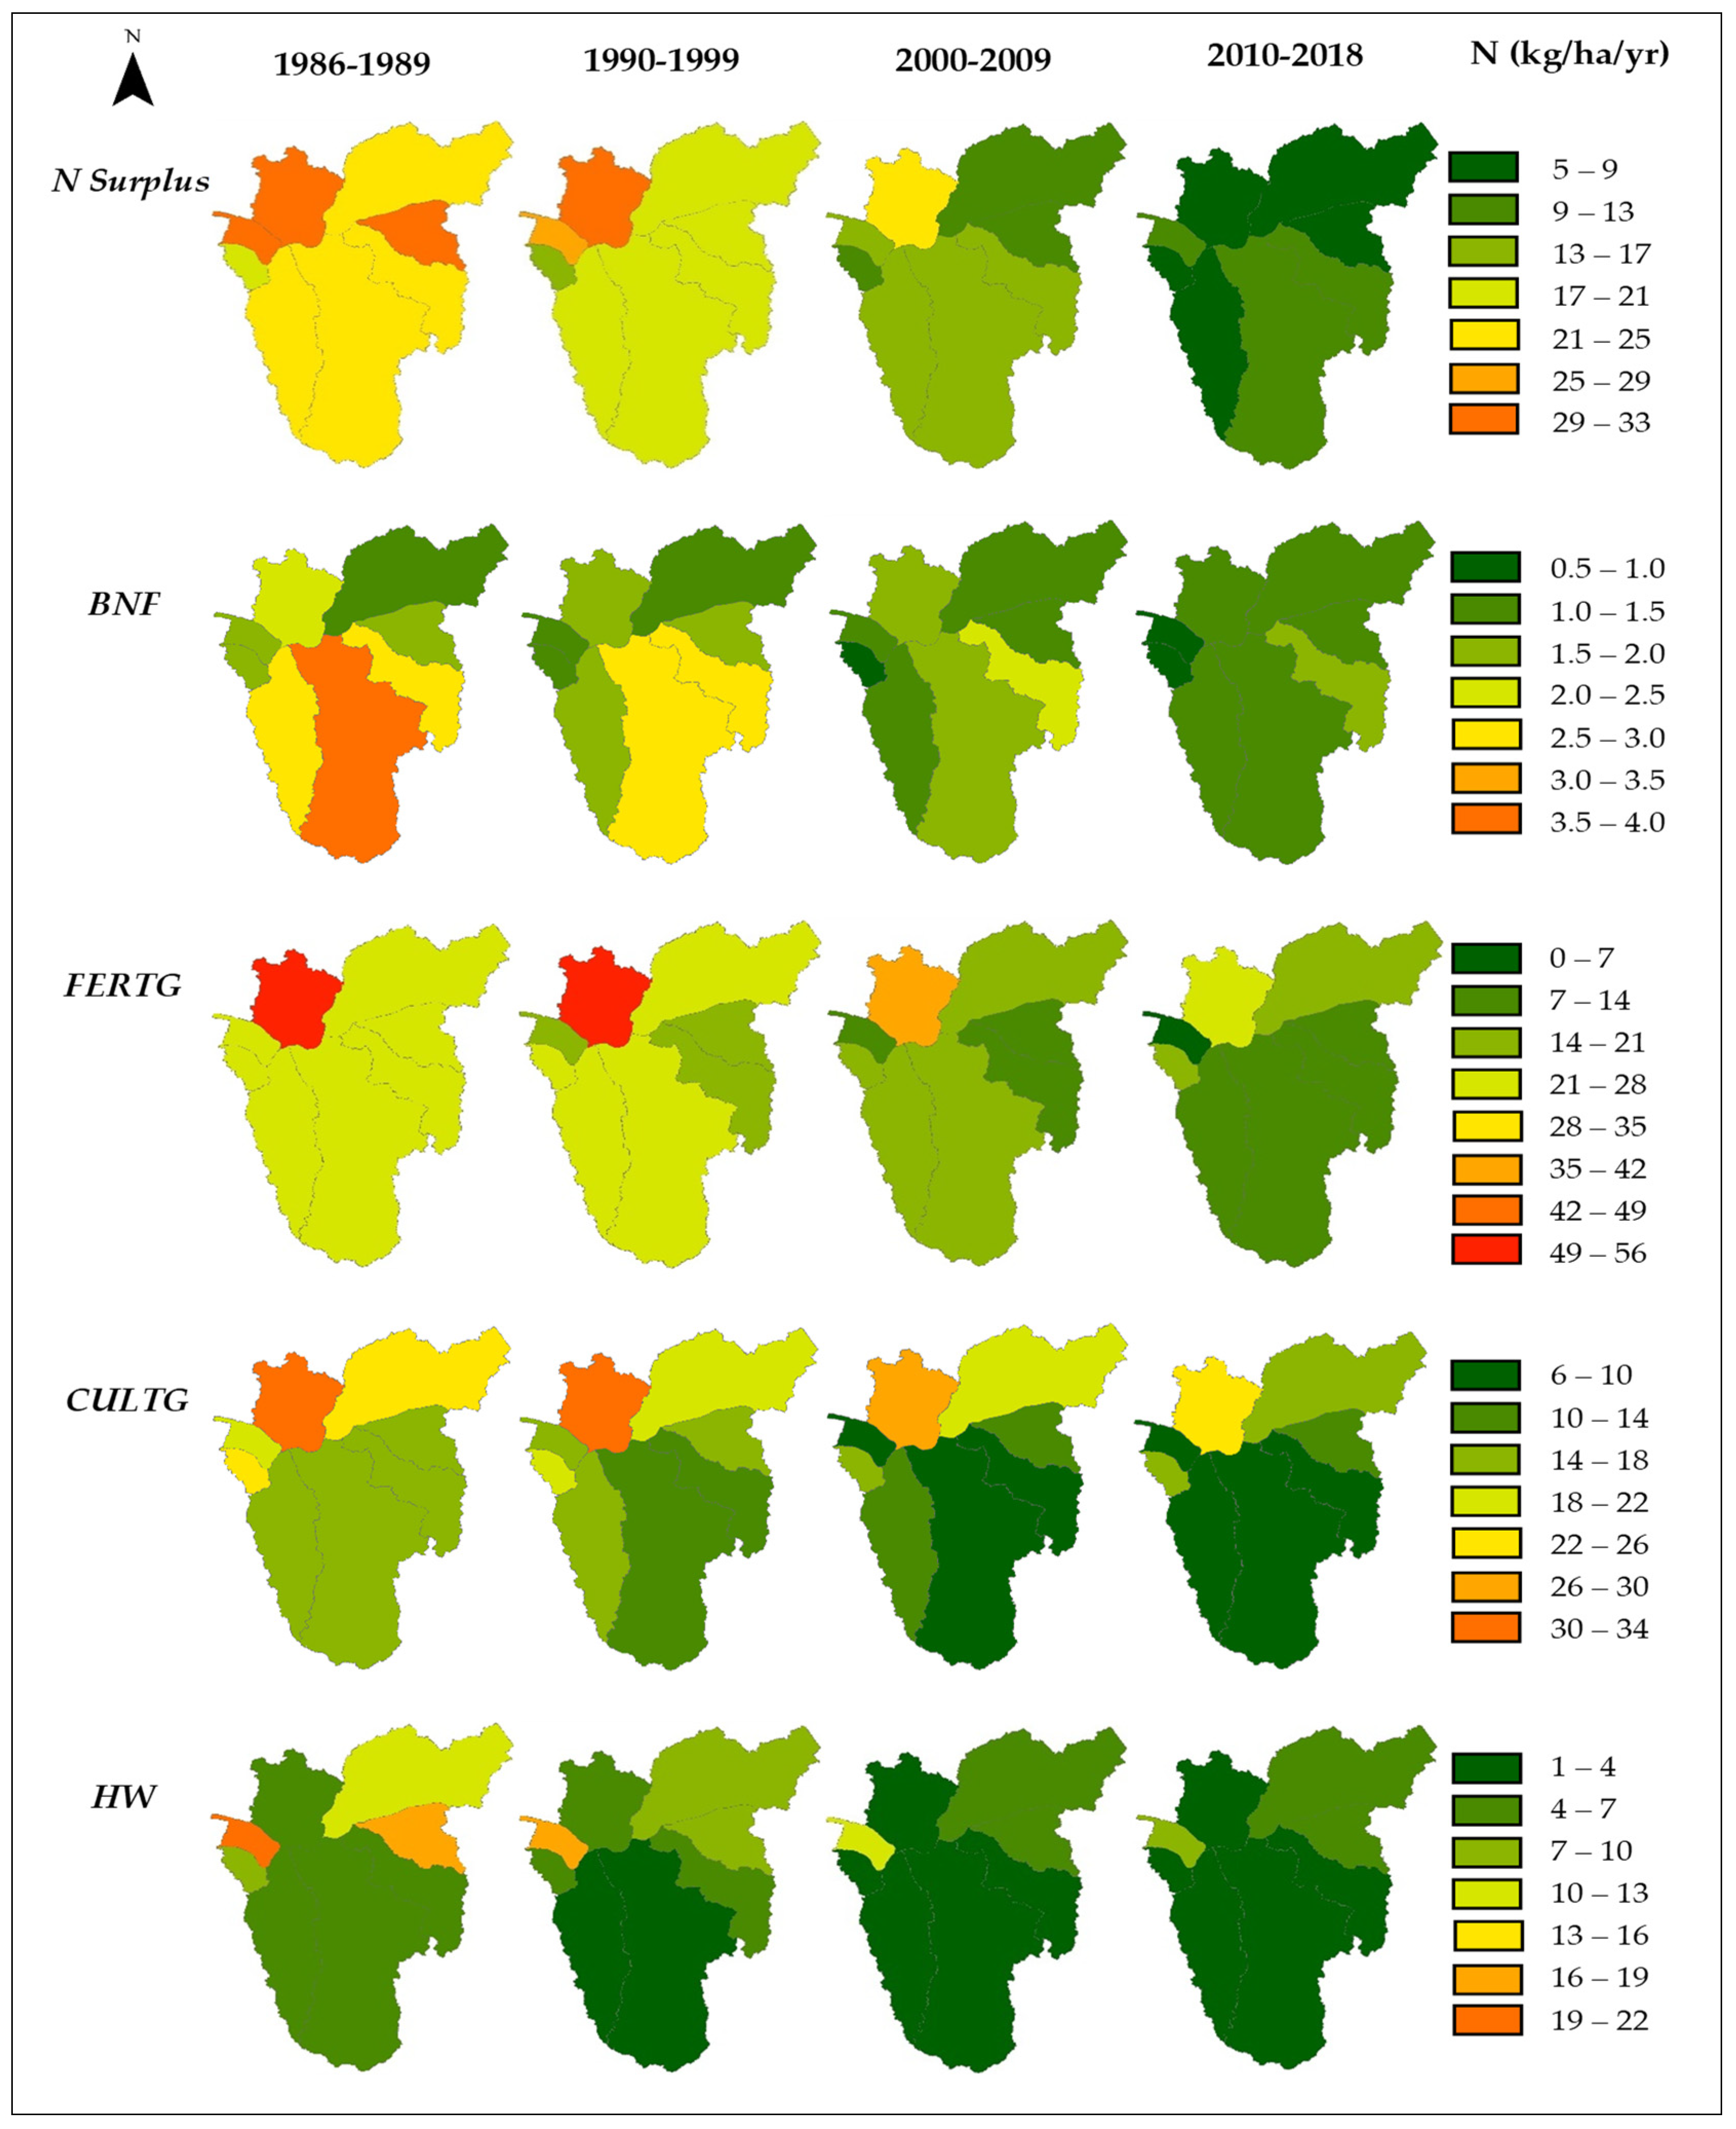
4.2. Spatial and Temporal Variation of Components of N Surplus

Figure 18 shows the N surplus for four time periods (1989, 1999, 2009 and 2018) disaggregated for each sub-basin. These periods represent the mean annual values in kg N per hectare of the periods 1986–1989, 1990–1999, 2000–2009 and 2010–2018. To make the explanation of this Figure easier, these time periods will be designated by the last year of the period (for instance, the period 1986–1989 is simply designated as 1989). The reduction in the surplus in all sub-basins since 1989 is clear. The highest reduction occurs in the Foja sub-basin as there was a conjuncture of many factors, including a decrease in cropland and a decrease in livestock, mainly cattle, that drastically reduce the N surplus in this sub-basin. In 2018, it is estimated that all the sub-basins show low values of N surplus between 5 and 13 kg N per hectare.
Figure 18 shows the contribution of different mass balance components used to compute the N surplus for each of the same previously defined time periods (1989, 1999, 2009 and 2018) desegregated for each sub-basin. The biological N fixation for the whole Low Mondego fell from 2.6 kg N/ha/yr in 1989 to less than half that figure in 2018 (1.2 kg N/ha/yr) associated with the decrease in leguminous crops and pasture areas with capacity for N fixation.
SB6 (Arunca) is the one with highest N fixation of 3.55 kg N/ha/yr in the 1989 period due to the larger pasture and leguminous areas (Figure 9 and Figure 10), but it falls to values of 1.23 kg N/ha/yr in 2018.
Total fertilization throughout all the Low Mondego basin decreases from the first period of 1989, mainly associated with the decrease in the cropland area but also with a reduction in livestock (Figure 12), mainly cattle, pigs, goat, equine, and rabbits. Poultry has increased in number but the individual contribution of this species to manure N inputs is much lower than other species such as cattle. This decline in the number of livestock is also a consequence of the decrease in the agricultural sector in this area and follows an opposite direction of the Portuguese numbers for some species, such as an increase of 9% for cattle and 11% for pigs between 2005 and 2016 [18].
Foja (SB2) is the sub-basin with the highest application of fertilizers. Even though fertilization decreases from 50.22 kg N/ha/yr in 1989 to 26.79 kg N/ha/yr in the 2018 period, associated with the reduction in the crop areas by 37% and with the % livestock decrease between 1989 and 2018 (Figure 12) affecting mainly cattle.
The sub-basins with the majority of the irrigation blocks already built (SB2 and SB3) are those with the highest N outputs between 31.34 kg N/ha/yr of SB2 in 1989 and 16.25 kg N/ha/yr of SB3 in 2018 of incorporated N in cultures and pastures. These figures compared with SB6 and SB7, those with the lowest contributions with values of 15.08 kg N/ha/yr in SB6 in 1989 to 5.7 kg N/ha/yr in SB7 in 2018 show the importance of blocks already improved (in fact, these last are SBs where the improvement in the agriculture conditions had not yet taken place).
The improvement in farming conditions in the areas presented in Figure 2b prevent a too-significant abandonment of agriculture activities compared with other areas that are still to be improved. The Ançã blocks (SB3) are practically all equipped, and between 1989 and 2018 there was a reduction of 26% in the N outputs from crops and pastures (from 22.1 to 16.3 kg N/ha/yr), which can be compared with a reduction of 54% in the Arunca (SB6) (from 15.1 to 6.9 kg N/ha/yr), where the agricultural block is still waiting for the investments for its improvement.
The effect of the improvement in agricultural conditions had a strong impact. In SB3 (Ançã region), practically all the blocks were improved, most of them during the nineties. In this sub-basin, maize culture is one of the most important. In the 1989 period, there were 2.9 × 10³ ha of this crop and with the improved agricultural conditions it increases to 3.3 × 10³ ha in 1999. Then it falls to 3.1 × 10³ ha in 2009 and to 2.7 × 10³ ha in 2018 (this area is practically all included in the agricultural blocks). In fact, the cropland is reduced in other parts of this sub-basin; the cultivated areas did not decrease in the blocks. Compared with SB6 (Arunca) where no improvement has been made up to now, the maize area was 3.2 × 10³ ha in 1989 and then reduces to 2.9 × 10³ ha in 1999, to 2.1 × 10³ ha in 2009, and 1.5 × 10³ ha in 2018. This amounts to a reduction of 54% of the maize area as the conditions for growing this type of crop and enjoying some profit are not fulfilled and farmers abandon part of the land.
In terms of rice, the Low Mondego has a very long tradition in this crop. It was the Arabs who brought rice cultivation to Iberian lands in the sixth century and D. Dinis, King of Portugal (1279–1325), was largely responsible for the increase in this culture in several river basins across the country [50]. Nowadays, rice culture is very important to a large number of farmers, and besides the economic value, there are traditional, social, and gastronomic activity values connected to this culture [51]. These added benefits could justify the small decrease in areas under rice cultivation in the Low Mondego region. Practically all the area under this culture is concentrated in the agricultural blocks (Figure 15) and the agricultural land improvements established in some of these blocks also contribute to the increase in productivity, which grew from 3.5 tons of rice per hectare in 1989 to 4.5 tons in 2018 [27].
Relative to the N outputs, represented by CULTG included 72% of CULT with the remaining 28% of PAST in the 1989 period, which changes to 78% of CULT and 22% of PAST in 2018. Both pastureland and cultivated areas diminish between these periods, and the increase in the relative importance of the CULT N output is related to improved crop yield in the blocks of the Low Mondego region. Finally, relative to human inputs (Figure 18), the variation in time shows that there was also a decrease in N inputs related to the expansion of wastewater treatment facilities across all these sub-basins.

4.3. ANOVA Results

Three variables, nitrogen surplus (N Surplus), organic and inorganic fertilizers (FERTG) and removal of nitrogen by the crop productions and by the grass consumption (CULTG) were further evaluated using the analysis of variance (ANOVA) complemented with Tukey tests. For each variable, the information over the periods of evaluation, from 1986 to 2018 (see Section 3.2), in all sub-basins (Figure 2) was tested (using the tool available at: https://astatsa.com/OneWay_Anova_with_TukeyHSD/). This tool computes the ANOVA according to the Microsoft Excel feature. Then the Tukey Honestly Significant Difference (HSD) is performed according to the procedure explained in the NIST Engineering Statistics Handbook [52].
From the statistical analysis of ANOVA for the N Surplus, the p-value (0.068) is higher than 0.05 (this means a confident level of 95%) suggesting that behavior of the sub-basins does not significantly differ from one to another, for that level of significance (See Tables S3–S5 in the Supplementary Materials). Based on this result, it is not necessary to evaluate the Tukey contrasts.
The statistical analysis of ANOVA for the FERTG component takes a p-value of 9.040 × 10⁻¹⁴ (lower than 0.05), suggesting that one or more sub-basins are significantly different from each other in terms of fertilization uses. Based on this result, Tukey contrast tests are computed to identify the pairs of sub-basins that are significantly different (see Tables S6 to S8 in the Supplementary Materials). The same occurs in the statistical analysis of ANOVA, which arrives at a p-value of 1.110 × 10⁻¹⁶ (lower than 0.05) for the CULTG component, suggesting also that one or more sub-basins are significantly different (see Tables S9–S11 in the Supplementary Materials). Based on these results, the Tukey contrasts are computed to identify the pairs of sub-basins that are significantly different for these two tests of FERTG and CULTG components. This is performed by applying the Tukey HSD test to each of the 28 possible pairs of sub-basins and the results are presented in Table 3.
From the results, ANOVA suggests that there are significantly different sub-basins in terms of the variation of the FERTG component of the N surplus. The Tukey results identify the SB2 as the one that is significantly different from the others (this is given by the p-value that is lower than 0.05 for these pairs and that are highlighted in Table 3). In fact, in SB2 there was a large number of cattle (giving rise to more organic fertilizer) in the 1980s that enlarged the FERTG component in the first periods under analysis, but the number of head of cattle has been declining, which led to a more pronounced decrease in FERTG in SB2 relative to the other sub-basins. This is why SB2 exhibits statistical differences from the others and that are highlighted through the Tukey contrast in Table 3.
The application of the Tukey contrasts to the ANOVA statistics of the CULTG component identifies pairs of statistically different sub-basins that include a p value lower than 0.05 (bold in Table 3). The SB1 is significantly different from SB2, SB3 and SB4. This difference is associated with the interventions to improve the land conditions in the agricultural blocks. In fact, in SB1 there were no improvements in agricultural conditions, and this contrasts with SB2, SB3 and SB4, with the highest areas of blocks that have been improved since 1990. The effects on the CULTG of interventions in the agricultural blocks are mainly associated with improvements in terms of land use for agriculture and with increased productivity. This means that the sub-basins that experienced improved land conditions show significantly different statistics on the variation of the CULTG from those where no intervention has occurred. This is also the case of SB3, which is statistically different from SB5, SB6, SB7 and SB8, and the case of SB4 that differs from SB5, SB6, SB7 and SB8. The sub-basins SB5, SB6, SB7 are still awaiting improvement today, and SB8, an area of 571 ha was improved, but this was only concluded at the end of 2015 and did not have a significant impact on the analysis performed in this work (until 2018). Added to these issues, SB2 is also significantly different from all the other sub-basins. SB2 has experienced a slight fall in terms of CULTG compared with the other sub-basins since the majority of the agricultural blocks have already been improved and this has had an impact on the increase in productivity and land use.

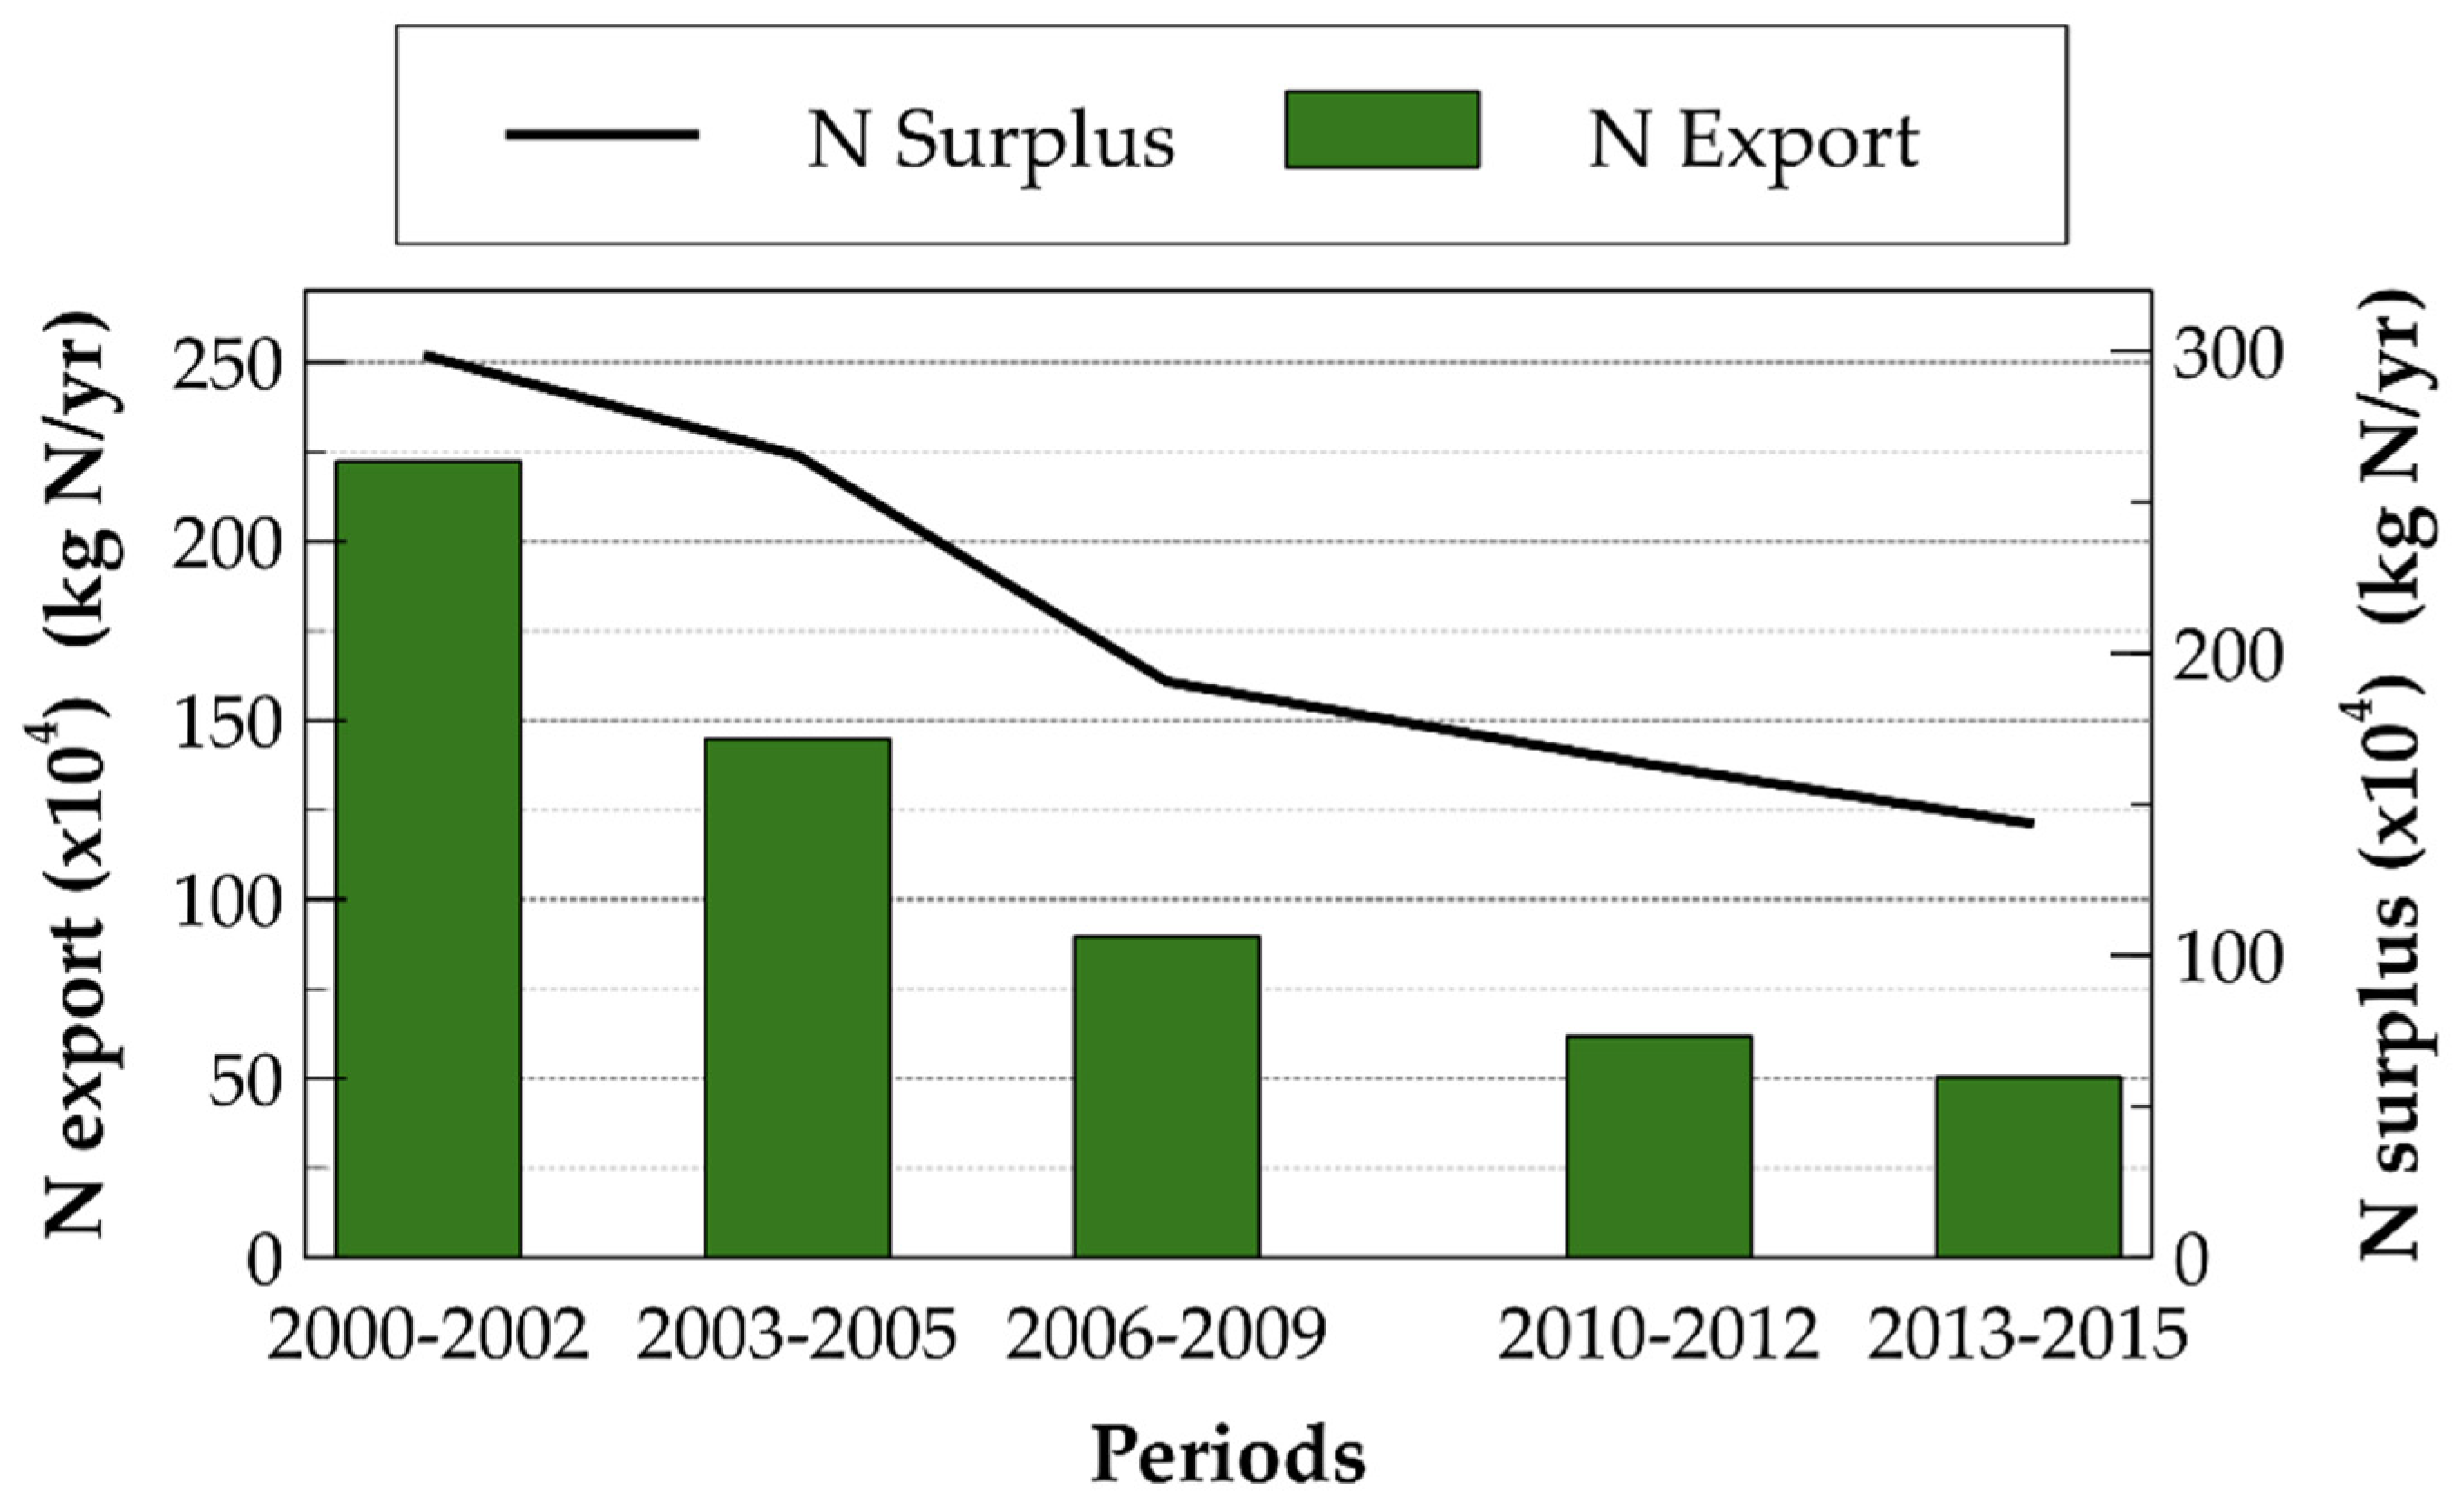
4.4. Comparison of the Evolution of the N Surplus with the N Export

Regarding the total N surplus value produced in the Low Mondego area, a portion flows into the river and another portion is retained in the basin. The part that enters the river is exported from the basin and is called an N export. The N export can be estimated by the concentration of N in the surface water of the river, leaving out the upper Mondego region contribution. Figure 19 compares the trajectory of the total N surplus in the Low Mondego area with the N that is exported by the river.
The periods of years represented in Figure 19 are those for which a water quality analysis from the Portuguese environmental agency is available (https://sniamb.apambiente.pt/). This allows estimation of the riverine N exports, and therefore these are the ones that are compared. The reduction in the N export follows the reduction in N surplus. Comparing the values of the N that is exported by the river with those estimated from N surplus, a mean percentage of 50% of the N surplus is exported by the rivers. A similar value of 45% was estimated by [53] for the high part of the Mondego river watershed.

4.5. Characterization of Active Residents in the Study Area

The characterization of active residents (Table 4) in the Low Mondego will give insights to understand the results already presented and the present situation in the Low Mondego area.
The data for years 2001 and 2011 were obtained directly from the INE Population Census at a parish level [27]. For the years 1991 and 1981, the data were also obtained from the INE Population Census of 1991 and 1981, respectively, but at a sub-region level (NUTS-III) for 1991 and at a district level for 1981, and thus the values were estimated at parish level so that the number of individuals for the area under study was obtained.
The variation in the number of residents in the Low Mondego region is low during this period (Table 2), but the total number of employed active residents has increased from 95,240 in 1981 to 121,477 in 2011 (28% increase). This is related to the socio-economic changes that occurred in Portugal since the seventies [54]. First, after the independence of the African Portuguese speaking countries, the military forces deployed there came back to Portugal, and simultaneously we find women becoming integrated in the workspace. New opportunities of work emerged afterwards (1986) when Portugal became a member of the EEC (European Economic Community).
The table also shows a significant reduction in workers engaged in the primary sector, from 20% of the employed population in 1981 to 2% in 2011. The secondary sector also lost importance during this period as almost half the labor force was lost (from 41% to 26%). On the other hand, the tertiary sector increased substantially from 40% in 1981 to 71% by 2011.
According to [54], the decrease in population dedicated to the primary sector, in terms of residents engaged in the activity, is related to the economic development of the region. Aspects that contributed to explain the reduction can be: the fact that agriculture has started to be carried out using more advanced techniques (thus needing less labor force); the expected improvement of all arable areas has not occurred; the growth of geographical mobility and the job opportunities emerging in other sectors encouraged workers who were born in agricultural areas to take better paid and more stable employment in the urban space. Nunes [55] argue that after the abandonment of the cropland, begins a process of plant colonization that after some time converges to spontaneous reforestation.
Related to mobility within the Low Mondego area, based on the INE Population Census in 2001, at a municipality level, Table 5 includes a symmetric matrix origin–destination with indicators of commuting active residents that corroborate the previous comments of [54].
From the above table, we conclude that the most urbanized municipality in the Low Mondego (Coimbra) is the one with the highest number of movements. In fact, many people from neighboring municipalities travel to work in Coimbra. Most of these employees are working in the tertiary sector.

5. Conclusions

During the past few decades, the Low Mondego basin underwent major modification, due to human interventions, to prevent floods and to improve the agricultural conditions (new irrigation and drainage system, mechanized and intensified cropping by increasing the cultivated areas through land consolidation programs; access to the land plots by new roads). The Project for Agricultural Development in the Lower Mondego River Valley [36] was designed to be implemented on 12,200 ha of land with very high agricultural potential. The priority was to transform small farms (many of them just subsistence farms) into modern, technology-based productive agricultural areas. However, only some blocks were developed, and this happened very slowly (the last one in 2015). In fact, only a little more than half of this area, 6706 ha, was improved, and this was one of the reasons for the abandonment of some promising agricultural areas.
This work has been developed to contribute to understanding the different impacts of the interventions in the Low Mondego region and the particular socio-economic situation that have arisen since the approval of the development plan for the Mondego river basin [1], and later the Project for implementing the actions foreseen [36], until the current situation.
A framework has been developed to compute the N surplus in this region over a period of time, from the point when the agricultural improvements started until 2018, and to realize how these interventions influenced the variation of the N anthropogenic sources and their impacts.
The temporal and spatial variation, in terms of different sub-basins of the Low Mondego tributaries, were calculated following a methodology that enables the evaluation of the N surplus for different types of land use and considering different N inputs and outputs of the mass balance between 1986 and 2018, for ten intermediate periods. The results show that the N surplus is decreasing from the eighties across all sub-basins of the Low Mondego. The N surplus values were also compared with the N that is exported into the river streamflow. It is concluded that the tendency of the N surplus reduction is accompanied by a reduction in the N that is exported by the Mondego river and that a mean percentage of 50% of the N surplus is exported by the river. The fertilization inputs represent the major contributors and are, on average, 62% of the total N input.
The decrease in N surplus is in part due to farming practices, but mainly it is related to a considerable abandonment of agriculture activities. The areas that suffered most from abandonment were those where the planned interventions did not take place. The lack of infrastructure such as irrigation and drainage, the small areas and high dispersion of parcels combined with other problems such as the low financial income from crops has led to the abandonment of agriculture in part of the Arunca tributary sub-basin, despite it having high potential for agriculture. Even though only some of the agricultural conditions of the planned blocks have been improved, these have helped to increase the crop yield in the Low Mondego that is expressed as a lower decline of the N outputs from cultures than the reduction in the cropland use.
It is worth noting that the Portuguese revolution, “the carnation revolution” of 1974, which ended a dictatorship of 48 years, has changed the social structure, and new opportunities for jobs have emerged in the cities of the basin such as Coimbra and Figueira da Foz. The existent farmers grew old and then ceased farming but had no younger successors to replace them, or young and/or newly established farmers soon gave up because the agricultural holdings were not viable. Simultaneously, more attractive jobs in the tertiary sector started to increase considerably. The structure of the residents’ activities has changed, as can be seen in Table 2 and Table 3.
The results obtained from the evaluation of nitrates in the Mondego river estuary (Figueira da Foz) and N surplus show that the full development of 12,200 ha would be sustainable from the environmental perspective and would have resulted in improved social-economic indicators. The expectations created by the different governments were not fulfilled. Policies defined in the early 1960s did not lead to a flourishing agricultural area, because the actions foreseen were postponed.

Supplementary Materials

The following are available online at https://www.mdpi.com/2073-445X/10/2/114/s1, Table S1: Areas of the different crops in the sub-basins of Low Mondego (periods 1989 to 2002), Table S2: Areas of the different crops in the sub-basins of Low Mondego (periods 2005 to 2018). Tables S3–S11: ANOVA intermediate calculations.

Author Contributions

Conceptualization M.C.; definition of framework used, M.C. and J.M.; data curation M.C., J.M., J.A., A.C.; writing original draft, M.C. and J.M.; review and editing, M.C. All authors have read and agreed to the published version of the manuscript.

Funding

Project LEAP (Legacies of Agricultural Pollutants (Leap): Integrated Assessment of Biophysical and Socioeconomic Controls on Water Quality in Agroecosystems; WaterWorks2015 ERA-NET Cofund 2016 Joint Call (Fundação para a Ciência e a Tecnologia, WATERJPI/005/2016; 3599-PPCDT).

Institutional Review Board Statement

Not applicable.

Informed Consent Statement

Not applicable.

Data Availability Statement

The data presented in this study are available in article and supplementary material.

Acknowledgments

The authors acknowledge funding from the WaterJPI—WaterWorks2015 ERA-NET Cofund 2016 Joint Call, Fundação para a Ciência e a Tecnologia, WATERJPI/005/2016; 3599-PPCDT. We express our gratitude to the Administração da Região Hidrográfica do Centro and Direção Geral de Agricultura e Desenvolvimento Rural for providing us with some of the data used in the paper, as well as for insightful discussions.

Conflicts of Interest

The authors declare no conflict of interest.

References

  1. DGSH (Direcção-Geral dos Serviços Hidráulicos). Aproveitamento Hidráulico da Bacia do Mondego: Plano Geral; Direcção Geral dos Serviços Hidráulicos, Ministério das Obras Públicas: Lisbon, Portugal, 1962; p. 142. (In Portuguese) [Google Scholar]
  2. Han, Y.; Feng, G.; Swaney, D.P.; Dentener, F.; Koeble, R.; Ouyang, Y.; Gao, W. Global and regional estimation of net anthropogenic nitrogen inputs (NANI). Geoderma 2020, 361, 114066. [Google Scholar] [CrossRef]
  3. Zhang, X. Spatio-Temporal Patterns in Net Anthropogenic Nitrogen and Phosphorus Inputs across the Grand River Watershed. Master’s Thesis, University of Waterloo, Waterloo, ON, Canada, 2016. [Google Scholar]
  4. Midolo, G.; Alkemade, R.; Schipper, A.M.; Benítez-López, A.; Perring, M.P.; De Vries, W. Impacts of nitrogen addition on plant species richness and abundance: A global meta-analysis. Glob. Ecol. Biogeogr. 2019, 28, 398–413. [Google Scholar] [CrossRef] [Green Version]
  5. Smith, R.A.; Schwarz, G.E.; Alexander, R.B. Regional interpretation of water-quality monitoring data. Water Resour. Res. 1997, 33, 2781–2798. [Google Scholar] [CrossRef] [Green Version]
  6. Douglas-Mankin, K.R.; Srinivasan, R.; Arnold, J.G. Soil and Water Assessment Tool (SWAT) Model: Current developments and applications. Trans. ASABE 2010, 53, 1423–1431. [Google Scholar] [CrossRef]
  7. Seitzinger, S.P.; Harrison, J.A.; Dumont, E.; Beusen, A.H.W.; Bouwman, A.F. Sources and delivery of carbon, nitrogen, and phosphorus to the coastal zone: An overview of Global Nutrient Export from Watersheds (NEWS) models and their application. Glob. Biogeochem. Cycles 2005, 19. [Google Scholar] [CrossRef]
  8. Howarth, R.W.; Billen, G.; Swaney, D.; Townsend, A.; Jaworski, N.; Lajtha, K.; Zhu, Z.L. Regional nitrogen budgets and riverine N & P fluxes for the drainages to the North Atlantic Ocean: Natural and human influences. Biogeochemistry 1996, 35, 75–139. [Google Scholar]
  9. Hong, B.; Swaney, D.P.; Mörth, C.-M.; Smedberg, E.; Eriksson Hägg, H.; Humborg, C.; Bouraoui, F. Evaluating regional variation of net anthropogenic nitrogen and phosphorus inputs (NANI/NAPI), major drivers, nutrient retention pattern and management implications in the multinational areas of Baltic Sea basin. Ecol. Model. 2012, 227, 117–135. [Google Scholar] [CrossRef]
  10. Lassaletta, L.; Romero, E.; Billen, G.; Garnier, J.; García-Gómez, H.; Rovira, J.V. Spatialized N budgets in a large agricultural Mediterranean watershed: High loading and low transfer. Biogeosciences 2012, 9, 57–70. [Google Scholar] [CrossRef] [Green Version]
  11. Hong, B.; Swaney, D.P.; Howarth, R.W. Estimating net anthropogenic nitrogen inputs to U.S. watersheds: Comparison of methodologies. Environ. Sci. Technol. 2013, 47, 5199–5207. [Google Scholar] [CrossRef]
  12. Zhou, M.; Brandt, P.; Pelster, D.; Rufino, M.C.; Robinson, T.; Butterbach-Bahl, K. Regional nitrogen budget of the Lake Victoria Basin, East Africa: Syntheses, uncertainties and perspectives. Environ. Res. Lett. 2014, 9, 105009. [Google Scholar] [CrossRef]
  13. Cui, X.; Huang, C.; Wu, J.; Liu, X.; Hong, Y. Temporal and spatial variations of net anthropogenic nitrogen inputs (NANI) in the Pearl River Basin of China from 1986 to 2015. PLoS ONE 2020, 15, e0228683. [Google Scholar] [CrossRef] [PubMed] [Green Version]
  14. Van Meter, K.J.; Basu, N.B.; Van Cappellen, P. Two centuries of nitrogen dynamics: Legacy sources and sinks in the Mississippi and Susquehanna River Basins. Glob. Biogeochem. Cycles 2017, 31, 2–23. [Google Scholar] [CrossRef] [Green Version]
  15. Carmo, M.; García-Ruiz, R.; Ferreira, M.I.; Domingos, T. The N-P-K soil nutrient balance of Portuguese cropland in the 1950s: The transition from organic to chemical fertilization. Sci. Rep. 2017, 7, 1–14. [Google Scholar] [CrossRef] [Green Version]
  16. Cruz, S.; Cordovil, C.M.S.; Pinto, R.; Brito, A.G.; Cameira, M.R.; Gonçalves, G.; May, L. Nitrogen in Water-Portugal and Denmark: Two contrasting realities. Water 2019, 11, 1114. [Google Scholar] [CrossRef] [Green Version]
  17. European Environment Agency (EEA). DPSIR Framework (Driving Forces, Pressure, State, Impact, Response). 2018. Available online: https://www.eea.europa.eu/publications/TEC25 (accessed on 3 December 2020).
  18. Cameira, M.R.; Rolim, J.; Valente, F.; Faro, A.; Dragosits, U.; Cordovil Marques dos Santos, C. Spatial distribution and uncertainties of nitrogen budgets for agriculture in the Tagus river basin in Portugal–Implications for effectiveness of mitigation measures. Land Use Policy 2019, 84, 278–293. [Google Scholar] [CrossRef]
  19. Oenema, O.; Kros, H.; De Vries, W. Approaches and uncertainties in nutrient budgets: Implications for nutrient management and environmental policies. Eur. J. Agronom. 2003, 20, 3–16. [Google Scholar] [CrossRef]
  20. Eurostat. Agriculture, Forestry and Fishery Statistics. Nutrient Budgets Methodology and Handbook; Eurostat/OECD 2013; European Union: Brussels, Belgium, 2016. [Google Scholar]
  21. Swaney, D.P.; Hong, B.; Paneer Selvam, A.; Howarth, R.W.; Ramesh, R.; Purvaja, R. Net anthropogenic nitrogen inputs and nitrogen fluxes from Indian watersheds: An initial assessment. J. Mar. Syst. 2015, 141, 45–58. [Google Scholar] [CrossRef]
  22. Howarth, R.; Swaney, D.; Billen, G.; Garnier, J.; Hong, B.; Humborg, C.; Marino, R. Nitrogen fluxes from the landscape are controlled by net anthropogenic nitrogen inputs and by climate. Front. Ecol. Environ. 2012, 10, 37–43. [Google Scholar] [CrossRef] [Green Version]
  23. WFD. Directive 2000/60/EC of the European Parliament and of the Council Establishing a Framework for the Community Action in the Field of Water Policy; OJ L327, 22.12.2000; European Parliament: Brussels, Belgium, 2020. [Google Scholar]
  24. CBPA, Código de Boas Práticas Agrícolas. Despacho No. 1230/2018 de 5 de Fevereiro de 2018; Ministérios do Ambiente e Agricultura, Florestas e Desenvolvimento Rural: Lisbon, Portugal, 2018. (In Portuguese) [Google Scholar]
  25. Bouwman, A.F.; Van Brecht, G.; Van Der Hoek, K.W. Global and regional surface nitrogen balances in intensive agricultural production systems for the period 1970–2030. Pedosphere 2005, 15, 137–155. [Google Scholar]
  26. Hong, B.; Swaney, D.P.; Howarth, R.W. A toolbox for calculating net anthropogenic nitrogen inputs (NANI). Environ. Model. Softw. 2011, 26, 623–633. [Google Scholar] [CrossRef]
  27. INE, Instituto Nacional de Estatistica. Available online: https://www.ine.pt (accessed on 3 December 2020).
  28. DGT, Direção-Geral do Territorio. Carta Administrativa Oficial de Portugal (CAOP). Available online: http://www.dgterritorio.pt (accessed on 3 December 2020).
  29. SNIAmb, Agência Portuguesa do Ambiente. Bacias dos Troços de Linha de Água GeoCodificadas. Available online: https://sniamb.apambiente.pt/ (accessed on 3 December 2020).
  30. Corine Land Cover (CLC), European Union, Copernicus Land Monitoring Service (2018), European Environment Agency (EEA) (2018). Available online: https://land.copernicus.eu/pan-european/corine-land-cover/clc2018 (accessed on 18 January 2021).
  31. DGADR, Direção-Geral de Agricultura e Desenvolvimento Rural. Aproveitamento Hidroagrícola do Baixo Mondego. Available online: http://www.dgadr.gov.pt (accessed on 3 December 2020).
  32. Barbosa, A.E.; Alves, E.; Cortes, R.M.V.; Silva-Santos, P.M.; Aguiar, F.; Ferreira, T. Evaluation of Environmental Impacts Resulting from River Regulation Works: A Case Study from Portugal. In Proceedings of the International Conference on Fluvial Hydraulics-River Flow, Lisbon, Portugal, 6–8 September 2006; Volume 2, pp. 2081–2091. [Google Scholar]
  33. Maia, R. Estudo Estratégico para Intervenções de Reabilitação na Rede Hidrográfica da ARH do Centro Guia de Orientação para a Intervenção em Linhas de Água; ARHC and FEUP Report; ARHC: Coimbra, Portugal, 2013; p. 187. (In Portuguese)
  34. Marques, J.C.; Graça, M.A.; Pardal, M.Â. Introducing the Mondego River Basin. In Aquatic Ecology of the Mondego River Basin Global Importance of Local Experience; Imprensa da Universidade de Coimbra: Coimbra, Portugal, 2002. [Google Scholar]
  35. Almeida, P.R.; Quintella, B. Reabilitação dos Habitats de Peixes Diádromos na Bacia Hidrográfica do Mondego; Promar Report; Promar International: Lisbon, Portugal, 2016; 126p. [Google Scholar]
  36. DGHEA. Projecto de Desenvolvimento Agrícola do Baixo Mondego; Ministério da Agricultura Pescas e Alimentação-Direcção Geral de Hidráulica e Engenharia Agrícola: Lisbon, Portugal, 1983. (In Portuguese) [Google Scholar]
  37. ABOFHBM, Associação de Beneficiários da Obra de Fomento Hidroagrícola do Baixo Mondego. Historial. Available online: http://www.abofhbm.net/historial.htm (accessed on 18 January 2021).
  38. IDRHa (Instituto de Desenvolvimento Rural e Hidraulica). Bloco 10 de Alfarelos no Aproveitamento Hidroagrícola do Baixo Mondego; Ministry of Agriculture: Lisbon, Portugal, 2004.
  39. Santos, J.F.; Freitas, V. Aproveitamento hidroagrícola do baixo Mondego. Actualidade e desafios futuros. In Jornadas Técnicas da APRH; APRH: Lisbon, Portugal, 2011. (In Portuguese) [Google Scholar]
  40. Pereira, P.M. Mapear Paisagens do Baixo Mondego. Ph.D. Thesis, University of Coimbra, Coimbra, Portugal, 2013; p. 146. (In Portuguese). [Google Scholar]
  41. Gonçalves, J.M. Principais aspectos da avaliação de rega por sulcos. In IV Encontro de Regantes do Baixo Mondego; Associações de Regantes e Beneficiários: Coimbra, Portugal, 2011. (In Portuguese) [Google Scholar]
  42. ABOFHBM, Associação de Beneficiários da Obra de Fomento Hidroagrícola do Baixo Mondego. Perímetro de Rega do Baixo Mondego: Evolução da Área Equipada. Available online: http://www.abofhbm.net/caracterizacaoperimetro.htm (accessed on 3 December 2020).
  43. GTAA (Grupo de Trabalho Agro-Ambiental). O Abandono da Actividade Agrícola; Ministério da Agricultura, do Desenvolvimento Rural e das Pescas: Lisbon, Portugal, 2003. (In Portuguese) [Google Scholar]
  44. Boyer, E.W.; Goodale, C.L.; Jaworski, N.A.; Howarth, R.W. Anthropogenic nitrogen sources and relationships to riverine nitrogen export in the northeastern U.S.A. Biogeochemistry 2002, 57–58, 137–169. [Google Scholar] [CrossRef]
  45. Britz, W.; Witzke, P. CAPRI Model Documentation. Available online: http://www.capri-model.org/docs/capri_documentation.pdf (accessed on 3 December 2020).
  46. Büttner, G. CORINE land cover and land cover change products. Remote Sens. Digital Image Process. 2014, 18, 55–74. [Google Scholar]
  47. Lassaletta, L.; Billen, G.; Romero, E.; Garnier, J.; Aguilera, E. How changes in diet and trade patterns have shaped the N cycle at the national scale: Spain (1961–2009). Reg. Environ. Chang. 2014, 14, 785–797. [Google Scholar] [CrossRef]
  48. Pordata, Base de Dados de Portugal Contemporâneo. Available online: https://www.pordata.pt (accessed on 3 December 2020).
  49. SNIAmb, Agência Portuguesa do Ambiente. Inventário Nacional de Sistemas de Abastecimento de Água e de Águas Residuais. Available online: https://sniamb.apambiente.pt/ (accessed on 3 December 2020).
  50. Ferreira, L.M. O Arroz como Potenciador do Ecoturismo no Baixo Mondego. Master’s Thesis, Escola Superior Agrária de Coimbra, Coimbra, Portugal, 2014. (In Portuguese). [Google Scholar]
  51. Vaquinhas, I. Breve Historial Sobre a Cultura do Arroz nos Campos do Mondego; Associação dos Agricultores do Baixo Mondego: Coimbra, Portugal, 2005. (In Portuguese)
  52. NIST/SEMATECH. e-Handbook of Statistical Methods. Available online: http://www.itl.nist.gov/div898/handbook/ (accessed on 30 December 2020).
  53. Romero, E.; Garnier, J.; Billen, G.; Peters, F.; Lassaletta, L. Water management practices exacerbate nitrogen retention in Mediterranean catchments. Sci. Total Environ. 2016, 573, 420–432. [Google Scholar] [CrossRef] [Green Version]
  54. Mateus, M. Campos de Coimbra, Do Rural ao Urbano. Ph.D. Thesis, University of Coimbra, Coimbra, Portugal, 2009. (In Portuguese). [Google Scholar]
  55. Nunes, A. Abandono do Espaço Agrícola na Beira Transmontana. Ph.D. Thesis, University of Coimbra, Coimbra, Portugal, 2007. (In Portuguese). [Google Scholar]
Figure 1. The Mondego river basin (a), High and Low Mondego areas (b), land use and civil parishes in the Low Mondego area (c), Açude-Dam/Bridge (d) [28,29,30].
Land 10 00114 g001
Figure 2. Low Mondego divided into sub-basins (a), blocks of agricultural land in Low Mondego (b), Pranto structure (c) [29,31].
Land 10 00114 g002
Figure 3. Alders (a), ash (b), willows (c) and Tamarix (d) (retrieved from [34]).
Land 10 00114 g003
Figure 4. Allis shad (a), yellowtail (b), European eel (c) and lamprey (d) (model authors: Pedro Andrade, Cláudia Baeta and Lúcia Antunes, retrieved from [35]).
Land 10 00114 g004
Figure 5. Maize (a) and rice (b) crops produced in the Mondego valley.
Land 10 00114 g005
Figure 6. Land plots before (a) and after (b) the land consolidation process (taken from [38]).
Land 10 00114 g006
Figure 7. Plot sizes before (black lines) and after the land consolidation process (extracted from [39]).
Land 10 00114 g007
Figure 8. Main channel in the Low Mondego (photograph taken in the right margin of Mondego river, close to the Foja river outlet).
Land 10 00114 g008
Figure 9. Example of an irrigation system for maize crops (extracted from [41]) (a), watering point (b), drainage of rice crops (c) and rural roads (d).
Land 10 00114 g009
Figure 10. Nodules of N incorporated in broad bean roots (photos taken in April 2020 of broad beans sown in the Low Mondego area): nodules of N in broad bean roots (a) and broad bean leaves (b).
Land 10 00114 g010
Figure 11. Cultivated areas of leguminous crops (a) and pasture areas (b) in Low Mondego.
Land 10 00114 g011
Figure 12. Number of animals in each sub-basin in Low Mondego.
Land 10 00114 g012
Figure 13. Atmospheric N deposition in the Low Mondego.
Land 10 00114 g013
Figure 14. Percentage of land use by crops, pasture and non-agricultural areas.
Land 10 00114 g014
Figure 15. Total areas of maize and rice in the Low Mondego; areas of the blocks still to improve or already improved; improved areas of maize and rice in block parishes.
Land 10 00114 g015
Figure 16. Nitrogen surplus in Low Mondego and the contribution of the different terms.
Land 10 00114 g016
Figure 17. Contribution of the input N terms to the nitrogen surplus in the Low Mondego in periods 1986–1989 and 2016–2018.
Land 10 00114 g017
Figure 18. Nitrogen surplus in the sub-basins and the contributions of BNF, FERTG, CULTG and WH in Low Mondego.
Land 10 00114 g018
Figure 19. Comparison between the N export and the N surplus in the Low Mondego sub-basin in 2002–2015.
Land 10 00114 g019
Table 1. Areas dedicated to different crops in Low Mondego.
CropsCrop Areas (ha)
1986–19891990–19921993–19951996–19992000–20022003–20052006–20092010–20122013–20152016–2018
Maize12,15211,72610,29511,434994582938658807084707953
Rice7258583270305822562257445890611258175876
Vineyards6397634157874490397237072542223022482249
Olive trees3992389636964437414435873270305330513048
Oat2374157995515641266943752569536612
Potatoes2172203816461142804633443295289294
Wheat956853772598470311620444369417
All forage crops16,28115,32111,55710,362968396026513568456315719
All fruit trees903892849557465392235191192193
Other cultures2297208820121037735708880809788822
Table 2. Number of residents in each sub-basin in Low Mondego.
Sub-BasinsNumber of Residents
1986–19891990–19921993–19951996–19992000–20022003–20052006–20092010–20122013–20152016–2018
SB117,41220,43620,71520,94621,17021,32221,49221,59921,24920,847
SB219,83919,68619,66719,64719,60019,36919,06918,76318,46618,153
SB380,17085,85787,68890,02792,07191,71290,94889,98787,75085,602
SB45994582358695941600359895961592358205710
SB521,53421,26121,51321,82822,07821,83521,47621,09720,62720,177
SB651,63648,41249,15350,29451,25850,81150,08249,28048,08246,947
SB716,43416,12816,50817,03317,56818,09918,73019,29219,28219,113
SB829,28030,61931,39532,44133,43633,92134,42834,79034,07733,301
Table 3. Tukey Honestly Significant Difference (HSD) results for FERTG and CULTG components. p-values lower than 0.05 highlighted in bold.
Sub-Basin PairsTukey p-Value for FERTGTukey p-Value for CULTG
SB1 vs. SB20.0010.001
SB1 vs. SB30.3200.010
SB1 vs. SB40.1830.007
SB1 vs. SB50.5780.900
SB1 vs. SB60.7740.874
SB1 vs. SB70.9000.561
SB1 vs. SB80.9000.900
SB2 vs. SB30.0010.001
SB2 vs. SB40.0010.001
SB2 vs. SB50.0010.001
SB2 vs. SB60.0010.001
SB2 vs. SB70.0010.001
SB2 vs. SB80.0010.001
SB3 vs. SB40.9000.900
SB3 vs. SB50.9000.010
SB3 vs. SB60.9000.001
SB3 vs. SB70.7850.001
SB3 vs. SB80.5680.031
SB4 vs. SB50.9000.007
SB4 vs. SB60.9000.001
SB4 vs. SB70.6140.001
SB4 vs. SB80.3900.023
SB5 vs. SB60.9000.868
SB5 vs. SB70.9000.555
SB5 vs. SB80.8180.900
SB6 vs. SB70.9000.900
SB6 vs. SB80.9000.646
SB7 vs. SB80.9000.324
Table 4. Distribution of residents by sector of activity.
Employed Population by Employment Sector
Year PrimarySecondaryTertiaryTotal
1981Percentage by sector (%)20%40%40%100%
Number18,98838,62237,63095,240
1991Percentage by sector (%)11%34%55%100%
Number11,15534,67756,181102,013
2001Percentage by sector (%)4%32%64%100%
Number423436,01572,433112,683
2011Percentage by sector (%)2%26%71%100%
Number288032,16486,433121,477
Table 5. Number of movements of active residents.
Number of
Movements
CantanhedeCoimbraCondeixa-a-NovaFigueira da FozMontemor-o-VelhoPenacovaSoure
Cantanhede02998053989600
Coimbra2998038652299333729822093
Condeixa-a-Nova038650000479
Figueira da Foz53922990014710546
Montemor-o-Velho89633370147100504
Penacova0298200000
Soure0209347954650400
Publisher’s Note: MDPI stays neutral with regard to jurisdictional claims in published maps and institutional affiliations.

