Abstract
Changes in land use and land cover (LULC) are the leading contributors to the decline and loss of ecosystem services in the world. The present study covered the Central Rift Valley lakes basin in Ethiopia, focusing on the valley floor and the East and West escarpments, to analyze changes in LULC and to estimate associated losses in ecosystem service values (ESVs). Covering both upstream and downstream areas in the basin, the study addressed major gaps in existing studies by connecting the sources and sinks of material (e.g., sediment and water) in source-to-lake systems. Additionally, the study facilitated the identification of critical areas for conserving natural resources and reversing the decline of associated ESVs in the Central Rift Valley. A post-classification comparison approach was used to detect LULC changes between 1973 and 2020 using four Landsat images from 1973, 1990, 2005 and 2020. The value transfer valuation method was used to estimate the changes in ESVs due to LULC changes. Among the seven major identified LULC classes, farmlands, settlements, and bare lands showed positive changes, while forestlands, grasslands, shrublands and waterbodies showed negative changes over the last 47 years. The expansion of farmlands, for example, has occurred at the expense of grasslands, forestlands and shrublands. The changes in LULC over a period of 47 years resulted in a total loss of US $62,110.4 × 106 in ESVs. The contributors to the overall loss of ESVs in decreasing order are provisioning services (US $33,795.1 × 106), cultural services (US $28,981.5 × 106) and regulating services (US $652.9 × 10⁶). The results imply that addressing the degradation of land and water resources is crucial to reversing the loss of ecosystem services and achieving the national Sustainable Development Goals (SDGs) related to food and water security (SDGs 2 and 6) and life on land (SDG 15).
1. Introduction
The Millennium Ecosystem Assessment [1] defined Ecosystem Services as “the benefits people derive from ecosystems”. The Economics of Ecosystems and Biodiversity (TEEB) and the Dasgupta review defined ecosystem services as the direct and indirect contributions of ecosystems to human well-being [2,3]. The services and functions obtained from natural ecosystems have diverse ecological, cultural, and economic importance [4]. However, the major ecosystems and biodiversity that underpin them are still being degraded and lost at an unprecedented scale [5]. The review by Davidson [6] reported that the long-term loss of global natural wetlands averages between 54–57% but losses since 1700 AD may have been as high as 87%. More recently Arora [7] suggested that around 60% of global ecosystem services have been degraded in just 50 years. Since 1990, it is estimated that 420 million hectares of forest have been lost through conversion to other land uses, with the rate of deforestation between 2015 and 2020 estimated at 10 million hectares per year [8].
Pressures on ecosystem services are among the most critical global challenges [9]. Although there are various drivers (e.g., rapid economic development and other socio-economic changes, climate change and underestimation of the value of ecosystem services to human welfare), changes in land use and land cover (LULC) are the leading contributors to the loss of ecosystem services [4,10,11,12]. Land use and land cover are important structures and functions of ecosystem services [13]; therefore, changes to LULC (e.g., loss of forest cover and water bodies) and associated loss of ecosystem services are putting both ecosystems and humans at risk. These trends are expected to continue to accelerate in the future, particularly, in developing countries [14,15,16,17,18,19,20].
In Sub-Sharan Africa, LULC under improper land management is a major challenge e.g., [21,22]. For example, a study in Zanzibar, Tanzania [21] demonstrated that the ecological risk index of Zanzibar increased at a consistent rate due to the degradation of natural grassland and forest cover. Fenta et al. [22] demonstrated that this region is under severe pressure of degradation with significant consequences for loss of ecosystem service values (ESVs) and rural livelihoods. For example, Omar and Cabral [21] estimated an ESVs loss of US $6.0 × 10¹⁰ y−1 from the conversion of evergreen forest and shrubland in the region.
As in other Sub-Saharan African countries, the expansion of agriculture, urbanization, extraction of forest products, the prevalence of drought, poor land-use planning and increasing human and livestock populations are driving a significant change in LULC in Ethiopia, and these changes in LULC are causing considerable losses in ecosystem services [19,23,24]. For example, a study in the Afar region, Ethiopia [19] demonstrated that the ecosystem changes caused by LULC changes resulted in an average loss of ESVs of about US $602 million over a 30-year period. A study by Gashaw et al. [23] in the Andassa watershed, Upper Blue Nile basin, demonstrated that there are continued changes in LULC and the associated decline of ESVs over a 30-year period (e.g., ESV declined from US $26.83 × 10⁶ in 1985 to 21.00 × 10⁶ in 2015). This same study suggested that the ESVs will decline further to 17.94 × 106 by 2030 and to 15.25 × 106 by 2045. Hence if the current LULC changes continue, it will have serious consequences on the livelihoods of local communities.
The Central Rift Valley (CRV) and the surrounding escarpments, the study area, is one of the most environmentally sensitive areas in Ethiopia and is currently experiencing considerable LULC changes [25]. The leading drivers of LULC changes in the area include growing human and livestock populations in a region of limited resources, unsustainable farming techniques, an insecure land tenure system, poverty and climate change [25,26,27,28]. For example, Elias et al. [25] demonstrated that over the last 30 years (1985 to 2015), about 86% of the CRV showed a change in LULC. Such changes in LULC are also causing a considerable loss of ESVs and are affecting the livelihood of the local communities. Similarly, Godebo et al. [29] demonstrated a loss of 9.36 million US $ over a period of 45 years in the Bilate–Halaba sub-watershed, CRV, Ethiopia, while Kindu et al. [30] showed a loss of 19.4 million US $ over a period of 40 years in the Munessa–Shashemene landscape, a sub-watershed in the study area.
Most of these studies, however, have estimated the changes in ESVs in response to LULC changes at watershed or sub-watershed level and have not estimated the impact at basin level connecting both upstream and downstream areas and flows of ecosystem services [31]. It has been suggested that the wide variation in natural resources and drivers of LULC change and their implications on ecosystem services and human wellbeing cannot be fully understood with such fragmented case studies [32]. This suggests that the ability to summarize and apply the results of these case studies to the entire CRV lakes basin is limited due to their incomplete coverage. With the current focus in Ethiopia on sub-basin or basin level planning and implementation of natural resource development activities, studying the impact of LULC changes on ESVs at sub-basin or basin scale is essential. This provides information on how to balance losses and gains of productive land and associated ecosystem services. This is needed by policy and decision-makers involved in planning sustainable management for safe ecological systems and achievement of national SDGs related to food and water security (SDGs 2 and 6) and life on land (SDG15) [33].
Unlike the previously conducted studies, the present study used ESV coefficients updated in 2020 [34] to provide comprehensive values for different biomes. Given that this study analyzed the changes in LULC in the CRV lakes basin and the surrounding escarpments (i.e., the Arsi and Gurage highlands) over a 45 year period (1973–2020) and estimated the associated losses and gains in ESVs, it addresses major gaps in existing studies by connecting the sources and sinks of material (e.g., sediment and water) in source-to-lake systems. This approach was discussed by Belete et al. [31] in the case of sediment management in the Lake Hawassa catchment. Against this background, the objective of the present study was to analyze the LULC dynamics in both upstream, and downstream areas in the CRV, to enhance understanding of how LULC changes drive the loss of different types of ecosystem services, including provisioning (e.g., food and water), regulating (e.g., regulation of climate and sediment flows), supporting (e.g., nutrient cycling), and cultural (e.g., recreation and tourism), and to facilitate the identification of critical areas for conserving natural resources and reversing the decline of associated ESVs in the CRV.
2. Materials and Methods
The present study covered the CRV Lakes basin, which is part of the great African rift valley and the East and West escarpments (i.e., the Arsi and Gurage highlands), Ethiopia (Figure 1). The study area is 150 km south of Addis Ababa and encompasses a chain of four hydrologically interconnected lakes; Lake Ziway, Lake Abijata, Lake Langano and Lake Shala (Figure 1). It covers about 1.8 million hectares, with waterbodies covering approximately 7% of the study area. Elevation in the CRV varies between 1503 and 4144 m (±16 m) above mean sea level. The slope steepness, derived from a 30 m resolution Digital Elevation Model, ranges from 0 to 92%, with most of the study area (95%) exhibiting a flat to gentle slope (i.e., 0–10%).
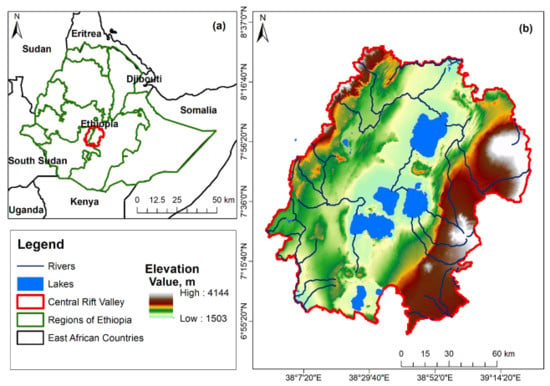
Figure 1.
Geographical location of Ethiopia (a), and elevation variation and lakes in the Central Rift Valley (CRV), Ethiopia (b).
According to the traditional agroecological zone classification used in Ethiopia [35], the study area encompasses four major agroecological zones; Kolla (refers to lowland with an elevation between 500 and 1500 m above sea level), Woina Dega (midland, 1500–2300), Dega (highlands, 2300–3200) and Wurch (highlands, 3200–3700). According to data from the Ethiopian Meteorological Agency, the long-term annual rainfall of the study area ranges from 722 mm to 1274 mm, indicating a considerable variation across the CRV lakes basin. The highlands and midlands receive higher rainfall compared to the lowland or the valley floor. The mean minimum and maximum annual air temperature of the study areas varies decreases with an increase in elevation.
The study area includes a wide range of ecosystems, including farmland, forestland, waterbodies, shrubland and grassland, which provide humans with a range of important ecosystem services. The study area is endowed with a suitable land potential for rainfed and irrigated agriculture. Over 95% of the total agricultural land is cultivated by smallholder farmers and most of the agricultural production is rainfed.
Table 1 presents the characteristics of Landsat images used for the analysis of LULC changes for the years 1973, 1990, 2005 and 2020. The dry and cloud-free seasons (Table 1) were selected as their spectral properties are less affected by cloud cover. Additionally, seasonal and sensor coherence allows similar vegetation phenology and atmospheric conditions to be mapped. This in turn reduces differences in the sun angle and helps to match spectral characteristics of the different LULC across time.

Table 1.
Characteristics of the Landsat images used for the analysis of LULC changes.
The four Landsat images (Table 1) were preprocessed or restored and rectified by geometric and radiometric corrections before classification. The radiometric corrections include histogram equalization, haze and noise reductions, and atmospheric correction. Such image preprocessing helps to produce more enhanced images for classification. The enhanced image bands were layer stacked and the scenes were mosaicked for image classification. Landsat 7 ETM+ has a scan-line corrector due to the ETM+ sensor failing permanently in 2005. This consequently created image gaps for the year and so the gap in the Landsat 7 image was filled using the interpolation method.
The collection of Ground Control Points (GCPs) employed the following steps. First, we conducted unsupervised image classification to identify the major LULC classes. At this stage, we identified seven major LULC classes; bare land, forestland, shrubland, grassland, farmland, settlements and waterbodies. Second, we used a random sampling technique to select sampling points for gathering GCPs from each identified LULC class. Third, we gathered GCPs from each selected point in each LULC class during field surveys conducted in June 2020. We followed these steps to ensure the collection of GCPs from all major LULC classes and fair representation during training and verification of image classification. During the entire field survey, data for 206 GCPs and an additional 394 reference points from google earth were collected for classification and accuracy assessment. The collection of GCPs was aided by topographic maps and a Global Positioning System with a positional error of ±3 m.
The actual classification was carried out after the training data had been established (half of the sampled data) and the classification was conducted using the Maximum Likelihood Classifier [36]. Additionally, all satellite images were interpreted using red, green and blue color composition to distinguish surface features. A pixel-based supervised image classification with a maximum likelihood algorithm was used to classify or map the major LULC in the basin. A total of seven LULC classes including settlement areas were identified for all years (Table 2). The categories are consistent with the IPCC Guidelines [37].
Table 2.
Description of land use and land cover (LULC) classes used in the study.
Accuracy assessment (overall, producer and user accuracies) and Kappa coefficient were determined by comparing the area extent of the LULC classes in the classified images with the reference data set using error matrices. The accuracy of the classified image was assessed using 420 random reference points for each year of analysis (i.e., 1973, 1990, 2005 and 2020). This was translated into 60 reference points for each LULC class in each analysis year. The accuracies and Kappa coefficients were calculated using Equations (1)–(4).
where OA is overall accuracy, X is the total number of correctly classified values in the diagonals of the matrix, Y is the total number of reference points, PA is the producer accuracy, Q is the number of correctly classified pixels in each category (on the major diagonal), R is the number of reference pixels “known” to be of that category (the column total), UA is the user accuracy, A is the number of correctly classified pixels in each category, B is the total number of pixels that were classified in that category (the row total). K is Kappa coefficient, r is the number of rows in the matrix, xii is the number of observations in row i and column i, xi+ are the marginal totals of row i, x + i are the marginal totals column i and M is the total number of observations in the matrix.
We used a post-classification comparison approach to determine changes in LULC classes in three intervals; 1973–1990, 1990–2005 and 2005–2020. In particular, LULC dynamics, the area extent of the changes, and the nature and spatial patterns of the changes were assessed. The intervals were set in such a way as to enable detection of LULC changes following regime changes (i.e., periods during the transition of government in the country).
To map the transition matrix of losses and gains with each LULC between the four periods, the land-use change module (LUCM), which is an extension to ArcGIS, was used. The magnitude of LULC change experienced between the different periods was expressed in percent Equation (5) and rate of change Equation (6).
where PC is percentage change, RC is the rate of change in ha yr −1, X is the area of LULC in ha in time 2, Y is the area of LULC in ha in time 1, Z is the time interval between X and Y in years.
The change in ecosystem service values (ESVs) was assessed using the classified (1973, 1990, 2005 and 2020) LULC conditions. The ESV coefficients have been modified several times since their first establishment in 1997 [38]. For example, the values were modified in 2010 [39], in 2012 [40] and in 2014 [41]. However, all these modifications have been criticized due to the lack of representation of the context of certain regions, including Ethiopia [23], and over- or under-estimation of some ecosystem services [42]. Recognizing the importance of having information on spatial ESVs to support decision making, and address some of these criticisms, the ecosystem service valuation database (ESVD) was updated in 2020 with support from the UK Department for Environment, Food and Rural Affairs (Defra) [34].
The Ecosystem Services Valuation Database (ESVD) is a follow-up to “The Economics of Ecosystems and Biodiversity” (TEEB) database which contained over 1300 data points from 267 case studies on monetary values of ecosystem services across all biomes [34]. The same author updated the database in 2020, and the current version of ESVD now contains 4042 value records based on 693 studies (i.e., three times as many as the original TEEB database). The recently updated ESVD added additional variables, and information on study site location, size and condition. The values recorded in ESVD were obtained from six geographical locations (Continents); Africa (309 studies), Asia (1140), Europe (1639), North America (594), South America (109) and Oceania (223).
The recently updated global ecosystem service valuation database (ESVD) [34] (Table 3) and the value transfer valuation method were used to estimate the changes in ESVs in response to LULC changes in the study area. The selection of most representative biomes used as a proxy for each LULC class is summarized in Table 3. The equation described by Gashaw et al. [23] was used to estimate ESVs from each LULC class and the total ESVs of the entire CRV lakes basin (the study area). In addition, the values of the individual ecosystem services (i.e., provisioning, regulating, supporting and cultural ecosystem services) were estimated using the equation described in Gashaw et al. [23]. The updated coefficients given by de Groot et al. [34] that were used in this study are shown in Table 4. The percent change of ESVs across different periods (1975–1990, 1990–2005, 2005–2020) was calculated using the equation described in Kindu et al. [30].
Table 3.
Land use and land cover (LULC) classes, the corresponding biomes and mean standardized values per ecosystem service biome based on the updated values [34].
Table 4.
Coefficients (Int$/hectare/year; 2020 price levels) of ecosystem service values for the five-land use and land cover classes.
3. Results and Discussion
3.1. Accuracy of the Classification Process
The overall accuracy for the base year (i.e., 1973) was 90%, 87% for 1990, 86% for 2005, and 88% for 2020. The Kappa coefficient for 1973 was 0.88, 0.85 for 1990, 0.84 for 2005, and 0.86 for 2020. Figure 2 summarized the producer’s and user’s accuracies for each LULC class across the four investigated years. The classification of waterbodies displayed a 100% producer accuracy across the four years, indicating that no pixel was incorrectly excluded from this land cover type (Figure 2). The classification of settlement displayed the lowest producer accuracy in 1973 and 1990, while grassland showed the lowest producer accuracy in 2020 (Figure 2). In summary, the kappa coefficient is rated as substantial and hence the classified image was found to be fit for further use and analysis.
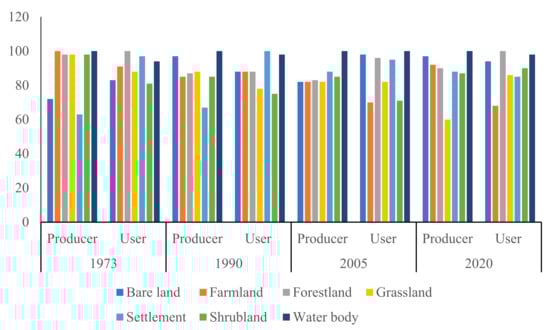
Figure 2.
Error matrix showing the accuracy of the land use and land cover (LULC) type classification.
3.2. Change in Land Use and Land Cover
We detected that farmlands, grasslands and shrublands are distributed throughout the basin, but forestlands are dominantly found in the highlands (i.e., in eastern and western escarpments), and waterbodies (mainly lakes) and bare lands are concentrated in the valley floor (Figure 3). Table 5 presents the dominant LULC and percent cover of each LULC class in 1973, 1990, 2005 and 2020. Table 6 presents the annual rate and percent changes, as well as the changes in hectares in LULC classes across the investigated years.
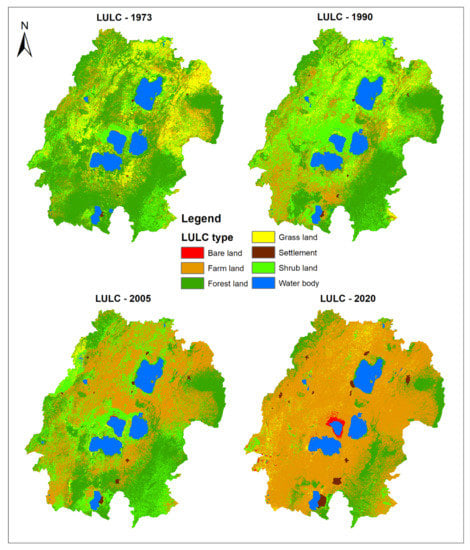
Figure 3.
LULC in the CRV lakes basin, Ethiopia in 1973, 1990, 2005 and 2020.
Table 5.
Area coverage of major land use and land cover types.
Table 6.
Changes in land use and land cover (LULC) from 1973–2020.
Farmlands, bare lands and settlement areas showed positive changes, while forest, grasslands, shrublands and waterbodies showed negative changes over the analyzed 47-year period (Table 6). We detected several trajectories of LULC changes (Table 7) and observed a slight difference in trajectories of land use conversion in the four investigated periods (i.e., 1973–1990, 1990–2005, 2005–2020, 1973–2020). The expansion of agricultural lands over the last 47 years period, for example, has occurred at the expense of grassland (where 204,491 ha, or 87.2% of grassland was converted to farmland), forestland (556,834 ha, 65.9%), and shrubland (261,412 ha, 78.3%) (Table 7). The expansion of bare land occurred mainly at the expense of waterbodies (7722 ha, 6.0%) (Table 7). In summary, farmland displayed a net gain, while forestlands, grasslands and shrublands showed net losses over a 47-year period (Table 7).
Table 7.
Pattern of land use and land cover change (i.e., “from–to’’ changes).
The expansion of agricultural lands and the associated decrease in forestland, shrubland and grassland, as well as the expansion of bare lands at the expense of waterbodies can be explained by the growing pressures on land from increasing population and livestock in the basin. Several major assessments e.g., [43,44] have shown similar results in relation to the expansion of agricultural lands in Africa at the expense of forest and woodlands. A study in West Africa demonstrated that population pressure is one of the driving factors that shape the complexity of land cover outcomes [45]. Studies conducted in Ethiopia and the CRV e.g., [24,27,46,47,48] have shown a major land cover reversal; while woodland was the dominant land cover four to five decades ago, it has been converted to agriculture in recent years. These studies also indicated that the expansion of agricultural lands occurred at the expense of woodlands and forests. According to these studies, the leading drivers of the observed LULC changes (i.e., the expansion of agricultural land at the expense of forest and woodlands) include both indirect (e.g., population growth) and direct (e.g., fuelwood extraction, charcoal making, and overgrazing) drivers. This implies that addressing the pressure from increasing human and livestock population is crucial for ensuring the sustainable provision of ecosystem goods and services. Designing and implementing better forest and landscape restoration measures, tools, strategies, and policies that address both human demand for energy, food and feed, while preserving the functioning and structure of ecosystems, should be a priority for a country like Ethiopia.
3.3. Changes in the Total Ecosystem Service Values
Table 8 summarizes the total ESVs of the identified LULC classes. We detected that only the ESVs of farmland increased between 1973 and 2020 (Table 8; Figure 4). The total ESVs were reduced from US $117,384.3 × 106 in 1973 to US $55,273.9 × 106 in 2020. It was found that the major contributor to this change is the change in forestland. The next major contributor to the reduction of total ESVs across the study periods was the reduction of waterbodies (Figure 4). It is also observed that the changes in LULC over a period of 47 years resulted in a total loss of ESVs of US $62,110.4 × 106 (Figure 4). Considering that the loss of waterbodies is one of the major contributors to the loss of ESVs, the reported values here might be underestimated, as the spatial resolution of the Landsat Maps used in this study could not capture the loss of small water bodies, such as springs, due to LULC changes. These changes in LULC and associated loss of ESVs are expected to increase in the near future if the current decreasing trends of forestland, shrubland and waterbodies continue. Many other studies e.g., [15,23,30,49,50] have also shown similar results in that the loss of shrubland, grasslands and forestlands are major contributors to the reduction in ESVs. The expansion of bare lands in the basin could also contribute significantly to this.
Table 8.
Effects of LULC Changes on the total ecosystem service values (ESVs) (in millions of US $; 2020 price levels) in the Central Rift Valley lakes basin.
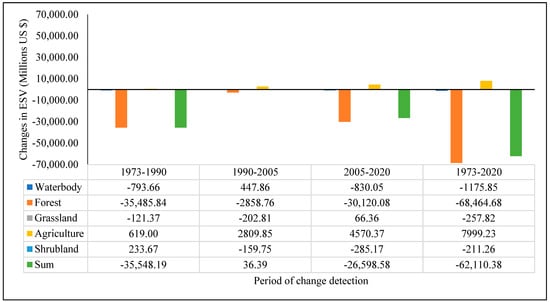
Figure 4.
Changes in ecosystem service values (ESVs) (in millions of US $; 2020 price levels) in the Central Rift Valley lakes basin, Ethiopia.
3.4. Impact of Land Use and Landcover Changes on the Specific Ecosystem Service Values
Most of the ecosystem services were reduced during the observation period compared to the base year (Table 9). Over the 47-year period (1973–2020), the greatest ecosystem service loss was related to water supply (US $27,071.4 × 106), opportunities for recreation and tourism (US $27,458.1 × 106), and raw material (US $6847.7 × 106). In a broader sense, the greatest contributors to the loss of ESVs from the 1973 to 2020 period, in decreasing order, are provisioning services (US $33,795.1 × 106), cultural services (US $28,981.5 × 106) and regulating services (US $653.0 × 10⁶). The highest reduction in provisioning ecosystem services compared to other ecosystem services could be attributed to the reduction in coverage of forest and water bodies. Similar results have demonstrated that reduction in tropical forest biomes, in general, contributes to a significant reduction in provisioning ecosystem services e.g., [19,30,50,51,52,53]. In line with this, a study in the Abaya–Chamo sub-basin of the CRV [54] indicated that the losses of services obtained from natural ecosystems are a major concern and the consequences have already been reported in the basin in the form of reduced water quality and productivity of the lakes due to increased soil erosion and sediment transport and deposition in the sub-basin.
Table 9.
Effects of land use and land cover changes on individual ecosystem services or functions in the basin over a period of 47 years. Note: ESV = ecosystem service value.
On the other hand, over the 47-year period, some ecosystem services, such as food production, pollination and biological control, increased corresponding to the LULC changes. The increases in these ecosystem services could mainly be attributed to the expansion of agricultural lands in the sub-basin.
3.5. Implications for Landscape Management
The results of the present study indicate that the impacts of LULC changes in the basin on ecosystem services are considerable. In particular, the degradation of forest resources and waterbodies (e.g., rivers, lakes) in the CRV lakes basin needs further attention as their degradation in the basin is contributing significantly to the loss of a multitude of ESVs. The main human drivers identified included increasing pressures from human and livestock populations, which in turn lead to an enhanced demand for food, water and raw materials. It could, therefore, be argued that these provisioning ecosystem services have been prioritized at the expense of regulating services, such as water flows, as well cultural ecosystem services. Regulating services are best addressed at the basin and landscape scale, as they require integrated management of different land cover classes at scale and the linking of upstream and downstream interventions. In the face of climate change and recurrent drought, this is becoming even more important. Integrated basin and landscape approaches also need to engage with stakeholders at multiple levels and be participatory. Mapping of stakeholder interest and influence, benefit-sharing dialogues for shared visioning, and multi-stakeholder platforms for coordinated decision-making and learning are important [55,56,57].
In line with this, using different policy incentives for landscape management, such as payment for ecosystem services and integration of income generating activities within land management practices, could help restore degraded forests and landscapes. The use of incentives for forest and landscape restoration, for example, helps to bridge the gap between landscape restoration and ecosystem services in the long term and local economic losses in the short term. This, in turn, supports local communities to adopt long-term conservation approaches (e.g., exclosures for landscape restoration) and to maintain or increase the ESVs of the natural resources in the basin. For example, Kibret et al. [58] identified more than 500,000 hectares of land suitable for the establishment of exclosures in the CRV, which enables the integration of income generating activities in different land cover classes in the landscapes.
This study has shown how long-term LULC changes can have negative impacts on a wide range of ecosystem services and that in general the regulating, supporting and cultural ecosystem services are more negatively impacted than provisioning services, e.g., provision of food, feed and energy. Changes in LULC need to be monitored and managed at the basin and landscape scales to manage trade-offs between different ecosystem services and to balance losses and gains of land cover within the same land cover classes. This will contribute to the achievement of national SDG targets related to food and water security (SDGs 2 and 6) and life on land (SDG15). This also requires adaptive management of ecosystems and natural resources [13], which in turn lays a foundation to bring different stakeholders together to help accommodate different opinions and interests, and thereby ensures better management of water and land resources for improved rural livelihoods.
4. Conclusions
The present study covered the Central Rift Valley lakes basin in Ethiopia, focusing on the valley floor and the East and West escarpments, to analyze changes in LULC and to estimate associated losses in ecosystem service values (ESVs), as well as to facilitate the identification of critical areas for conserving natural resources and reversing the decline of associated ESVs. Covering both upstream and downstream areas in the basin, the study addressed major gaps in existing studies by connecting the sources and sinks of material (e.g., sediment and water) in source-to-lake systems. The long-term LULC changes observed in this study have negative impacts on a wide range of ecosystem services. Therefore, this supports that LULC are the leading contributors to the decline and loss of ecosystem services in the CRV. This, in turn, suggests that addressing the decline in forest cover and waterbodies, the major observed LULC changes in CRV, plays a vital role in improving ecosystem services in the CRV lakes basin. Our analysis of LULC changes and the associated losses in ecosystem service values can provide a guide as to where to focus when planning and implementing landscape restoration measures.
Author Contributions
Conceptualization, W.M. and M.D.; methodology, W.M. and M.D.; software, M.D.; validation, W.M.; formal analysis, W.M.; writing—original draft preparation, W.M.; writing—review and editing, A.T. and A.H. All authors have read and agreed to the published version of the manuscript.
Funding
This research was funded by The Ethiopian Land and Water Governance Program funded by SIDA, grant number 10822/43-42100 and the APC was funded by The Ethiopian Land and Water Governance Program funded by SIDA.
Informed Consent Statement
Not applicable.
Conflicts of Interest
The authors declare no conflict of interest.
References
- Millennium Ecosystem Assessment. Ecosystems and human well-being: Wetlands and water. Int. J. Biodivers. Sci. 2005, 11, 71–83. [Google Scholar]
- De Groot, R.S.; Fisher, B.; Christie, M.; Aronson, J.; Braat, L.; Haines-Young, R.; Ring, I. Integrating the ecological and economic dimensions in biodiversity and ecosystem service valuation. In The Economics of Ecosystems and Biodiversity (TEEB): Ecological and Economic Foundations; Earthscan Routledge: London, UK, 2010; pp. 9–40. [Google Scholar]
- Dasgupta, P. The Economics of Biodiversity: The Dasgupta Review; HM Treasury: London, UK, 2021. [Google Scholar]
- Hasan, S.; Shi, W.; Zhu, X. Impact of land use land cover changes on ecosystem service value–A case study of Guangdong, Hong Kong, and Macao in South China. PLoS ONE 2020, 15, e0231259. [Google Scholar] [CrossRef] [Green Version]
- Markandya, A. The economic feedbacks of loss of biodiversity and ecosystems services. OECD Environ. Work. Pap. 2015. [Google Scholar] [CrossRef]
- Davidson, N.C. How much wetland has the world lost? Long-term and recent trends in global wetland area. Mar. Freshw. Res. 2014, 65, 934–941. [Google Scholar] [CrossRef]
- Arora, N.K. Earth: 50 years challenge. Environ. Sustain. 2019, 2, 1–3. [Google Scholar] [CrossRef] [Green Version]
- FAO; UNEP. The State of the World’s Forests 2020. Forests, Biodiversity, and People; FAO: Rome, Italy; UNEP: Rome, Italy, 2020. [Google Scholar]
- Palomo, I.; Locatelli, B.; Otero, I.; Colloff, M.; Crouzat, E.; Cuni-Sanchez, A.; Gómez-Baggethun, E.; González-García, A.; Grêt-Regamey, A.; Jiménez-Aceituno, A.; et al. Assessing nature-based solutions for transformative change. One Earth 2021, 4, 730–741. [Google Scholar] [CrossRef]
- Zorrilla-Miras, P.; Palomo, I.; Gómez-Baggethun, E.; Martin-Lopez, B.; Lomas, P.L.; Montes, C. Effects of land-use change on wetland ecosystem services: A case study in the Doñana marshes (SW Spain). Landsc. Urban. Plan. 2014, 122, 160–174. [Google Scholar] [CrossRef]
- Łowicki, D.; Walz, U. Gradient of land cover and ecosystem service supply capacities—A comparison of suburban and rural fringes of towns Dresden (Germany) and Poznan (Poland). Procedia Earth Planet. Sci. 2015, 15, 495–501. [Google Scholar] [CrossRef] [Green Version]
- Ye, Y.; Zhang, J.; Bryan, B.A.; Gao, L.; Qin, Z.; Chen, L.; Yang, J. Impacts of rapid urbanization on ecosystem services along urban-rural gradients: A case study of the Guangzhou-Foshan Metropolitan Area, South China. Écoscience 2018, 25, 235–247. [Google Scholar] [CrossRef]
- Haileslassie, A.; Mekuria, W.; Schmitter, P.; Uhlenbrook, S.; Ludi, E. Changing agricultural landscapes in Ethiopia: Examining application of adaptive management approach. Sustainability 2020, 12, 8939. [Google Scholar] [CrossRef]
- Deng, X.; Li, Z.; Huang, J.; Shi, Q.; Li, Y. A revisit to the impacts of land use changes on the human wellbeing via altering the ecosystem provisioning services. Adv. Meteorol. 2013, 2013, 1–8. [Google Scholar] [CrossRef] [Green Version]
- Hu, H.; Liu, W.; Cao, M. Impact of land use and land cover changes on ecosystem services in Menglun, Xishuangbanna, Southwest China. Environ. Monit. Assess. 2007, 146, 147–156. [Google Scholar] [CrossRef] [PubMed]
- Lin, X.; Xu, M.; Cao, C.; Singh, P.R.; Chen, W.; Ju, H. Land-use/land-cover changes and their influence on the ecosystem in Chengdu City, China during the period of 1992–2018. Sustainability 2018, 10, 3580. [Google Scholar] [CrossRef] [Green Version]
- Sharma, R.; Nehren, U.; Rahman, S.A.; Meyer, M.; Rimal, B.; Seta, G.A.; Baral, H. Modeling land use and land cover changes and their effects on biodiversity in central Kalimantan, Indonesia. Land 2018, 7, 57. [Google Scholar] [CrossRef] [Green Version]
- Patel, S.K.; Verma, P.; Singh, G.S. Agricultural growth and land use land cover change in peri-urban India. Environ. Monit. Assess. 2019, 191, 1–17. [Google Scholar] [CrossRef]
- Shiferaw, H.; Bewket, W.; Alamirew, T.; Zeleke, G.; Teketay, D.; Bekele, K.; Schaffner, U.; Eckert, S. Implications of land use/land cover dynamics and Prosopis invasion on ecosystem service values in Afar Region, Ethiopia. Sci. Total Environ. 2019, 675, 354–366. [Google Scholar] [CrossRef] [PubMed]
- Xu, X.; Jiang, H.; Wang, L.; Guan, M.; Zhang, T.; Qiao, S. Major consequences of land-use changes for ecosystems in the future in the agro-pastoral transitional zone of Northern China. Appl. Sci. 2020, 10, 6714. [Google Scholar] [CrossRef]
- Omar, H.; Cabral, P. Ecological risk assessment based on land cover changes: A case of Zanzibar (Tanzania). Remote Sens. 2020, 12, 3114. [Google Scholar] [CrossRef]
- Fenta, A.A.; Tsunekawa, A.; Haregeweyn, N.; Tsubo, M.; Yasuda, H.; Shimizu, K.; Kawai, T.; Ebabu, K.; Berihun, M.L.; Sultan, D.; et al. Cropland expansion outweighs the monetary effect of declining natural vegetation on ecosystem services in sub-Saharan Africa. Ecosyst. Serv. 2020, 45, 101154. [Google Scholar] [CrossRef]
- Gashaw, T.; Tulu, T.; Argaw, M.; Worqlul, A.W.; Tolessa, T.; Kindu, M. Estimating the impacts of land use/land cover changes on ecosystem service values: The case of the Andassa watershed in the Upper Blue Nile basin of Ethiopia. Ecosyst. Serv. 2018, 31, 219–228. [Google Scholar] [CrossRef]
- Galata, A.W. Analysis of land use/land cover changes and their causes using landsat data in hangar watershed, Abay basin, Ethiopia. J. Sediment. Environ. 2020, 5, 415–423. [Google Scholar] [CrossRef]
- Elias, E.; Seifu, W.; Tesfaye, B.; Girmay, W. Impact of land use/cover changes on lake ecosystem of Ethiopia central rift valley. Cogent Food Agric. 2019, 5, 1595876. [Google Scholar] [CrossRef]
- Garedew, E.; Sandewall, M.; Söderberg, U.; Campbell, B.M. Land-use and land-cover dynamics in the Central Rift Valley of Ethiopia. Environ. Manag. 2009, 44, 683–694. [Google Scholar] [CrossRef]
- Mesfin, D.; Simane, B.; Belay, A.; Recha, J.W.; Taddese, H. Woodland cover change in the Central Rift Valley of Ethiopia. Forests 2020, 11, 916. [Google Scholar] [CrossRef]
- Desta, H.; Fetene, A. Land-use and land-cover change in Lake Ziway watershed of the Ethiopian Central Rift Valley region and its environmental impacts. Land Use Policy 2020, 96, 104682. [Google Scholar] [CrossRef]
- Godebo, M.M.; Ulsido, M.D.; Jijo, T.E.; Geleto, G.M. Influence of land use and land cover changes on ecosystem services in the Bilate Alaba Sub-watershed, Southern Ethiopia. J. Ecol. Nat. Env. 2018, 10, 228–238. [Google Scholar]
- Kindu, M.; Schneider, T.; Teketay, D.; Knoke, T. Changes of ecosystem service values in response to land use/land cover dynamics in Munessa–Shashemene landscape of the Ethiopian highlands. Sci. Total. Environ. 2016, 547, 137–147. [Google Scholar] [CrossRef] [PubMed]
- Belete, M.D.; Hebart-Coleman, D.; Mathews, R.E.; Zazu, C. Building foundations for source-to-sea management: The case of sediment management in the Lake Hawassa sub-basin of the Ethiopian Rift Valley. Water Int. 2021, 46, 138–156. [Google Scholar] [CrossRef]
- Dibaba, W.T.; Demissie, T.A.; Miegel, K. Drivers and implications of land use/land cover dynamics in Finchaa Catchment, Northwestern Ethiopia. Land 2020, 9, 113. [Google Scholar] [CrossRef] [Green Version]
- SDG. The Sustainable Development Goals Report; United Nation: New York, NY, USA, 2019. [Google Scholar]
- De Groot, R.; Brander, L.; Solomonides, S. Update of Global Ecosystem Service Valuation Database (ESVD); Wageningen University & Research: Wageningen, The Netherlands, 2020; p. 58. [Google Scholar]
- Hurni, H.; Berhe, W.A.; Chadhokar, P.; Daniel, D.; Gete, Z.; Grunder, M.; Kassaye, G. Soil and Water Conservation in Ethiopia: Guidelines for Development Agents, 2nd ed.; Centre for Development and Environment (CDE), University of Bern, with Bern Open Publishing (BOP): Bern, Switzerland, 2016; p. 134. [Google Scholar]
- Shivakumar, B.R.; Rajashekararadhya, S.V. Investigation on land cover mapping capability of maximum likelihood classifier: A case study on North Canara, India. Procedia Comput. Sci. 2018, 143, 579–586. [Google Scholar] [CrossRef]
- Penman, J.; Gytarsky, M.; Hiraishi, T.; Krug, T.; Kruger, D.; Pipatti, R.; Wagner, F. Good practice guidance for land use, land-use change and forestry. Intergov. Panel Clim. Chang. 2003. [Google Scholar]
- Costanza, R.; d’Arge, R.; De Groot, R.; Farber, S.; Grasso, M.; Hannon, B.; Van Den Belt, M. The value of the world’s ecosystem services and natural capital. Nature 1997, 387, 253–260. [Google Scholar] [CrossRef]
- Van der Ploeg, S.; De Groot, R.S.; Wang, Y. The TEEB Valuation Database: Overview of Structure, Data and Results; Foundation for Sustainable Development: Wageningen, The Netherlands, 2010. [Google Scholar]
- De Groot, R.; Brander, L.; Van Der Ploeg, S.; Costanza, R.; Bernard, F.; Braat, L.; Christie, M.; Crossman, N.; Ghermandi, A.; Hein, L.; et al. Global estimates of the value of ecosystems and their services in monetary units. Ecosyst. Serv. 2012, 1, 50–61. [Google Scholar] [CrossRef]
- Costanza, R.; De Groot, R.; Sutton, P.; Van Der Ploeg, S.; Anderson, S.J.; Kubiszewski, I.; Farber, S.; Turner, R.K. Changes in the global value of ecosystem services. Glob. Environ. Chang. 2014, 26, 152–158. [Google Scholar] [CrossRef]
- Tolessa, T.; Senbeta, F.; Kidane, M. Landscape composition and configuration in the central highlands of Ethiopia. Ecol. Evol. 2016, 6, 7409–7421. [Google Scholar] [CrossRef]
- Eva, H.D.; Brink, A.; Simonetti, D. Monitoring Land Cover Dynamics in Sub-Saharan Africa; Institute for Environmental and Sustainability: Ispra, Italy, 2006; ISSN 1018-5593. [Google Scholar]
- Cherlet, M.; Hutchinson, C.; Reynolds, J.; Hill, J.; Sommer, S. World Atlas of Desertification; Publication Office of the European Union: Luxembourg, 2018; ISBN 978-92-79-75350-3. [Google Scholar] [CrossRef]
- Herrmann, S.M.; Brandt, M.; Rasmussen, K.; Fensholt, R. Accelerating land cover change in West Africa over four decades as population pressure increased. Commun. Earth Environ. 2020, 1, 1–10. [Google Scholar] [CrossRef]
- Bekele, B.; Wu, W.; Yirsaw, E. Drivers of land use-land cover changes in the Central Rift Valley of Ethiopia. Sains Malays. 2019, 48, 1333–1345. [Google Scholar] [CrossRef]
- Akalu, F.; Raude, J.M.; Sintayehu, E.G.; Kiptala, J. Evaluation of land use and land cover change (1986–2019) using Remote Sensing and GIS in Dabus Sub-Catchment, Southwestern Ethiopia. J. Sustain. Res. Eng. 2019, 5, 91–100. [Google Scholar]
- Shiferaw, H.; Alamirew, T.; Kassawmar, T.; Zeleke, G. Evaluating ecosystems services values due to land use transformation in the Gojeb watershed, Southwest Ethiopia. Environ. Syst. Res. 2021, 10, 1–12. [Google Scholar] [CrossRef]
- Kindu, M.; Schneider, T.; Döllerer, M.; Teketay, D.; Knoke, T. Scenario modelling of land use/land cover changes in Munessa-Shashemene landscape of the Ethiopian highlands. Sci. Total. Environ. 2018, 622, 534–546. [Google Scholar] [CrossRef]
- Tolessa, T.; Senbeta, F.; Abebe, T. Land use/land cover analysis and ecosystem services valuation in the central highlands of Ethiopia. For. Trees Livelihoods 2016, 26, 1–13. [Google Scholar] [CrossRef]
- Yan, F.; Zhang, S.; Liu, X.; Chen, D.; Chen, J.; Bu, K.; Yang, J.; Chang, L. The effects of spatiotemporal changes in land degradation on ecosystem services values in Sanjiang Plain, China. Remote. Sens. 2016, 8, 917. [Google Scholar] [CrossRef] [Green Version]
- Wang, X.-C.; Dong, X.; Liu, H.; Wei, H.; Fan, W.; Lu, N.; Xu, Z.; Ren, J.; Xing, K. Linking land use change, ecosystem services and human well-being: A case study of the Manas River Basin of Xinjiang, China. Ecosyst. Serv. 2017, 27, 113–123. [Google Scholar] [CrossRef]
- Solomon, N.; Segnon, A.C.; Birhane, E. Ecosystem service values changes in response to land-use/land-cover dynamics in dry afromontane forest in Northern Ethiopia. Int. J. Environ. Res. Public Health 2019, 16, 4653. [Google Scholar] [CrossRef] [Green Version]
- Woldeyohannes, A.; Cotter, M.; Biru, W.D.; Kelboro, G. Assessing changes in ecosystem service values over 1985–2050 in response to land use and land cover dynamics in Abaya-Chamo Basin, Southern Ethiopia. Land 2020, 9, 37. [Google Scholar] [CrossRef] [Green Version]
- Mekuria, W.; Haileslassie, A.; Tengberg, A.; Zazu, C. Stakeholders interest and influence and their interactions in managing natural resources in Lake Hawassa catchment, Ethiopia. Ecosyst. People 2021, 17, 87–107. [Google Scholar] [CrossRef]
- Tengberg, A.; Gustafsson, M.; Samuelson, L.; Weyler, E. Knowledge production for resilient landscapes: Experiences from multi-stakeholder dialogues on water, food, forests, and landscapes. Forests 2020, 12, 1. [Google Scholar] [CrossRef]
- Welling, R.; Filz, P.; Dalton, J.; Smith, D.M.; de Silva, J.; Manyara, P. Governing resilient landscapes across the source-to-sea continuum. Water Int. 2021, 46, 264–282. [Google Scholar] [CrossRef]
- Kibret, K.S.; Haileslassie, A.; Bori, W.M.; Schmitter, P. Multicriteria decision-support system to assess the potential of exclosure-based conservation in Ethiopia. Renew. Agric. Food Syst. 2020, 1–15. [Google Scholar] [CrossRef] [Green Version]
Publisher’s Note: MDPI stays neutral with regard to jurisdictional claims in published maps and institutional affiliations. |
© 2021 by the authors. Licensee MDPI, Basel, Switzerland. This article is an open access article distributed under the terms and conditions of the Creative Commons Attribution (CC BY) license (https://creativecommons.org/licenses/by/4.0/).