Article

Government Competition, Land Supply Structure and Semi-Urbanization in China

1
School of Management, Zhejiang University of Technology, 288 Liuhe Road, Hangzhou 310023, China
2
China Academy of Housing & Real Estate, Zhejiang University of Technology, 288 Liuhe Road, Hangzhou 310023, China
3
ESIC Business & Marketing School, Madrid Campus, Avda. Valdenigrales s/n, 28223 Pozuelo de Alarcón, Spain
*
Author to whom correspondence should be addressed.
Land 2021, 10(12), 1371; https://doi.org/10.3390/land10121371
Submission received: 30 October 2021 / Revised: 30 November 2021 / Accepted: 9 December 2021 / Published: 11 December 2021
(This article belongs to the Special Issue The Governance of Land Use)

Abstract

:
Population urbanization is crucial to establishing a harmonious society. However, the phenomenon of population semi-urbanization is becoming an issue of ever-increasing concern in China. More and more immigrants from rural areas work and live in the city, but their roots remain in the rural area. This paper aims to analyze the influence mechanism of government competition on population semi-urbanization through land supply structure. The study’s theoretical analysis and empirical analysis results are based on the panel data of 105 key prefecture-level cities in China from 2007 to 2017. The results demonstrate that: (1) land finance and land-motivated investment engendered by government competition lead to an imbalance in the land price structure, further increasing the rate of population semi-urbanization; (2) land finance does not lead to population semi-urbanization through the land area structure; and (3) land-motivated investment aggravates the imbalance in the land area structure, further leading to population semi-urbanization. It is found that government competition in terms of achieving performance indicators affects population semi-urbanization by adjusting the land supply structure. Efforts should be made to achieve the coordinated development of urbanization, given that the increasing rate of population semi-urbanization will almost certainly aggravate social instability.

1. Introduction

According to the United Nations Population Division, by 2030, the urban population of developing countries will exceed the rural population; by 2050, two-thirds of the population of these countries may live in urban areas. Urbanization is, currently, the key development path in every country worldwide. The problems derived from the process of development makes the study of urbanization very complicated [1]. The impact of urbanization not only occurs with regard to territorial movements but is also exerted on the environment, ecology, economy, society, and so forth [2]. There also exists research demonstrating that urbanization is significantly related to the prevalence of psychiatric disorders, with a higher rate of urbanization being more likely to lead to a higher prevalence of psychiatric disorders [3,4]. As a developing country, China has, itself, experienced a series of problems in the process of urbanization, e.g., a soaring population and environmental pollution directly caused by uncontrolled land use [5,6,7,8]. Previous studies, especially in English language articles, have provided relatively limited commentary on the semi-urbanization of China’s population, with no study of this semi-urbanization from the perspective of land supply. Some exceptions contribute primarily to the description of problems arising in the process of China’s urbanization. However, analyzing the cause mechanism of the semi-urbanization of China’s population, particularly from the perspective of land supply, remains a gap that urgently requires further investigation. The current paper aims to fill this gap so as to contribute useful insights in dealing with the challenges generated by the process of urbanization.
China’s Hukou Policy1 divides the population into rural hukou and urban hukou, and the hukou system links people’s accessibility to state-provided benefits and opportunities [9]. Urban hukou holders are allowed to enjoy better social welfare such as pensions, medical insurance, and education, so hukou significantly affects personal life in many aspects. The number of migrants from rural areas began to rise in the 1980s, because the development of labor-intensive and export-oriented industries in China stimulated the demands for cheap labor [10]. However, hukou conversion restrictions limited the ability of rural laborers to move from rural areas and register in urban areas—even if they worked and settled in the urban areas [11]. Hence, the discrepancy between the urbanization rate of “permanent residents” and “registered residents” arose, and China’s path towards urbanization has recently encountered the dilemma of “semi-urbanization”2, that is, where a rural household’s labor force is employed in the city, but their hukou remains in the rural area; the rural household’s labor force lives in the city, but their social and economic rights in the destination area remain limited, leaving them as a “secondary class” citizen in the destination area. This growing phenomenon can seriously hamper the development of population urbanization and is also not conducive to economic development or to the harmonious construction of society. China’s National New Urbanization Plan (2014–2020) set the target that the urbanization rate of the permanent population would increase to 60% in 2020, that the urbanization rate of the registered population would increase to 45%, and that the rate of population semi-urbanization3 would decrease to around 15%. In 2020, the rate of urbanization of China’s permanent population exceeded 60% (reaching 63.89%), but the urbanization rate of the registered population lagged far behind, at only 45.40%, with the rate of population semi-urbanization being over 15% (reaching 18.49%, see Figure 14). Considering this situation, it will arguably prove difficult for China to achieve the goal of reducing the rate of population semi-urbanization to 15%. In light of this challenge, how to solve the dilemma of semi-urbanization and promote the development of harmonious urbanization has become topical focus of attention in both academic research and policy making.
The emergence of population semi-urbanization is also accompanied by a peculiar phenomenon: population urbanization is seriously lagging behind land urbanization [12]. There is an imbalance between land urbanization and population urbanization [13]. The pace of urban land expansion in China measured by its built-up area was 1.44 times that of the increase in permanent residents from 1990 to 2000. From 2000 to 2015, the difference between the two even expanded to 1.94 times, far beyond the reasonable level of 1.12 [12]. As an important factor of production, land resources play an irreplaceable role in regional economic growth [14]. Land finance [13,15] and land-motivated investment [16,17] are the main elements of prefecture-level governments’ intervention when allocating regional economic resources through the transfer of land use rights. Local governments control the supply of land between industrial, commercial, and residential use. In the process of government intervention in the allocation of land resources, some novel phenomena have emerged in China: the supply proportion of industrial land is much higher than that of commercial and residential land; the price of residential land is significantly higher than that of commercial land and industrial land; and the price of residential housing is also correspondingly significantly higher than that of office buildings or even commercial buildings. The proportion of industrial land is much higher than that of residential land; as a result, the supply of residential land is being squeezed, and the price of such land is rising sharply. This imbalanced land supply structure needs to be corrected urgently, for two reasons. Firstly, the demand for residential housing in China is increasing, but the rapidly rising housing prices mean the vast majority of the middle and lower classes are unable to afford houses. Secondly, there is a presence of “quasi-residential housing” corresponding to residential housing built on land not formally or officially classified and designed as residential. This type of housing has been transformed from commercial buildings, office buildings, or even industrial factory buildings, but these “houses” offer poor and unsafe living conditions. Urban residential housing is one of the main factors affecting population urbanization [18]. The rapid expansion of industrial land, however, is accelerating the process of land urbanization and thus seriously hindering population urbanization. If China does not coordinate the urban land supply structure, the harmonious promotion of urbanization will undoubtedly be negatively affected. From this point of view, the study of population urbanization must necessarily take into account the land supply structure.
Despite the necessity of studying population urbanization from the perspective of land, for a long period of time, academic research has tended to focus on factors pertaining to registered residence and human capital; only a few studies have been conducted from the perspective of land. However, the body of land research mainly discusses the impact of China’s farmland system on rural flight from the perspective of this exodus. These studies neglect the perspective of city land supply structure and government competition in terms of achieving performance indicators. In China, local urban governments have absolute control over the primary land supply market [12,19,20,21], making it both inevitable and feasible for local governments to use land elements to create revenue and attract external investment; this, in turn, means that land resources create tools for local governments to compete in performance indicators. With this absolute control, local governments determine the supply structure of the different types of land in each city [22,23]. In order to maximize revenue and attract external investment, local governments often adopt the “two-handed” land supply strategy. That is, on the one hand, local governments reduce the proportion of commercial and residential land and adopt the strategy of “bidding, auction and listing” to increase commercial and residential land prices (we regard such behavior as land finance). On the other hand, local governments supply industrial land on a large scale and transfer industrial land at a low price through subsequent agreements to attract external investment (we regard such behavior as land-motivated investment). This “two-handed” land supply strategy caused by competition among local governments tends to result in an imbalanced land supply structure, which will, in turn, have a significant impact on settlement costs for immigrants from rural areas, thus making it difficult for them to truly settle in urban areas [24].
In light of this context, the current paper explores the causes of China’s semi-urbanization in depth, aiming to prove the existence of a key, hypothesized formation mechanism of population semi-urbanization: that an imbalanced land supply structure caused by government competition leads to the semi-urbanization of the population. Overall, the main contribution of this paper is that it not only discusses the intermediary role of land supply structure as a key factor between government competition and population semi-urbanization, but also integrates the two major land factors pertaining to population semi-urbanization, land finance and land-motivated investment, which are driven by local urban government competition in performance indicators (see Figure 2). It may also be seen as beneficial to further study the semi-urbanization of the population in similar developing countries.
The rest of the paper is organized as follows: In Section 2, we analyze the impact mechanism of land supply structure on the population semi-urbanization under conditions of government competition in terms of achieving performance indicators by means of land finance and land-motivated investment. We introduce relevant variables and data sources and construct the Mediation Model in Section 3. Section 4 is the empirical test results and analysis, and Section 5 concludes, with a discussion on implications of this study and suggestions for future research.

2. Impact Mechanism Analysis

In the context of the political promotion of government officials based on performance appraisals such as GDP growth rate [25,26], China’s prefecture-level city governments have launched a series of financial competitions for political promotion [27]. Given that local governments’ monopoly of the land supply system helps them to attract investment and bring about long-term economic growth [28], these governments have been known to transfer a large amount of industrial land at low prices in order to attract external investment. This causes enterprises to occupy the latter and further perpetuates the excessive supply of industrial land. However, land resources are limited. The excessive occupation of land for industrial purposes reduces the supply of commercial and residential land. Under the effect of the Supply–Demand Theory, the price of commercial and residential land rises, which then generates high land revenues for the given local government. At the same time, the latter body hopes that the price of commercial and residential land will remain at a high level, because this will generate substantial land transfer fees and subsidize the loss caused by transferring industrial land at a low price. Land sale strategies thus expand local governments’ income until it reaches the optimal level. However, the government’s optimal land sale strategy results in the distortion of the land supply structure. This is because a large amount of industrial land is supplied and commercial and residential land is contracted, which undoubtedly raises the price of commercial and residential land and pushes up housing prices. As a result, the living costs for immigrants from rural areas in cities and towns rises sharply, hindering their migration to and settlement in cities, and leading to the semi-urbanization of this population, whereby the latter lives in cities but is unable to buy a house and register in urban hukou. In most cities with a developed economy and a large population inflow, there are two main ways to obtain a local urban hukou: owning a property in the local urban environment or through talent introduction policies, such as a high-tech talent, which can help obtain an urban hukou without additional conditions [29,30]. For the vast majority of immigrants from rural areas, they are poorly educated people, and most of them are engaged in labor-intensive, low-end manufacturing. It is difficult for them to obtain a local urban hukou through talent introduction policies. Therefore, buying a house in the local urban area has become their main way to obtain an urban hukou. If immigrants from rural areas do not have an urban hukou, they cannot be treated as registered residents and cannot enjoy the privilege of urban residents such as preferential entrepreneurship policies for urban hukou owners, urban medical insurance, and better educational resources for their children [31,32,33,34]. However, as mentioned above, the government’s land allocation has led to a rapid rise in housing prices and hindered them from obtaining an urban hukou through owning a house property. Considering these dynamics, the current study examines the influence mechanism of the land supply structure on the semi-urbanization of the population under conditions of government competition in terms of achieving performance indicators. As such, this study highlights the leading role of land finance and land-motivated investment in said competition.

2.1. Influence Mechanism of Land Finance on Population Semi-Urbanization

Land finance that local governments reduce the proportion of commercial and residential land to increase incomes from these land transfers is an important means by which local governments can develop a regional economy [35]. Additionally, high revenue from commercial and residential land transfers is an important source of income for local governments to carry out urban construction [36], in turn providing the necessary conditions for these governments competition in promoting local economic growth by relying on high land transfer fees. Meanwhile, tax-sharing reform5 weakens the financial power of local governments and reduces the types of taxes exclusive to local governments and the proportion of local governments in large-scale sharing taxes. As a result, the tax revenue of local governments decreases significantly. Tax revenue is the main general budget revenue of local governments, and its sharp decline has led to a financial gap of local governments. There is widespread academic belief that, under the pressure of tax-sharing reform, in order to compensate for the financial gap, the phenomenon of local governments relying on land development and urban construction to obtain land finance is growing increasingly serious [37,38]. At the same time, for the purposes of political promotion, the government has tended to pay more attention to the index ranking related to GDP growth and fiscal revenue [39,40,41]. Ultimately, whether it is to compensate for the financial gap or to stand out amid the fierce political promotion landscape, local governments have a strong competitive motivation to obtain significant land finance through “land management” [42]. Tang et al. (2014) applied a spatial econometric model based on provincial-level panel data from 1999 to 2007. The study found that local governments will imitate their neighboring governments to make the same decision [43]. Shang et al. (2018), through a quantitative comparison analysis with 66 so-called innovations in performance management of China’s local governments, found that local governments imitate each other. Further, the study argued that the incentives offered in China’s bureaucratic system may result in such an outcome [44]. These findings indicate the existence of peer effects motivating local governments to use land elements in order to compete for high revenues derived from land transfers.
Based on the data of 300 cities in the United States from 2000 to 2009, Huang and Tang (2011) conducted an empirical test on the relationship between the restrictive supply policy of residential land and housing prices, finding the restrictive supply of residential land to be a major reason for the rise in housing prices [45]. Wen and Peng (2016) used data pertaining to 281 cities at prefecture level and above in China to verify that the rapid rise of housing prices was not conducive to the urbanization of immigrants from rural areas, and that the unreasonable land supply structure was the basic reason for the increase in house prices [46]. Fan et al. (2021) used the data of 282 prefecture level cities in China, from 2001 to 2016, to empirically test the relationship between local governments’ strategic land supply behavior and housing prices. The study found that the decline in the proportion of commercial and residential land supply significantly pushed up housing prices during the study period [47]. From these studies, it becomes evident that against the institutional background of the primary land market monopoly, China’s local governments’ biased land transfer strategies have given rise to an imbalance in the land supply structure [48]. Subsequently, the rising price of commercial and residential land directly increases cost of living for immigrants from rural areas in cities and towns, hindering their migration and settlement in these areas, and ultimately turning them into a semi-urbanized population. Most of the people in this group are socio-economically disadvantaged. Compared with urban residents who own urban hukou, a significant proportion of the semi-urbanized population are poor and do not benefit from access to the same medical insurance, social welfare, and so on, as the former. In the short term, it is difficult to improve the situation of these groups. An increasing number of immigrants from rural areas will mean an increase in the urbanization rate of the permanent population, but the urbanization rate of the registered population lags far behind the former, making it difficult for the rate of population semi-urbanization to decline. Based on the above analysis, this paper proposes the following hypotheses:
Hypothesis 1.
The local governments’ reliance on land finance competition will affect the semi-urbanization of the population by intervening in land supply prices. The higher the residential land transfer fee is, the higher the ratio of residential land price to industrial land price is, and the higher the rate of population semi-urbanization will be.
Hypothesis 2.
The local governments’ reliance on land finance competition will affect the semi-urbanization of the population by intervening in the land supply area. The higher the land transfer income is, the higher the ratio of industrial land area to residential land area is, and the higher the rate of population semi-urbanization will be.

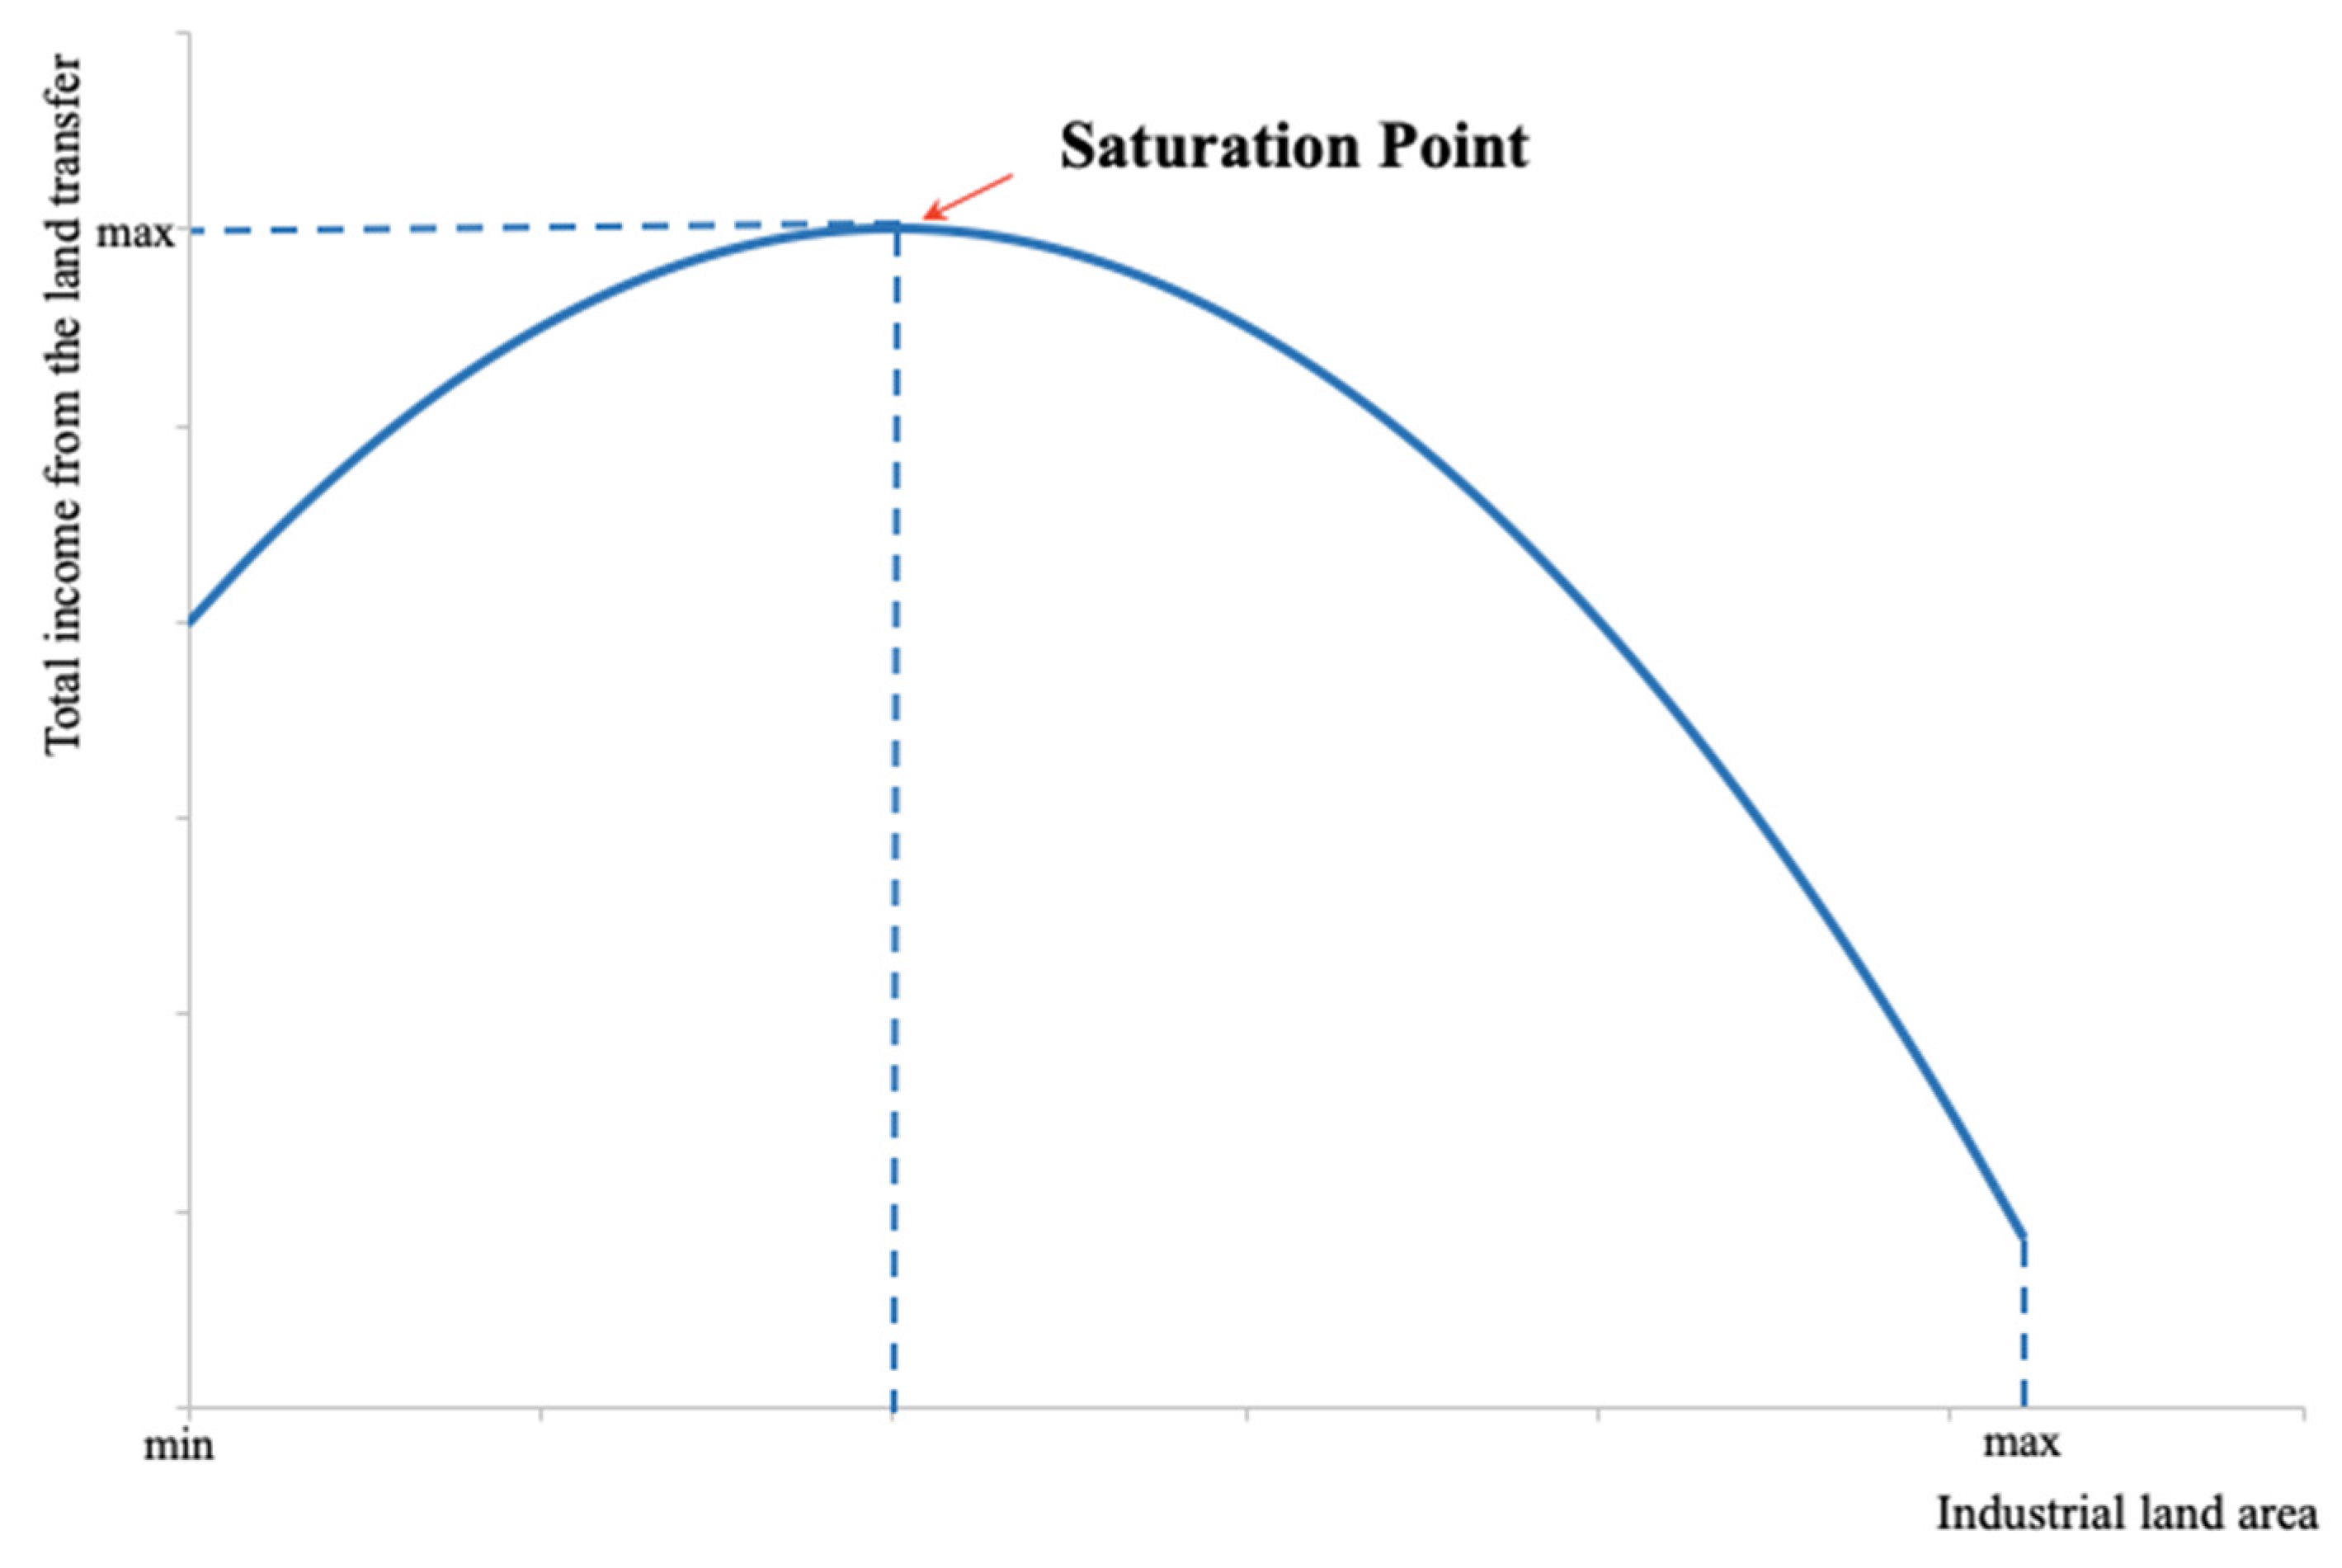
2.2. Influence Mechanism of Land-Motivated Investment on Population Semi-Urbanization

Under the premise of GDP as the main assessment index, in addition to relying on the high income of commercial and residential land transfers to improve their fiscal revenue, and in order to develop the local economy, China’s local governments can also transfer a large amount of industrial land at a low price in order to attract external investment (and launch competitions for the same purpose) [49,50,51]. On the one hand, a large number of industrial land transfers at low prices bring about long-term economic growth, tax revenue, and employment to local governments, which is in line with these governments’ preference for long-term, stable urban development. Some scholars have interpreted this behavior as a “subsidy” on attracting investment by selling industrial land at a low price [19,38]. On the other hand, the price of industrial land is closely related to residential land prices and housing prices [47,52,53]. Local governments attract investment through the excessive supply of industrial land at low prices; according to the Supply–Demand Theory, the price of commercial and residential land will rise, meaning that local governments can obtain substantial land transfer income to horizontally subsidize the losses caused by the low-price transfers of industrial land [54,55]. In this favorable situation, the given local government will be increasingly inclined to adopt this distorting land transfer strategy, even though this excessive reliance on land for the purposes of attracting investment will inevitably lead to an imbalance in the land supply structure [54]. The latter will, in turn, lead to a rise in house prices, making it difficult for the immigrants from rural areas to settle in cities, turning them into a semi-urbanized group. Based on empirical research of China’s urban household survey data, Chen and Yang (2013) found that the local governments’ monopoly of the land supply is the main factor driving up housing prices, whereby the lower the supply of residential land, the higher the housing prices [56]. Based on the panel data of 105 cities in China, Xie (2018) demonstrated the mechanism of land supply intervention affecting the smooth progress of urbanization through residential segmentation, finding that such intervention significantly expanded the income gap between urban and rural areas [57]. The higher the ratio of residential land price to industrial land price, the bigger the income gap between urban and rural areas, which will then affect the smooth progress of urbanization. Based on the above analysis, this paper puts forward the following hypotheses:
Hypothesis 3.
Local government competition’s reliance on land-motivated investment will affect the semi-urbanization of the population by intervening in land supply prices. The more significant the effect of attracting investment by the low pricing of industrial land is, the higher the ratio of the residential land price to industrial land price is, and the higher the rate of population semi-urbanization will be.
Hypothesis 4.
Local government competition’s reliance on land-motivated investment will affect the semi-urbanization of the population by intervening in the land supply area. The stronger the attraction of land-motivated investment is, the higher the ratio of the industrial land area to residential land area is, and the higher the rate of population semi-urbanization will be.

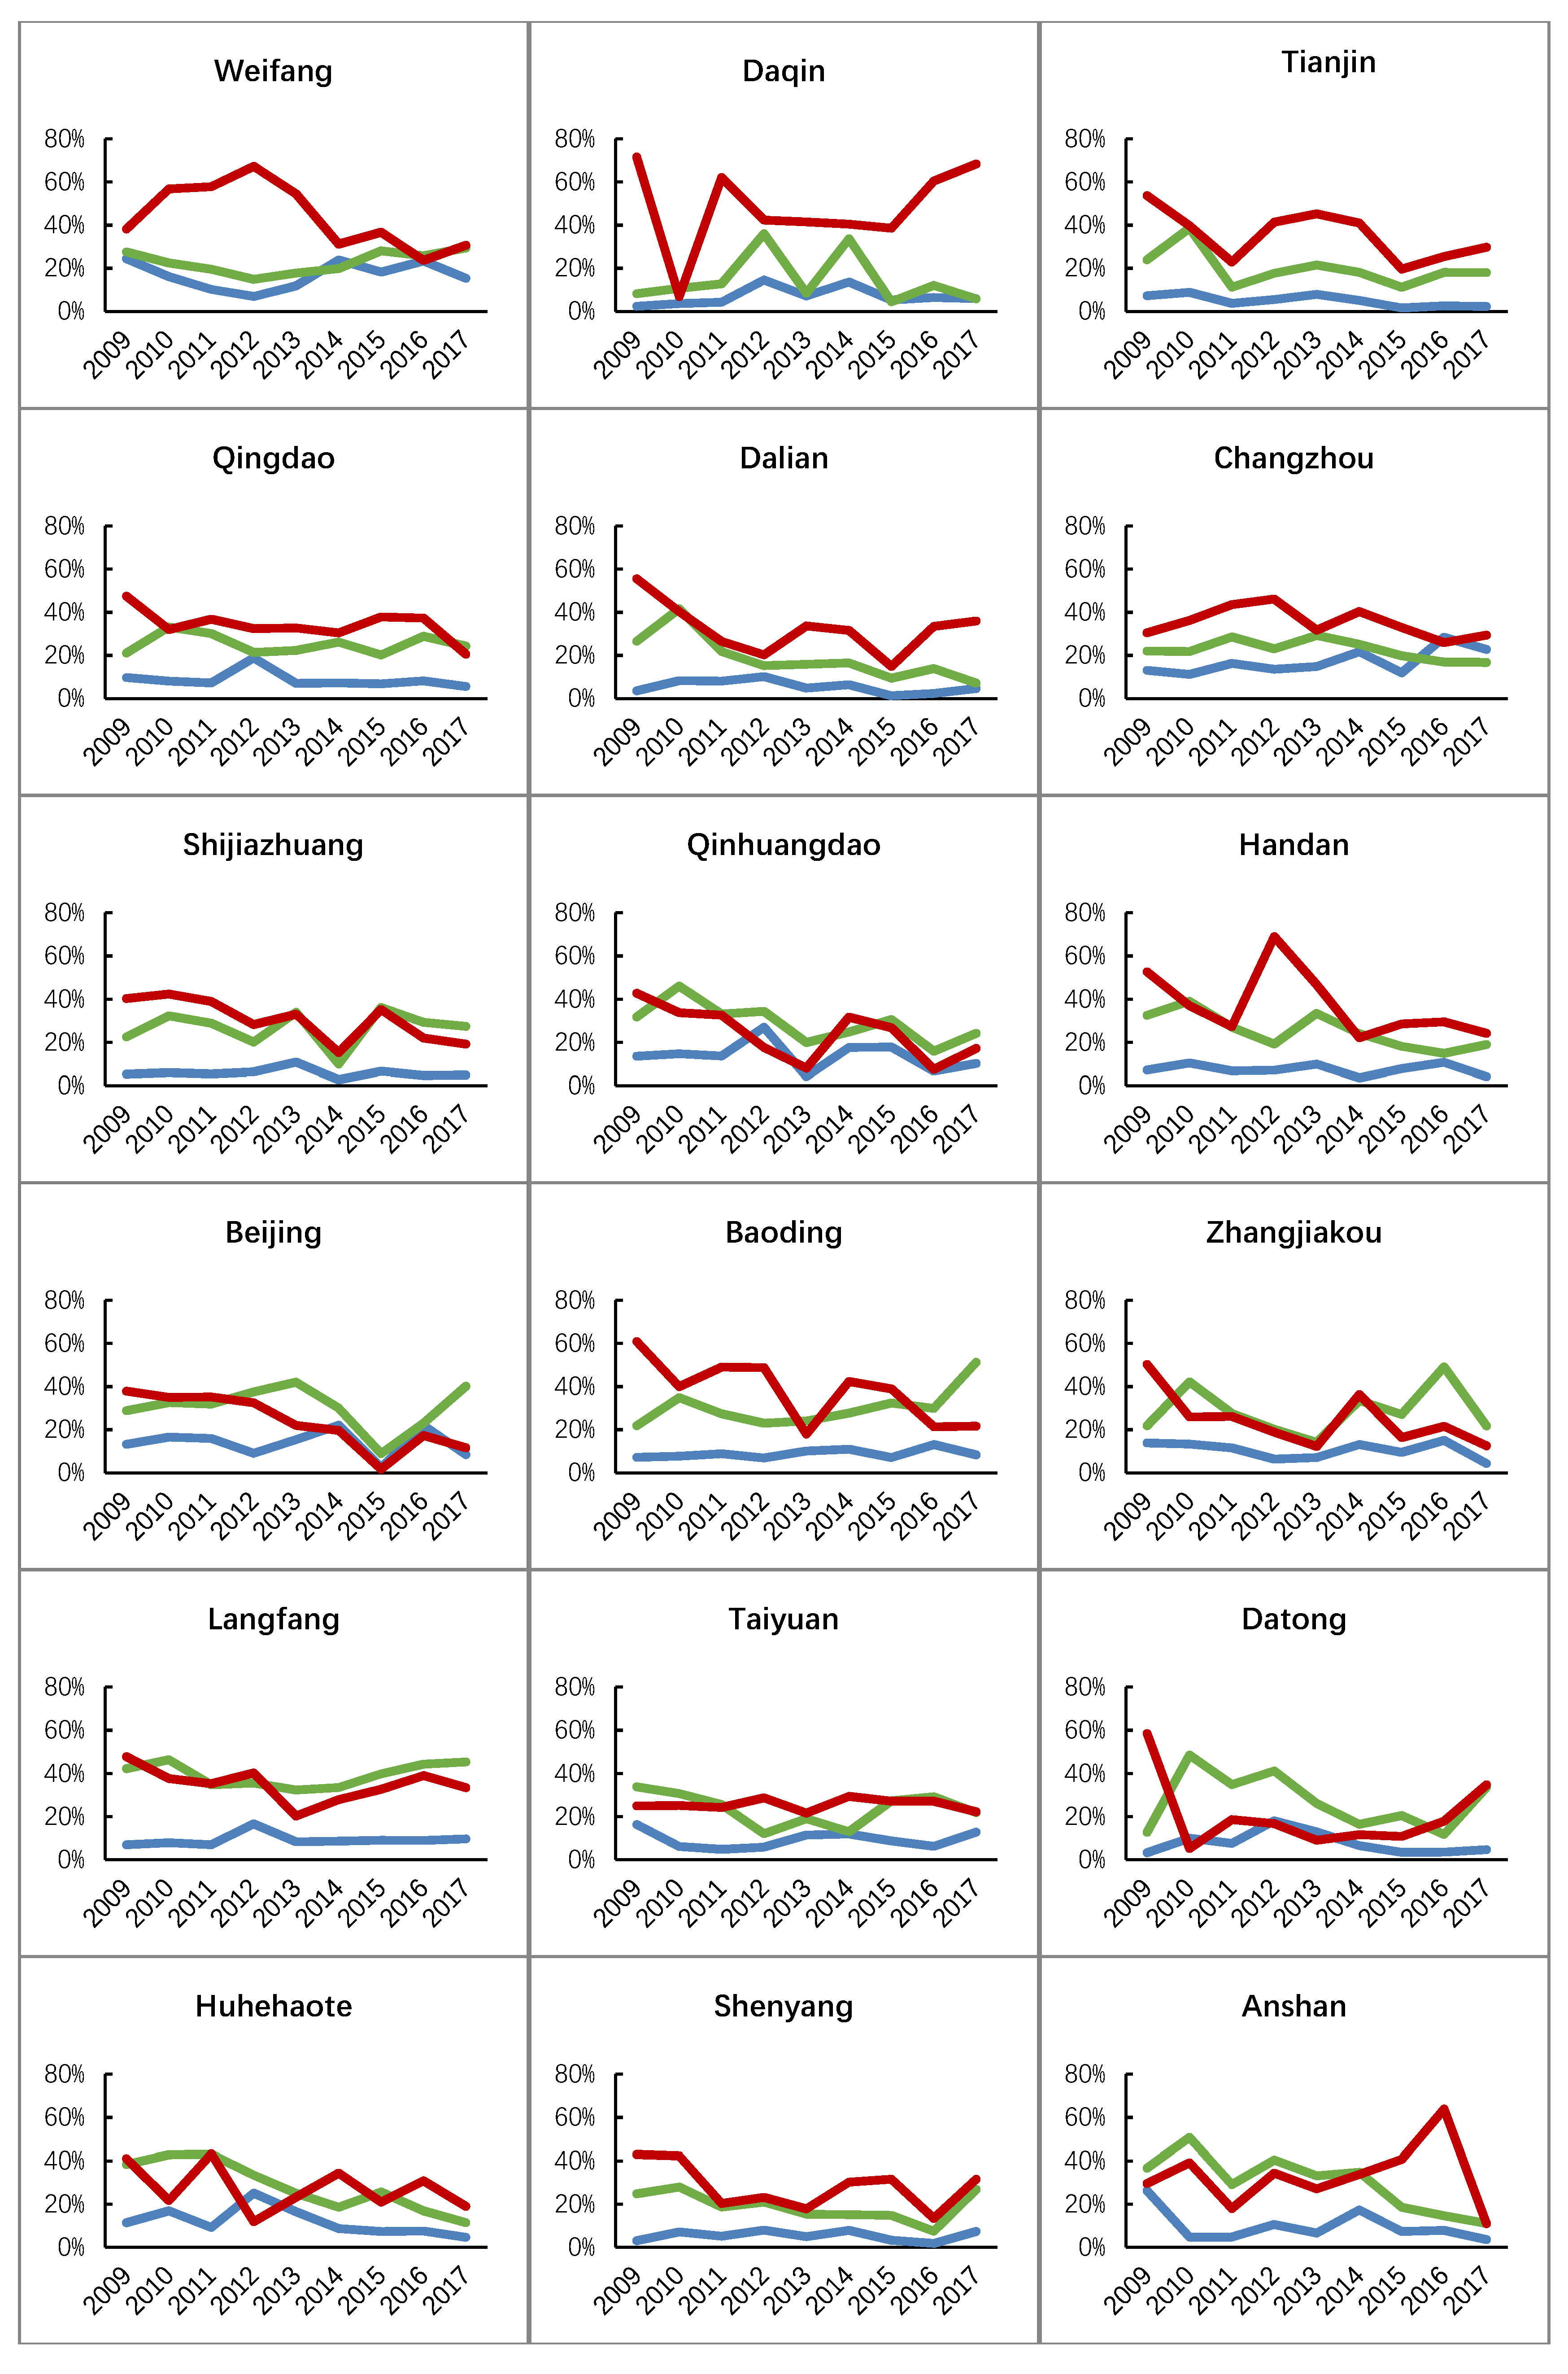
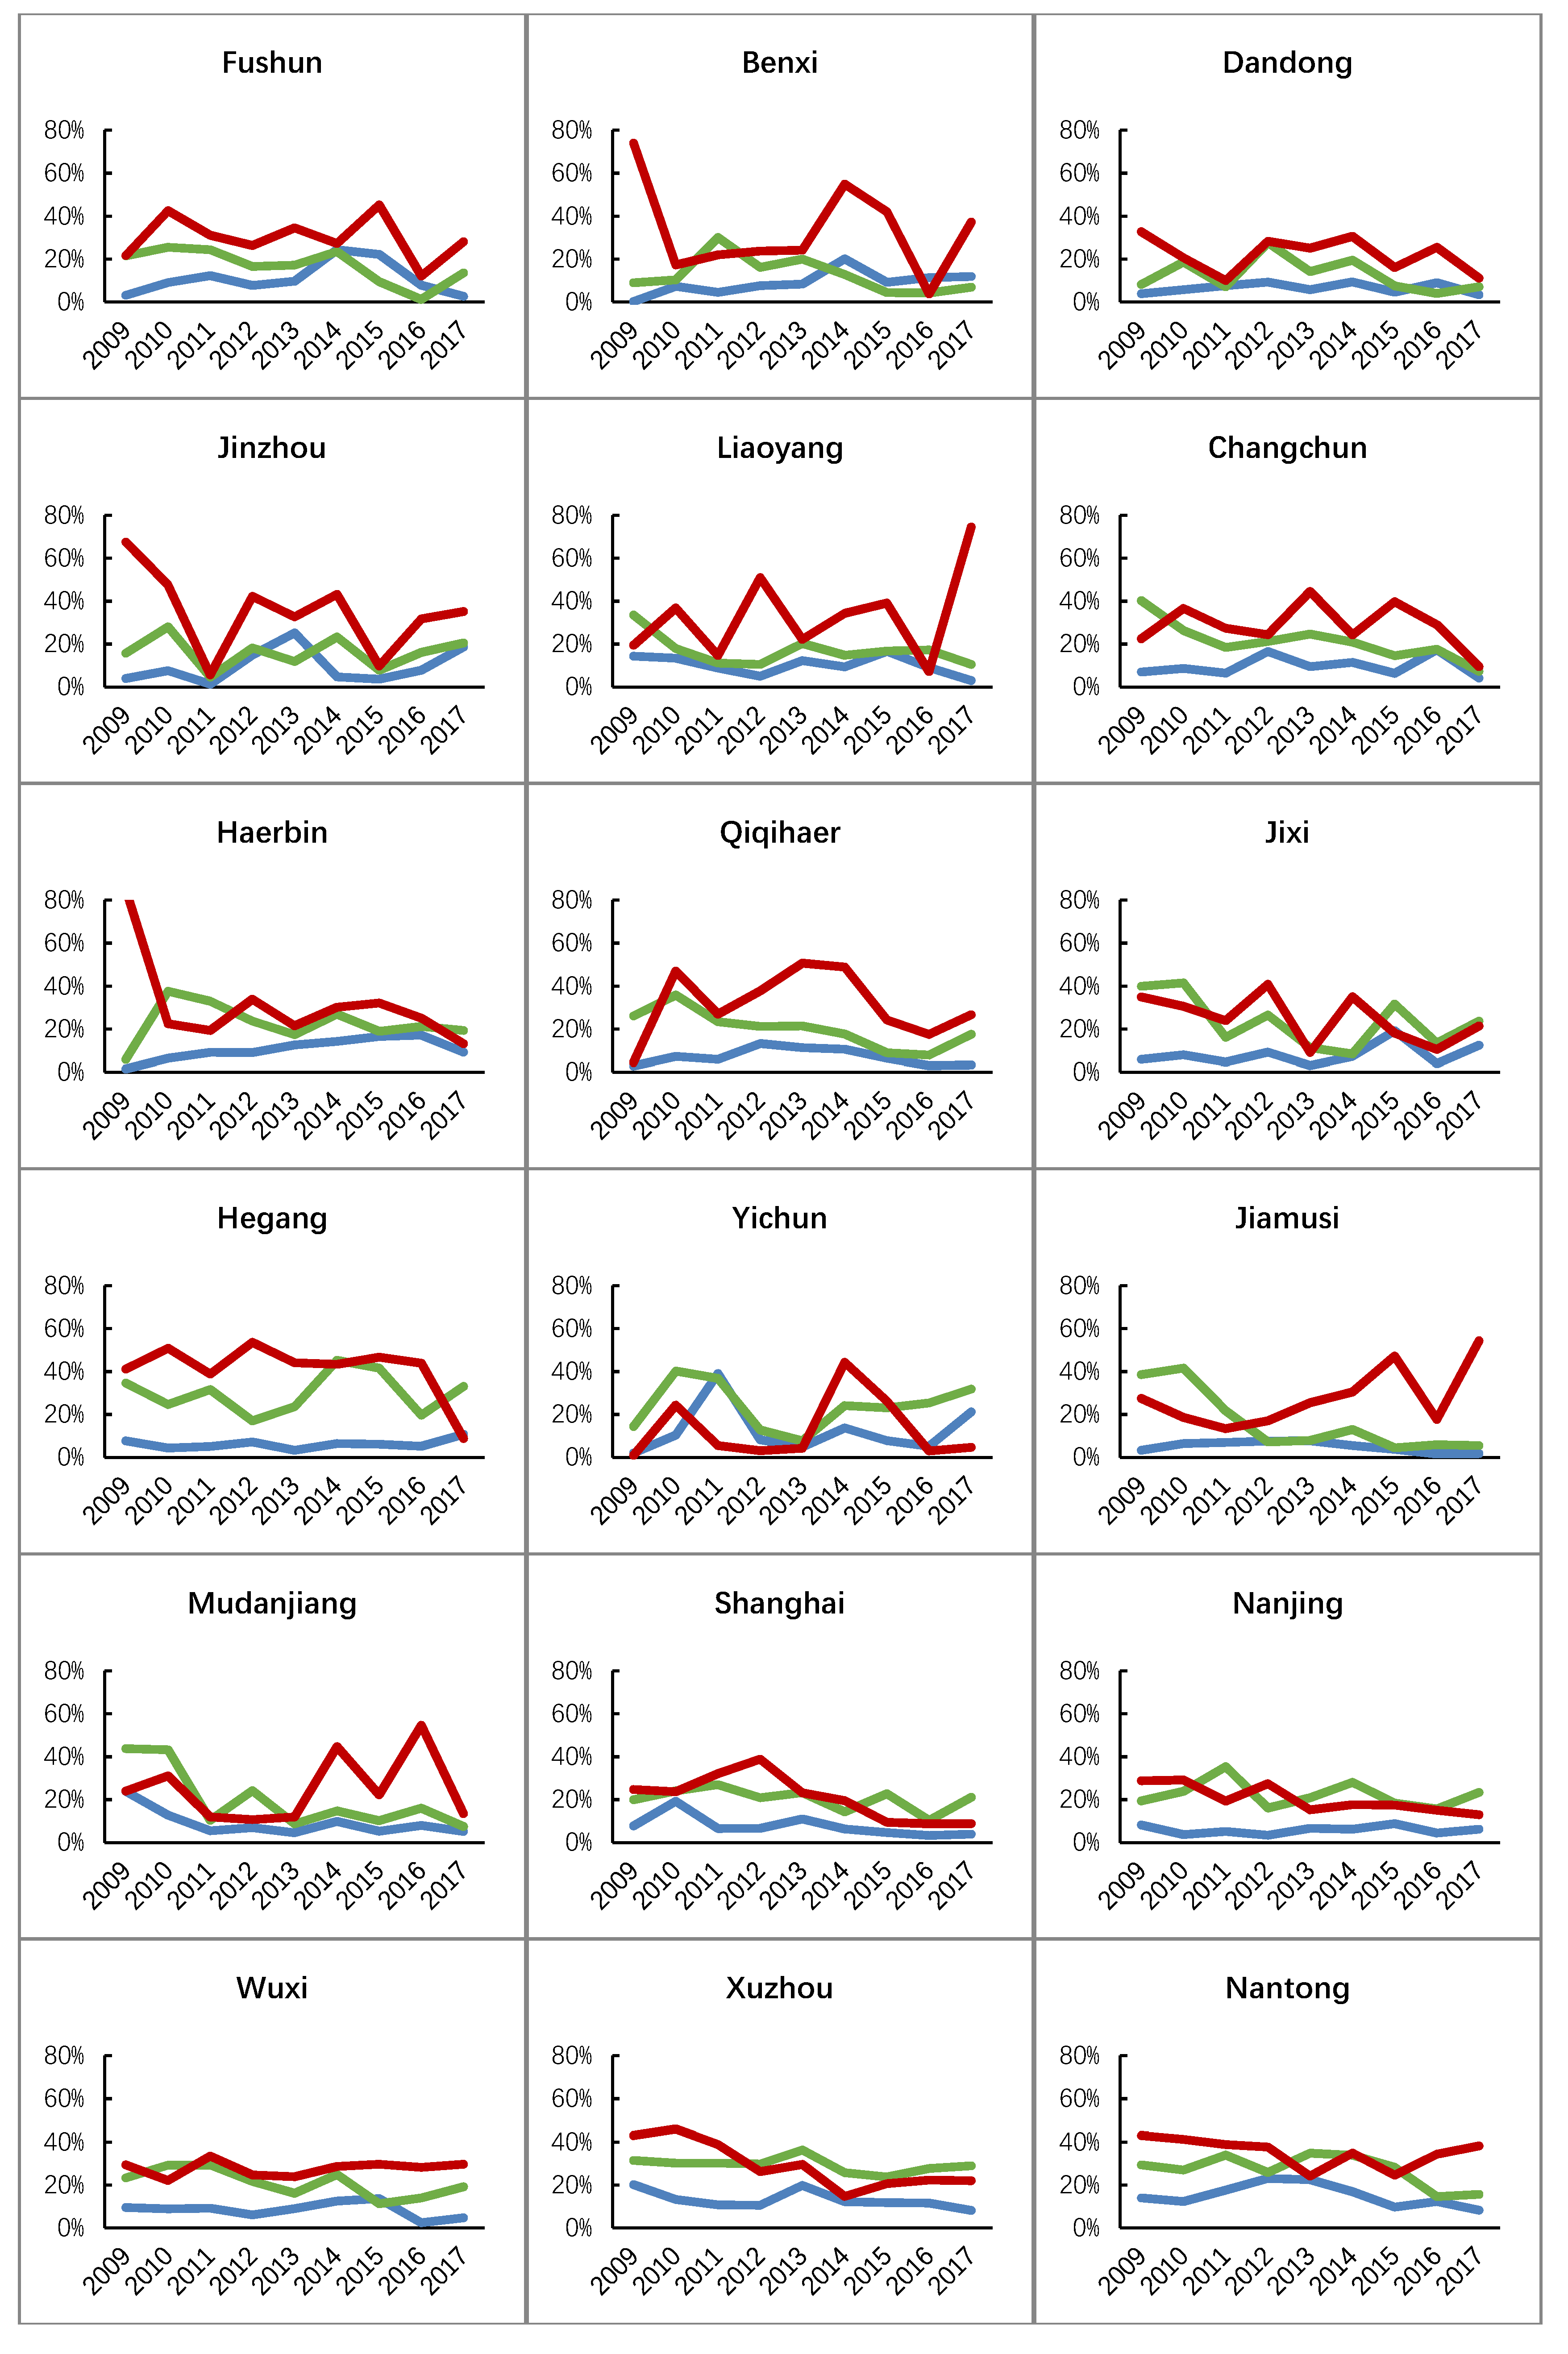
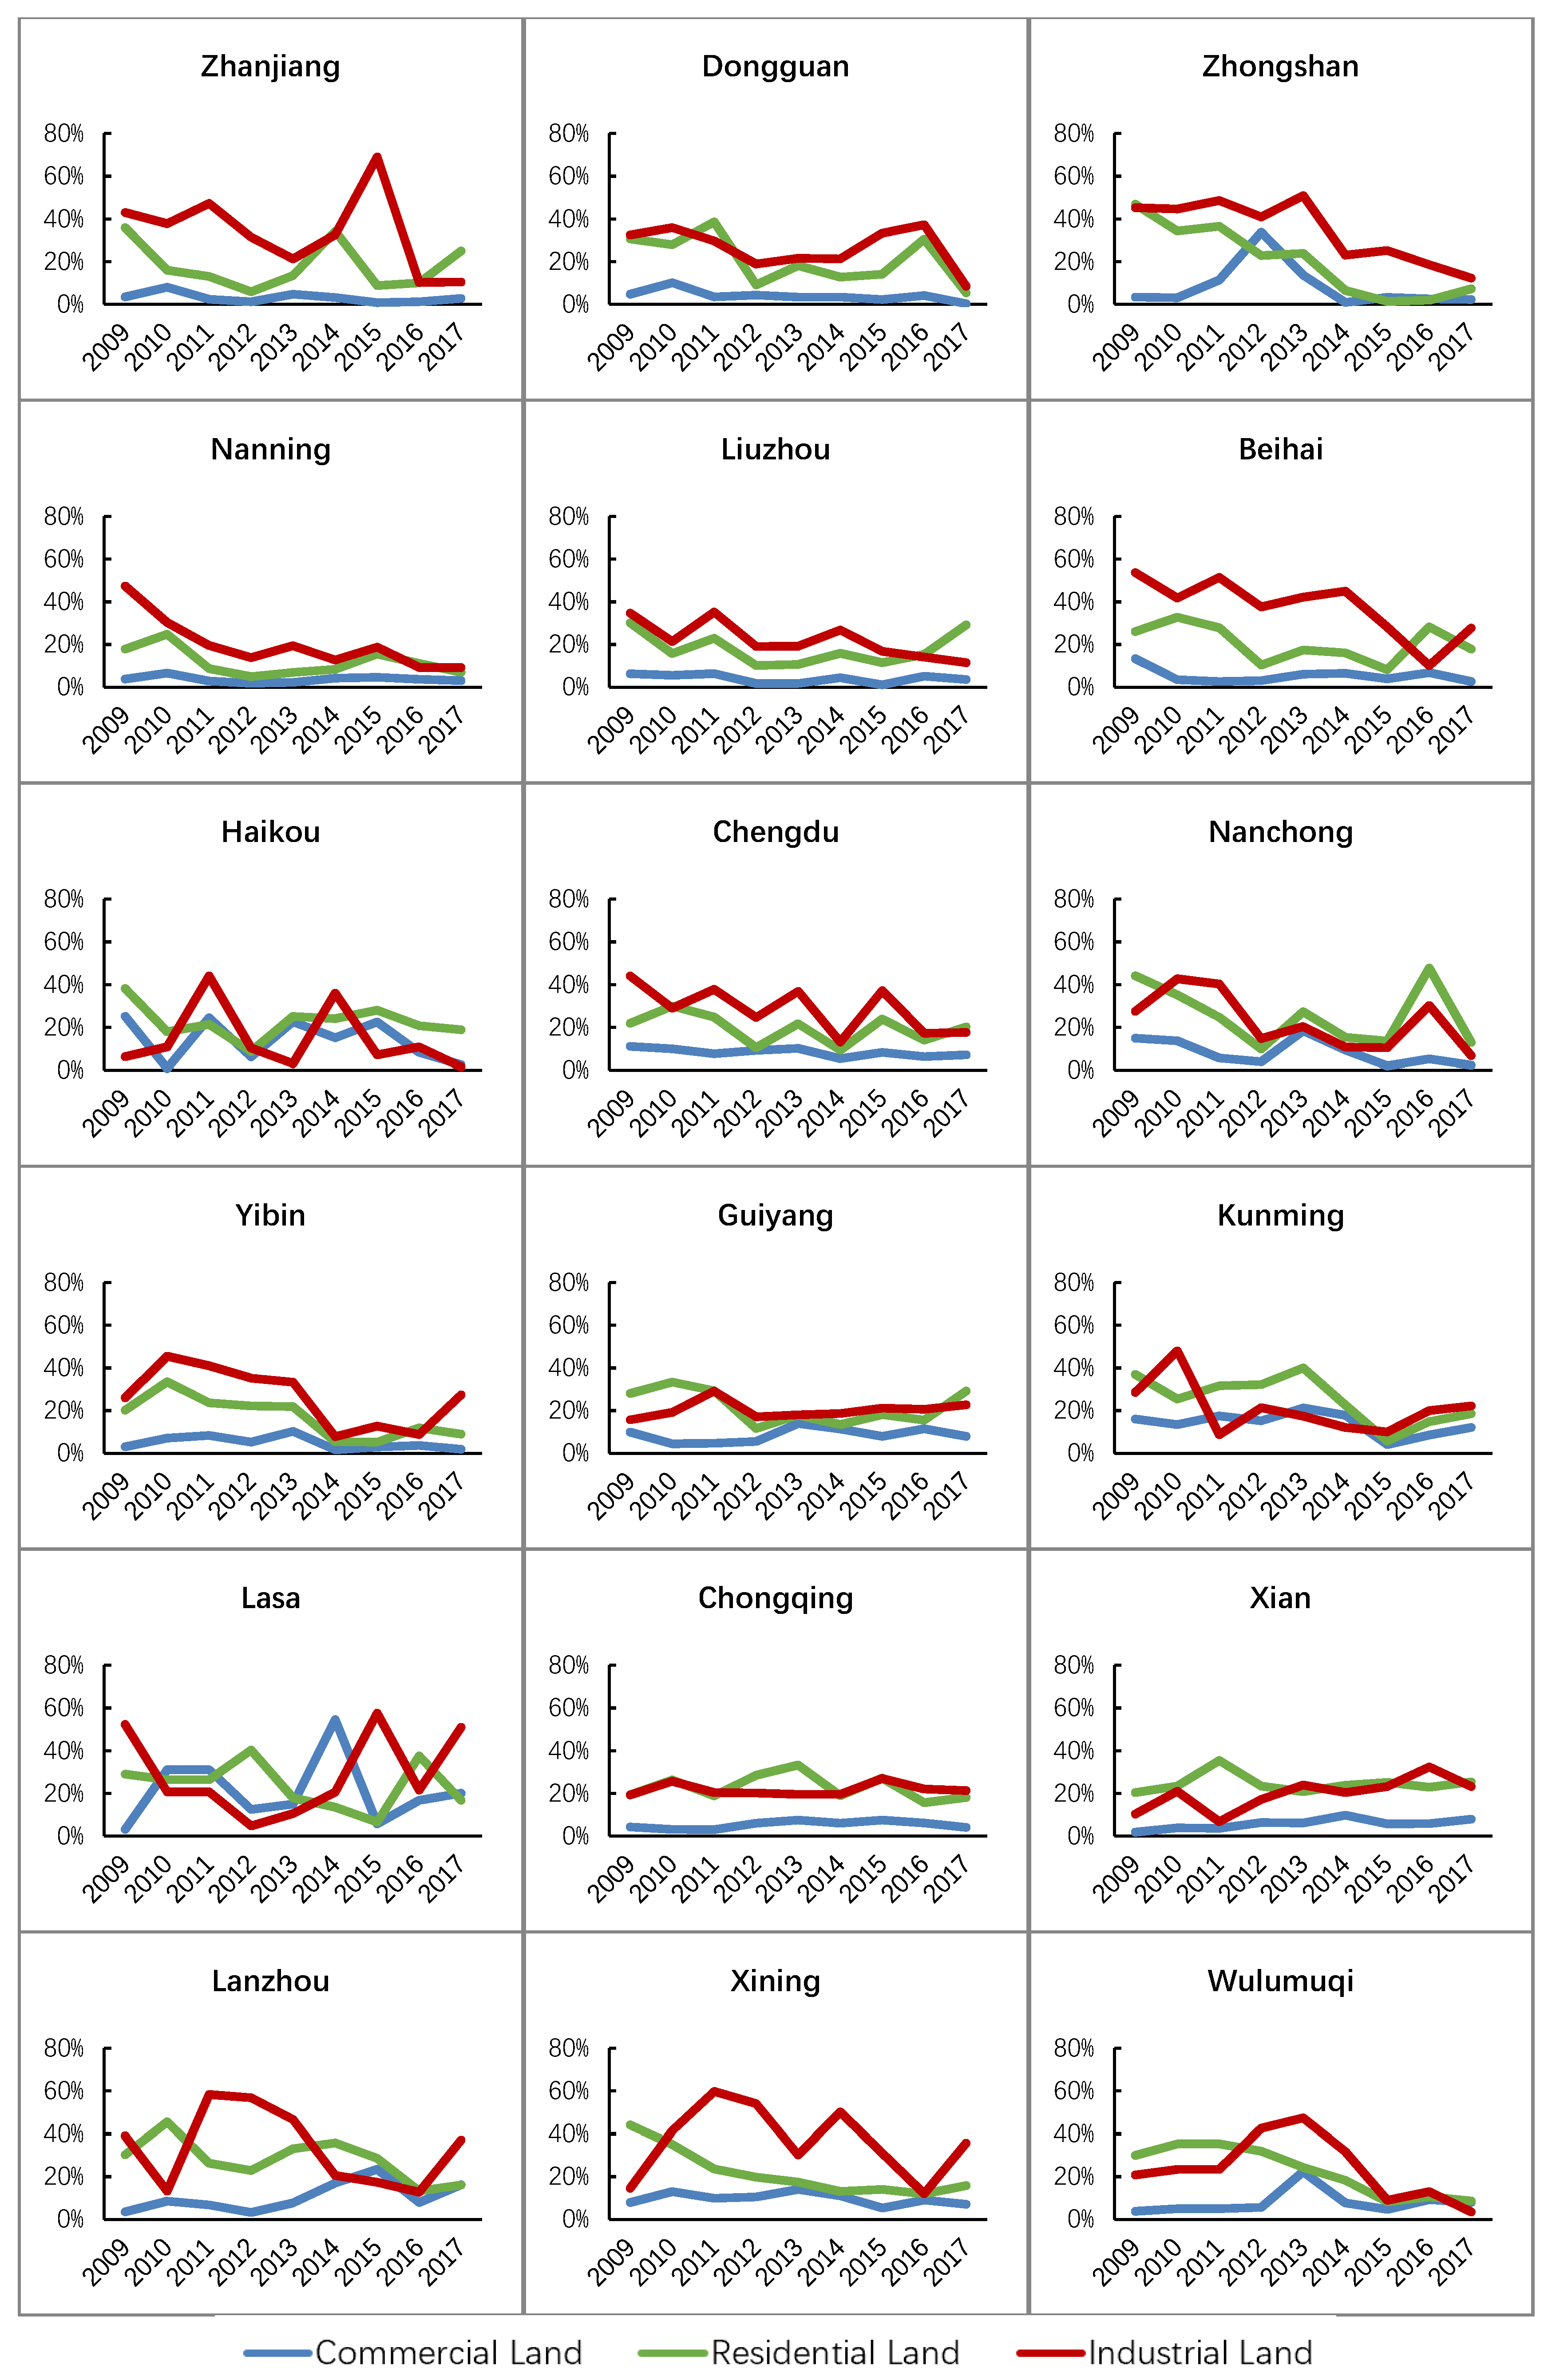
3. Model Construction, Variable Selection, and Data Sources

In Section 3, we first introduce the mediation model based on the intermediary theory in Section 3.1, which was proposed by Baron and Kenny in 1986 [58]. Additionally, based on the three-step test method of the mediation model (see Figure 3), we construct the general form of the models estimated in this paper (see Equations (1)–(3)) in order to explore whether the government competition will affect the population semi-urbanization through the intermediary variable of land supply structure. Then, according to the purpose of this research, the selection process of dependent variables, independent variables, intermediary variables, and control variables are explained in Section 3.2. Finally, Section 3.3 presents the data sources and descriptive statistics of this research.

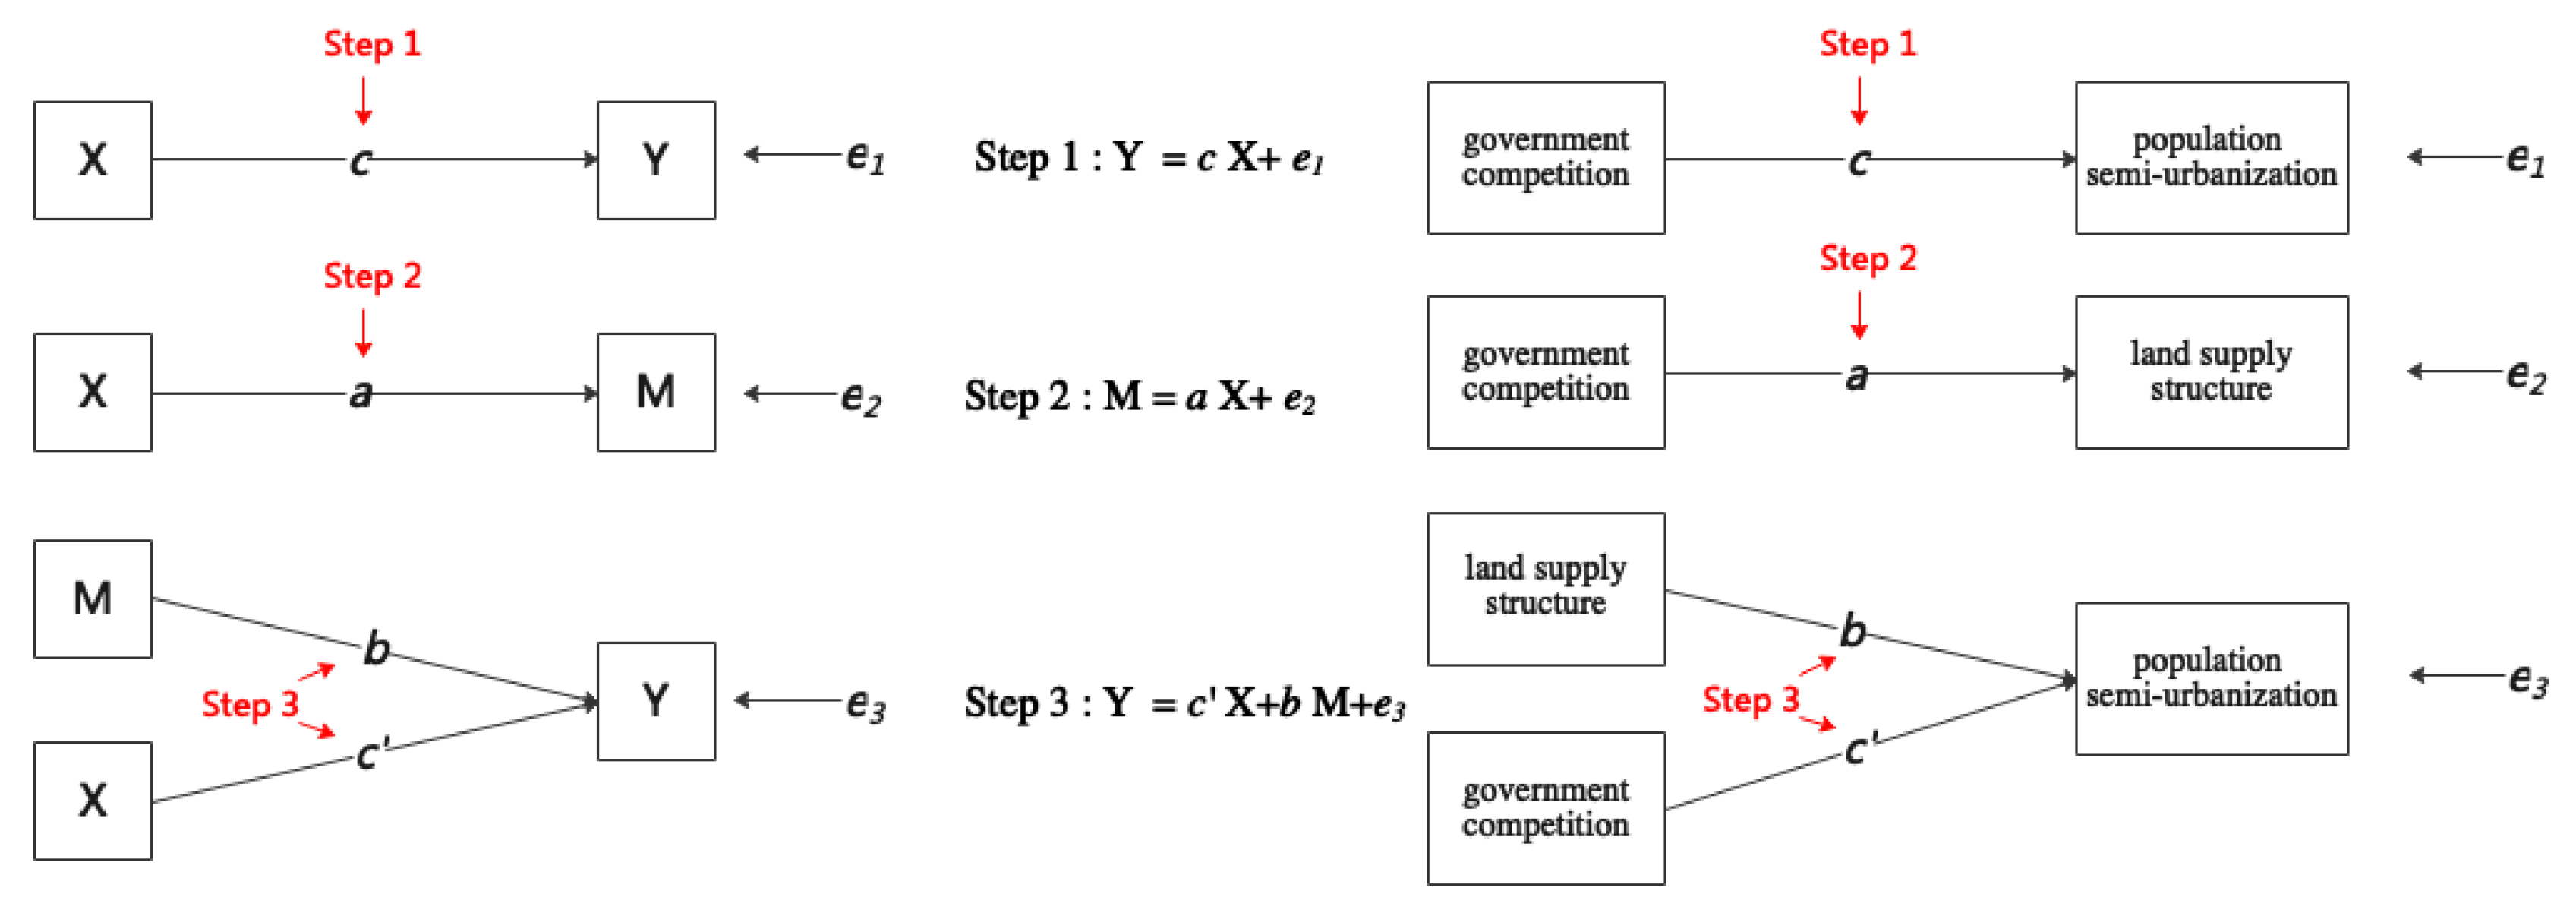
3.1. Model Construction

From 1925 to 1930, C. K. Ingold proposed the intermediary theory to explain the chemical behavior of molecules that cannot be satisfactorily described by the classical structural formula. On this basis, Baron and Kenny (1986) proposed the mediation model in 1986 to test whether the influence of independent variable X on dependent variable Y is realized through intermediary variable M [58]. The mediation model is now widely used in the fields of humanities and social sciences, histology, psychology, and so on [59,60,61,62]. As shown in Figure 3, the test is divided into three steps: first, the regression of X to Y is used to test the significance of the regression coefficient c and verify whether there is a causality between independent variable X and dependent variable Y (in this study, i.e., explore whether there is a causality between government competition and population semi-urbanization). Second, the regression of X to M is used to test the significance of the regression coefficient a and verify whether there is a causality between independent variable X and intermediary variable M in this study, i.e., explore whether there is a causality between government competition and land supply structure. Third, the regression of X and M to Y is used to test the significance of the regression coefficients b and c’, and verify whether there is a causality between intermediary variable M and dependent variable Y, and whether there is still a causality between independent variable X and dependent variable Y through intermediary variable M in this study, i.e., explore whether there is a causality between land supply structure and population semi-urbanization, and whether there is still a causality between government competition and population semi-urbanization through the intermediary variable of land supply structure. If the coefficients c, a, and b are significant, indicating that there is an intermediary effect, that is, the independent variable X affects the dependent variable Y through the intermediary variable M in this study, i.e., government competition affects population semi-urbanization through land supply structure. When the coefficients c, a, and b are significant but the coefficient c’ is not significant, meaning that the causality mechanism of the independent variable X on the dependent variable Y is totally transmitted through the intermediary variable M, this mediation effect is called full mediation; if the coefficient c’ is significant, meaning that the causality mechanism of the independent variable X on the dependent variable Y is partially transmitted through the intermediary variable M, this mediation effect is called partial mediation. The effect level of the partial mediation is often measured by ab/c or ab/c’ [63,64]. This paper aims to explore whether government competition affects population semi-urbanization through the intermediary variable of land supply structure, so we adopt the mediation model.
The models estimated will be of the general form:
Y it =   c   X it 1   + d   C it   + μ i   + ν t  
M it =   a   X it 1   + d   C it   + μ i   + ν t  
Y it =   c     X it 1   + b   M it 1 + d   C it   + μ i   + ν t   ,
where the dependent variable Yit is the investigated phenomenon (population semi-urbanization), Xit is one of the independent variables of interest (land finance or land-motivated investment), and Mit is one of the potential intermediary variables (land price structure or land area structure). Cit refers to the control variables, including economic development (pgdp), land resource endowment (nonagro), proportion of non-agricultural output value (resource), real estate development investment (estate), education resources (book), and related variables reflecting the unique characteristics of local government officials. In addition, the entity fixed effect, μi, and the time fixed effect, νt, were added to control the influence of individual city characteristics and common time trends. At the same time, in order to overcome the problem of endogeneity, the model used the one-period-lagged data pertaining to independent variables and intermediary variables. Although lagging variables cannot completely avoid the endogenous problem [65,66], it can solve the endogenous problem of the current period to a certain extent. Dormann and Griffin (2015) suggest that optimal time lags for panel designs should be short [67], so we adopt only one-period-lagged variables.

3.2. Variable Selection

3.2.1. Dependent Variable

The concept of population semi-urbanization includes the urban permanent population and its rate of urbanization, the urban registered population and its rate of the urbanization, the semi-urbanized population and its rate of semi-urbanization. To date, most scholars have measured the rate of population semi-urbanization using the difference between the urbanization rate of the permanent population and that of the registered population [46,68,69]. The definition of the rate of population semi-urbanization in geography textbooks in China is as follows:
the   rate   of   population   semi urbanization = urban   permanent   population the   urban   registered   population total   urban   and   rural   population × 100 % = the   urbanization   rate   of   the   permanent   population the   urbanization   rate   of   the   registered   population
Therefore, this paper uses the difference of the two urbanization rates to measure the rate of population semi-urbanization. Hou (2019) used the ratio of the two urbanization rates to measure the rate of population semi-urbanization; the higher the ratio of the urbanization rate of the permanent population to that of the registered population is, the more serious the population semi-urbanization is [70]. The former is the official definition of the rate of population semi-urbanization, which is more authoritative. The latter uses the ratio of the two urbanization rates to measure population semi-urbanization, which can also well describe the degree of population semi-urbanization, so we use the latter to carry out the robustness test. However, these two measures also have limitations. For example, they cannot well describe the immigrants from one urban area to another urban area who already have urban hukou, because if the immigrants from urban areas do not transfer their hukou from the original urban area to the new urban area, they will be counted into the urban permanent population instead of the urban registered population in the new urban area, and the rate of the population semi-urbanization will be overestimated in the new urban area.

3.2.2. Independent Variable

Land finance (fiscal): according to the existing literature research and analysis, most measures of land finance indicators are expressed by land transfer income [36,42,71,72,73,74], because residential and commercial land transfer fee has become one of the main sources of local governments’ general budgetary income, while some scholars have adjusted the scale per capita, measuring this by per capita land transfer income [75,76]. We argue that the absolute scale can better reflect local governments’ comprehensive strength in land finance, for which reason we used the former to measure land finance. Although the total value of land transfer incomes is related to land area, local gdp, or population, what we want to focus on is the government competition behind the land transfer, because it is the local government that formulates the land transfer strategy. For government competition, in terms of local economic growth, the local governments would like to pay more attention to the total value of land transfer incomes instead of per capita land transfer income and to achieving the maximum value of land transfer incomes. Therefore, we use the absolute scale.
Land-motivated investment (capital): FDI can reflect a city’s level of the attraction of its preferential land policies to foreign investment. Xie (2018) and Zhou et al. (2019) used the proportion of FDI in GDP to measure local governments’ preferential land policies for the purposes of attracting foreign investment [19,57]. The higher this proportion, the stronger the competitive edge in attracting foreign investment. Fu and Zhang (2007) used the ratio of each province’s FDI across China as a whole to express the government’s preferential land policies for attracting investment, whereby the larger this proportion, the stronger the competitive edge in terms of attracting foreign investment [77]. This paper uses the ratio of FDI and GDP of local cities to measure local governments’ preferential land policies in terms of attracting foreign investment. Although this proxy measure ignores the preferential land policies’ driving force for national investment, the main purpose of the local governments’ preferential land policies is to attract external investment. Therefore, we choose to focus on FDI, which is also the focus of other scholars when they define land-motivated investment indicators.

3.2.3. Intermediary Variable

Regarding the measurement of the land supply structure index, two indexes are commonly adopted: area and price [51,57,78,79,80,81,82]. The definition of the specific indicators differs slightly in line with the specific research aim. For example, Yang et al. (2014) measured the imbalance in the land supply structure using the transfer area size of industrial land and the proportion of industrial land transferred through an agreement6 between the local government and foreign enterprises about investing in the locality [51]. Huang et al. (2015) used China National Lowest Price Standard for Industrial Land Transfer, which is proposed by the central government as the benchmark to set the price of industrial land [79]. The standard divides China’s industrial land into 15 grades, and the lowest price standard for industrial land transfer decreases from 840 yuan/m2 in Grade 1 to 60 yuan/m2 in Grade 15; also, the industrial land grades of all counties and cities in China are clearly defined. On this basis, the deviation degree of the price of industrial land is measured and expressed by “(the transaction price—the lowest price standard) / the lowest price standard”. Agreement-transfer land always is transferred at a low price; some studies regard the quantity of agreement-transfer land as that of industrial land or low-price-transfer land. Li et al. (2016) regarded the proportion of the agreed transfer land area in the total land transfer as a measure of the imbalance of land supply structure, and use the proportion of industrial, mining, and storage land in the total transfer area as an alternative indicator, regarding the proportion of the “new” part of the land transferred by agreement in the total area of new transferred land as the second alternative indicator [80]. Xie (2018) used the ratio of the residential land supply area to total land supply area as the proxy variable of land supply structure distortion [57]. Yu and Cai (2018) measured the land supply structure by the supply proportion of residential land, industrial land, and infrastructure land, respectively [81]. Zhang and Yu (2019) used the ratio of the average price of residential land to the average price of industrial land in order to measure the degree of the land price distortion index [82].
According to the statistical description of the overall allocation of three types of land in 105 key7 prefecture-level cities in China, the allocation of industrial land is the most unstable and features a wide range of fluctuation, with a minimum value of 1.06% of industrial land proportion in the allocation of three types of land and a maximum of 85.14%, while the average proportion of industrial land is the largest, reaching 30.24% (see Table 1). As shown in Appendix A, the red line, representing industrial land, lies above residential and commercial land in most cities. That is to say the supply proportion of industrial land accounts for the vast majority of the three types of land. In line with this focus, we measured the imbalance of the land supply structure using the price structure (price) and area structure (area) indicators, which are here expressed by the ratio of the average price of residential land to that of industrial land and the ratio of industrial land area to residential land area.
price   structure = average   price   of   residential   land average   price   of   industrial   land   area   structure =   industrial   land   area residential   land   area

3.2.4. Control Variable

In view of the emergent research results pertaining to population semi-urbanization, we also added in the following control variables to reduce the bias caused by the omitted variables: (1) the level of regional economic development (pgdp) expressed by regional real per capita GDP. Regional economic development is closely related to the level of population semi-urbanization. For example, in the economically developed areas, there are often more immigrants from rural areas, and there is always a high level of population semi-urbanization. Therefore, we added this variable to control its influence on the results. (2) Land resource endowment (resource): expressed by per capita construction land area. Cities, with higher per capita construction land areas, may have more land transfer quantities, which will affect the intermediary variable of the land transfer structure. Therefore, we added this variable to control its influence on the results. (3) The proportion of non-agricultural industrial output value (nonagro) expressed by the ratio of the output value of the secondary and tertiary industries to GDP. There will be more intense government competition in the cities with developed secondary and tertiary industries, so we added this variable to control its influence on the independent variables and further reduce its influence on the results. (4) Investment in real estate development (estate) expressed by the actual investment in real estate development. Cities with developed real estate investment activities may have a booming housing market, which indirectly affects population semi-urbanization by affecting the housing supply. Therefore, we added this variable to control its influence on the results. (5) Educational resources (book) expressed by the total book collections of public libraries. Although the use of modern techniques is very widespread nowadays, many high-quality materials are also retained in the form of books, such as historical classics, professional books, and teaching materials. The total book collections of public libraries can reflect the education level of the regional population to a certain extent, which may indirectly affect the amount of the population of the semi-urbanization. Therefore, we added this variable to control its influence on the results.
In addition, in order to control for the influence of individual factors on decision-making behavior, the data pertaining to local government officials’ personal characteristics were introduced as control variables, including age, education, localization (whether the officials were appointed from within their local jurisdiction or other cities), and tenure. Age denotes the actual age of officials; education is measured as follows: 0 = below undergraduate level, 1 = undergraduate degree, 2 = master’s degree, 3 = doctorate or above; localization is measured by whether the local officials were promoted locally (1) or not (0); tenure is measured by the current length of their tenure, whereby if their term of office dates from January to June, it is calculated from the year of their appointment, and if this dates from July to December, it is calculated from the following year. In China, local governments have absolute control over land allocation. The government officials may be influenced by their personal characteristics in the process of decision-making. For example, young officials may pursue a more radical policy, while older officials may pursue a more conservative policy. Therefore, we introduced the control variables of local government officials’ personal characteristics to eliminate the impact of personal characteristics on the final results.

3.3. Data Sources and Descriptive Statistics

The observations used for this research comprise 105 key prefecture-level cities in China from 2007 to 20178. The data regarding the rate of semi-urbanization of the population were drawn from China National Bureau of Statistics (2007–2009, 2011–2017), China Sixth Census (2010), local statistical yearbook and bulletin (2007–2017), and EPS China Data (2007–2017). Data pertaining to land finance and land-motivated investment were taken from China Land Market (2007–2017) and EPS China Data (2007–2017), and missing data were supplemented by the local statistical yearbook and bulletin (2007–2017). The data relating to land price structure and land area structure were taken from China Land Market (2007–2017) and EPS China Data (2007–2017), with missing data supplemented by the China Land and Resources Statistical Yearbook (2007–2017) and the local statistical yearbook and bulletin (2007–2017). Personal characteristic data of government officials were collected from the official websites of each city, and the remaining data were mainly drawn from the China Urban Statistical Yearbook (2007–2017) and the China Regional Economic Statistical Yearbook (2007–2017). This study also applied the interpolation method to clean the data in cases of records with clear abnormalities. Table 2 presents the descriptive statistics of the main variables.

4. Empirical Test Results and Analysis

4.1. Testing the Hypothesis on the Impact of Land Finance on Population Semi-Urbanization

In the panel data model, in order to reduce the influence of endogeneity, this study took one-period-lag data for the explanatory variables of each regression model. Taking the land price structure as the intermediary variable to investigate the impact of land finance on population semi-urbanization, the regression results in Table 3 show that the increase of land finance brings about population semi-urbanization, and that one standard deviation of land finance increase will increase the rate of population semi-urbanization by 0.489 standard deviation (see Group (1.1) with control variables), which is significant at the level of 1%. One standard deviation of land finance increase will increase the price ratio of residential land to industrial land by 0.424 standard deviation (see Group (2.1) with control variables), which is also significant at the 1% level. However, when the land price structure is used as an intermediary variable and introduced into the Group (1.1) for regression purposes, the effect of land finance on the semi-urbanization of the population is not significant (see Group (3.1) with control variables); instead, it is the land price structure that affects the latter, indicating a full mediation effect. The coefficient of land price structure is 0.294, which is significant at the level of 1%, thus verifying Hypothesis 1 that land finance affects population semi-urbanization totally through the intermediary variable of land price structure.
When the land area structure is applied as an intermediary variable to investigate the impact of land finance on the semi-urbanization of the population, the increase in land finance reduces the land area structure (see Group (2.2) with control variables); that is, the ratio of industrial land area to residential land area decreases, and the decrease in this ratio increases the rate of population semi-urbanization. Thus, Hypothesis 2 is not supported. This then leads to the questions of why the ratio of industrial land area to residential land area does not rise with the increase of land revenue, and why the decline of this ratio pushes up the population semi-urbanization rate. To engage with these questions, we undertook further analysis.
Without considering the influence of other factors, in order to attract a large amount of investment, local governments in China tend to supply industrial land at a low price, but the land resources are limited. This strategy thus squeezes the supply of residential land, makes residential land scarce, and increases the income yielded by the residential land transfer in order to compensate for the loss incurred by transferring industrial land at a low price, ultimately increasing the total income obtained through the land transfer. We can regard this process as the stage of temporary increase (whereby total land transfer income increases in line with the increase of industrial land before the saturation point, see Figure 4). However, with the blind expansion of the supply of industrial land, the government’s optimal land sale strategy fails after reaching the saturation point. The income from the transfer of residential land is not robust enough to compensate for the loss caused by the low supply price of industrial land, and the total land transfer income thus decreases with the increase in industrial land area. We can regard this process as the period of decline (whereby total land transfer income declines with the increase of industrial land after the saturation point has been reached, see Figure 4). Hypothesis 2 is proposed with regard to the period of increase: when the income from the land transfer increases, the area of industrial land increases, and the ratio of industrial land area to residential land area also increases. However, the actual situation that occurs in practice is contrary to Hypothesis 2, whereby the actual situation was the case in the period of decline, when the industrial land transfer area exceeded the saturation point and the total land transfer income decreased. We thus propose the following possible explanation: in order to increase the income derived from land transfer, the local government may extend the supply of residential land after the saturation point is reached, whereby the ratio of industrial land area to residential land area decreases. However, the purpose of the government’s move is not to reduce house prices. With the continuous influx of immigrants from rural areas into cities, but without the problem of settlement being solved, the rate of population semi-urbanization continues to rise.

4.2. Testing the Hypothesis Regarding the Effect of Land-Motivated Investment on Population Semi-Urbanization

Based on the regression results in Table 4, it can be seen that land-motivated investment leads to population semi-urbanization, and that one standard deviation of investment increase will increase the rate of population semi-urbanization by 0.25 standard deviation (see Group (1.3) with control variables), which is significant at the level of 10%. One standard deviation of land-motivated investment increase will increase the price ratio of residential land to industrial land by 0.217 standard deviation (see Group (2.3) with control variables), significant at the 1% level. When the land price structure is introduced into the Group (1.3), one standard deviation of land price structure increase will increase the rate of population semi-urbanization by 0.157 standard deviation (see Group (3.3) with control variables), which is significant at the 5% level. The impact of land-motivated investment on population semi-urbanization also remains significant. The overall process of population semi-urbanization caused by land-motivated investment through the intermediary variable of land price structure represents a partial mediation effect, thus supporting Hypothesis 3 that land-motivated investment affects population semi-urbanization through the intermediary variable of land price structure, and the effect level of mediating effect is 13.63%9, meaning that 13.63% of the impact of land-motivated investment on population semi-urbanization will be transferred through the intermediary variable of land price structure.
Taking the land area structure as the intermediary variable, the regression result indicates that one standard deviation of land area structure increase will increase the rate of population semi-urbanization by 0.049 standard deviation (see Group (2.4) with control variables), which is significant at the level of 10%. When the land area structure is introduced into the model (1.4), one standard deviation of land area structure increase will increase the rate of population semi-urbanization by 0.606 standard deviation (see Group (3.4) with control variables), which is significant at the level of 1%. The impact of land-motivated investment on population semi-urbanization remains significant, implying a partial mediation effect and verifying Hypothesis 4 that land-motivated investment affects population semi-urbanization through the intermediary variable of land area structure, and the effect level of mediating effect is 11.88%10, meaning that 11.88% of the impact of land-motivated investment on population semi-urbanization will be transferred through the intermediary variable of land area structure.

4.3. Robustness Test

In this study, we applied the method of replacing the dependent variable in order to test the robustness of the results. Under the control of the other variables remaining unchanged, the dependent variable semi (the difference between the urbanization rate of permanent residents and that of the registered population) was replaced by the dependent variable semi’ (the ratio of the urbanization rate of permanent residents to that of the registered population). According to the regression results in Table 5 and Table 6, the empirical results after replacing the dependent variables are, essentially, consistent with the previous regression results, meaning that the results presented in this paper are robust and can provide a preliminary benchmark for future related research.

5. Conclusions and Discussion

Based on land transfer data in 105 cities in China from 2007 to 2017, and combining cities’ permanent population data and registered population data, this paper examines the impact of land supply structure on the semi-urbanization of the population under conditions of local government competition. The results show that: (1) land finance affects the rate of population semi-urbanization through the land price structure. The higher the land transfer income is, the more imbalanced the land price structure will be, which in turn leads to the intensification of population semi-urbanization. (2) While land finance affects the semi-urbanization of the population through the land area structure, this impact is not consistent with the hypotheses proposed. In light of the latter, we undertook a further exploration, concluding that the local governments’ land sale strategy exceeds the saturation point of the total land transfer income reaching its possible maximum with the increase of industrial land. After that point is exceeded, the total land transfer income will decrease with the increase in industrial land. In order to improve their land transfer income, local governments will increase the supply of residential land accordingly, but not with the main purpose of reducing housing prices. The latter means that house prices remain high, which, coupled with the growing floating agricultural population moving from rural areas to cities, but not being completely integrated in cities, means that the rate of population semi-urbanization continues to rise. (3) Land-motivated investment affects population semi-urbanization through the land price structure. The stronger the attraction of preferential land policies to foreign investment is, the more imbalanced the land price structure will be, and the greater the degree of population semi-urbanization will be. (4) Land-motivated investment affects population semi-urbanization in terms of the land area structure. The stronger the ability of preferential land policies to attract foreign investment is, the more imbalanced the land area structure will be, and the greater the degree of population semi-urbanization will be.
The results of this paper indicate that, first, revenue-driven land finance and land-motivated investment have led to an imbalance in the land supply structure, which then further exacerbated the semi-urbanization of the population in China. Although Chinese governments are trying to ease restrictions concerning households in urban areas11, the problem of population semi-urbanization has not been adequately addressed by the land intervention dynamics under local government competition, particularly in terms of achieving performance indicators. Clarifying the influence mechanism of such competition and the land supply structure on population semi-urbanization may thus be seen as useful to furthering the understanding of population semi-urbanization in China. In addition, it provides a whole new perspective for solving the problem of population semi-urbanization.
Nevertheless, this study presents only a preliminary exploration. There remain further aspects to be studied, such as whether the personal characteristics of government officials will play a regulatory role in this process. When the land sale strategy reaches its optimal level, will the local government relax the supply of residential land? Will the phenomenon of population semi-urbanization be alleviated? Considering the massive population loss in China’s three northeast provinces in recent years, what kind of impact will this phenomenon bring to China’s overall semi-urbanization of the population?

Author Contributions

Conceptualization, X.J. and J.Z.; methodology, J.Z. and X.J.; software, J.Z. and N.M.; validation, X.Y. and X.J.; formal analysis, X.Y. and X.J.; data curation, J.Z. and N.M.; writing—original draft preparation, J.Z.; writing—review and editing, X.J. and X.Y.; visualization, J.Z. and N.M.; supervision, X.Y. and X.J.; funding acquisition, X.Y., X.J. and J.Z. All authors have read and agreed to the published version of the manuscript.

Funding

This research was funded by the National Social Science Fund of China (No.17CSH026), Key Projects of the Ministry of Education (No.18JZD033), College Students’ Scientific and Technological Innovation Activity Plan and Xinmiao Talent Plan of Zhejiang Province (No.2021R403052).

Data Availability Statement

The data supporting the findings of the research are available in the National Bureau of Statistics of China (http://www.stats.gov.cn/english/, accessed on 30 October 2021), EPS CHINA DATA (http://www.epschinadata.com/, accessed on 30 October 2021) and China Land Market Website (https://www.landchina.com/, accessed on 30 October 2021).

Acknowledgments

We thank Zhang of the National University of Singapore for his guidance during this research, and the editor and reviewers for the valuable comments and suggestions.

Conflicts of Interest

The authors have no conflict of interest to declare.

Appendix A

Figure A1. Supply of three types of land in 105 key prefecture-level cities in China from 2009 to 2017.
Land 10 01371 g0a1aLand 10 01371 g0a1bLand 10 01371 g0a1cLand 10 01371 g0a1dLand 10 01371 g0a1eLand 10 01371 g0a1f

References

  1. Tisdale, H. The process of urbanization. Soc. Forces 1942, 3, 311–316. [Google Scholar] [CrossRef]
  2. Dociu, M.; Dunarintu, A. The socio-economic impact of urbanization. Int. J. Acad. Res. Account. Financ. 2012, 2, 47–52. [Google Scholar]
  3. Dekker, J.; Peen, J.; Koelen, J.; Smit, F.; Schoevers, R. Psychiatric disorders and urbanization in Germany. BMC Public Health 2008, 8, 17–26. [Google Scholar] [CrossRef] [PubMed]
  4. Yang, D.; Ye, C.; Xu, J. Land-use change and health risks in the process of urbanization: A spatiotemporal interpretation of a typical case in Changzhou, China. Land 2021, 10, 820. [Google Scholar] [CrossRef]
  5. Lin, X.; Wang, Y.; Wang, S.; Wang, D. Spatial differences and driving forces of land urbanization in China. J. Geogr. Sci. 2015, 25, 545–558. [Google Scholar] [CrossRef]
  6. Zhang, Y.; Xie, H. Interactive relationship among urban expansion, economic development, and population growth since the reform and opening up in China: An analysis based on a Vector Error Correction Model. Land 2019, 8, 153. [Google Scholar] [CrossRef] [Green Version]
  7. Huang, B.X.; Chiou, S.C.; Li, W.Y. Landscape pattern and ecological network structure in urban green space planning: A case study of Fuzhou city. Land 2021, 10, 769. [Google Scholar] [CrossRef]
  8. Zheng, Y.; Zhao, S.; Huang, J.; Lv, A. Analysis of the spatiotemporal pattern and mechanism of land use mixture: Evidence from China’s county data. Land 2021, 10, 370. [Google Scholar] [CrossRef]
  9. Chan, K.W.; Zhang, L. The Hukou System and Rural-Urban Migration in China: Processes and Changes. China Q. 1999, 160, 818–855. [Google Scholar] [CrossRef] [PubMed] [Green Version]
  10. Zhu, H.; Qian, J.X. New theoretical dialogues on migration in China: Introduction to the special issue. J. Ethn. Migr. Stud. 2021, 47, 2685–2705. [Google Scholar] [CrossRef] [Green Version]
  11. Chan, K.W. The Chinese Hukou System at 50. Eurasian Geogr. Econ. 2009, 50, 197–221. [Google Scholar] [CrossRef] [Green Version]
  12. Ji, Y.; Guo, X.; Zhong, S.; Wu, L. Land financialization, uncoordinated development of population urbanization and land urbanization, and economic growth: Evidence from China. Land 2020, 9, 481. [Google Scholar] [CrossRef]
  13. Wang, D.; Ren, C.; Zhou, T. Understanding the impact of land finance on industrial structure change in China: Insights from a spatial econometric analysis. Land Use Policy 2021, 103, 105323. [Google Scholar] [CrossRef]
  14. Lin, G.C.S.; Yi, F. Urbanization of capital or capitalization on urban land? Land Development and local public finance in urbanizing China. Urban Geogr. 2011, 32, 50–79. [Google Scholar] [CrossRef]
  15. Lin, G.C.S. China’s landed urbanization: Neo-liberalizing politics, land commodification, and municipal finance in the growth of metropolises. Environ. Plan. A Econ. Space 2014, 46, 1814–1835. [Google Scholar] [CrossRef]
  16. Tian, L.; Ge, B.; Li, Y. Impacts of state-led and bottom-up urbanization on land use change in the peri-urban areas of Shanghai: Planned growth or uncontrolled sprawl? Cities 2017, 60, 476–486. [Google Scholar] [CrossRef]
  17. Wang, B.; Zhang, Y.; Zhan, C.; Yang, X. Strategic interaction of industrial land conveyance behaviors in China: Based on an asymmetric two-regime Spatial Durbin Model. J. Clean. Prod. 2020, 270, 122598. [Google Scholar] [CrossRef]
  18. Cao, Y.; Liu, R.; Qi, W.; Wen, J. Urban land regulation and heterogeneity of housing conditions of inter-provincial migrants in China. Land 2020, 9, 428. [Google Scholar] [CrossRef]
  19. Zhou, L.; Fan, J.; Yu, X. The bilateral effect of intergovernmental competition on the level of urban land marketization: Based on the different functions of fiscal competition and investment attraction competition. China Land Sci. 2019, 33, 60–68. [Google Scholar] [CrossRef]
  20. Yan, J. Land supply regulation and residential land misallocation: An empirical study based on the city-level panel data. China Land Sci. 2018, 32, 15–22. [Google Scholar] [CrossRef]
  21. Dong, O.; Zhu, X.; Liu, X.; He, R.; Wan, Q. Spatial differentiation and driving factor analysis of urban construction land change in county-level city of Guangxi, China. Land 2021, 10, 691. [Google Scholar] [CrossRef]
  22. Wu, J.; Guo, Q.; Hewings, G.J.D. Land regulating economy as a policy instrument in urban China. Cities 2019, 94, 225–234. [Google Scholar] [CrossRef]
  23. Tian, L.; Ma, W. Government intervention in city development of China: A tool of land supply. Land Use Policy 2009, 26, 599–609. [Google Scholar] [CrossRef]
  24. Huang, J.; Shen, G.Q.; Zheng, H.W. Is insufficient land supply the root cause of housing shortage? Empirical evidence from Hong Kong. Habitat Int. 2015, 49, 538–546. [Google Scholar] [CrossRef]
  25. Li, H.; Zhou, L. Political Turnover and Economic Performance: The Incentive Role of Personnel Control in China. J. Public Econ. 2005, 89, 1743–1762. [Google Scholar] [CrossRef]
  26. Zhou, L.A. Governing China’s Local Officials: An Analysis of Promotion Tournament Model. Econ. Res. J. 2007, 7, 36–50. (In Chinese) [Google Scholar]
  27. Deng, J.; Zhang, N.; Ahmad, F.; Draz, M.U. Local government competition, environmental regulation intensity and regional innovation performance: An empirical investigation of Chinese provinces. Int. J. Environ. Res. Public Health 2019, 16, 2130. [Google Scholar] [CrossRef] [Green Version]
  28. Chen, Z.; Tang, J.; Wan, J.; Chen, Y. Promotion incentives for local officials and the expansion of urban construction land in China: Using the Yangtze River Delta as a case study. Land Use Policy 2017, 63, 214–225. [Google Scholar] [CrossRef]
  29. Wu, K.A.; Zhang, L. Developmentalist Government and Urban Hukou Threshold: Rethinking hukou system reform. Sociol. Stud. 2010, 25, 58–85. (In Chinese) [Google Scholar] [CrossRef]
  30. Wen, H.; Zhao, Z. Talent introduction and housing price: A tale of Xi’an. Appl. Econ. Lett. 2019, 26, 954–962. [Google Scholar] [CrossRef]
  31. Chen, J.; Hu, Z.M. Hukou-based labour market discrimination and ownership structure in urban China. Urban Stud. 2016, 53, 1657–1673. [Google Scholar] [CrossRef]
  32. Qian, Y.; Qian, Z. Assortative Mating by Education and Hukou in Shanghai. Chin. Sociol. Rev. 2017, 49, 239–262. [Google Scholar] [CrossRef] [Green Version]
  33. Zhang, Z.; Treiman, D.J. Social origins, hukou conversion, and the wellbeing of urban residents in contemporary China. Soc. Sci. Res. 2013, 42, 71–89. [Google Scholar] [CrossRef]
  34. Luo, J.; Chen, Y.F.; He, H.R.; Gao, G.L. Hukou identity and fairness in the ultimatum game. Theory Decis. 2019, 87, 389–420. [Google Scholar] [CrossRef]
  35. Hou, S.; Song, L.; Wang, J.; Ali, S. How land finance affects green economic growth in Chinese cities. Land 2021, 10, 819. [Google Scholar] [CrossRef]
  36. Qun, W.; Yongle, L.; Siqi, Y. The incentives of China’s urban land finance. Land Use Policy 2015, 42, 432–442. [Google Scholar] [CrossRef]
  37. Yan, S.; Ge, X.J.; Wu, Q. Government intervention in land market and its impacts on land supply and new housing supply: Evidence from major Chinese markets. Habitat Int. 2014, 44, 517–527. [Google Scholar] [CrossRef]
  38. Zhao, W.Z.; Yang, J.D. Financial gap of local governments and land transfer methods—An explanation based on the mutually beneficial behavior of local governments and state-owned enterprises. Manag. World 2015, 4, 11–24. (In Chinese) [Google Scholar] [CrossRef]
  39. Zheng, W.; Chen, P. The political economy of air pollution: Local development, sustainability, and political incentives in China. Energy Res. Soc. Sci. 2020, 69, 101707. [Google Scholar] [CrossRef]
  40. Yao, Y.; Zhang, M. Subnational leaders and economic growth: Evidence from Chinese cities. J. Econ. Growth 2015, 20, 405–436. [Google Scholar] [CrossRef]
  41. Yu, J.; Zhou, L.A.; Zhu, G. Strategic interaction in political competition: Evidence from spatial effects across Chinese cities. Reg. Sci. Urban Econ. 2016, 57, 23–37. [Google Scholar] [CrossRef] [Green Version]
  42. Shao, C.D.; Su, D.N.; Deng, H.T. Housing prices, land finance and city agglomeration characteristics: The road of China’s city development. Manag. World 2016, 2, 19–31. (In Chinese) [Google Scholar] [CrossRef]
  43. Tang, P.; Shi, X.; Qu, F. Local government competition and land financial strategies. Resour. Sci. 2014, 36, 702–711. [Google Scholar]
  44. Shang, H.; Li, W.; Liu, W. Innovation or imitation—A comparison of Performance Evaluation Models in China. Transylv. Rev. Adm. Sci. 2018, 54E, 138–154. [Google Scholar] [CrossRef]
  45. Huang, H.; Tang, Y. Residential land use regulation and the US housing price cycle between 2000 and 2009. J. Urban Econ. 2011, 71, 93–99. [Google Scholar] [CrossRef]
  46. Wen, L.; Peng, D.Y. Research on misallocation of land supply, rising housing prices and semi-urbanization. China Land Sci. 2016, 30, 18–27. (In Chinese) [Google Scholar] [CrossRef]
  47. Fan, J.; Zhou, L.; Yu, X.; Zhang, Y. Impact of land quota and land supply structure on China’s housing prices: Quasi-natural experiment based on land quota policy adjustment. Land Use Policy 2021, 106, 105452. [Google Scholar] [CrossRef]
  48. Xiong, C.; Tan, R. Will the land supply structure affect the urban expansion form? Habitat Int. 2018, 75, 25–37. [Google Scholar] [CrossRef]
  49. Zhang, L.; Gao, Y.H.; Xu, X.X. Land transfer under the collusion of governments and enterprises. Manag. World 2013, 12, 43–51. (In Chinese) [Google Scholar] [CrossRef]
  50. Tu, F.; Yu, X.; Ruan, J. Industrial land use efficiency under government intervention: Evidence from Hangzhou, China. Habitat Int. 2014, 43, 1–10. [Google Scholar] [CrossRef]
  51. Yang, Q.J.; Zhuo, P.; Yang, J.D. Industrial land transfer and bottom line competition of investment quality—An empirical study based on the panel data of China’s prefecture level cities from 2007 to 2011. Manag. World 2014, 11, 24–34. (In Chinese) [Google Scholar] [CrossRef]
  52. Yuan, F.; Wei, Y.D.; Xiao, W. Land marketization, fiscal decentralization, and the dynamics of urban land prices in transitional China. Land Use Policy 2019, 89, 104208. [Google Scholar] [CrossRef]
  53. Fitzgerald, M.; Hansen, D.J.; McIntosh, W.; Slade, B.A. Urban land: Price indices, performance, and leading indicators. J. Real Estate Financ. Econ. 2020, 60, 396–419. [Google Scholar] [CrossRef]
  54. Huang, Z.; Du, X. Government intervention and land misallocation: Evidence from China. Cities 2017, 60, 323–332. [Google Scholar] [CrossRef]
  55. Wu, Y.; Zhang, X.; Skitmore, M.; Song, Y.; Hui, E.C.M. Industrial land price and its impact on urban growth: A Chinese case study. Land Use Policy 2014, 36, 199–209. [Google Scholar] [CrossRef] [Green Version]
  56. Chen, B.K.; Yang, R.D. Land supply, housing price and household saving in urban China: Evidence from urban household survey. Econ. Res. J. 2013, 48, 110–122. (In Chinese) [Google Scholar]
  57. Xie, D.S. Land supply intervention and urban-rural income gap—Based on panel data of 105 cities in China. Econ. Sci. 2018, 3, 35–48. (In Chinese) [Google Scholar] [CrossRef]
  58. Baron, R.M.; Kenny, D.A. Baron & Kenny, 1986. J. Personal. Soc. Psychol. 1986, 51, 1173–1182. [Google Scholar]
  59. Nam, J.; Ekinci, Y.; Whyatt, G. Brand equity, brand loyalty and consumer satisfaction. Ann. Tour. Res. 2011, 38, 1009–1030. [Google Scholar] [CrossRef]
  60. Tofighi, D.; Mackinnon, D.P. RMediation: An R Package for Mediation Analysis Confidence Intervals. Behav. Res. Methods 2011, 43, 692–700. [Google Scholar] [CrossRef] [Green Version]
  61. Liu, Q.Q.; Zhou, Z.K.; Yang, X.J.; Kong, F.C.; Niu, G.F.; Fan, C.Y. Mobile phone addiction and sleep quality among Chinese adolescents: A moderated mediation model. Comput. Hum. Behav. 2017, 72, 108–114. [Google Scholar] [CrossRef]
  62. Wang, Y.L.; Huang, Z.M.; Kong, F. Parenting stress and life satisfaction in mothers of children with cerebral palsy: The mediating effect of social support. J. Health Psychol. 2020, 25, 416–425. [Google Scholar] [CrossRef]
  63. MacKinnon, D.P.; Warsi, G.; Dwyer, J.H. A simulation study of mediated effect measures. Multivar. Behav. Res. 1995, 30, 41–62. [Google Scholar] [CrossRef] [Green Version]
  64. Wen, Z.L.; Hau, K.T.; Chang, L. A comparison of moderator and mediator and their applications. Acta Psychol. Sin. 2005, 37, 268–274. (In Chinese) [Google Scholar]
  65. Reed, W.R. On the Practice of Lagging Variables to Avoid Simultaneity. Oxf. Bull. Econ. Stat. 2015, 77, 897–905. [Google Scholar] [CrossRef]
  66. Bellemare, M.F.; Masaki, T.; Pepinsky, T.B. Lagged Explanatory Variables and the Estimation of Causal Effect. J. Polit. 2017, 79, 949–963. [Google Scholar] [CrossRef]
  67. Dormann, C.; Griffin, M.A. Optimal Time Lags in Panel Studies. Psychol. Methods 2015, 20, 489–505. [Google Scholar] [CrossRef]
  68. Liu, X.; Cao, G.; Liu, T.; Liu, H. Semi-urbanization and evolving patterns of urbanization in China: Insights from the 2000 to 2010 national censuses. J. Geogr. Sci. 2016, 26, 1626–1642. [Google Scholar] [CrossRef]
  69. Zhu, Y. Research on the land system arrangement and peri urbanization: Division, argument and extension. China Popul. Resour. Environ. 2018, 28, 29–36. [Google Scholar] [CrossRef]
  70. Hou, X.P. Local government behavior and dual population urbanization: An spatial econometric analysis based on Chinese provincial panel data. Econ. Probl. 2019, 11, 96–103. (In Chinese) [Google Scholar] [CrossRef]
  71. Fan, J.; Zhou, L.; Yu, X. Impact of land finance and land market development on urban housing price. Sci. Geogr. Sin. 2021, 41, 863–871. [Google Scholar] [CrossRef]
  72. Shi, F.; Xu, Y. Study on spatial-temporal differences and driving forces of the relationship between land finance and industrial development in China. Geogr. Geo-Inf. Sci. 2020, 36, 110–115. [Google Scholar] [CrossRef]
  73. Chen, T.; Kung, J.K.S. Do land revenue windfalls create a political resource curse? Evidence from China. J. Dev. Econ. 2016, 123, 86–106. [Google Scholar] [CrossRef]
  74. Wang, J.; Skidmore, M.; Wu, Q.; Wang, S. The impact of a tax cut reform on land finance revenue: Constrained by the binding target of construction land. J. Urban Aff. 2020, 1803750. [Google Scholar] [CrossRef]
  75. Sun, X.L.; Zhou, F.Z. Land Finance and the tax-sharing system: An empirical interpretation. Soc. Sci. China 2014, 35, 47–64. [Google Scholar] [CrossRef]
  76. Li, Y.G.; Wang, M. Land finance and industrial structure tertiarization: A new perspective of an explanation of “Chinese Paradox” of industrial structure tertiarization. J. Financ. Econ. 2015, 41, 29–41. (In Chinese) [Google Scholar] [CrossRef]
  77. Fu, Y.; Zhang, Y. The China-style of decentralization and fiscal expenditure composition: The cost of competition for growth. Manag. World 2007, 3, 4–22. [Google Scholar] [CrossRef]
  78. Ihlanfeldt, K.R. The effect of land use regulation on housing and land prices. J. Urban Econ. 2006, 61, 420–435. [Google Scholar] [CrossRef]
  79. Huang, J.B.; Xu, Z.; Xu, S. Land price distortion, enterprises’ property and over-investment—An empirical research based on the data of Chinese industrial enterprises and land price of cities in China. China Ind. Econ. 2015, 3, 57–69. (In Chinese) [Google Scholar] [CrossRef]
  80. Li, L.X.; Huang, P.Y.; Ma, G.R. Mismatch of land resources and productivity difference of Chinese industrial enterprises. Manag. World 2016, 8, 86–96. (In Chinese) [Google Scholar] [CrossRef]
  81. Yu, L.L.; Cai, Y.Y. Land supply structure, financial pressure and housing price: Empirical evidence from Guangdong province. China Land Sci. 2018, 32, 30–36. (In Chinese) [Google Scholar] [CrossRef]
  82. Zhang, S.H.; Yu, Y.Z. Land lease, resource misallocation and total factor productivity. J. Financ. Econ. 2019, 45, 73–85. (In Chinese) [Google Scholar] [CrossRef]

Notes

1
The urban–rural dualism in the People’s Republic of China was codified in 1958 with the issue of the Regulations on Registration (Hukou Policy), one fundamental social and political–institutional arrangement in China. The hukou can be transferred in the process of rural–urban migration, but such a transfer exerts a significant influence on the pace of urbanization and regional development in contemporary China.
2
While the Hukou Policy is the immediate cause of the phenomenon of population semi-urbanization, it is not the root cause.
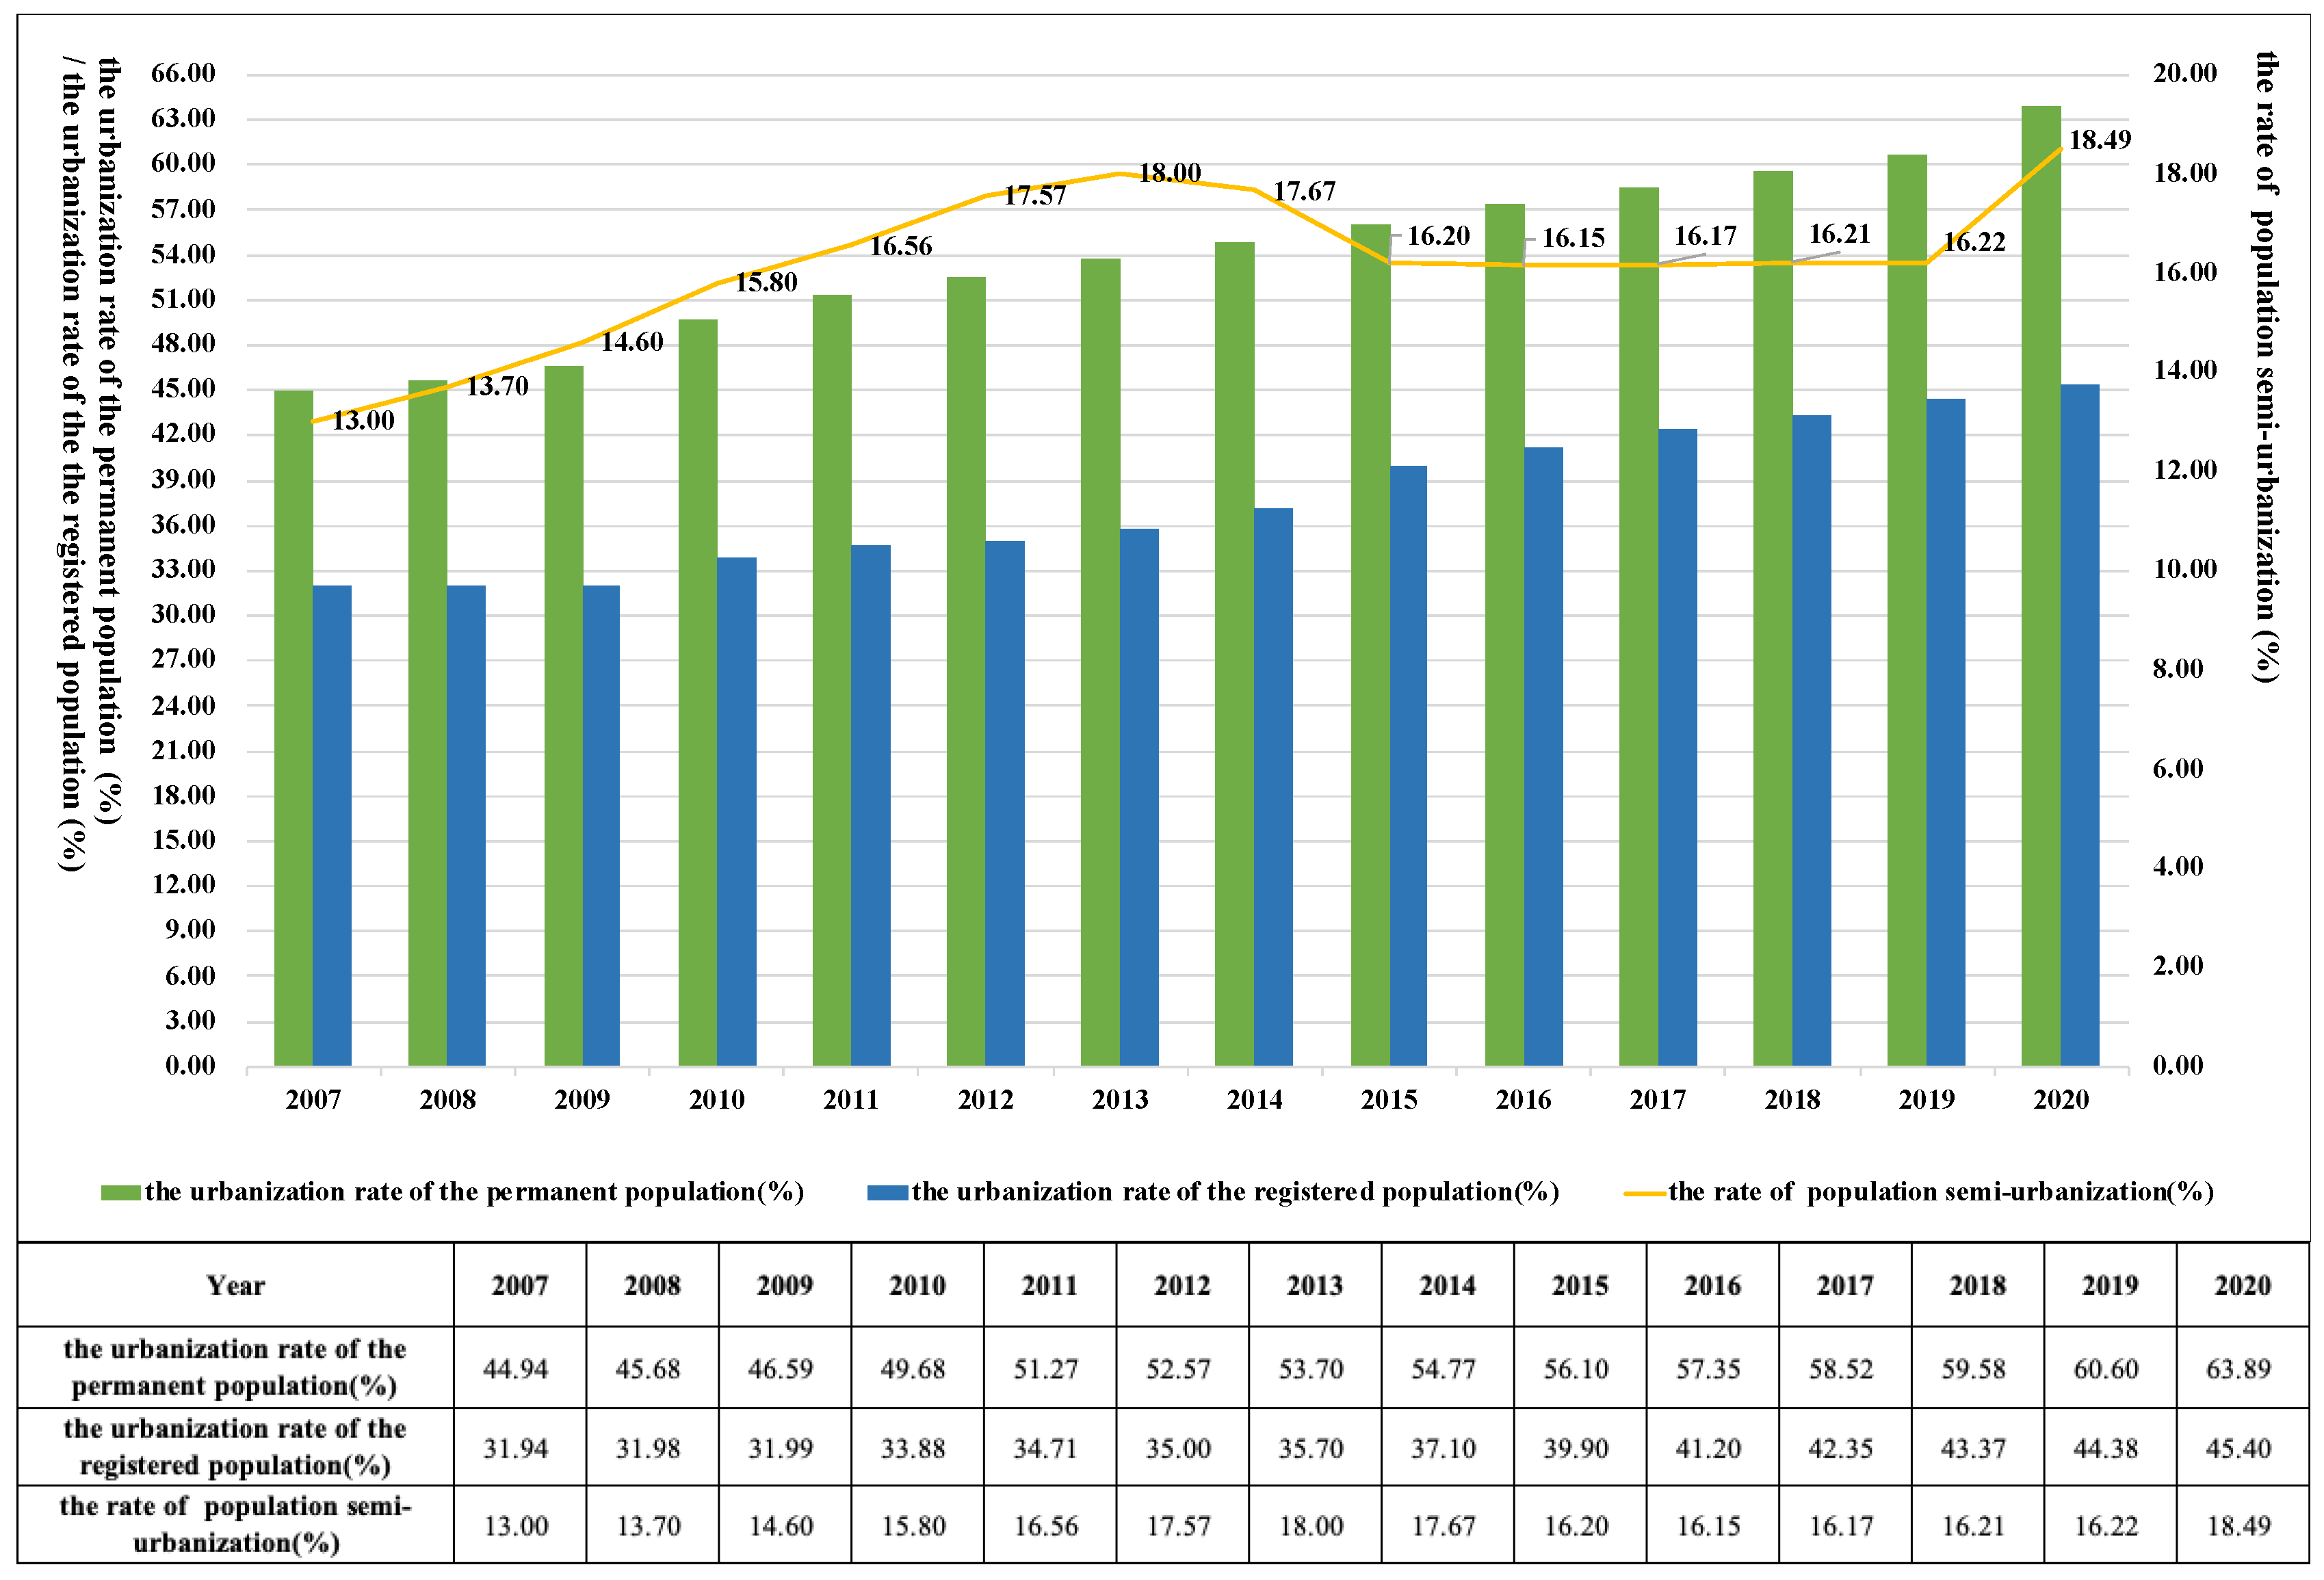
3
The definition of the rate of population semi-urbanization, as derived from geography textbooks in China, refers to the difference between the urbanization rate of the permanent population and that of the registered population. The permanent population refers to the people who have lived in the place of residence for more than half a year, and the registered population refers to the people who have registered permanent residence with the public security household registration authority in the place of residence.
4
We guess that the sudden drop in 2015 may be related to the Hukou Policy introduced in 2014. “Under the plan, China will completely remove restrictions concerning households in towns and small cities”. Such plan certainly led to a significant increase in the number of registered residents in the short term, so the rate of population semi-urbanization suddenly dropped in 2015. The sudden rise in 2020 may be related to the China Seventh Census. The data of the urbanization rate of the permanent population in 2020 is from the China Seventh Census; this census is a comprehensive survey and conducted every ten years, which greatly reduces the probability of under-reporting. This means that the urban permanent population that was originally misreported was counted in the China Seventh Census, so the rate of population semi-urbanization increased in 2020.
5
Tax-sharing reform was implemented in 1994 in China, dividing tax into three types: central tax, local tax, and shared tax. After the tax-sharing reform, 100% consumption tax and 75% of VAT belong to the central government. As a direct result of the tax-sharing reform, the proportion of local fiscal revenue in the national total fiscal revenue dropped rapidly from 78% in 1993 to 44.3% in 1994, which caused a huge impact on local fiscal pressure. At the same time, the ratio of local governments’ revenue to expenditure has been maintained at about 70%, and the tax-sharing reform has formed a financial gap of almost 30% of local governments.
6
Agreement assignment can specify matters related to enterprise investments other than the price and can well specify the interests between the enterprise and the government, while other transfer ways, such as bidding transfer or auction sale, cannot be well applied to this kind of transaction. However, agreement transfer’s operation process is often not under supervision; only a few developers have the opportunity to negotiate with the transferor, and this kind of transaction is usually in a “black box”. As a result, better developers without relevant information are excluded from the transaction.
7
The 105 key cities are representative cities selected by China central government based on different levels of economic development, and these cities cover the eastern, middle, and western regions, which can comprehensively reflect the urban development level in China.
8
We limited this research from 2007 to 2017, because the data during this period are relatively complete, and EPS China Data has not published most of the related data after 2017.
9
As mentioned in Section 3.1, the effect level of mediating effect is often measured by ab/c or ab/c’; here, it is ab/c, i.e., 0.217 × 0.157/0.25 = 13.63%.
10
As mentioned in Section 3.1, the effect level of mediating effect is often measured by ab/c or ab/c’; here, it is ab/c, i.e., 0.049 × 0.606/0.25 = 11.88%.
11
“Under the plan, China will completely remove restrictions concerning households in towns and small cities, gradually ease restrictions in mid-sized cities, and set reasonable conditions for people settling in big cities.”—China Introduces Guidelines for Household Registration Reform (Link: http://english.www.gov.cn/news/news_release/2014/08/23/content_281474983030658.htm, accessed on 20 November 2021).
Figure 1. China’s annual rates of urbanization. Sources: The data of the urbanization rate of the permanent population in 2010 and 2020 were collected from China Sixth Census (2010) and China Seventh Census (2020); the remaining data of the urbanization rate of the permanent population were collected from China National Bureau of Statistics (2007–2009, 2011–2019). The urbanization rate of the registered population was collected from China National Bureau of Statistics (2007–2020). The data of the rate of population semi-urbanization were calculated by the authors.
Land 10 01371 g001
Figure 2. Relationship between government competition, land supply structure, and population semi-urbanization.
Land 10 01371 g002
Figure 3. Test steps of the mediation effect.
Land 10 01371 g003
Figure 4. Relationship between land transfer income and industrial land area.
Land 10 01371 g004
Table 1. Statistical description of three types of land supply proportion in a city year.
Observation NumberMeanMinimumMaximumStandard Deviation
Commercial land9448.55%0.24%54.59%5.54
Residential land94522.32%1.21%51.77%9.78
Industrial land94530.24%1.06%85.14%30.24
Table 2. Descriptive Statistics of Variables (2007–2017).
Variable TypeVariable NameVariable CodeVariable DefinitionUnitObservation NumberMeanStandard DeviationMinimumMaximum
Dependent VariableRate of population semi-urbanizationsemiDifference between the urbanization rate of the permanent population and that of the registered population%90620.6014.34077.30
Independent VariableGovernment competitionfiscalLand transfer fees10 thousand yuan9851,797,4993,207,6665828,000,000
capitalRatio of FDI to GDP-11550.030.0200.13
Intermediary VariableLand supply structurepriceRatio of residential land price to industrial land price-9446.155.241.1947.26
areaRatio of industrial land area to residential land area-9451.721.580.0718.52
Control VariableCity characteristicspgdpPer capita GDPyuan/person115554,829.8435,277.098001467,749
resourcePer capita construction land aream2/person1155101.6457.899.95540.18
nonagroProportion of output value of secondary and tertiary industries%115591.007.3757.0799.97
estateReal estate development investment10 thousand yuan11554,831,4386,509,22517,43142,400,000
bookTotal book collections of public librariesthousand11555123.729192.7619377,730
Personal characteristics of officialsageAge of officialsyear old115551.833.934164
educationEducation level of officials: 0 = below undergraduate, 1 = undergraduate, 2 = master’s degree, 3 = doctorate or above-11552.040.7103
localizationlocal promotion or not, 1 = yes, 0 = no-11550.360.4801
tenureActual term of office; if officials’ term in post dates from January to June, it is calculated from the current year; if it began from July to December, it is calculated from the following yearyear11552.621.69012
Surrogate Variable for Robustness TestRate of population semi-urbanizationsemi’Ratio of the urbanization rate of the permanent population to that of the registered population-9061.560.501.004.21
Table 3. Regression results of land finance → land structure → population semi-urbanization.
Group without Control VariablesTaking Land Price Structure as Intermediary VariableTaking Land Area Structure as Intermediary Variable
(1.1)(2.1)(3.1)(1.2)(2.2)(3.2)
SemiMismatch
(Price)
SemiSemiMismatch
(Area)
Semi
fiscal1.021 ***0.954 ***0.3531.021 ***−0.471 ***0.372
(0.128)(0.126)(0.256)(0.128)(0.082)(0.255)
mismatch(price) 0.317 ***
(0.07)
mismatch(area) −0.536 ***
(0.121)
_cons7.266 ***−6.23 ***14.326 ***7.266 ***8.026 ***16.824 ***
(2.047)(1.696)(3.575)(2.047)(1.107)(3.591)
Observations823744574823742574
Group with Control VariablesTaking Land Price Structure as Intermediary VariableTaking Land Area Structure as Intermediary Variable
(1.1)(2.1)(3.1)(1.2)(2.2)(3.2)
SemiMismatch
(Price)
SemiSemiMismatch
(Area)
Semi
fiscal0.489 ***0.424 ***0.3520.489 ***−0.415 ***0.339
(0.173)(0.157)(0.273)(0.173)(0.093)(0.272)
mismatch(price) 0.294 ***
(0.072)
mismatch(area) −0.547 ***
(0.12)
pgdp1.875 **1.255 **2.187 **1.875 **0.3552.529 **
(0.919)(0.552)(1.022)(0.919)(0.347)(1.016)
nonagro0.0950.0220.293 *0.095−0.010.319 *
(0.136)(0.066)(0.167)(0.136)(0.069)(0.167)
resource0.929−0.1671.2920.9290.2420.868
(0.753)(0.56)(1.038)(0.753)(0.337)(1.03)
estate−0.0470.725 **−1.335 **−0.047−0.395 *−1.349 **
(0.557)(0.347)(0.677)(0.557)(0.216)(0.674)
book1.219 ***0.0151.158 **1.219 ***0.1571.148 **
(0.465)(0.289)(0.537)(0.465)(0.173)(0.535)
age0.0860.0360.040.086−0.0110.051
(0.055)(0.036)(0.062)(0.055)(0.019)(0.062)
education0.0840.56 ***0.2320.0840.0810.359
(0.263)(0.18)(0.314)(0.263)(0.097)(0.311)
tenure−0.12−0.076−0.056−0.12−0.009−0.052
(0.098)(0.063)(0.102)(0.098)(0.033)(0.101)
local0.513−0.0840.7020.513−0.2180.757
(0.438)(0.286)(0.504)(0.438)(0.156)(0.501)
_cons−32.333 ***−27.845 ***−33.892 **−32.333 ***8.382−35.823 **
(11.209)(5.618)(13.971)(11.209)(5.622)(13.921)
Observations823741574823742574
*** p < 0.01, ** p < 0.05, * p < 0.1. Standard errors are shown in parentheses.
Table 4. Regression results of land-motivated investment → land structure → population semi-urbanization.
Group without Control VariablesTaking Land Price Structure as Intermediary VariableTaking Land Area Structure as Intermediary Variable
(1.3)(2.3)(3.3)(1.4)(2.4)(3.4)
SemiMismatch
(Price)
SemiSemiMismatch
(Area)
Semi
capital0.404 ***0.355 ***0.326 **0.404 ***0.0380.331 **
(0.144)(0.082)(0.138)(0.144)(0.03)(0.137)
mismatch(price) 0.208 ***
(0.071)
mismatch(area) 0.726 ***
(0.173)
_cons20.661 ***5.945 ***19.891 ***20.661 ***1.751 ***19.899 ***
(0.188)(00.463)(0.467)(0.188)(0.085)(0.356)
Observations918835743918875744
Group with Control VariablesTaking Land Price Structure as Intermediary VariableTaking Land Area Structure as Intermediary Variable
(1.3)(2.3)(3.3)(1.4)(2.4)(3.4)
SemiMismatch
(Price)
SemiSemiMismatch
(Area)
Semi
capital0.25*0.217 ***0.282 **0.25 *0.049 *0.292 **
(0.14)(0.08)(0.14)(0.14)(0.03)(0.138)
mismatch(price) 0.157 **
(0.074)
mismatch(area) 0.606 ***
(0.184)
pgdp2.188 **0.835 *2.24 **2.188 **0.85 ***1.982 *
(0.934)(0.498)(1.049)(0.934)(0.222)(1.048)
nonagro0.0820.0580.1440.0820.0110.12
(0.149)(0.057)(0.19)(0.149)(0.037)(0.189)
resource0.7−0.2260.0770.70.316−0.119
(0.768)(0.505)(1.039)(0.768)(0.217)(1.033)
estate0.2641.075 ***−0.6560.264−0.114−0.456
(0.555)(0.294)(0.669)(0.555)(0.135)(0.662)
book0.7690.105−0.1330.7690.131−0.32
(0.5)(0.263)(0.545)(0.5)(0.117)(0.543)
age0.135 **0.0270.116 *0.135 **0.0110.111 *
(0.057)(0.032)(0.06)(0.057)(0.013)(0.06)
education0.2940.341 **0.4320.2940.0470.41
(0.266)(0.159)(0.301)(0.266)(0.063)(0.299)
tenure−0.143−0.053−0.101−0.143−0.062 ***−0.065
(0.1)(0.057)(0.104)(0.1)(0.023)(0.104)
local0.83 **−0.0530.911 **0.83 **−0.0230.94 **
(0.42)(0.242)(0.456)(0.42)(0.097)(0.452)
_cons−30.792 **−26.076 ***−13.65−30.792 **−9.853 ***−9.187
(12.205)(5.123)(16.14)(12.205)(3.058)(16.13)
Observations916833741916873742
*** p < 0.01, ** p < 0.05, * p < 0.1. Standard errors are shown in parentheses.
Table 5. Robustness test results of the impact of land finance on population semi-urbanization.
GroupTaking Land Price Structure as Intermediary VariableTaking Land Area Structure as Intermediary Variable
(1.1’)(2.1’)(3.1’)(1.2’)(2.2’)(3.2’)
Semi’Mismatch
(Price)
Semi’Semi’Mismatch
(Area)
Semi’
fiscal0.02 **0.424 ***0.0070.02 **−0.391 ***0.006
(0.008)(0.157)(0.013)(0.008)(0.093)(0.012)
mismatch(price) 0.006 **
(0.003)
mismatch(area) −0.032 ***
(0.005)
control variablecontrolcontrolcontrolcontrolcontrolcontrol
_cons0.71−28.166 ***0.9010.719.4080.899
(0.489)(5.932)(0.622)(0.489)(6.065)(0.607)
Observations774733578774734579
*** p < 0.01, ** p < 0.05. Standard errors are shown in parentheses.
Table 6. Robustness test results of the impact of land-motivated investment on population semi-urbanization.
GroupTaking Land Price Structure as Intermediary VariableTaking Land Area Structure as Intermediary Variable
(1.3’)(2.3’)(3.3’)(1.4’)(2.4’)(3.4’)
Semi’Mismatch
(Price)
Semi’Semi’Mismatch
(Area)
Semi’
capital0.026 **0.217 ***0.037 ***0.026 **0.049 *0.03 ***
(0.01)(0.08)(0.011)(0.01)(0.03)(0.011)
mismatch(price) 0.006 *
(0.003)
mismatch(area) 0.032 ***
(0.008)
control variablecontrolcontrolcontrolcontrolcontrolcontrol
_cons0.247−26.076 ***1.612 **0.247−9.853 ***1.225 *
(0.499)(5.123)(0.703)(0.499)(3.058)(0.625)
Observations906833687906873765
*** p < 0.01, ** p < 0.05, * p < 0.1. Standard errors are shown in parentheses.
Publisher’s Note: MDPI stays neutral with regard to jurisdictional claims in published maps and institutional affiliations.

