Article

Evapotranspiration Measurements and Assessment of Driving Factors: A Comparison of Different Green Roof Systems during Summer in Germany

by
Dominik Gößner
*,
Milena Mohri
and
Justine Jasmin Krespach
Optigrün International AG, 72505 Krauchenwies, Germany
*
Author to whom correspondence should be addressed.
Land 2021, 10(12), 1334; https://doi.org/10.3390/land10121334
Submission received: 29 October 2021 / Revised: 19 November 2021 / Accepted: 30 November 2021 / Published: 3 December 2021
(This article belongs to the Special Issue Urban Green and Blue Infrastructure in the View of Global Warming)

Abstract

:
Green roofs have proven to be a space-saving solution to mitigate peak temperatures and control floods in urban areas through evaporative cooling and storm water retention. To encourage a sustainable city design with large-scale green infrastructure networks, a better differentiation between the diverse existing green roof systems is needed. The aim of this study is to demonstrate differences among green roof systems based on comprehensive microclimatic measurements on four small experimental roofs and to assess differences in evapotranspiration with a partial least square regression. The results show that short-wave solar radiation, relative humidity and water availability are the most important drivers of evapotranspiration. The roof system with permanent water storage maintained significantly higher substrate moisture compared to the other roofs and produced peak evapotranspiration rates of 4.88 mm d−1. The highest total evapo-transpiration of 526 mm from April to September was recorded for the roof system with the thickest substrate layer and grass vegetation. In summer, the shallowest roof showed the highest substrate temperature and air temperature at vegetation level. These findings highlight the importance of specifying the characteristics of the various green roofs in order to turn them into useful planning tools for the design of climate-change-resilient cities.

1. Introduction

Hot weather extremes such as heatwaves or droughts as well as the intensity and frequency of heavy rain events have increased during in recent decades and, due to climate change, they are expected to intensify [1]. Urban areas are especially sensitive to these weather extremes because they already exhibit higher temperatures [2,3] and increased precipitation compared to the rural surroundings [4]. The high percentage of sealed surfaces and lack of green space both contribute to the urban heat island effect, resulting, on average, in a 1–3 °C difference between the city center and countryside with peak differences of up to 10 °C [5,6,7,8]. At the same time, urbanization also increases the precipitation over the city by more than 15% [4]. The consequences are floods from overloaded sewage systems and health implications due to heat stress [9,10]. Studies have shown that people living in cities are more likely to be affected by floods [11] and to die a premature death due to heat [12] than the rural population. As the majority of the world population at present lives in urban areas [13], measures for heat mitigation and flood prevention must be implemented in cities.
The expansion of vegetated areas as part of a green infrastructure network is highly effective in lowering temperatures through evaporative cooling as well as controlling floods through storm water retention [5]. Green roofs are a particularly suitable green infrastructure type for dense cities, because they do not take up precious ground space. Their cooling effect arises from the evaporation of water from the soil and the transpiration of water by vegetation, and the measured reduction in the ambient air temperature through green roofs was found to be, on average, 1.34 °C [14]. Models conducted on a meso-scale achieve similar results, with a vegetation cooling efficiency between 1 and 3 °C, while micro-scale results only detect a 0.5 °C cooling [15]. Moreover, green roofs are effectively controlling floods [16]: storm water slowly infiltrates into the substrate layer where it partly remains until it evaporates, while excess water can be temporarily stored in the drainage layer before it flows off with a delay. This lowers the burden on the sewer system, especially during the peaks of heavy rain events. Extensive green roofs can reduce the storm water runoff by about 60% and intensive green roofs by 80%, while the outflow is, on average, 70% delayed compared to non-vegetated roofs [14]. Apart from cooling the ambient air temperature and substantially reducing the storm water runoff, green roofs provide further environmental benefits such as increased biodiversity [17], noise protection [14], building insulation [18] and various social and economic benefits including improved aesthetics of the townscape, resulting in better mental recovery [19,20] and increased property value [14].
Municipalities increasingly acknowledge these benefits and the green roof coverage expands yearly by over 1.5 million m2 in central Europe [21]. Still, many cities lack a holistic and integrated spatial planning approach, which is needed to face today’s environmental challenges [22]. An important basis for solutions implemented at the city scale is detailed knowledge about green roof services, which can partly be obtained from urban climate simulations [23]. However, most scientific studies with models only differentiate between extensive and intensive green roofs [24,25,26,27], which does not adequately reflect the variety of existing green roofs: the growing demand for green infrastructure solutions has led to the development of a broad range of green roof systems. Thus, the simple differentiation between extensive and intensive green roofs, based only on the thickness of the substrate layer, can be considered outdated. Today’s green roofs differ not only in substrate height, but also in substrate type, vegetation, drainage/water retention layer and roof outlet characteristics. Further, some green roof systems even include water storage elements such as retention storages or cisterns, which can be used for passive or active irrigation. These different designs strongly affect the green roofs’ water household and their potential evaporative cooling and storm water retention capacity [28]. Even though scientific studies increasingly differentiate between green roof designs to measure evapotranspiration [29,30], present data do not adequately reflect the existing diversity of systems with their different effects.
Mitigating extreme summer temperatures and floods in urban areas has become one of the central goals of sustainable city planning [31]. With evapotranspiration as a key to the urban heat island mitigation [28], precise numbers are needed regarding the quantity of water returned to the atmosphere via green roofs. The best possible strategies to counter climate change in cities can only be developed when specific information about the services provided by different green roof systems is available. The obtained data can subsequently be used to validate urban climate simulations, which facilitate the implementation of research findings about green infrastructure.
The present study includes comprehensive microclimatic measurements on four small experimental roofs situated in Germany. The focus of the study lies on the evapotranspiration, which is measured using the gravimetric method. The presented results include the data of one summer season, and both single measured parameters and their relation and contribution to the evapotranspiration process will be evaluated. The aim of this study is (I) to encourage better differentiation between various green roof types by providing detailed data on microclimatic characteristics of four different green roof systems; (II) to quantify the evapotranspiration rate among the green roofs as a central tool for cooling the ambient air temperature and mitigating the urban heat island effect and (III) to better understand which environmental and climatic factors have the greatest influence on evapotranspiration.

2. Materials and Methods

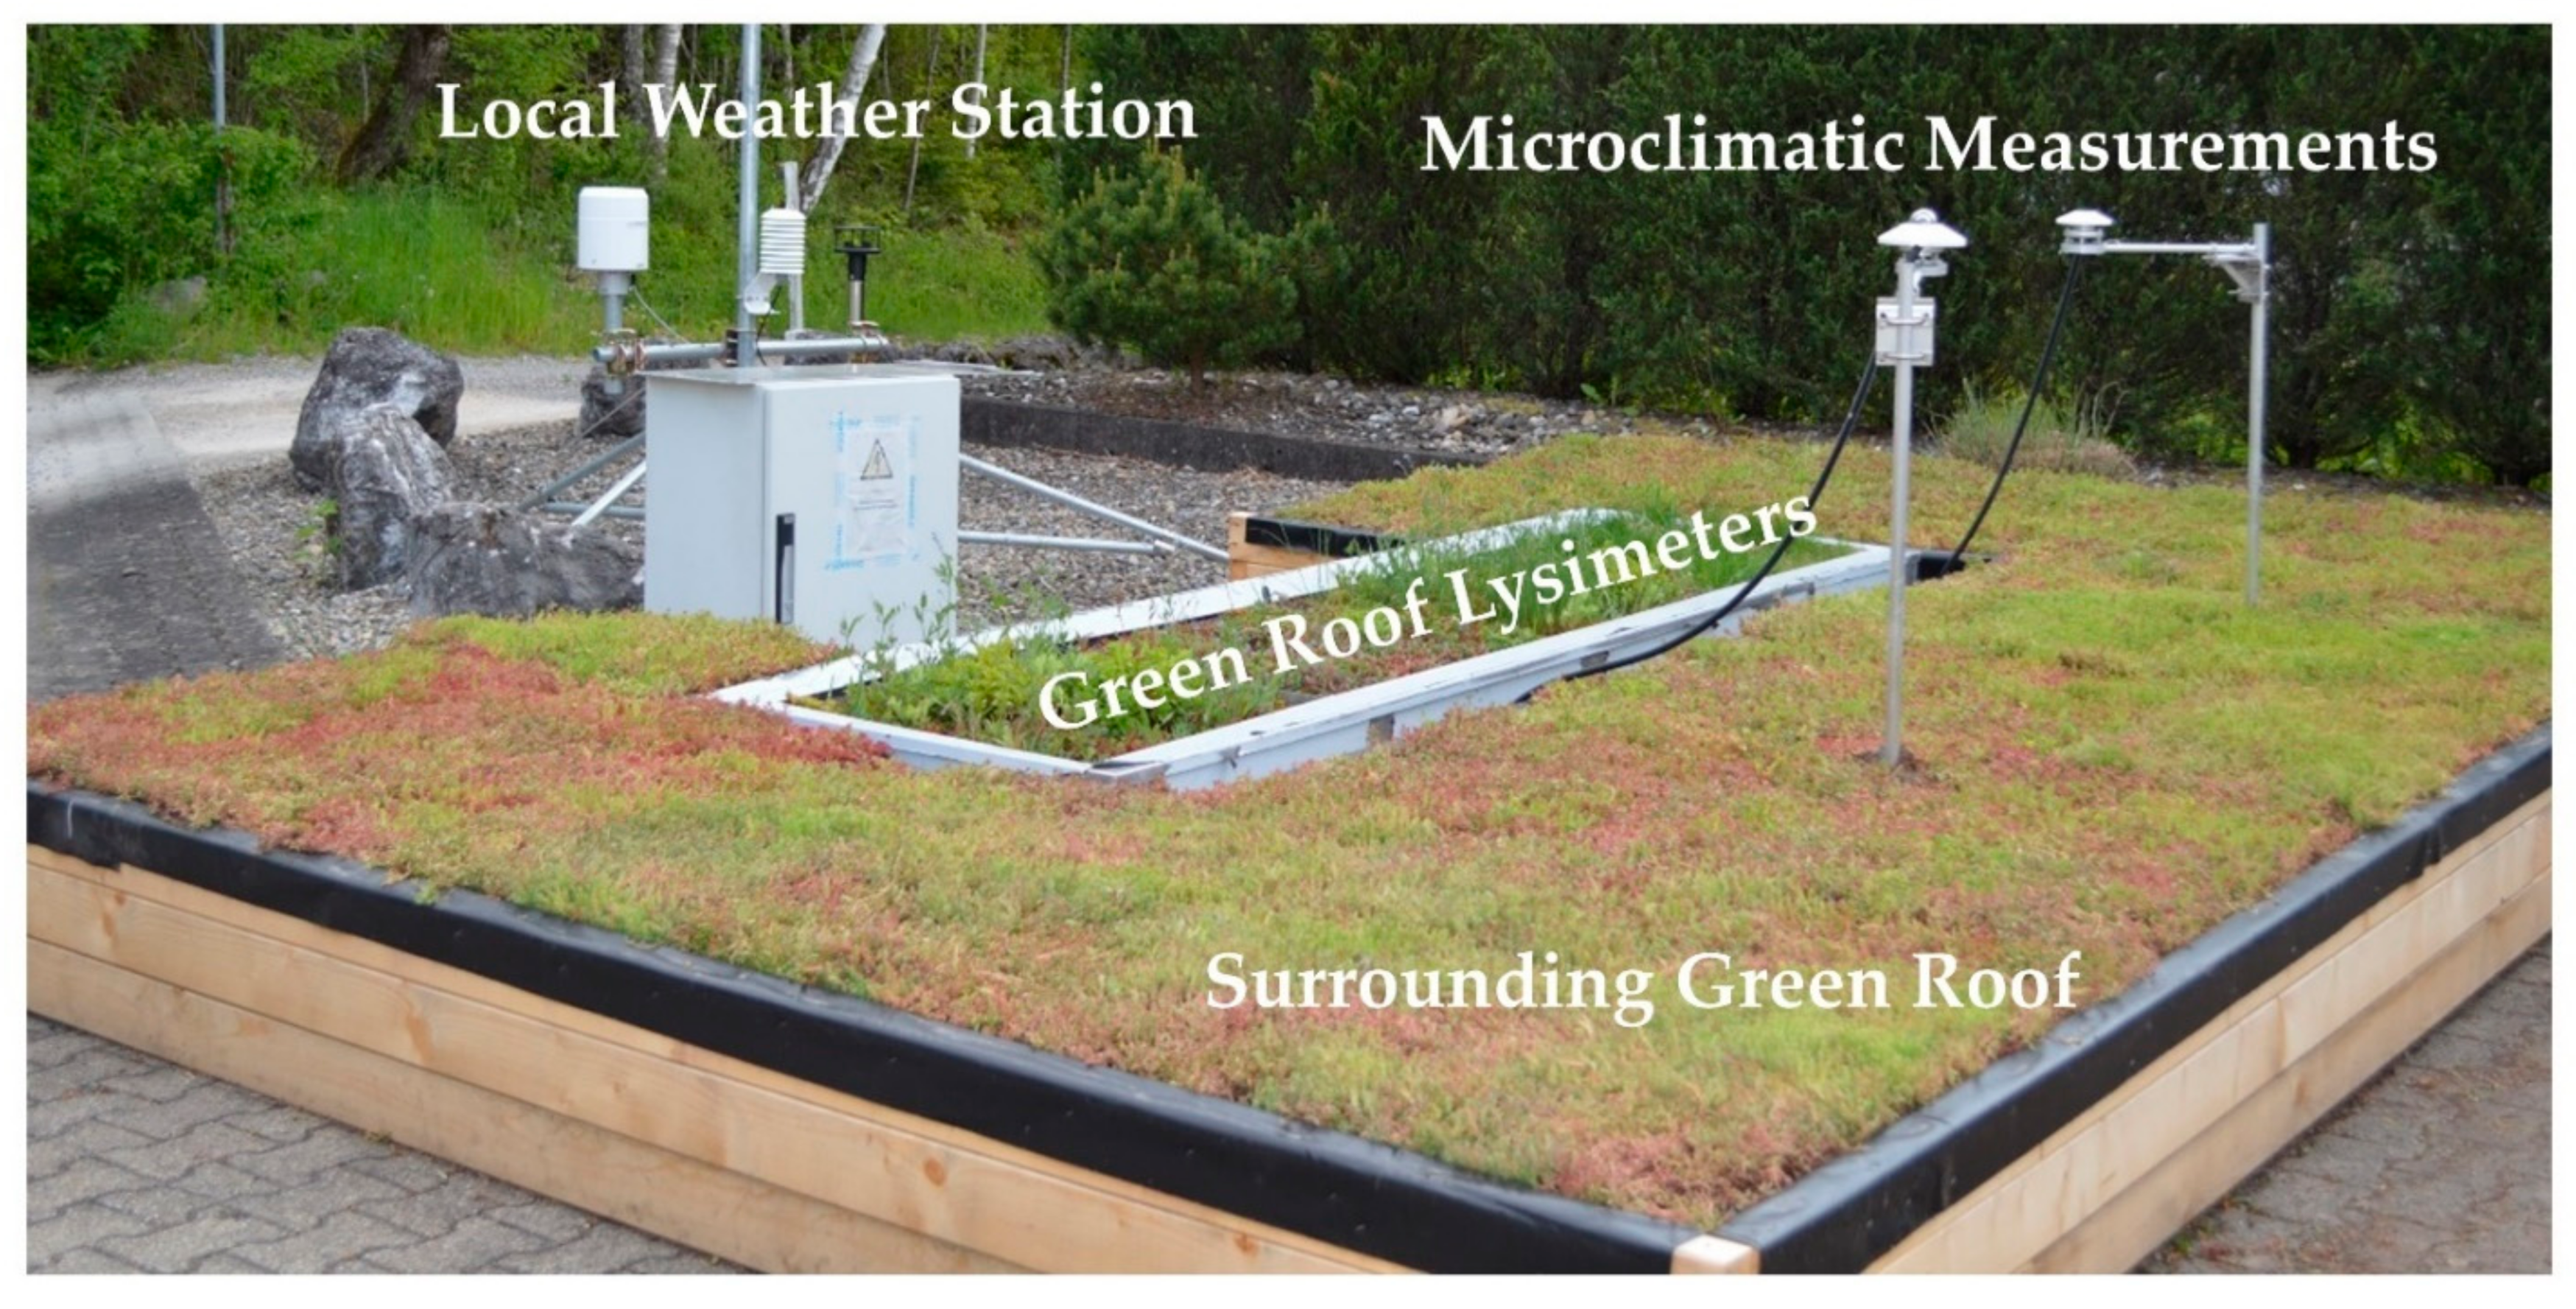
2.1. Site Description

The study site is located in Göggingen-Krauchenwies, Germany (48°0′20.27916″ N, 9°12′5.33952″ E) at 623 m altitude and belongs to the warm summer, humid continental climate zone according to the Köppen-Geiger classification [32]. The lowest mean, minimum and maximum temperatures occur in January and are −0.7 °C (−4.2 °C; 2.7 °C) respectively. The highest mean, minimum and maximum temperatures are 17.9 °C (10.7 °C; 24.5 °C) in July, and the precipitation is evenly distributed throughout the year, reaching an average total of 699 mm (reference period: 2016–2021, station Sigmaringen-Laiz at 581 m altitude, 8.5 km distance from the study site [33]).

2.2. Experimental Setup

The experimental site is located at ground-level at the side of a parking lot at the aforementioned coordinates, with a few trees throwing shade evenly across the area in late afternoon. Lysimeters with four different green roofs, each with an area of 0.5 m2, were set up together with a local climate station in spring 2021. To minimize the edge effects from the pavement, a green roof of about 16 m2 was constructed around the experimental roofs (Figure 1). The measurement period and data used in this study range from the 1 April 2021 until the 5 October 2021. Details about the measured parameters and installed devices are given in Table 1. Measurements were taken at 5 min intervals.

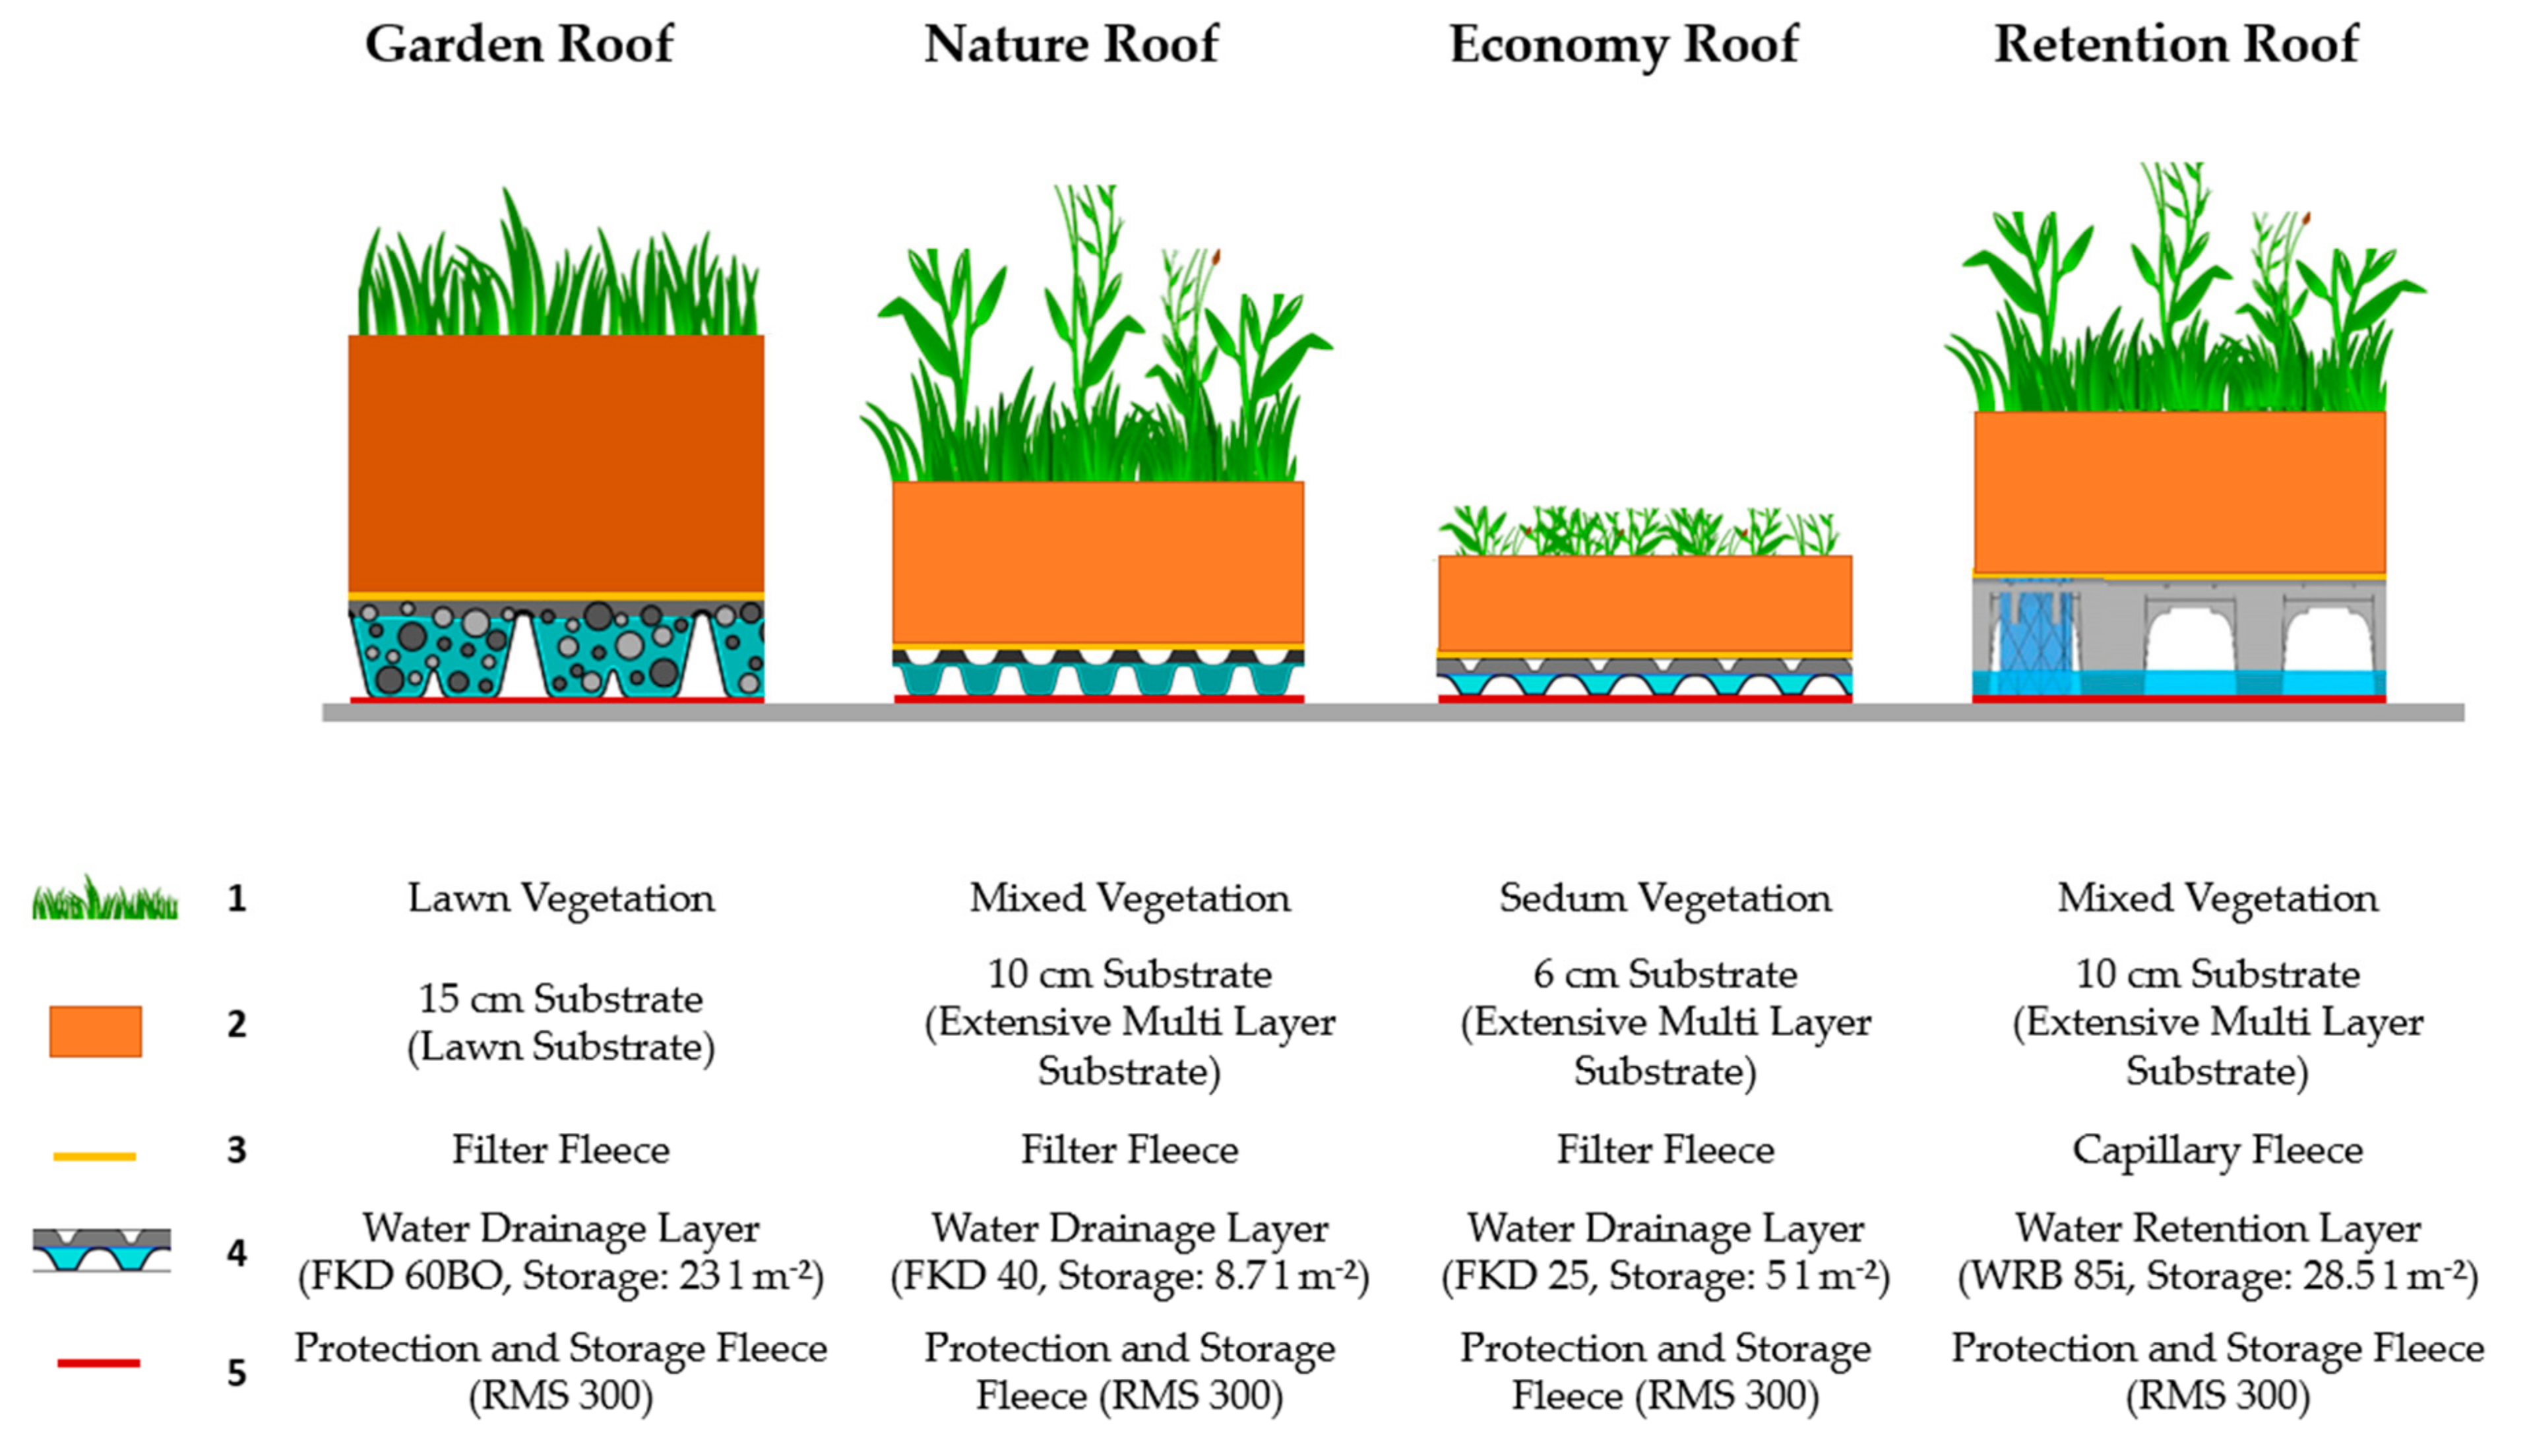
2.3. Green Roof Systems Description

The four green roof systems included in this study are the Garden Roof, Economy Roof, Nature Roof and Retention Roof, which are commercially available from Optigrün international AG, Germany. They can be distinguished based on vegetation, substrate type and depth, filter fleece, and the water retention and drainage layer (Figure 2).
The vegetation is comprised of typical lawn species (Garden Roof), Sedum species (Economy Roof), and mixed vegetation with succulents and herbs (Nature and Retention Roof). The lawn vegetation was transferred from a pre-grown Garden Roof onto the lysimeter, the Economy Roof received sprouts of different Sedum species and other low-growing perennials. Both the Nature and Retention Roof were planted with Sedum sprouts and seeds of various herbs in 2019.
The Optigrün Lawn Substrate of the Garden Roof consists of expanded shale, expanded clay, lava, pumice, crushed brick and green waste compost, while the Optigrün Extensive Multi-Layer Substrate used in the other systems also includes Porlith.
The fleece layer of the Garden, Nature and Economy Roof is a filter fleece with a thickness of 1.1 mm, while the Retention Roof contains a capillary fleece of 3.6 mm, which is able to quickly distribute water.
The drainage layers differ among all green roof systems: the Garden Roof is equipped with the Optigrün Drainage and Storage Board FKD 60BO from recycled high-density polyethylene, consisting of a 6 cm high chamber network filled with a drainage material. About 23 L m−2 of water can be stored in this system. The Nature Roof has the Optigrün Drainage and Storage Board FKD 40, which is about 4 cm high, with a water storage of 8.7 L m−2. The Economy Roof contains the shallow Optigrün Drainage and Storage board FKD 25 similar to the Nature Roof, but is only 2.5 cm high, and thus has a water reservoir function of only 5 L m−2. The Retention Roof contains the Optigrün Water Retention Box WRB 85i from recycled polypropylene, which can temporarily contain a water volume of up to 80 L m−2. In this study, a permanent water accumulation is reached in the Retention Roof by positioning the outflow at 3 cm height instead of at the bottom of the system, leading to a water storage capacity of 28.5 L m−2. Further, it contains capillary bridges, which allow for the vertical transportation of water between the drainage level and substrate layer through capillary forces.
The Optigrün Protection and Storage Fleece RMS 300, with a thickness of approximately 3.6 mm, protects the roof’s waterproofing.

2.4. Roof Maintenance

The green roofs were maintained according to the green roof guidelines [34]. In mid-April 2021, fertilizer (Slow Release Fertiliser Opticote, Optigrün AG, Krauchenwies, Germany) was added with 50 g m−2 to the Garden Roof and 35 g m−2 to the other three roofs. The Garden Roof was watered twice until field capacity (once in April, once in May). Weeding was carried out whenever needed and, due to the removal of plant biomass, the weight of each weeded roof was set to “not-a-number” (NaN) on the respective day. The grass of the Garden Roof was cut four times (in May, twice in July and once in September). The Nature Roof was weeded five times (in May, July, and three times in September), the Economy Roof had to be weeded only three times (in May, and twice in September) and the Retention Roof was weeded twice (once in May and once in September).

2.5. Data Processing

The hours at which maintenance work such as weeding, broken sensor replacements or cleaning of outflow sensors was carried out at the lysimeter station were excluded from the dataset. Additionally, the weight, outflow and soil moisture were set to NaN on the days where the Garden Roof was irrigated.
After inspecting the raw data (i.e., measurements in the interval of 5 min), reasonable minimum and maximum values were defined in order to exclude outliers: precipitation 0–2.5 mm, air temperature −10–40 °C, relative humidity 0–100%, short-wave solar radiation 0–1250 W m−2, long-wave radiation 250–450 W m−2, wind speed 0–3 m s−1, leaf temperature −20–55 °C, substrate temperature −10–45 °C, volumetric water content ≥0–1 m3 m−3 and heat flux −16–40 W m−2.
The weights of all fields were smoothened to hourly values due to strong variations, especially at the scale of the Garden Roof. Continuous increases and decreases in the weight would have led to an overestimation of weight loss, and thus in evapotranspiration.

2.6. Calculation of Vegetation Cover and Plant Area Index

For the estimation of the vegetation cover and the plant area index (PAI), triplicate photos were taken of each roof approximately once per week with a digital camera (D3200, Nikon, Düsseldorf, Germany and 8 mm/3.5 Fish-Eye II Lens Walimex pro, Studioexpress Vertriebs GmbH, Wiernsheim, Germany). The calculation of the vegetation cover and PAI was performed with the freeware CAN-EYE (INRAE, Paris, France). The PAI was calculated as the ratio of the plant area over the ground area, above which plants were growing.

2.7. Determination of Evapotranspiration

The daily evapotranspiration was calculated based on precipitation, outflow and smoothened weight of the roofs. Each of the smoothened weight values consisted of the mean of one hour calculated from 12 single-weight datapoints (the first ranging from 00:00 to 00:55 o’clock, the second from 01:00 to 01:55, etc.). Thus, each day contained a total of 24-hourly values and only complete days with 24 weight values were considered for the calculation. Equation (1) gives the calculation of the evapotranspiration for one specific day and one specific field
Evapotranspiration = Weight 00   Weight 23 Outflow + Precipitation × 0.5  
where Weight00 and Weight23 are the weights at the beginning and at the end of the day, respectively, and the outflow and the precipitation are the sum over the entire day. Both weight and outflow are based on the area of a single roof (≙0.5 m2) and are, therefore, expressed as kg per 0.5 m2 and l per 0.5 m2, while the precipitation is measured per m2, and thus needs to be divided by half. The calculated evapotranspiration has the unit l per 0.5 m2; however, all results presented in this study are scaled up to 1 m2.
Due to clogging and malfunctioning of the rain sensor, no precipitation data are available from the 7 June until the 16 August, and this gap could not be filled with data from any nearby weather station. Therefore, the evapotranspiration was calculated differently for the period without the rain sensor (Equation (2)); the units are as described above:
Evapotranspiration = Weight 00   Weight 23 Outflow
Days with negative evapotranspiration values are excluded, as this means that more rain has fallen than was evapotranspirated or lost as outflow. On days where only little rain fell, the evapotranspiration is slightly underestimated by the amount of the rain that was not incorporated into the calculation.
For the calculation of monthly and yearly sums of evapotranspiration, data for different roof systems must remain comparable, despite short-term sensor failures. Therefore, data were extrapolated onto the same number of days when needed, i.e., when only 28 days in one month were recorded for the Garden Roof, the monthly sum was extrapolated to 30 or 31 days depending on the month to allow for comparison to the other roofs containing data for the full month. Any extrapolation in the results is highlighted.

2.8. Statistical Analysis

All statistical analysis was done in RStudio Desktop Version 1.3.1093 [35] and R Version 4.0.3 [36]. To find out which factors play an important part in the evapotranspiration, a partial least square (PLS) regression was performed using the R-package “pls” and the function “plsr”. The regression was performed separately for each roof. Cross-validation was used to validate the model, as suggested in [37]. The PLS summary was used to choose the number of components based on the explained variance in the evapotranspiration, as well as the root mean squared error of prediction, with the aim of maximizing the explained variance and minimizing the error to neither underfit nor overfit the model [37]. The following variables, most of which are also used by [30], were considered in the PLS regression: soil moisture, soil heat flux, soil temperature, leaf temperature, relative humidity, wind speed, short-wave solar radiation, long-wave radiation, precipitation. Short-wave and long-wave radiation as well as precipitation were included as daily sums, and all other variables as daily means. As changes in the vegetation cover and PAI are generally very slow, these two variables were recorded only once per week. Consequently, the difference in measurement interval makes it impossible for the regression to relate the day-to-day variation in the evapotranspiration rate to the vegetation cover or PAI, which is why these two variables were excluded from the PLS regression. Further, the regression was only performed for the period in which the rain sensor was functioning. Based on the regression, the Variable Importance in Projection (VIP) was determined using the R function “VIP” of the package “plsVarSel”. For the determination of differences in means, a repeated measures analysis of variance (ANOVA) was chosen, and in case the assumptions were not met, the Friedman Test was used. The level of significance was set to 0.05.

3. Results

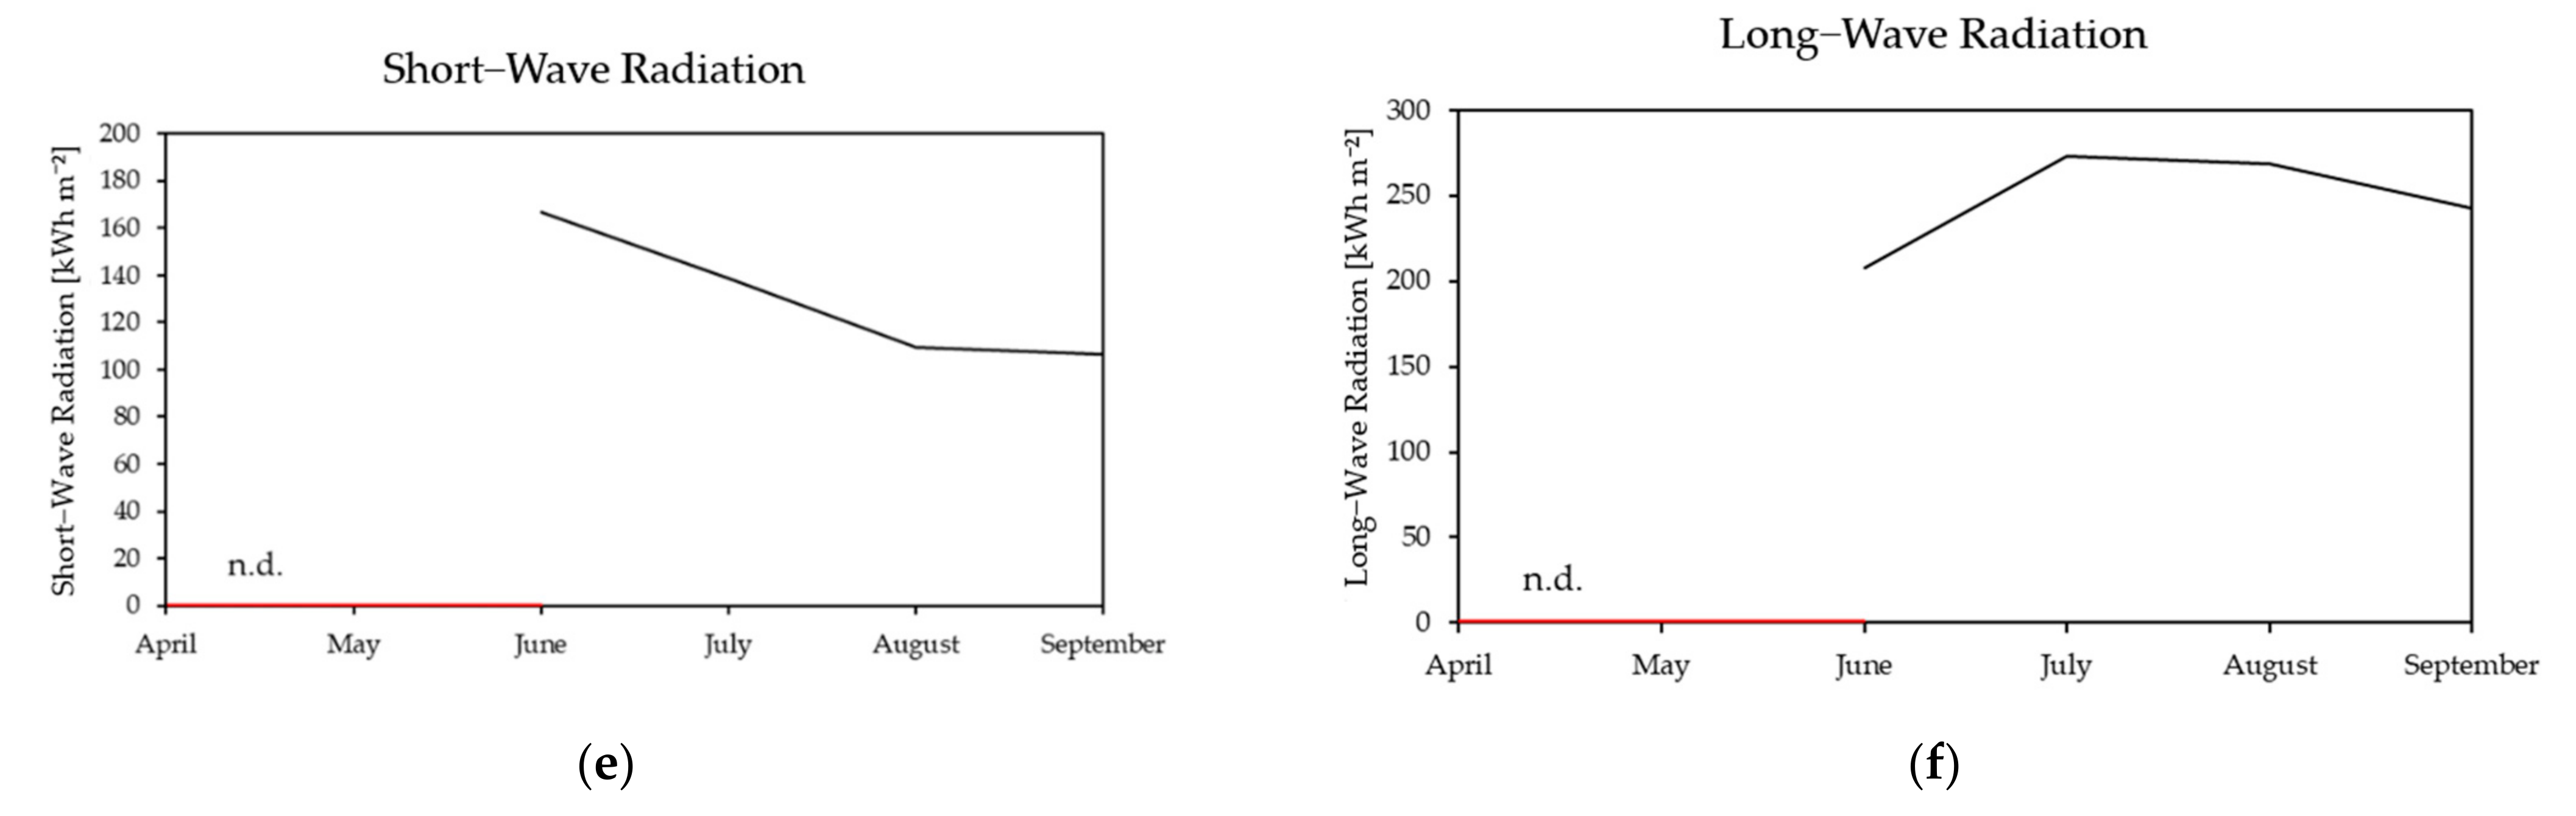
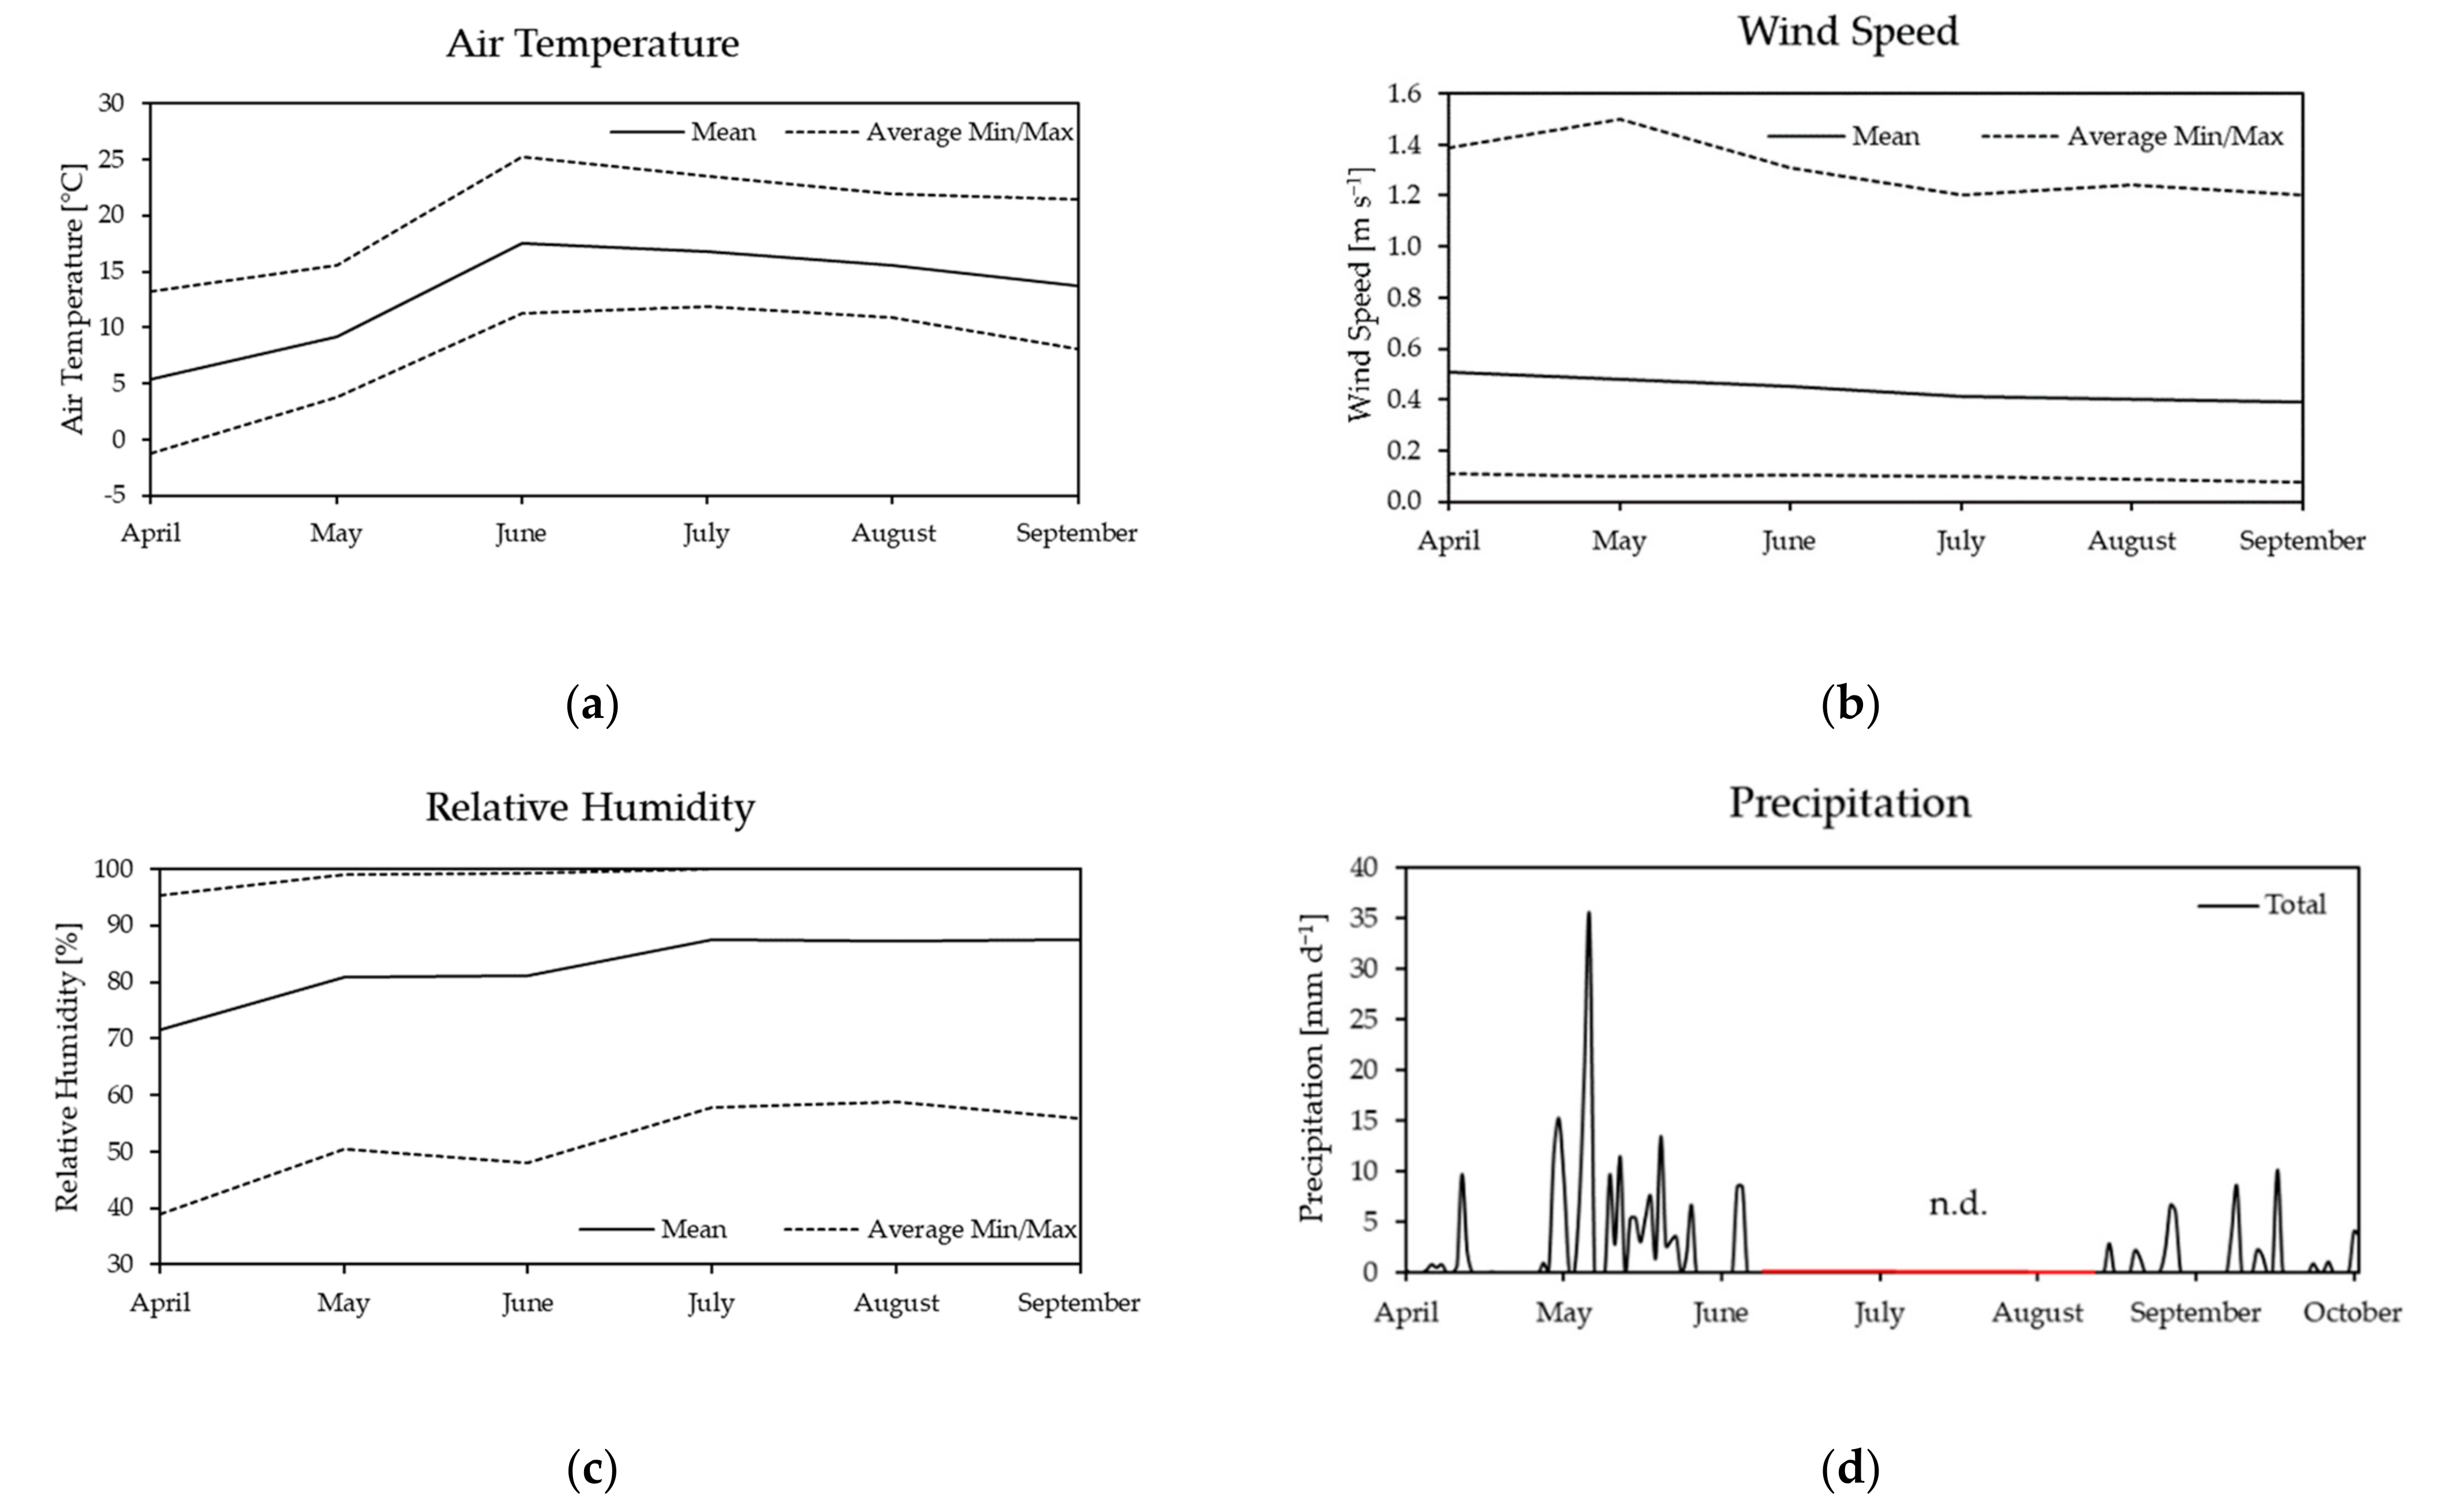
3.1. Weather Conditions

Overall, the summer months in Göggingen were slightly colder and much wetter (Appendix A, Figure A1) compared to the reference period data of 2016–2021 [33]. More precisely, April, May, July and August were colder and only June and September were a little warmer than usual. The precipitation of the summer months of May, June and July was a lot higher, as it rained, in total, over 400 mm instead of 275 mm [33], while April, August and September were drier compared to the reference climate.

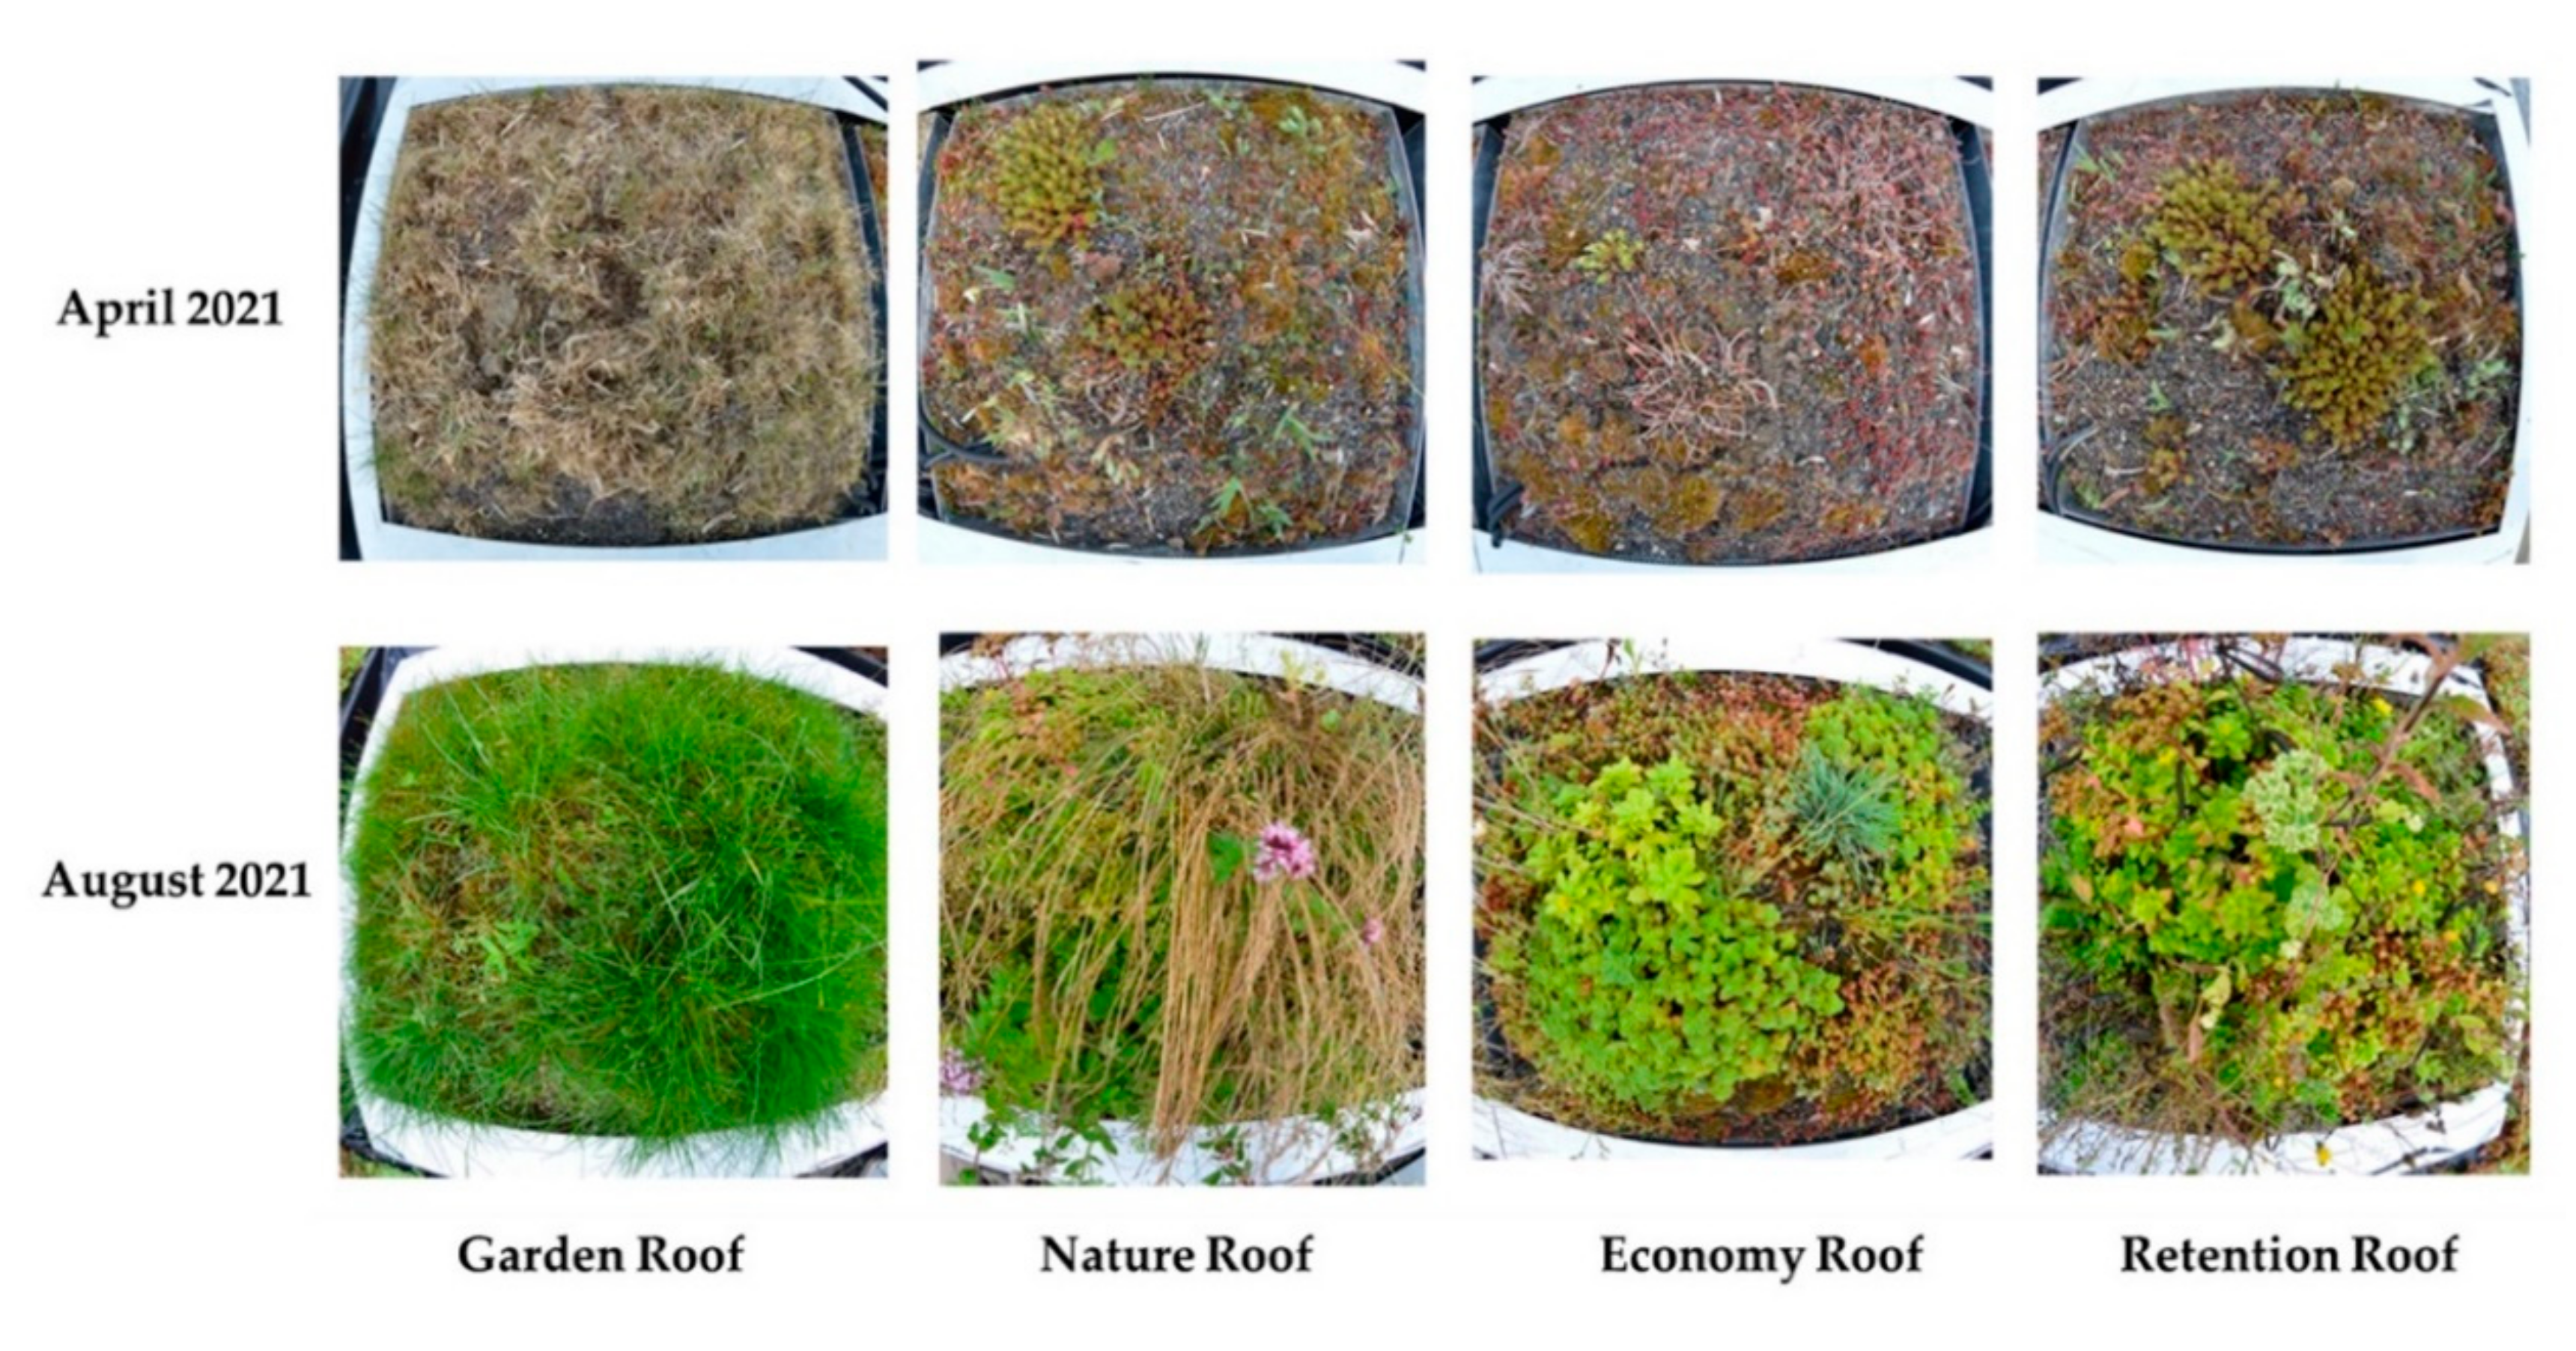
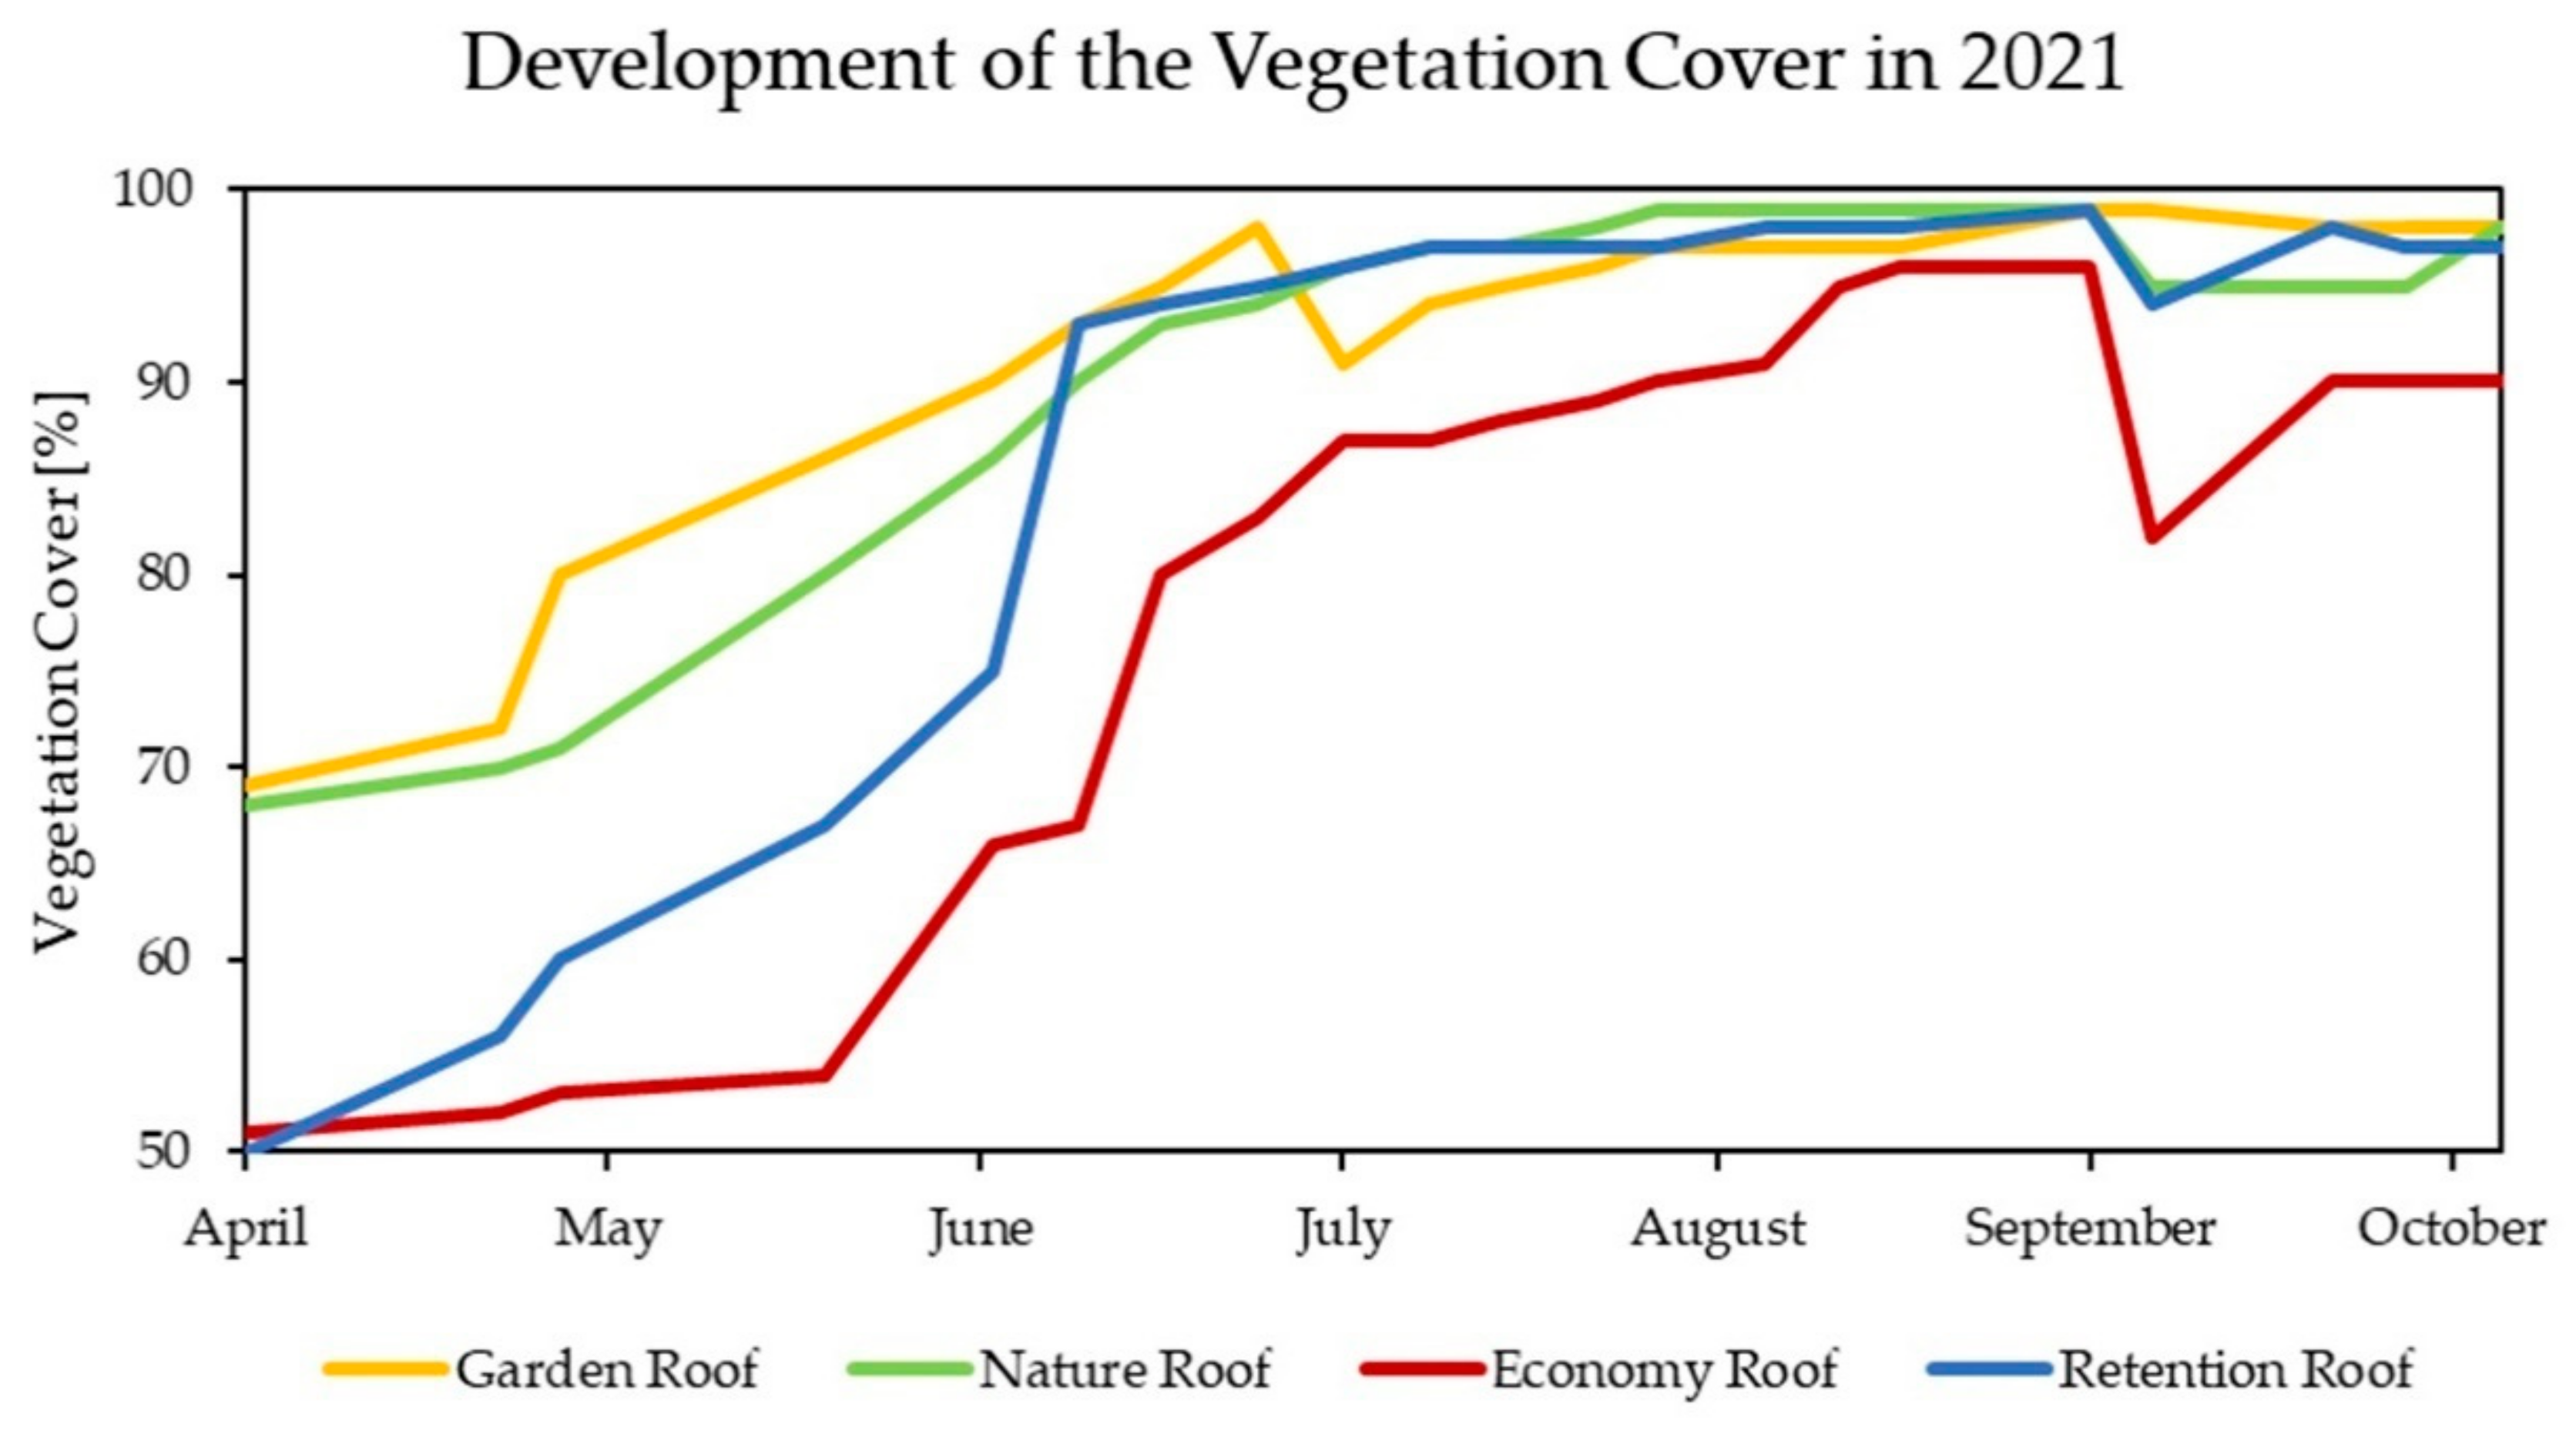
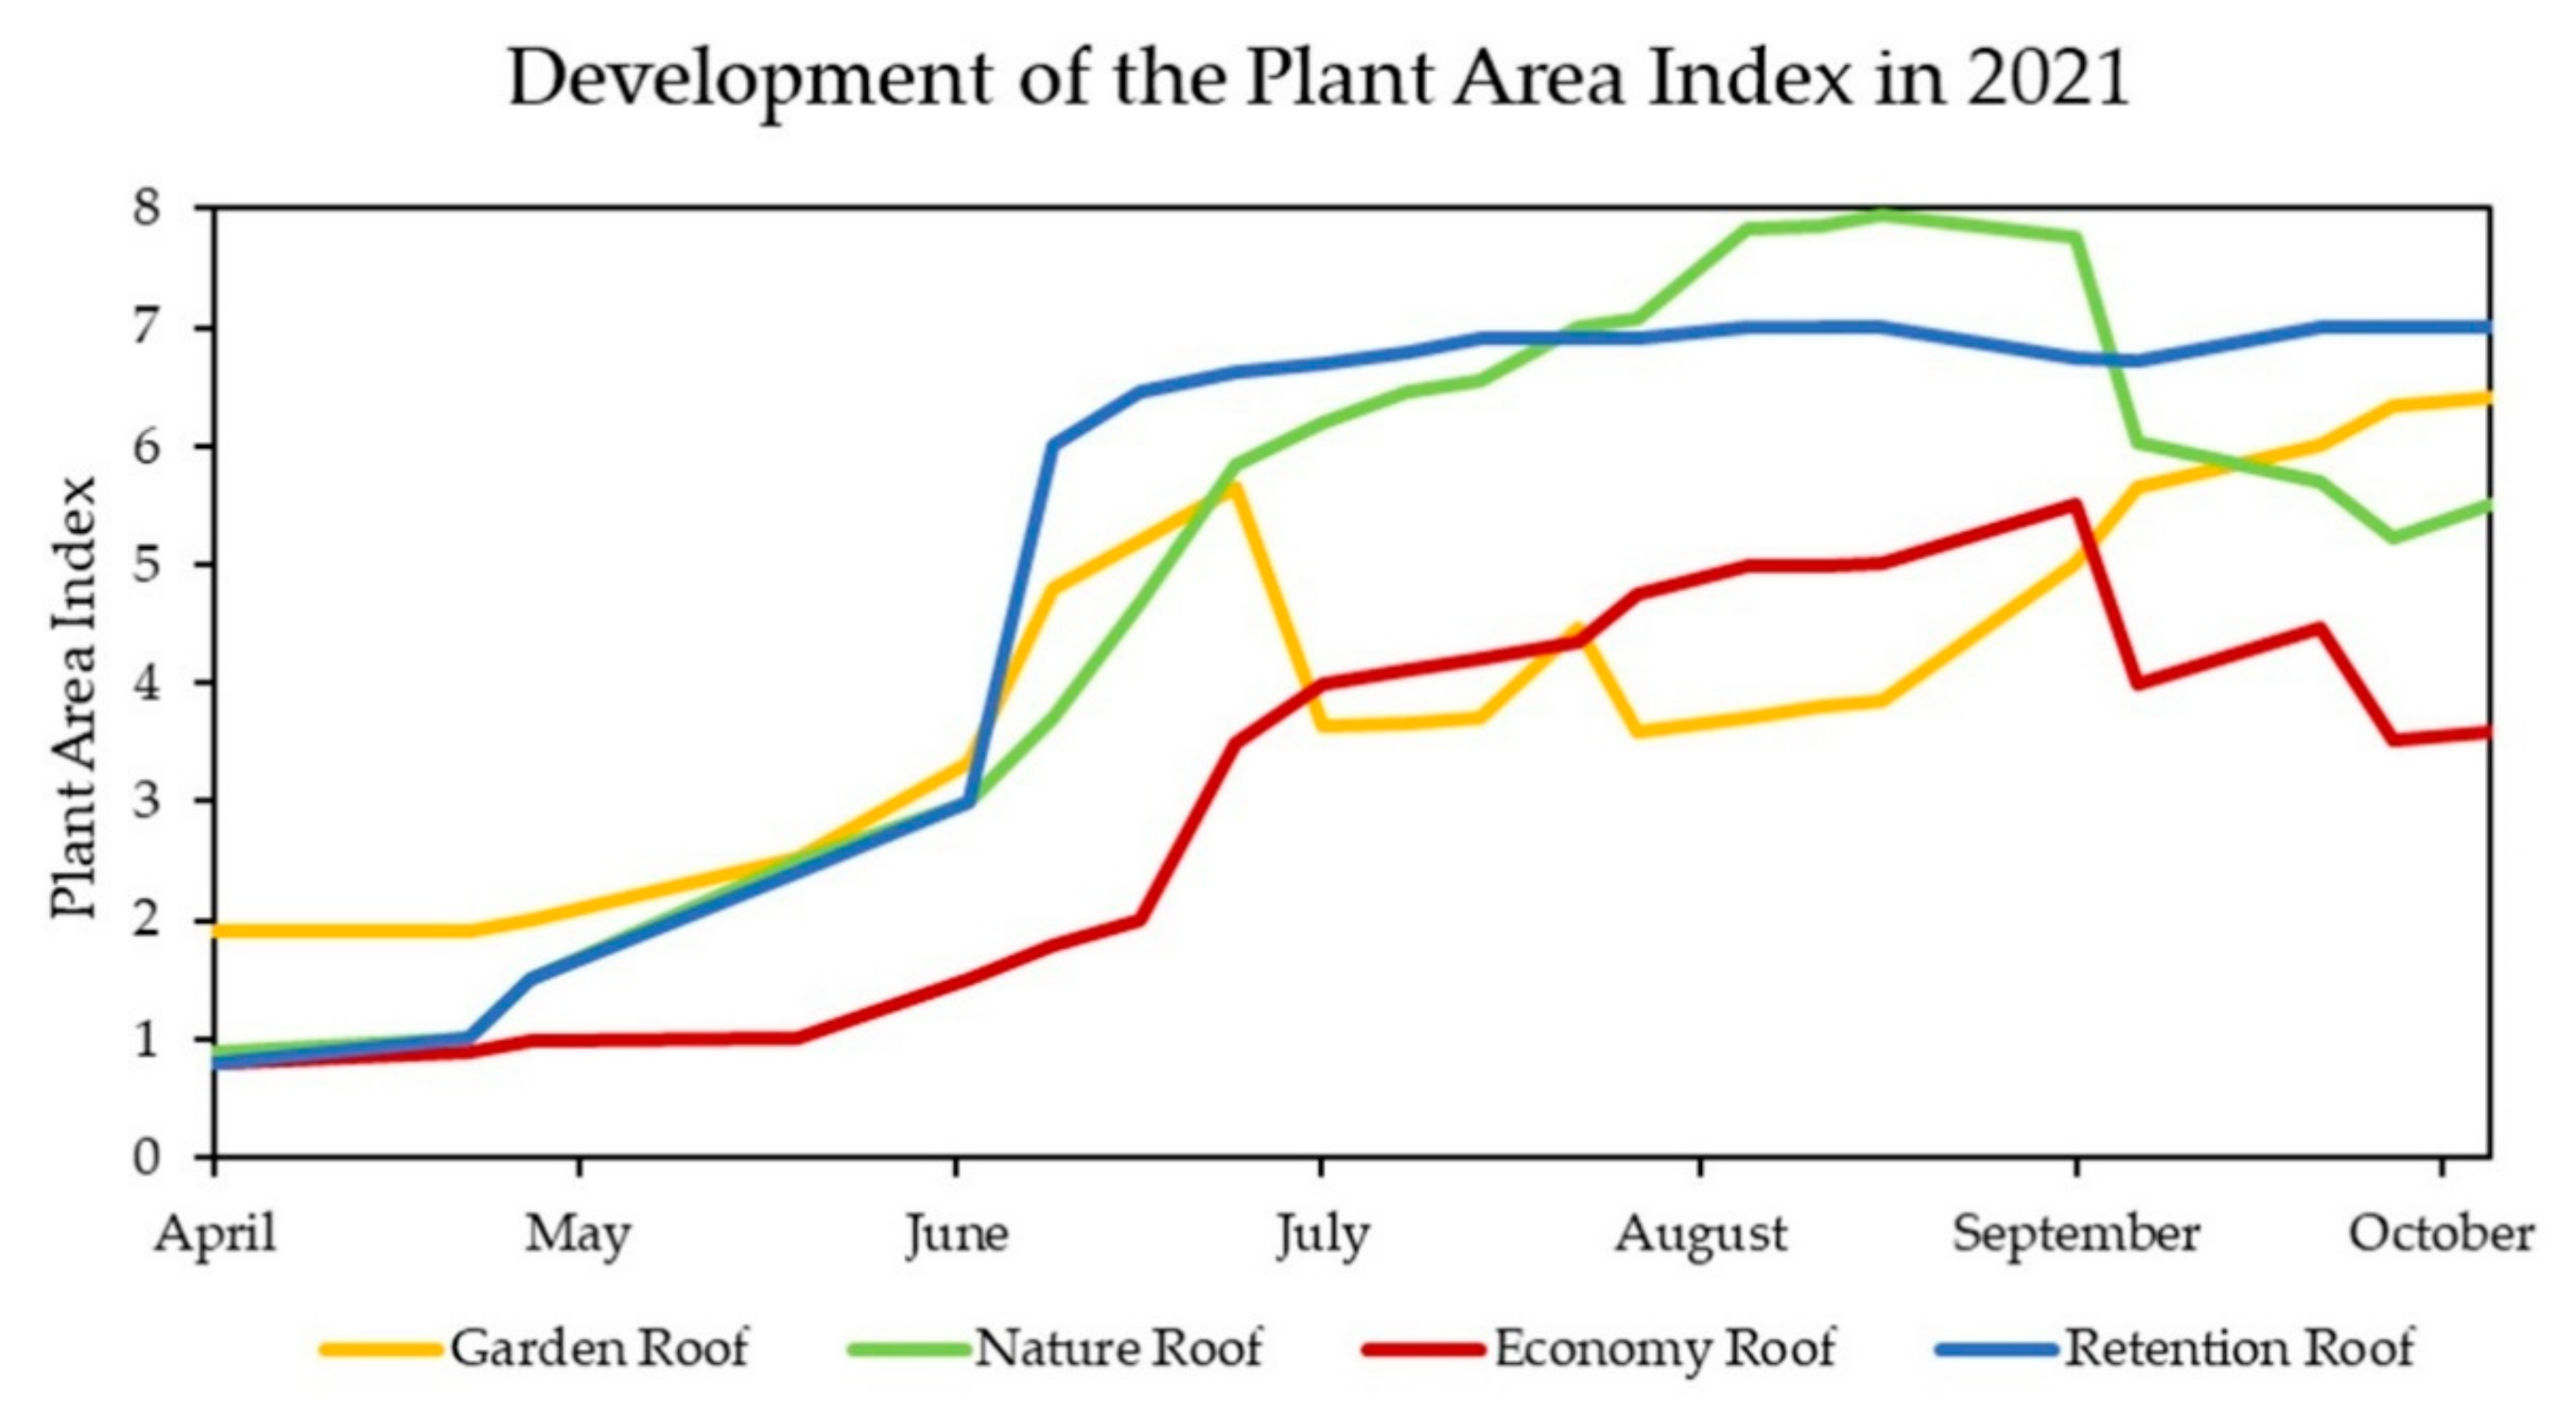
3.2. Vegetation Development

The survey of the vegetation development showed clear differences among the green roof systems (Figure 3). The Garden Roof was the first to reach 90% cover in the beginning of June, while the Nature Roof grew steadily and came to 90% shortly afterwards. Even though the Retention Roof started at 50% vegetation cover, together with the Economy Roof, it rapidly increased its cover and reached the 90% mark in the same week as the Nature Roof. The slowest development was registered for the Economy Roof, which showed little growth in the first 2 months, but quickly gained cover from the end of May onwards. However, it stagnated in July and only reached 90% cover by the end of July. The slight decreases in the cover of the Garden Roof in June, as well as of the Retention Roof, the Economy Roof and the Nature Roof in September, can be attributed to roof maintenance and weeding of unwanted species.
The plant area index (PAI) mostly increased slowly during the first months and more rapidly from June onwards (Figure 4). The Nature Roof reached the highest PAI of about 8; the Retention Roof was just below, with 7. The Economy Roof came up to 5 and the Garden Roof remained at around 4. Similar to the plant cover, the weeding of the Garden Roof also led to a decrease in the PAI.
Regarding the plant species, the Garden Roof was dominated by various grass species. The Economy Roof was covered by a mixture of succulent species such as Sedum album and Sedum reflexum. Even though the Nature and Retention Roof had the same vegetation mixture when set up, different species dominated at the peak stage of plant development. The Nature Roof exhibited a broad range of species with Origanum vulgare, Sedum kamtschaticum und Sedum telephium, while the Retention Roof was mostly covered by Sedum kamtschaticum.

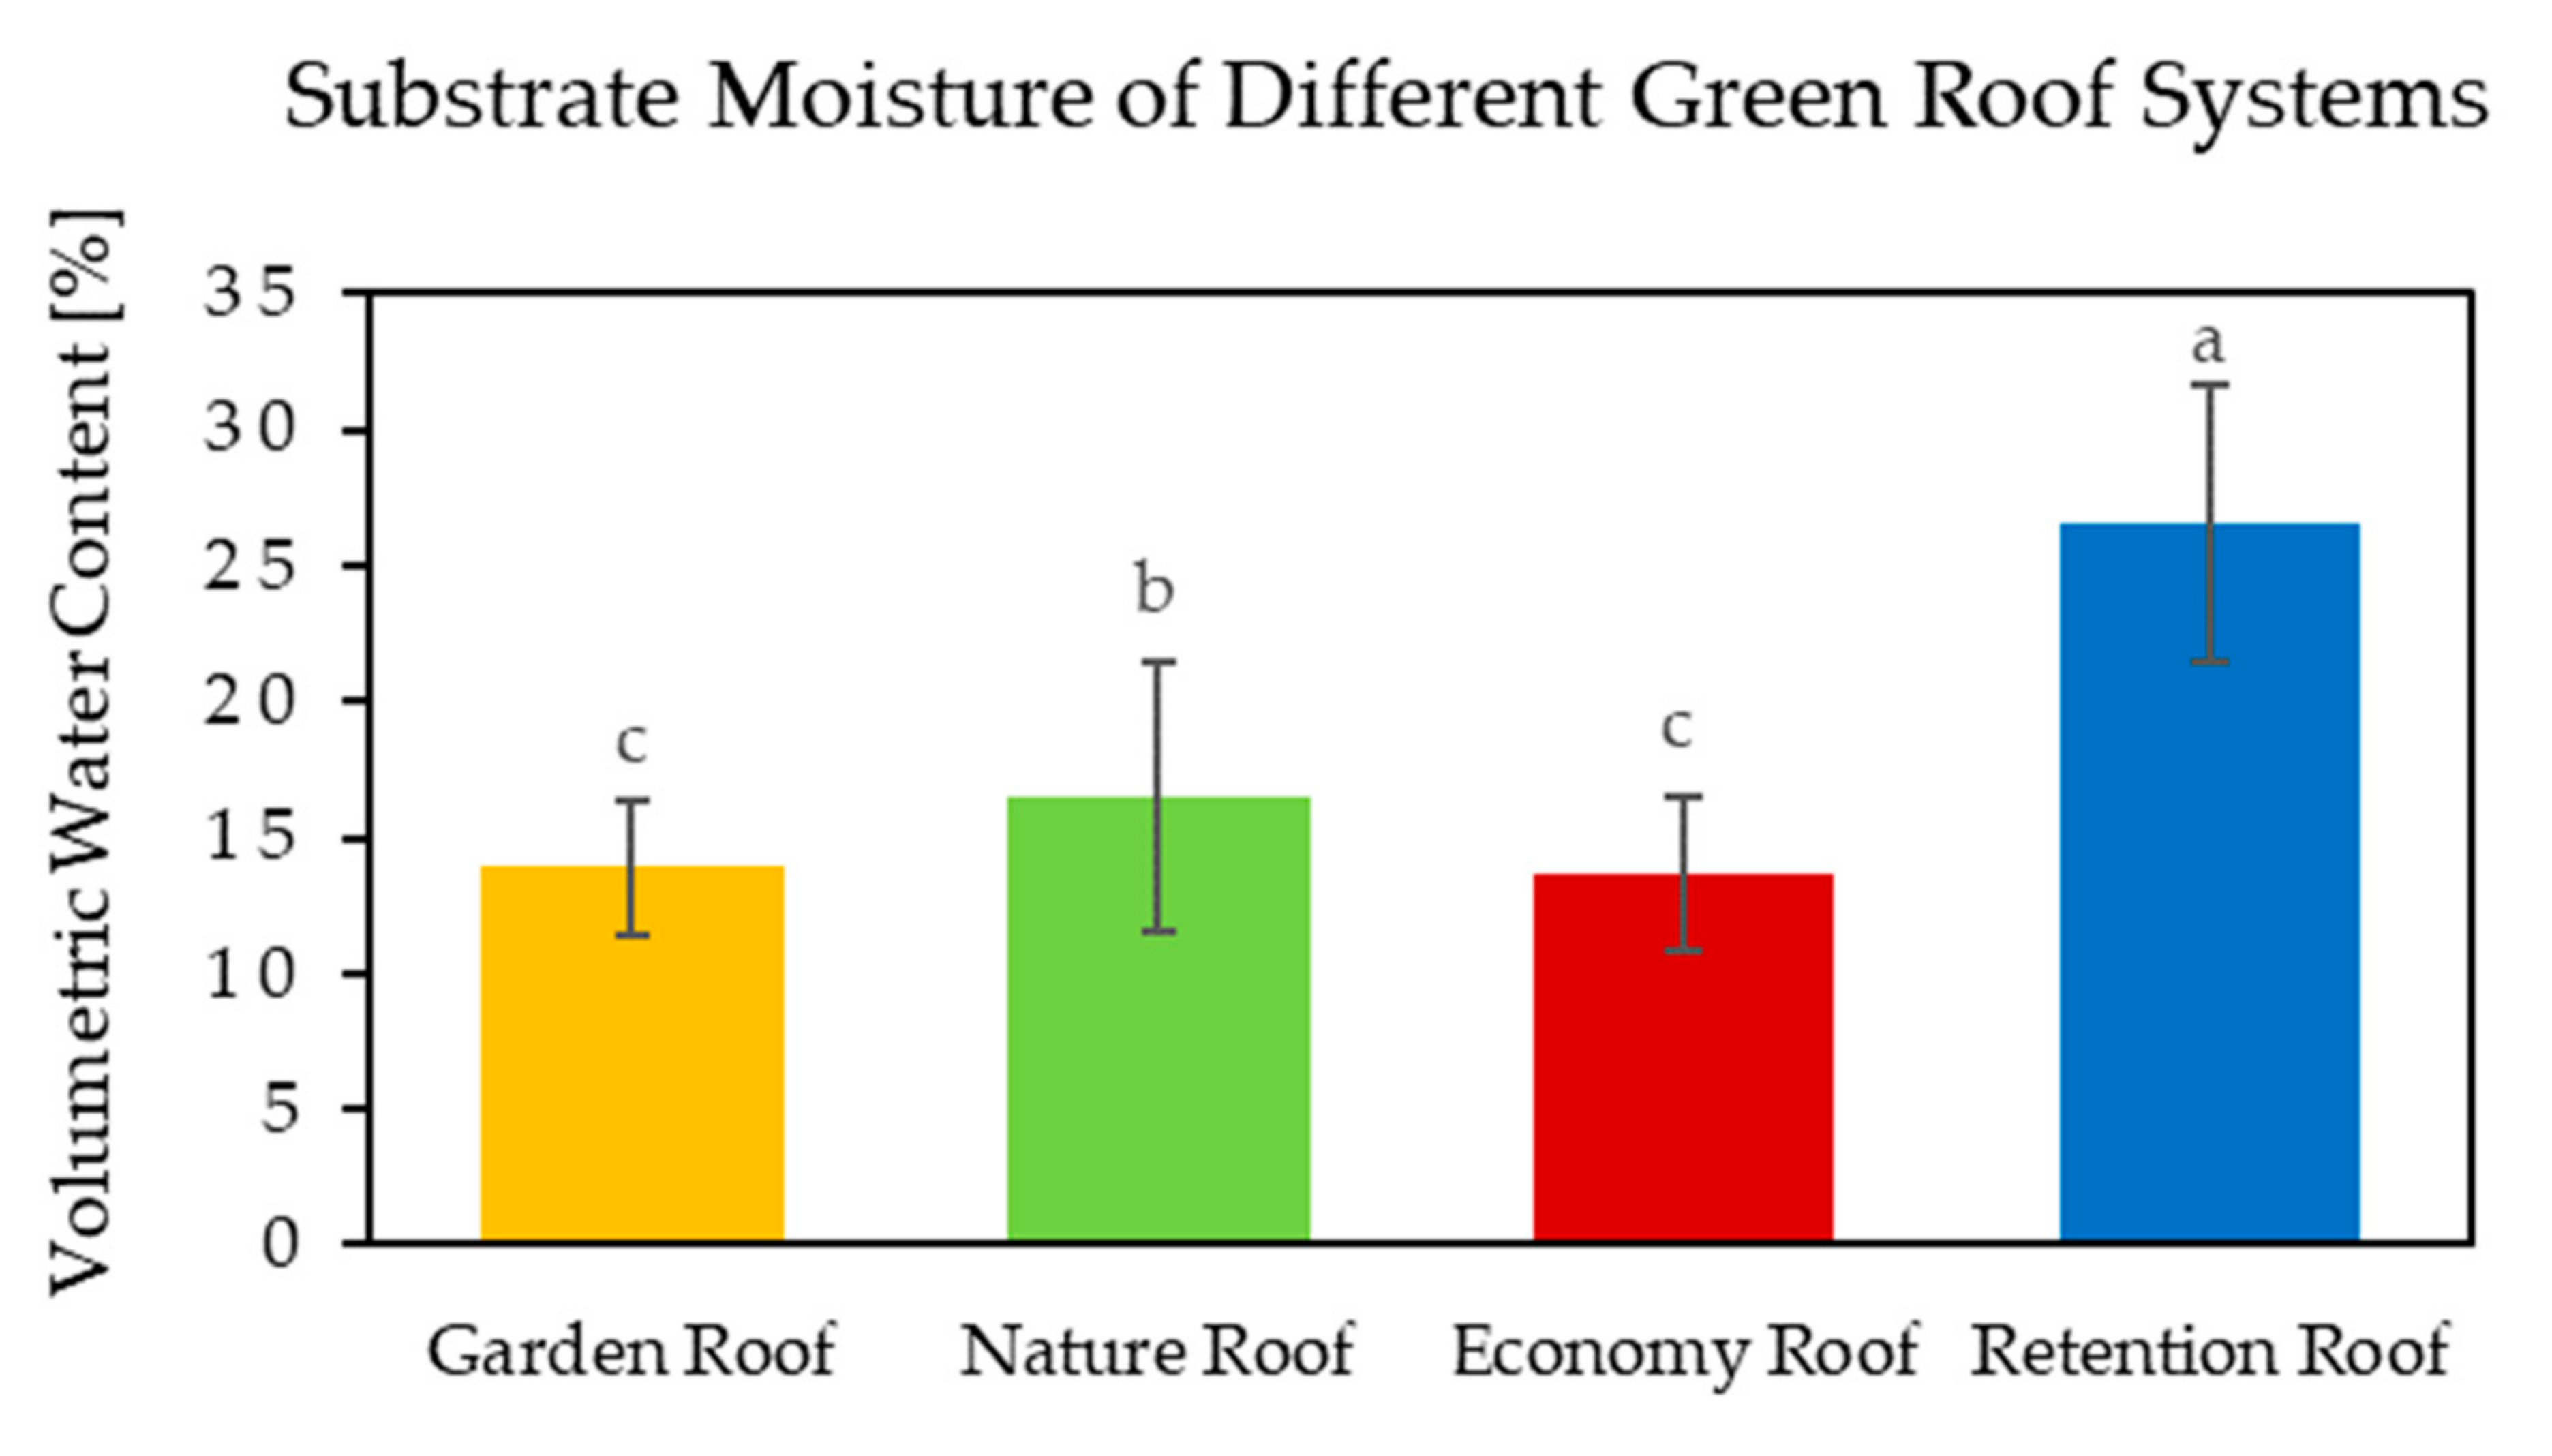
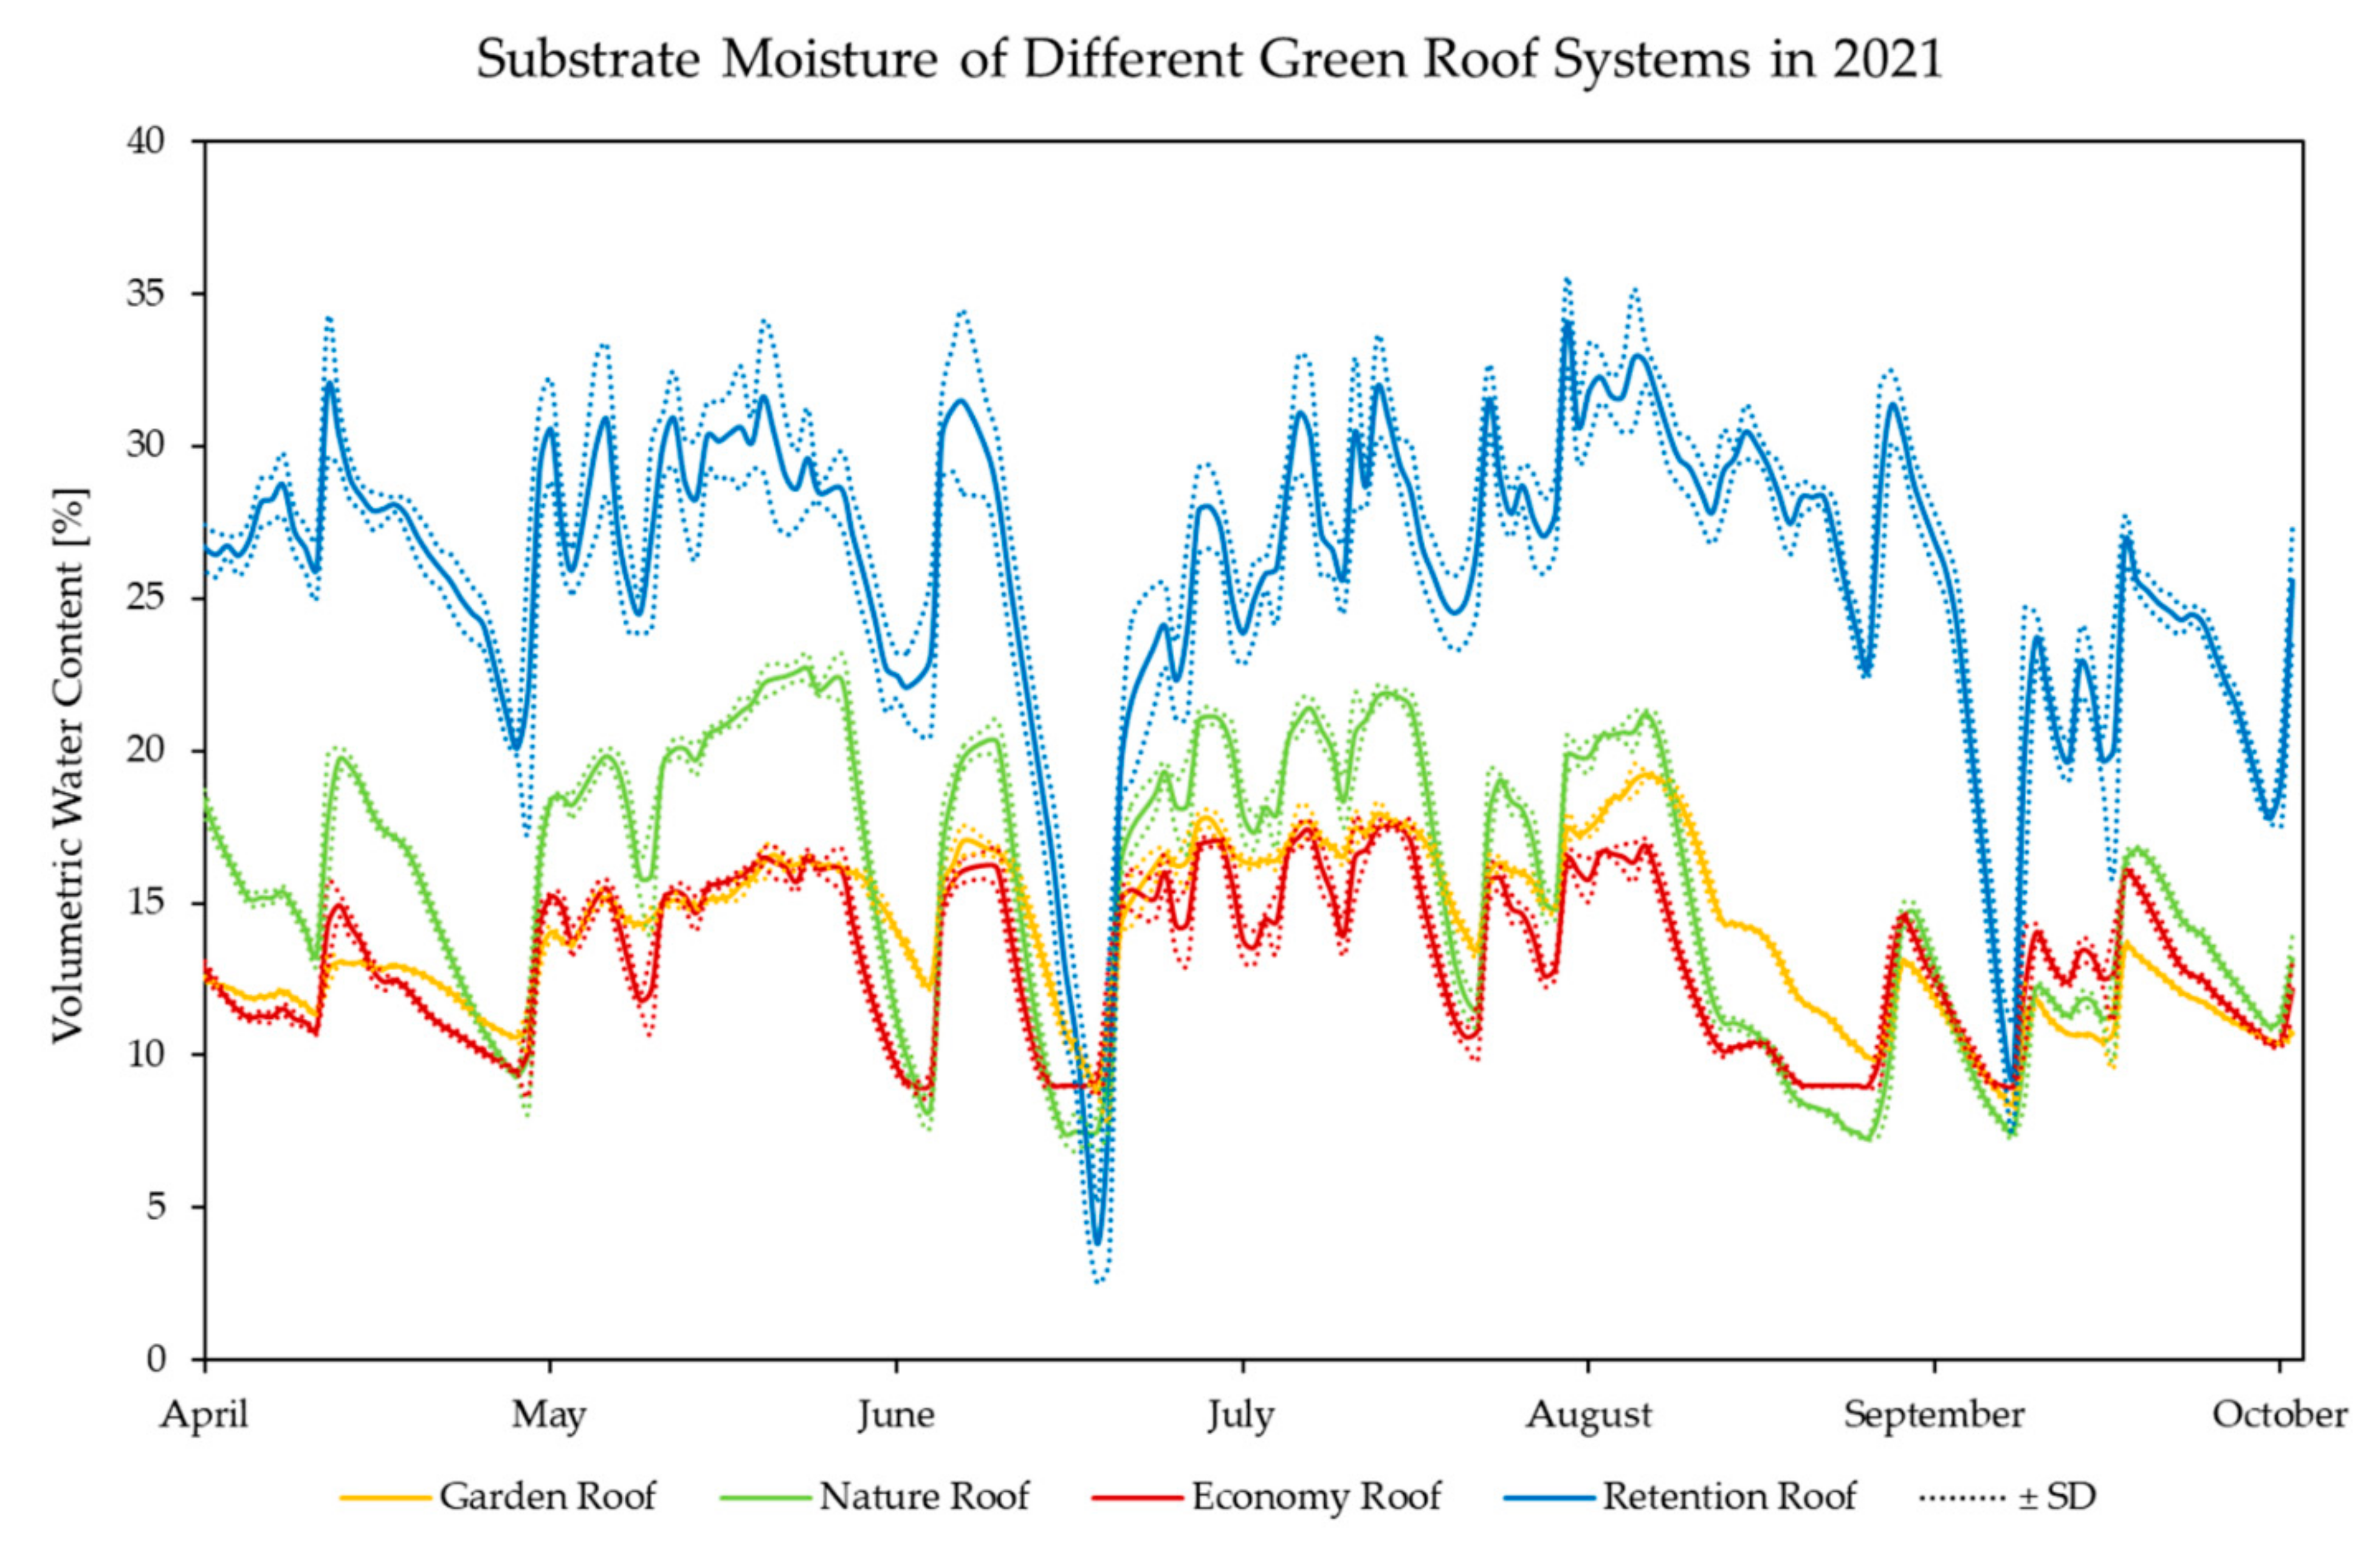
3.3. Substrate Moisture

The substrate moisture showed great variations over time due to the influence of precipitation and evapotranspiration; however, it can be noted that all roofs mostly remained above 10% (Figure 5). The Retention Roof had the highest substrate moisture with peaks of over 35%. Except for a few hot and dry summer days, during which the moisture content dropped below 10%, it generally maintained a considerably higher soil moisture compared to the other roofs. The moisture values of the Garden and Economy Roof differed only slightly, and the Nature Roof was mostly between the Retention and Economy Roof. Regarding the moisture ranges, the Garden Roof and the Economy Roof were the systems with the most stable moisture conditions, with only around 12% difference between their minimum and maximum value, while the Nature Roof and the Retention Roof had much larger differences of around 15% and 30%, respectively.
When the values are averaged over the entire growth period to a daily mean, the differences between the roofs become even more evident. The soil moisture of the Retention Roof, with 26.5%, is significantly higher than all other roofs. The Nature Roof, with an average of 16.5%, also has a significantly higher moisture level than the Garden and Economy Roof, which do not differ significantly, with 13.9% and 13.6%, respectively (Figure 6).
Differences in the cover were largest until July; however, due to the frequent rain events and only moderately warm summer temperatures in 2021, the soil moisture of all roofs remained relatively stable throughout the entire measurement period. Despite the initially low cover of both Retention Roof and Economy Roof, the substrate moisture did not strongly differ between the first and second half of the year. The Retention Roof had continuously high soil moisture, which shows that the water stored in the retention layer can effectively be returned to the substrate layer through the capillary fleece and the capillary bridges. This can be verified through comparison with the Nature Roof, which has the same system structure, except for the drainage layer, but lower soil moisture. Only when the water storage of the Retention Roof is completely empty, as in June, does the soil moisture drop. In April and May, the moisture values of the Garden Roof could be slightly overestimated, as it was watered twice in spring. Still, the soil moisture is generally low, which may be explained by the thicker substrate layer, in which the water is distributed more broadly. In the case of the Economy Roof, the substrate moisture is low because little water can be stored in the shallow substrate and drainage layer.

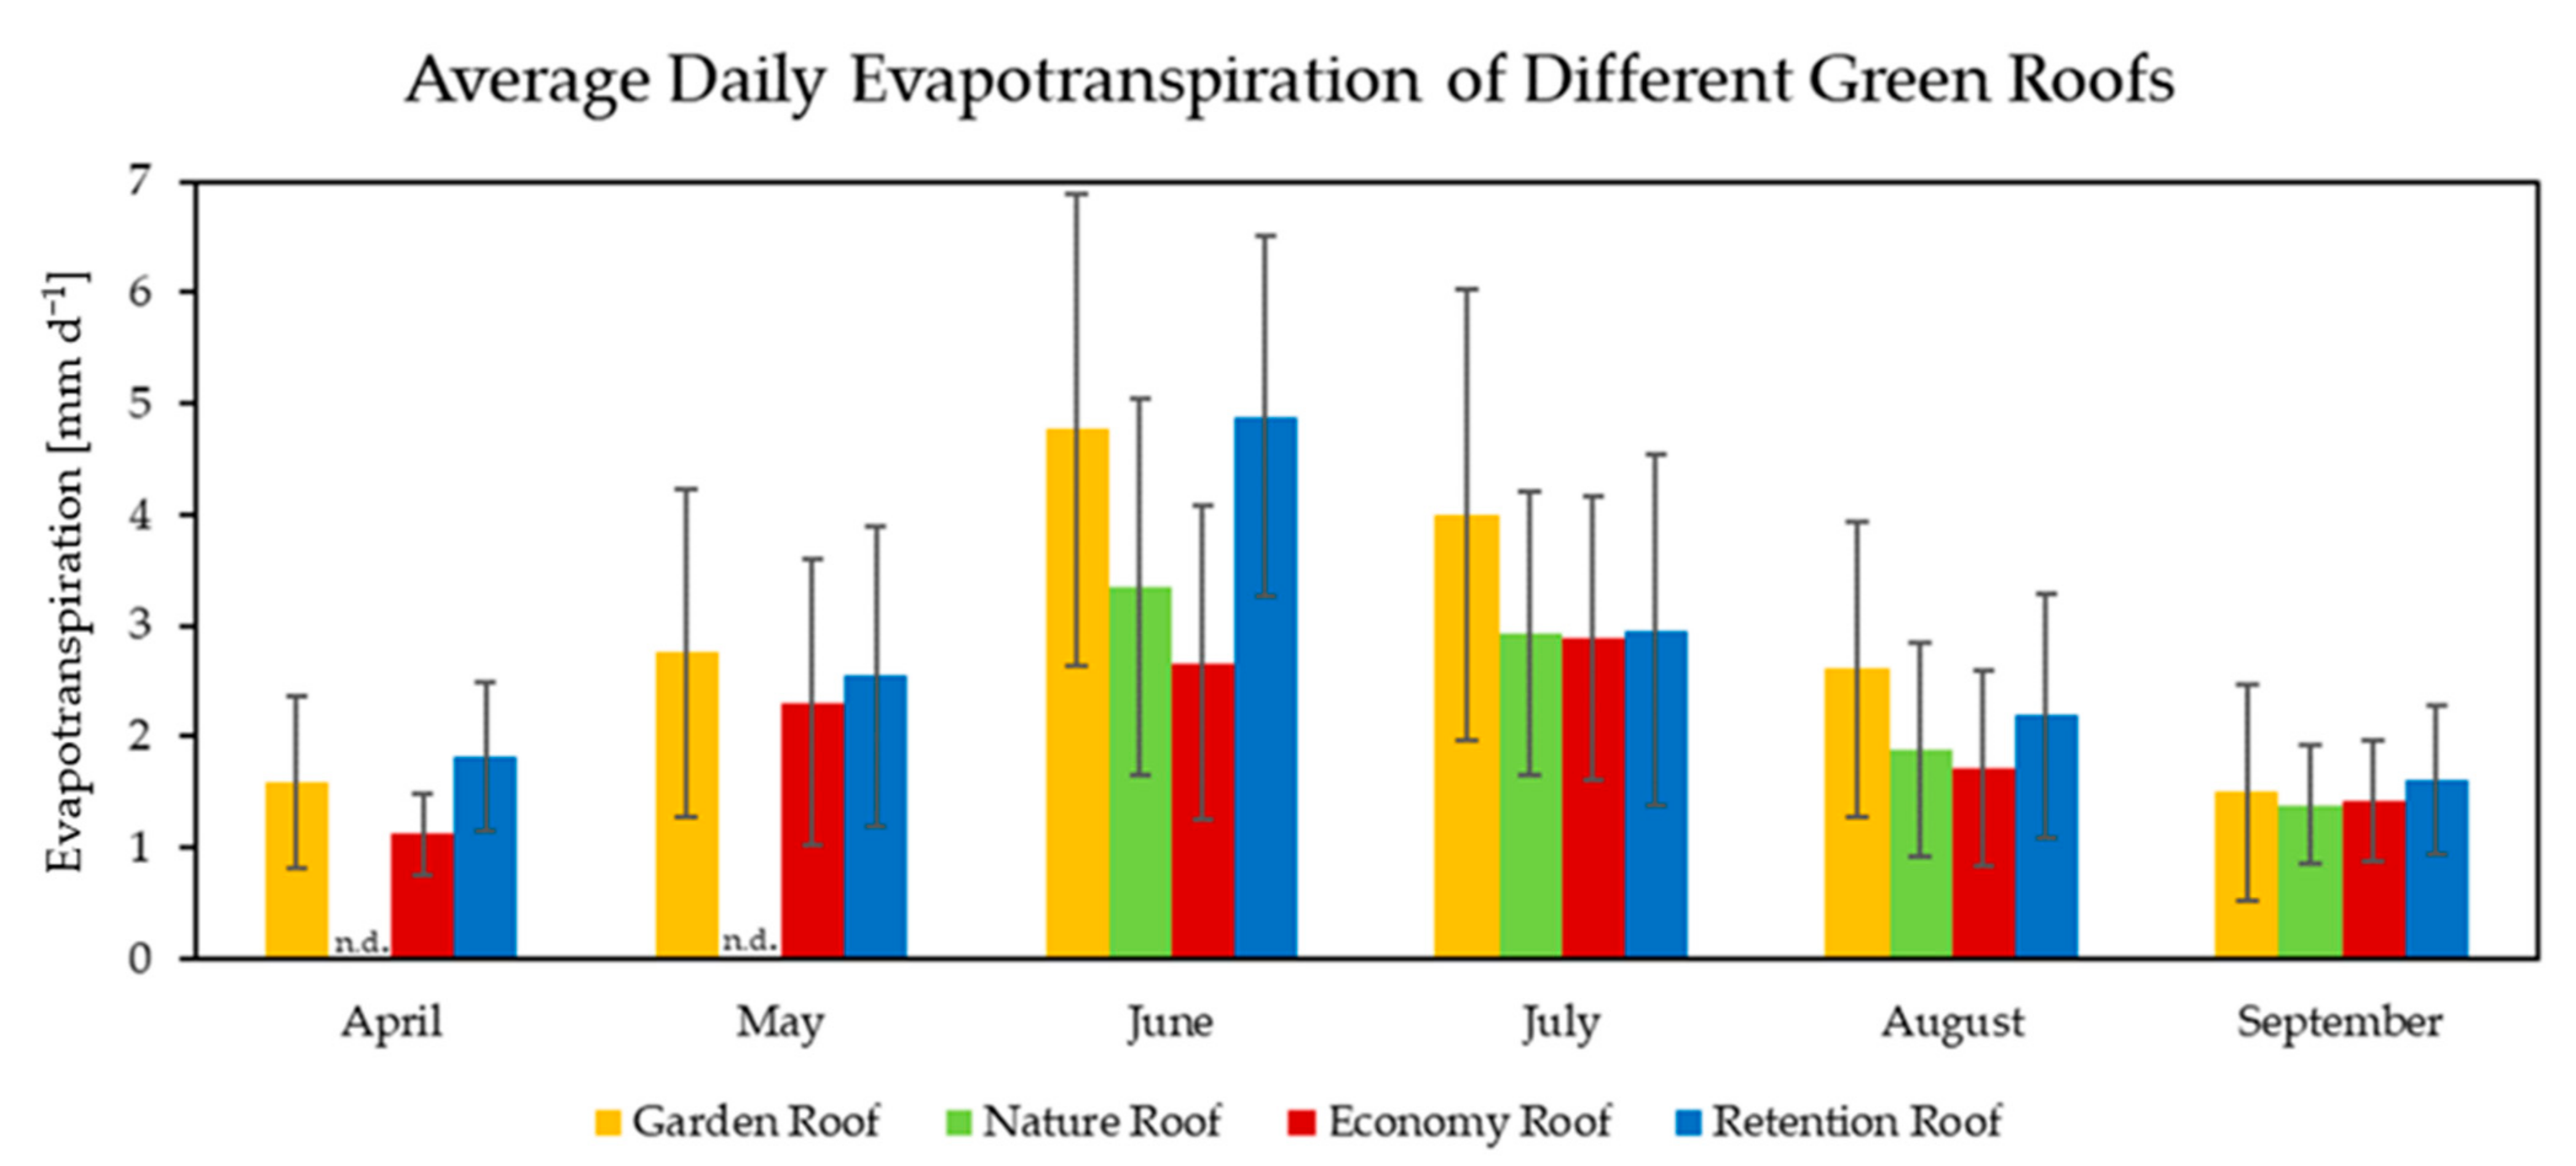
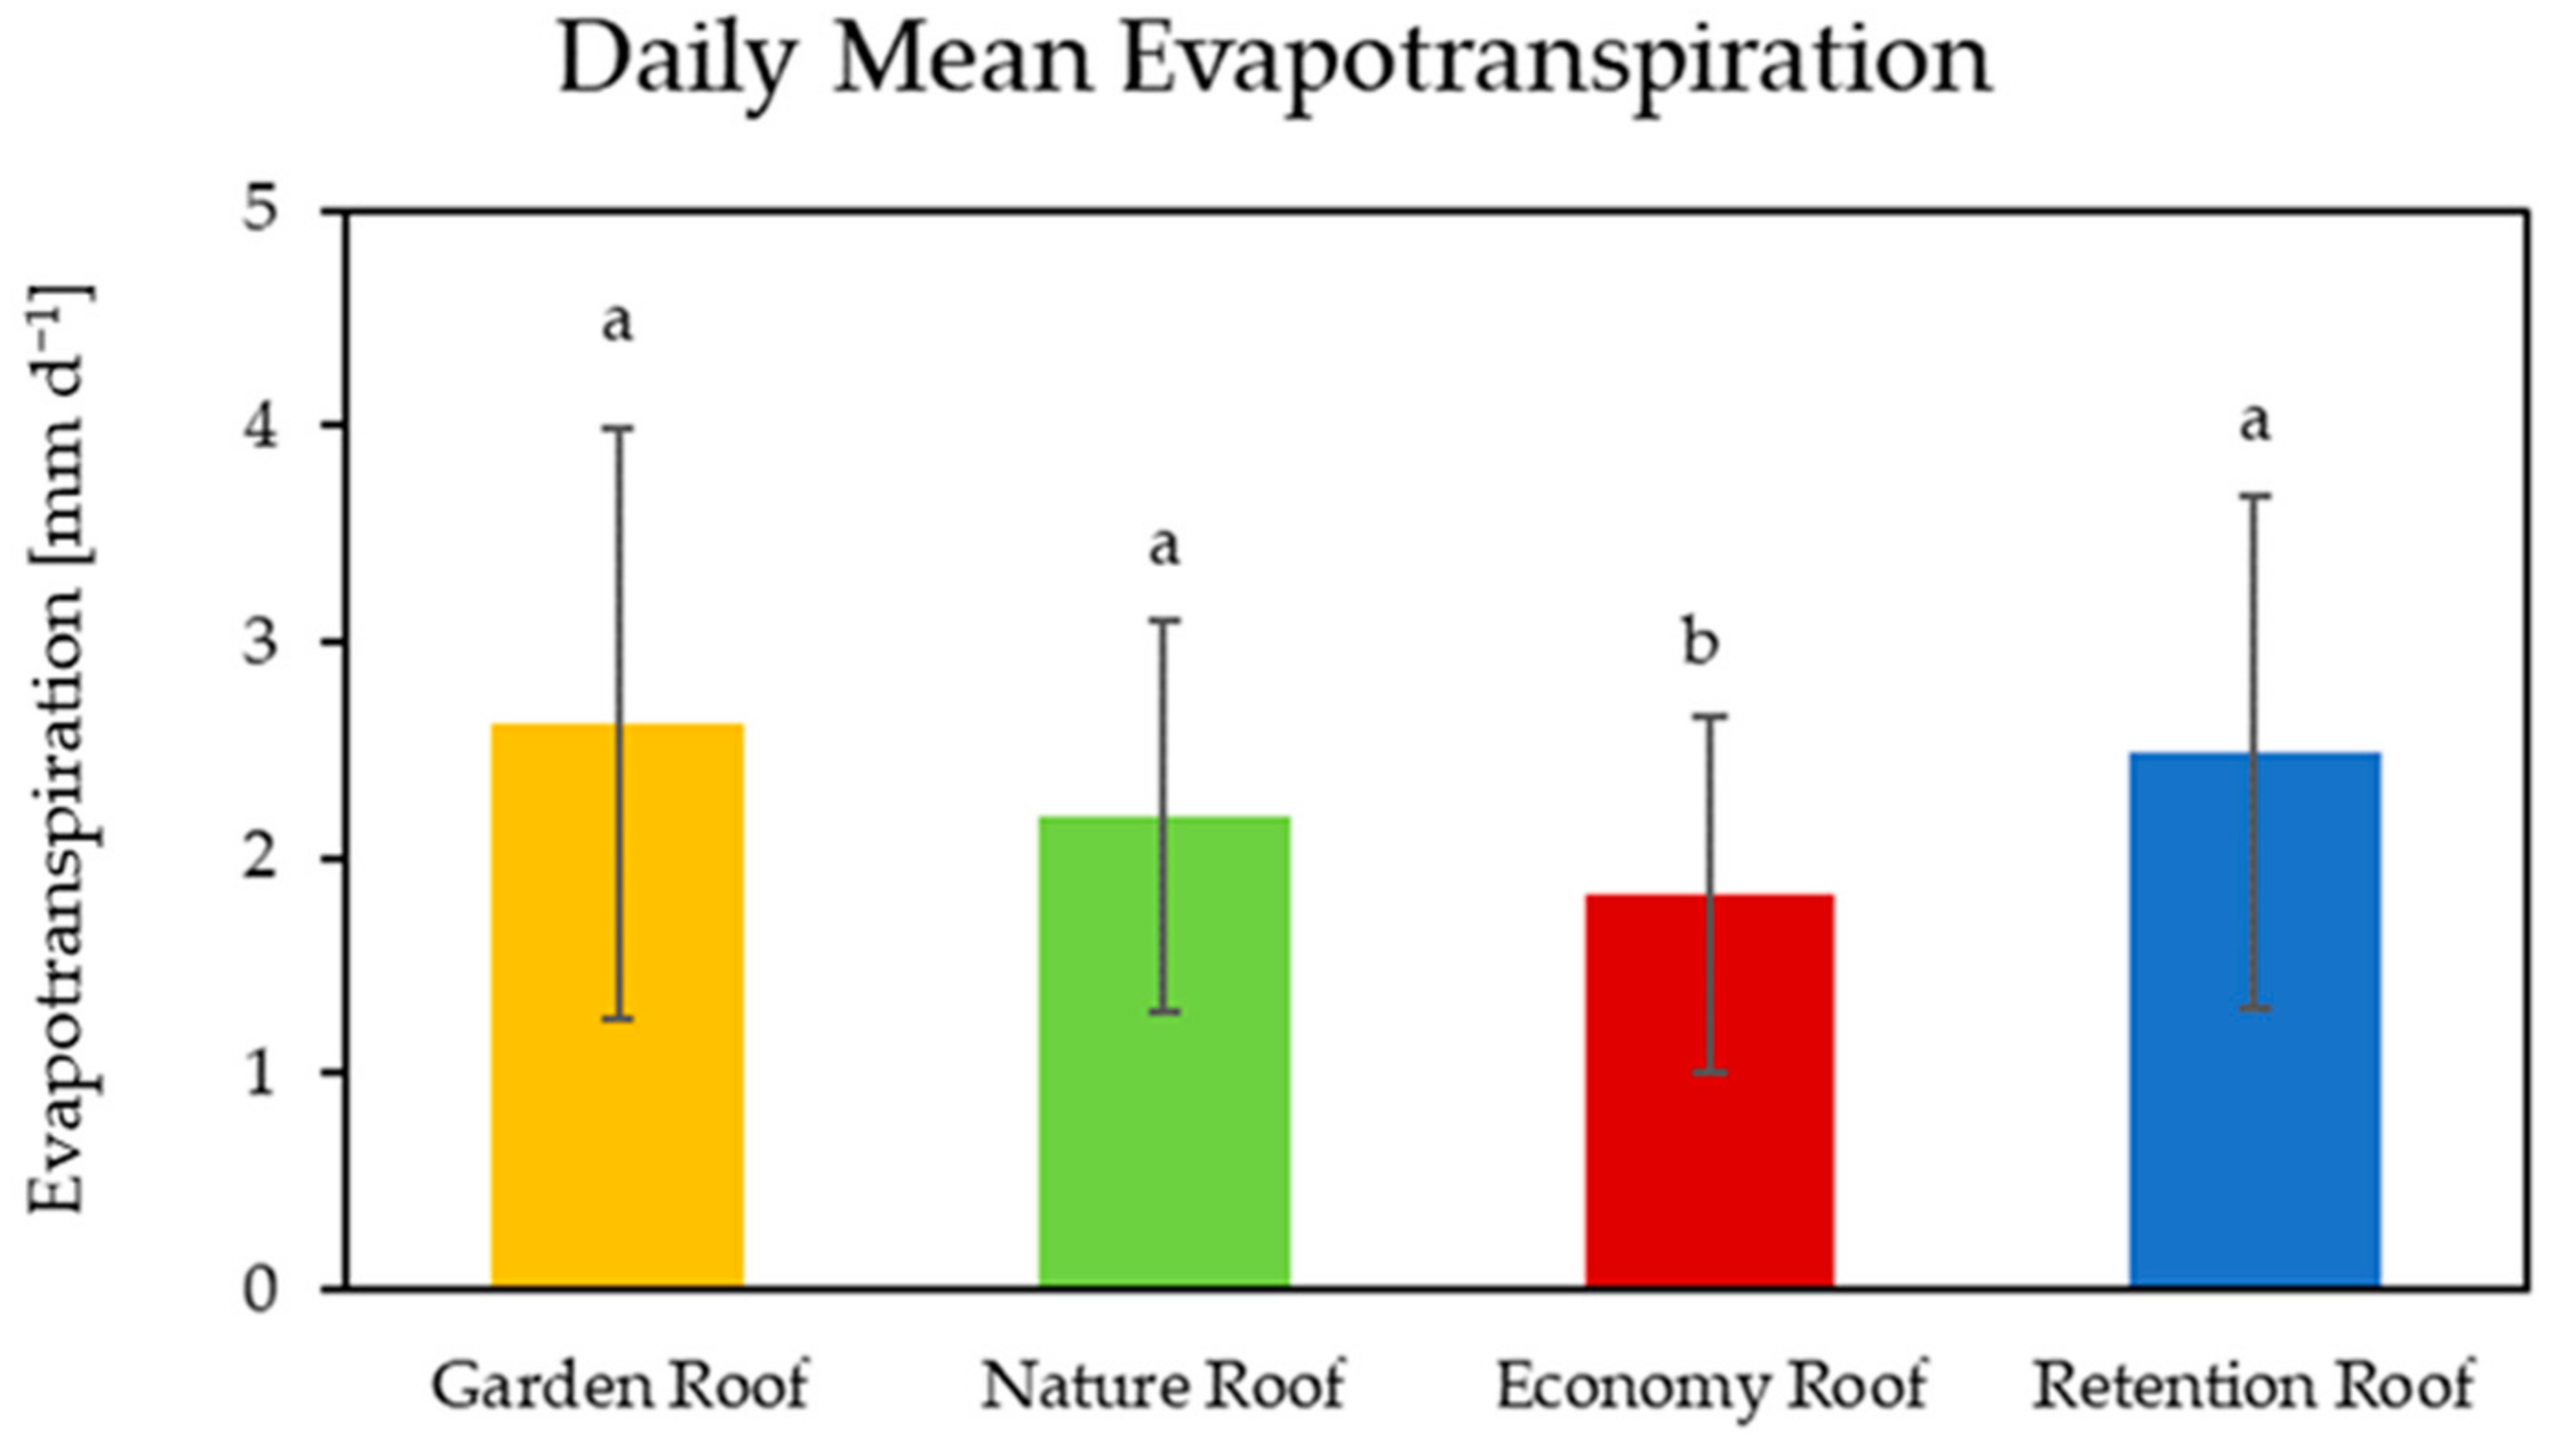
3.4. Evapotranspiration

Looking at the data for the whole measurement period, the highest evapotranspiration was measured in the summer months of June and July, while the spring and fall months had lower values (Figure 7). In the warmer period, differences between the roof systems can be observed. The Retention and Garden Roof showed the highest evapotranspiration rates of 4.88 mm d−1 and 4.77 mm d−1, respectively; the Nature Roof had slightly lower values, with a peak of 3.34 mm d−1, and the Economy Roof tended to have the lowest evapotranspiration, with only 2.67 mm d−1 in June.
The daily mean evapotranspiration over the entire measurement period was highest for the Garden Roof, with 2.62 ± 1.36 mm d−1 (Figure 8). The Retention Roof had an eva-potranspiration rate of 2.49 ± 1.19 mm d−1. The Nature Roof came third, with 2.19 ± 0.90 mm d−1, and the lowest evapotranspiration was measured for the Economy Roof, with 1.83 ± 0.82 mm d−1. However, no significant differences were found between the first three roofs; only the Economy Roof had a significantly lower evapotranspiration rate.
The total monthly evapotranspiration ranged from 33.7 mm for the Economy Roof in April to 146.4 mm for the Retention Roof in June (Table 2). During the entire measurement period, the Garden Roof achieved the highest total evapotranspiration of over 526 mm, the Retention Roof was close behind, with 488 mm, and the Economy Roof only reached 370 mm. Looking at the period from June to September to include the Nature Roof in the comparison, it can be noted that its evapotranspiration was higher than the Economy Roof, but lower than the Retention Roof.
The variation in the evapotranspiration rates between the different months likely arose from the fluctuations in air temperature and solar radiation: all green roof systems had their peak evapotranspiration rates in June and July, the months with the highest air temperatures and longest hours of sunshine (Appendix A, Figure A1), and thus with the highest available energy for potential evapotranspiration. However, the differences in evapotranspiration among the four roofs are most probably the result of the system components including the vegetation and their influence on the water availability. The Retention and the Garden Roof showed the highest evapotranspiration rates of all green roof systems, and these were the two setups with the greatest possible water storage: the Retention Roof has the largest storage volume, with a permanent water retention layer, from which water was able to migrate back into the substrate layer and produced a very high soil moisture content. The Garden Roof with 15 cm substrate and a drainage layer of 6 cm had the highest total setup, allowing a lot of water to remain in the system. Furthermore, it was watered twice to keep the lawn vegetation alive. The evapotranspiration rates of the Nature Roof were much lower compared to Retention and Garden Roof. As the vegetation and substrate thickness of the Nature Roof are the same as in the Retention Roof, the thinner type of drainage layer appears to be responsible for the recorded difference in evapotranspiration. In the case of the Economy Roof, the low evapotranspiration rates can also be attributed to the shallow substrate and thin water-retention layer.
The observed trends in differences between the roofs for the single months are also reflected in the daily mean evapotranspiration over the entire measurement period. Here, it is important to note that the daily mean value of the Nature Roof may be slightly overestimated, as the evapotranspiration could not be calculated for April and May due to failure of the outflow sensor. Furthermore, to keep the grass vegetation alive, the Garden Roof was watered twice in spring, which also contributed to the high evapotranspiration rates.
When interpreting the data, it should be noted that the rain sensor failure in summer impairs the data quality. The rain that could not be recorded from mid-June to mid-August increased the weight of the roofs, so the calculated evapotranspiration resulted in negative values for rainy days. Therefore, 15 days in both June and July were excluded from the analysis. However, the slight rain events that occurred in the summer months led to an underestimation of the evapotranspiration, as the weight gain due to rain was not subtracted in that period.
Furthermore, it must be noted that the evapotranspiration is always composed of the water loss attributed to the transpiration of the plants, but also of the evaporation from the substrate. When considering that many Sedum species are facultative CAM-plants, which are able to close their stomata under water stress during hot and dry summer days [38,39], the evapotranspiration measured on the Retention and Economy Roof with a high share of succulent plants may also result from the evaporation of the substrate.

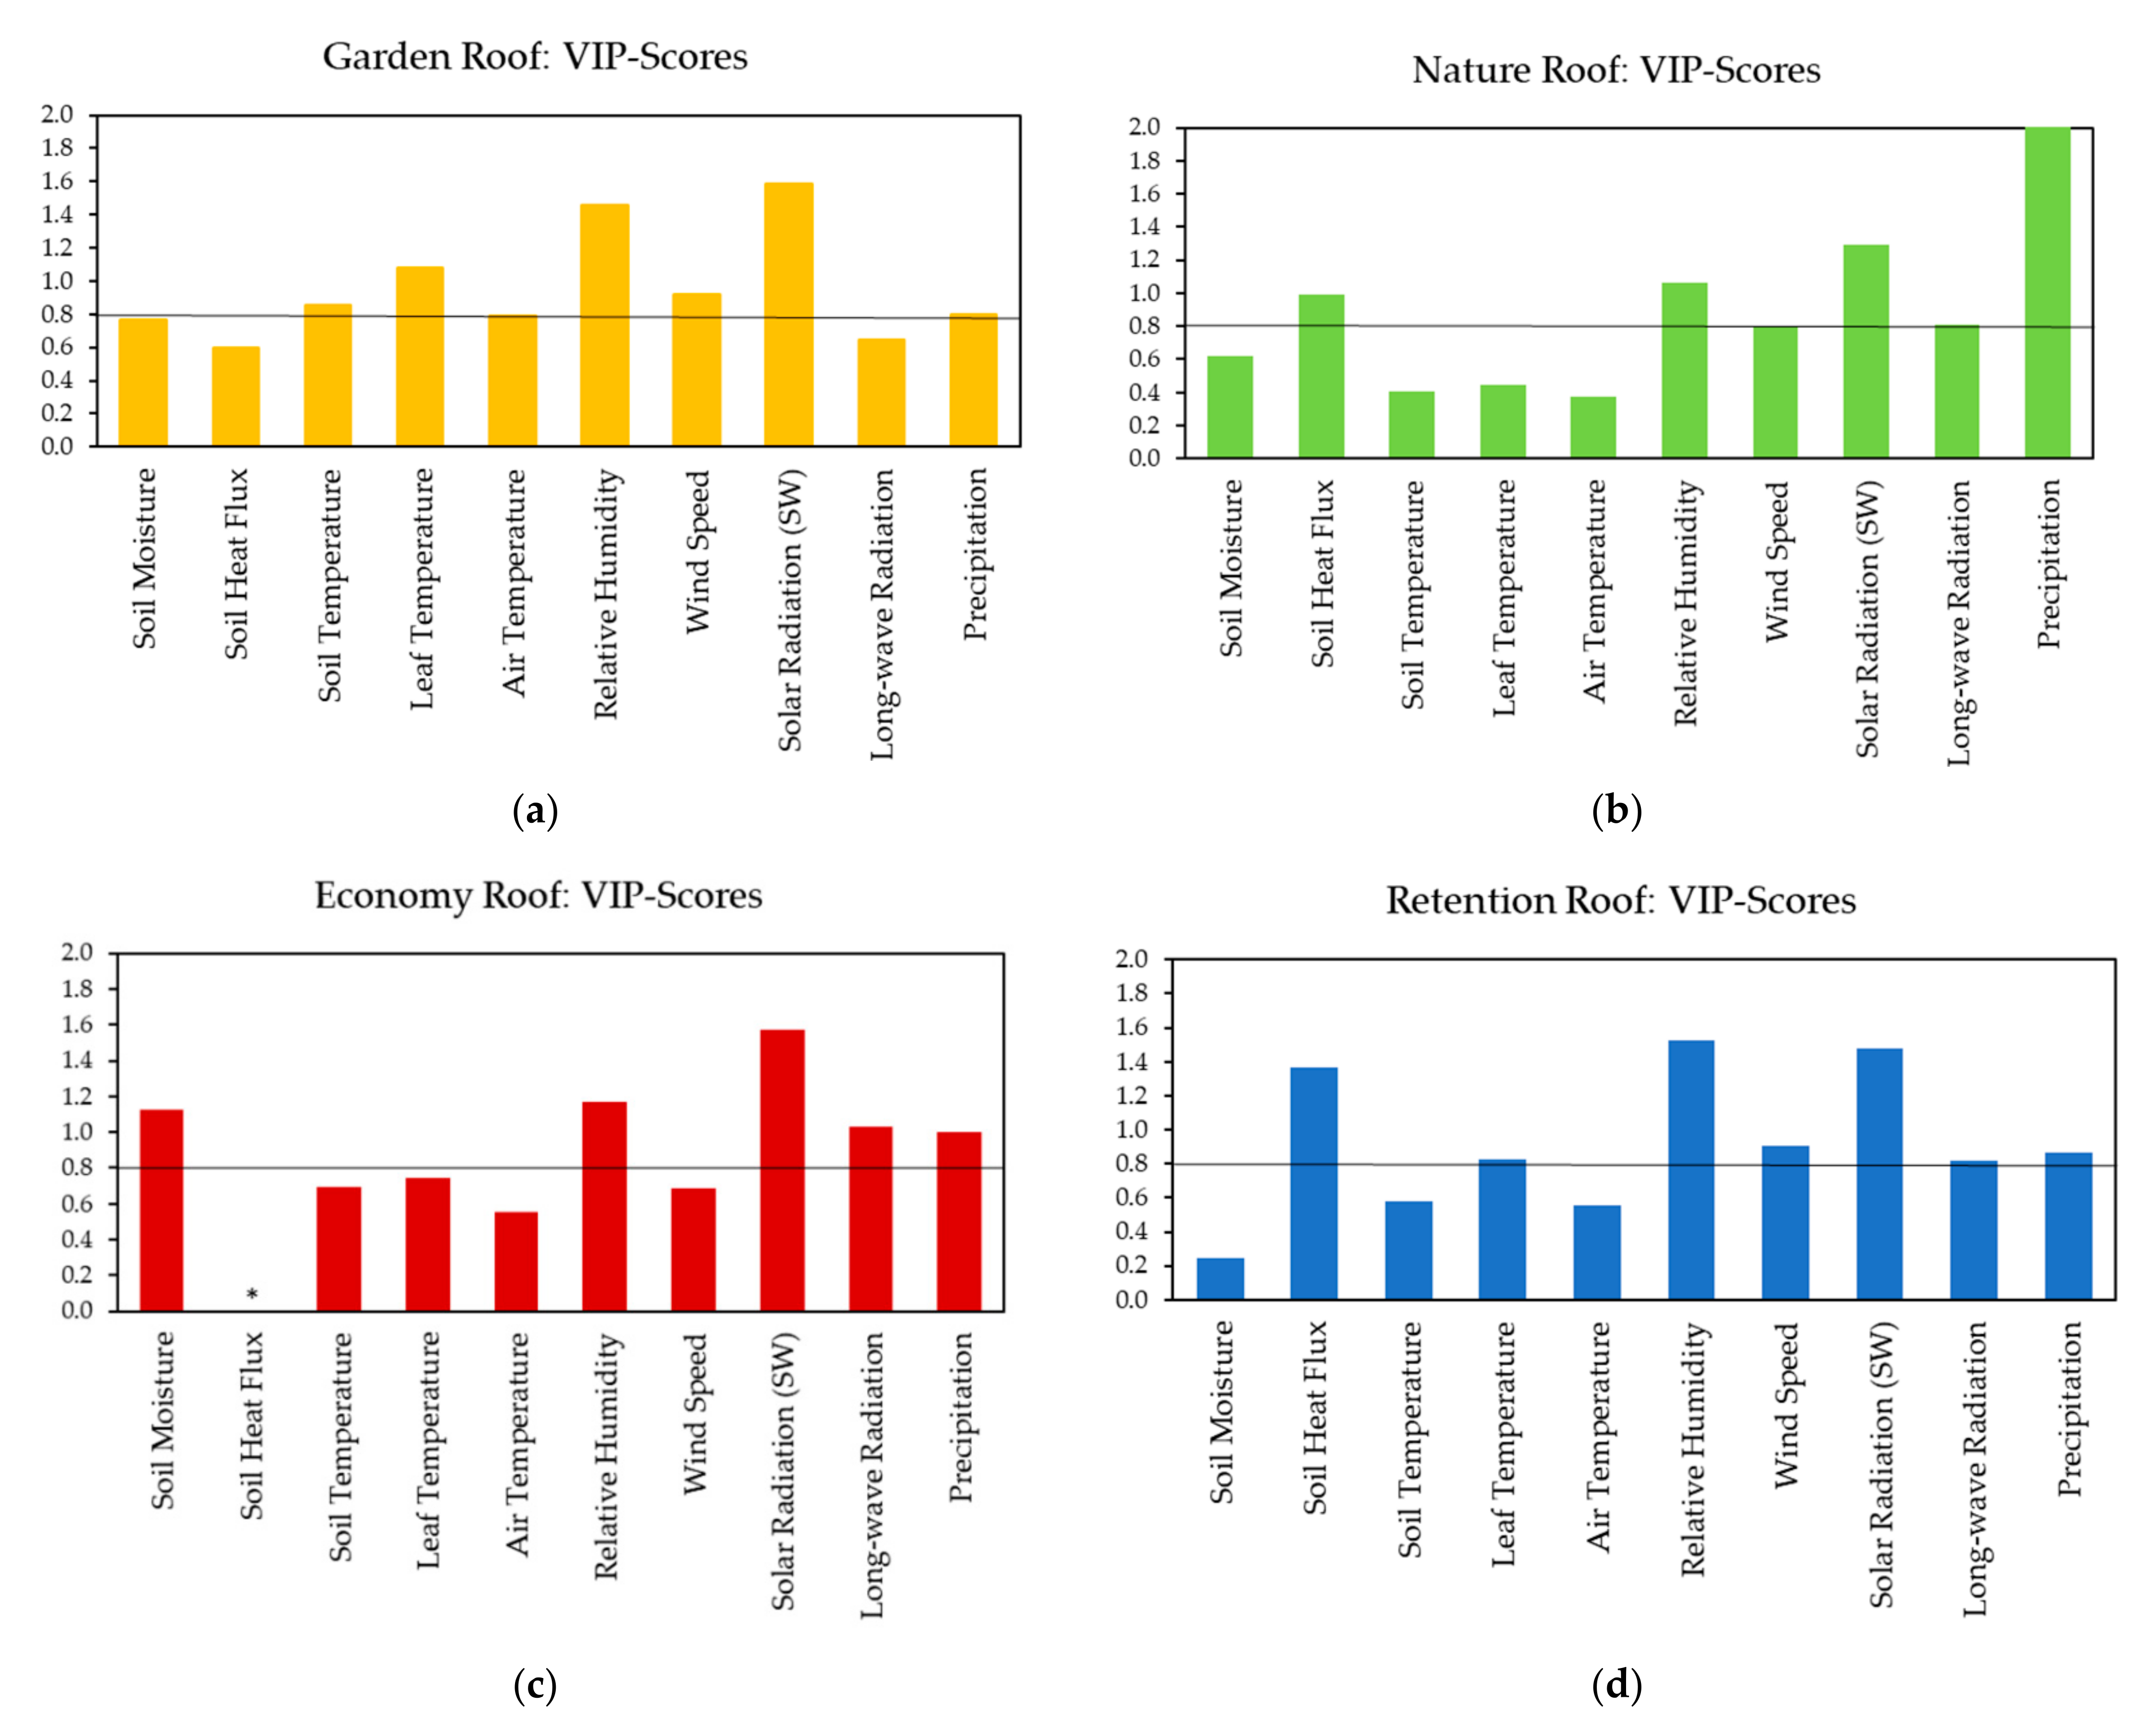
3.5. Variable Importance in Projection (VIP) Scores

The VIP-scores of the partial least square (PLS) regression provide insight into which factors are the key variables in determining the dependent variable, i.e., the evapotranspiration rate. In this context, variables with VIP-values above 0.8 are generally considered important [40]. The short-wave solar radiation, relative humidity and precipitation play a major role in consistently determining the evapotranspiration across all roof systems (Figure 9a–d). Additionalyl, the wind speed and the long-wave radiation are relevant in three out of four roof systems. However, some values also vary among the roofs or take a different order, which shows that the systems behave slightly differently: the evapotranspiration on the Garden Roof is mainly determined by the incoming solar radiation, the relative humidity and the leaf temperature (Figure 9a). On the Nature Roof, the precipitation reaches the highest score, followed by the short-wave radiation and the relative humidity (Figure 9b). The Economy Roof has short-wave radiation, relative humidity and soil moisture as the most important variables (Figure 9c), while the three highest scores of the Retention Roof are the relative humidity, short-wave radiation and soil heat flux (Figure 9d).
When the evapotranspiration is not measured directly via scales, an approximation is often obtained using the PenmanMonteith equation [41]. The main input parameters for the equation are the solar radiation, air temperature, relative humidity and the wind speed, which points out their relevance for the evapotranspiration process: the higher the solar radiation, air temperature and wind speed, and the lower the relative humidity, the higher the evapotranspiration rate [42].
The three parameters of solar radiation, relative humidity and wind speed were also highly relevant for determination of the green roof evapotranspiration. The air temperature received relatively low VIP scores, possibly because the VIP scores were calculated based on the time in which all sensors were functioning, excluding the warm weather period from mid-June to mid-August. Besides, air temperature, short-wave and long-wave radiation are subject to collinearity. The high scores for both short-wave and long-wave radiation in the case of the Nature, Economy and Retention Roof may, therefore, have affected the distribution among the three variables, causing lower scores for air temperature. As the substrate moisture is mainly affected by rain events, these two variables may also have been affected by collinearity. None of the variables were excluded from the regression by choice, as is sometimes done to revise a model [43]. All variables were considered relevant and the exclusion of single variables resulted in a lower percentage of explained evapotranspiration.
A possible explanation for the difference in substrate moisture scores between the Economy and Retention Roof may be the water availability in these systems. The Retention Roof had a continuously high substrate moisture. and thus plays no important role in determining the evapotranspiration. In the case of the Economy Roof, where the substrate moisture is rather low, a change in moisture can strongly affect the evapotranspiration, resulting in a higher score.
Leaf temperature received high scores for the Garden and Retention Roof; however, it is important to note that the temperature sensor was regularly repositioned among different species, which may have affected the relationship with the evapotranspiration rate.
Overall, it is important to consider that a few factors that influence the evapotranspiration rate could not be incorporated into the regression due to differences in the measurement intervals. These include the vegetation cover, the PAI, the season and the two irrigation events for the Garden Roof.

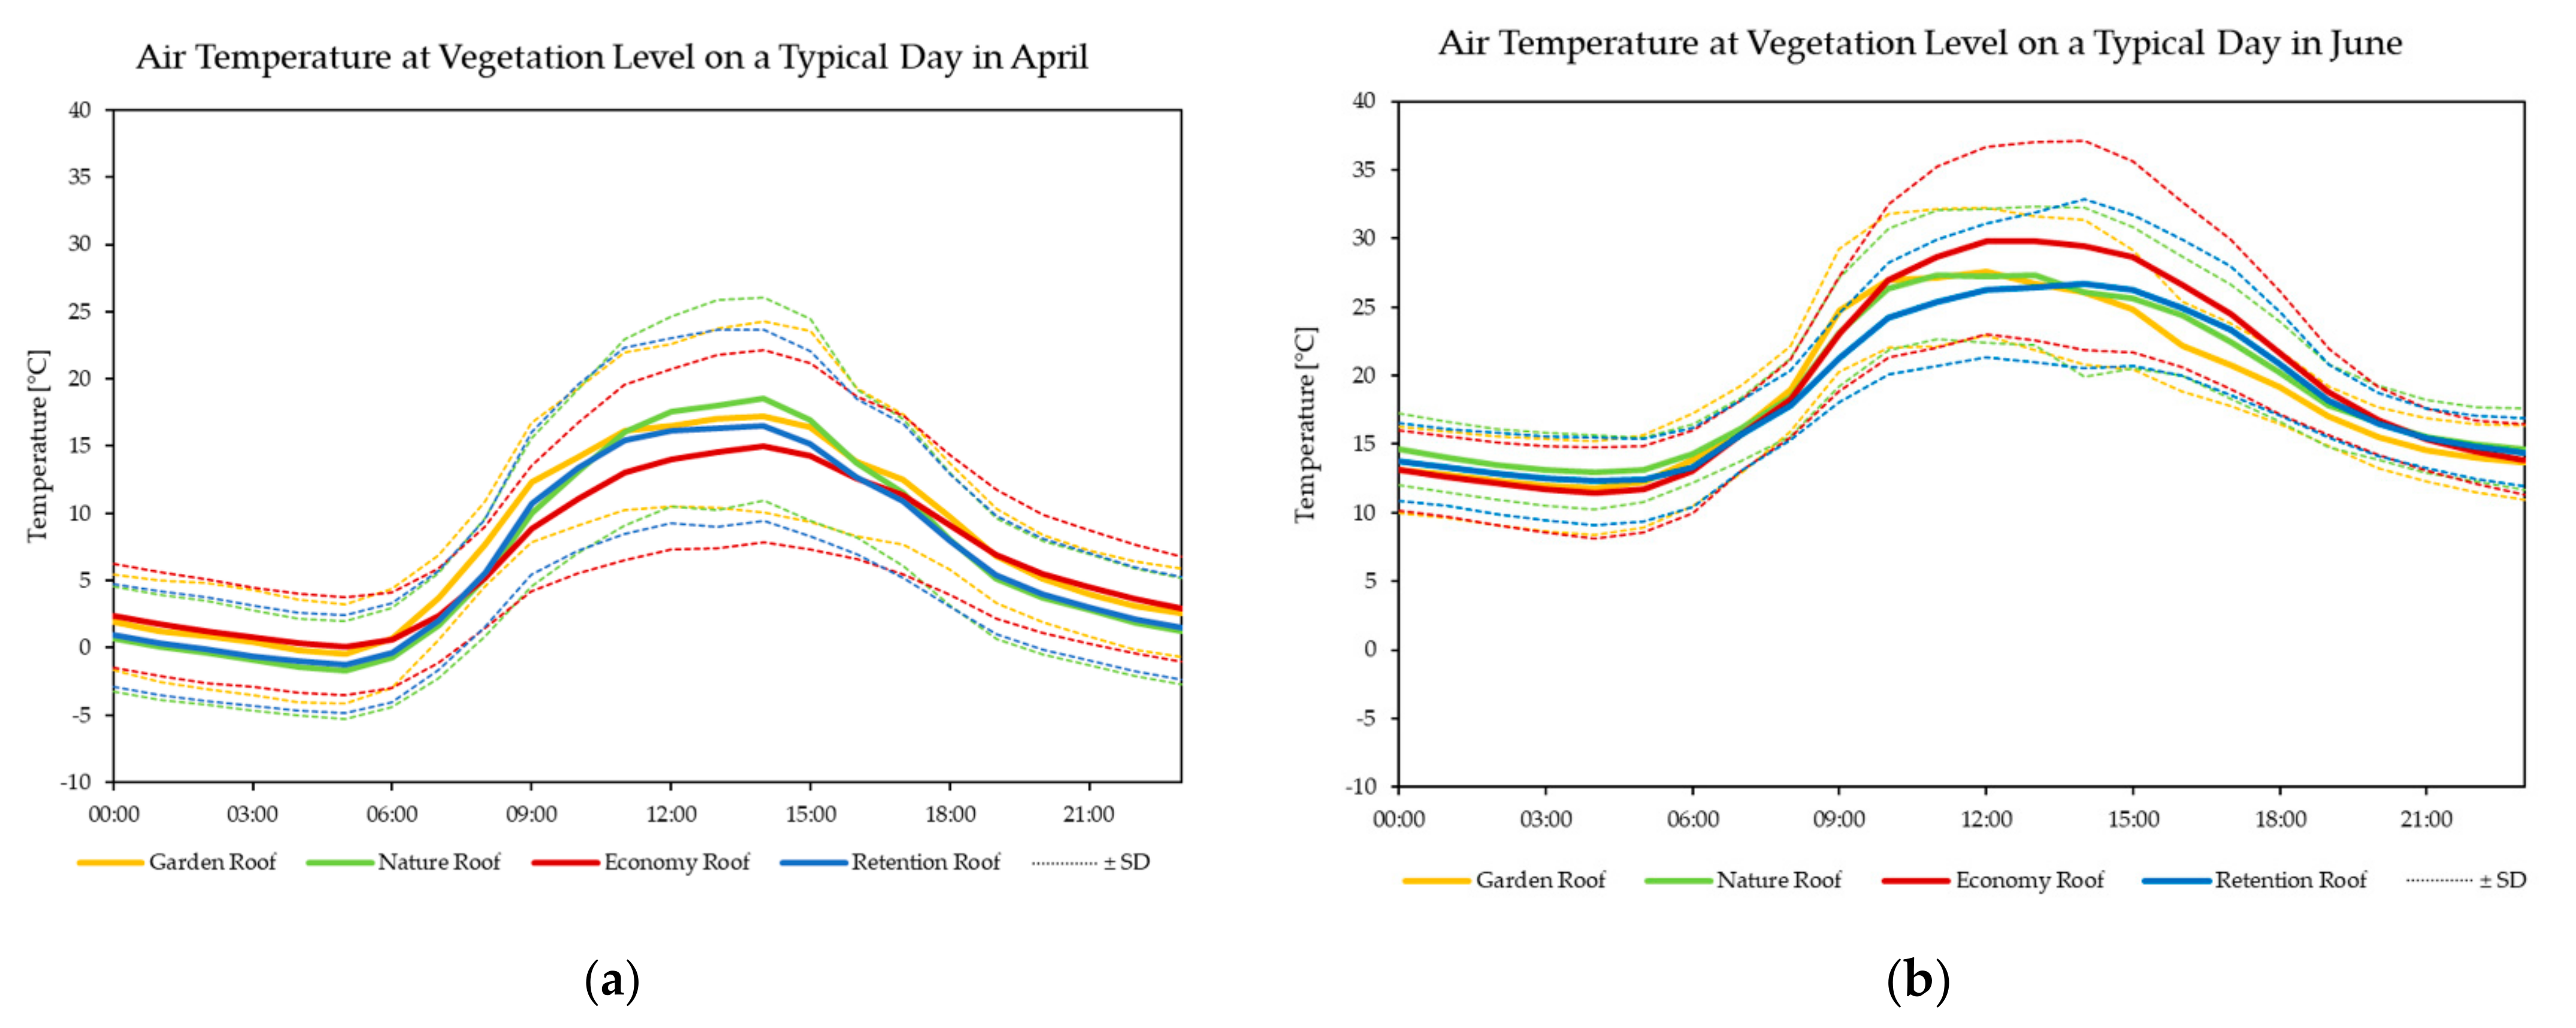
3.6. Substrate Temperature and Air Temperature at Vegetation Level

The substrate temperature and air temperature at the vegetation level were compared between an average day of the spring month, April, and a typical day in the warm summer month, June. In both months, the greatest substrate temperature differences were observed in the afternoon at around 3 p.m., when the green roofs reached their peak substrate temperatures. The Economy Roof was the warmest, at around 18 °C in spring and 30 °C in summer, and the Nature Roof was the second warmest in both months (Figure 10a,b). In April, the Garden and Retention Roof had a very similar temperature profile and reached around 13 °C, in June; however, the Retention Roof had the coldest substrate temperature at noon, with only 22 °C, while both the Garden and Nature Roof reached 26 °C. At night, the Garden, Nature and Retention Roof showed very similar temperatures and were about 3 °C warmer compared to the Economy Roof. Overall, the temperature amplitude was smallest for the Retention Roof.
When looking at the air temperatures at the vegetation level, the largest differences were measured at daytime: in April, the Economy Roof had the lowest air temperature at noon, while the Retention, Garden and Nature Roof were 2–3 °C warmer (Figure 11a). In June, the Economy Roof turned out to be the warmest, at nearly 30 °C at midday, while the Garden and Nature Roof both reached around 28 °C (Figure 11b). The air temperature above the Retention Roof was the coolest, with only 26 °C at noon; however it reached its maximum of 27 °C two hours later. In the afternoon, the Garden Roof was up to 2.5 °C cooler than Nature and Retention Roof, and up to 4.5 °C lower than the Economy Roof.
The small substrate temperature amplitude of the Retention Roof may be related to the higher soil moisture and the high specific heat capacity of water: a water-saturated substrate requires more energy to warm up and takes longer to cool down than a dry substrate. Conversely, the Economy Roof, with the thinner and drier substrate layer, has a lower specific heat capacity and, therefore, a larger temperature amplitude. This phenomenon can also explain the difference in peaks between the air temperature and substrate temperature: the higher the specific heat capacity, the longer the substrate needs to heat up and adapt to the ambient temperature. Among all roofs, the Retention Roof, with the highest soil moisture, reached its peak substrate temperature last.
In April, the air temperatures must be interpreted with the vegetation cover in mind: Both the Economy Roof and the Retention Roof had a much lower cover than the Garden and Nature Roof. As substrate can heat up quickly in the sun, the differences at around midday may have primarily been caused by the variation in cover. In June, however, the lowest air temperatures mainly occur above the roofs with highest evapotranspiration rate, namely, the Garden and Retention Roof. This indicates that the evaporative cooling effect may contribute to the differences in air temperature between the roofs. Nonetheless, the Economy Roof still had a lower vegetation cover, and the exposed substrate may have also led to increased air temperatures. It should also be considered that the sensors were attached to leaves of different plant species, and some might have been exposed to the sun while others were shaded. In June, the position of the sensors was changed once within each roof; thus, the data include two different leaf positions and may still be considered representative.

4. Discussion

4.1. Soil Moisture

The results did not show major differences in soil moisture between the period with a low and high plant area index (PAI). This is in line with the study by [44], in which no significant correlation was found between PAI and soil moisture for substrates with a low clay content.
When compared to roofs that receive additional irrigation, neither the Garden Roof, nor the Economy Roof reached comparable values: a study conducted in Utah, USA, assessed two irrigated miniature green roofs in terms of soil moisture and evapotranspiration [30]. Each roof had a soil thickness of 25 cm and one was covered with Sedum species, while the other was covered with grass. The soil moisture was reported to be 25–35% for the grass roof, and 20–40% for the Sedum roof for an entire year. Even though the sensors in the present study are placed several centimeters deeper in the substrate, where it would potentially be wetter, the Garden and Economy Roof only reached values of around 20%. However, the winter months with slightly higher precipitation are also not included in this study. On the other hand, the moisture values of the Retention Roof during summer are comparable with the irrigated Sedum roof from [30] and only drop during the driest and hottest days of June and September, while the overall summer average remains high. This is likely due to the additional water storage, from which water can migrate back into the substrate layer through capillary bridges, acting as a passive irrigation system. The high moisture values of the Nature Roof can be attributed to the thicker substrate and larger drainage and water storage layer compared to the Economy Roof.

4.2. Evapotranspiration

The relevance of sufficient plant-available water becomes particularly evident when comparing the results to studies assessing irrigated green roofs. For the summer average daily evapotranspiration, the previously mentioned study in Utah, USA, reports around 5 mm d−1 for the grass roof and approximately 3.5 mm d−1 for the Sedum roof [30]. Both the grass roof and the Sedum roof were irrigated, but neither contained a water storage layer. In the present study, the Garden Roof with lawn vegetation reached around 4.7 mm d−1 in June, a similar value to the irrigated grass roof in [30]. Although the Garden Roof has a thinner substrate layer than the grass roof and did not receive any irrigation in June, it contains a temporal water storage, which may have enabled the comparably high evapotranspiration rates. The Economy Roof, which can be considered equivalent to the Sedum roof by [30], reached only 2.67 mm d−1. Here, the omission of irrigation that results in a lower substrate moisture, as well as the thinner substrate and drainage layer, are most likely responsible for the differences in evapotranspiration.
A study set in Toronto, Canada, measured an evapotranspiration rate of over 7 mm day−1 in July with a lysimeter containing an extensive green roof with a 20 cm substrate layer [45]. The high evapotranspiration rate is likely due to the regular irrigation and the situation in a slightly warmer climate compared to this study’s site.
However, in the climate zone of the present study, high evapotranspiration rates have been recorded: a study conducted in northern Germany with a very similar experimental setup found that irrigation in summer can enhance the evapotranspiration rate to around 5 mm d−1 for extensive green roofs with 9–21 cm substrate [29]. Both the Retention Roof and the Garden Roof (with 10 and 15 cm substrate) reached evapotranspiration values close to 5 mm d−1 in June, and can be thus considered comparable to an irrigated green roof system.

4.3. Variable Importance in Projection (VIP) Scores

Due to the similar vegetation type, the Garden and Economy Roof are best suited to a comparison of the VIP-scores with the study conducted in Utah, USA, in which air temperature, soil moisture, solar radiation and relative humidity are named as the most influential variables [30]. In the present study, short-wave radiation and relative humidity were also among the most important variables, even though soil moisture had generally lower scores. Due to the close relationship between precipitation and soil moisture, it can be presumed that the results agree on the importance of plant-available water for the evapotranspiration process, which is manifested in the high scores for precipitation in this study and high soil moisture scores found by the authors of [30].
When looking at the different roof types, the authors of [30] found the solar radiation to be more relevant for the grass roof, while soil moisture was more important for the Sedum roof. These results correspond with the findings of this study, as soil moisture reached a much higher score for the Economy Roof, although the solar radiation is equally important for the Economy and Garden Roof. While the air temperature received high scores for both the grass and the Sedum roof in [30], this was only slightly important for the Garden Roof. This divergence may be due to the addition of long-wave radiation in the present study, which reached a high score in the case of the Economy Roof and may have led to a different distribution among the three variables of solar-radiation, long-wave radiation and air temperature.
Divergence from the VIP-scores reported by [30] may arise from the different study periods, as [30] used the data of a full year for the regression, while, in the present study, only the periods from April to the beginning of June and from mid-August to the beginning of October are included. Furthermore, the studies were conducted in different climate zones, namely a hot summer, sub-humid, continental climate in the case of [30], and a warm summer, humid continental climate in this study. The variables included in the regression also differed slightly between the studies, as soil heat flux, leaf temperature, soil temperature and long-wave radiation were included in this study, whereas the authors of [30] additionally included the air pressure and the surface soil moisture. These differences may be responsible for the varying distribution among the importance scores.

4.4. Substrate Temperature and Air Temperature at Vegetation Level

The results are in line with other studies observing that green roofs with shallower substrate layers exhibit greater temperature amplitudes during the day [46,47,48]. In [49], it was found that green roofs with higher substrate moisture also have lower substrate temperatures. Further, the evaporative cooling effect of green roofs was previously investigated, and model results have shown that irrigation can enhance the cooling effect [50]. However, the magnitude of the evapotranspiration and the resulting cooling effect generally varies due to the different green roof setups and study locations in different climate zones [29,30,45].

4.5. Limitations and Outlook

There are a few limitations to this study, mainly driven by the data quality. The period included in the analysis is rather short and does not represent an entire year. A number of sensors failed, and the lack of precipitation data limits the validity of the evapotranspiration rates during the summer months. Additionally, one of the scales showed strong variations, which may have been due to an insufficiently leveled setup. The smoothened hourly values, however, provided a good basis for the calculation of the evapotranspiration. The lysimeters used for measurements were relatively small; therefore, edge effects cannot be completely ruled out. Lastly, the experimental site was located at ground level, and the conditions are certainly different from an exposed roof top. However, the greening of underground structures such as car parks is also very common, and these roofs are often implemented as Garden Roofs at ground level.
At the experimental site, the data collection continues and, within a planned follow-up study, we aim to further investigate the underlying mechanisms of the differences among roofs, focusing on the contribution of the vegetation to the total evapotranspiration as well as using the long-term data to define the detailed physical and hydrological connections.

5. Conclusions

This study shows that both the Garden and the Retention Roof achieve very high evapotranspiration rates. The driving factors were identified as solar radiation and relative humidity, which are environmental variables that cannot be influenced. Additionally, the water availability in the form of rain and the resulting substrate moisture were shown to be highly relevant for the evapotranspiration. Even though rain is another environmental factor that cannot be controlled, the results demonstrate that engineered solutions can regulate the substrate moisture. The system design of the Retention Roof with permanent water storage turned out to be highly effective at raising the moisture content through passive irrigation and creating high evapotranspiration rates. The Garden Roof with lawn vegetation and a thick substrate layer also stands out, with a high evapotranspiration and a very stable moisture content throughout the course of the year. In summer, both roofs exhibited lower substrate temperatures and had lower air temperatures at the vegetation level. Therefore, these two roof systems are most suitable for cities that aim to mitigate the urban heat island effect and restore the natural water cycle. Ultimately, the great differences between green roof systems require the inclusion of explicit information into city-scale models. Only when accurate results are available will urban planners be able to complete the decision-making processes and implement a blue—green infrastructure network that is optimized for heat mitigation and storm water management.

Author Contributions

Among the three authors, the work was divided according to the following categories: D.G. carried out the conceptualization, the methodology that involved the measurement concept, the identification of information to be analyzed and the selection of the manner of analysis, supervision, project administration and funding acquisition. M.M. did the writing and preparation of the original draft. J.J.K. was responsible for software and data curation. Validation and management of resources was carried out by D.G. and M.M. The investigation was performed by D.G. and J.J.K. Parts of the methodology, including the search for appropriate analyses, as well as the visualization and formal analysis, were realized by M.M. and J.J.K. The review and editing were carried out by D.G., J.J.K. and M.M. All authors have read and agreed to the published version of the manuscript.

Funding

The data were collected as part of the Project “Building physics design of urban surfaces for a sustainable quality of life and environment in cities” which is 60% funded by the Federal Ministry of Education and Research BMBF (Grant Number: 01LR1725Q). The remaining 40% was funded by Optigrün international AG.

Institutional Review Board Statement

Not applicable.

Informed Consent Statement

Not applicable.

Data Availability Statement

The raw data used for the analysis in this study can be handed out on request by contacting the corresponding author.

Acknowledgments

We kindly acknowledge the permission of Optigrün international AG to use the space for the experimental setup in the parking lot.

Conflicts of Interest

The authors declare that no conflict of interest occurred. The roof systems analyzed in this study are commercially available from Optigrün international AG; therefore, the funders had influence on the choice of systems to be assessed. The data were evaluated according to scientific standards, and the results are presented truthfully.

Appendix A

Figure A1. Weather during the study period from April to September 2021, shown as means, with average minimum and average maximum for: (a) air temperature; (b) wind speed; (c) relative humidity; weather during this period shown as average daily sums for: (d) precipitation; weather during this period shown as a monthly sum: (e) short-wave radiation; (f) long-wave radiation. October is not included here as data were only available for four days in that month.
Land 10 01334 g0a1aLand 10 01334 g0a1b
Figure A2. Exemplary photos of the four experimental roofs in April and August 2021.
Land 10 01334 g0a2

References

  1. Masson-Delmotte, V.; Zhai, P.; Pirani, A.; Connors, S.L.; Péan, C.; Berger, S.; Caud, N.; Chen, Y.; Goldfarb, L.; Gomis, M.I.; et al. Summary for Policymakers. In Climate Change 2021: The Physical Science Basis. Contribution of Working Group I to the Sixth Assessment Report of the Intergovernmental Panel on Climate Change; Cambridge University: Cambridge, UK, 2021. [Google Scholar]
  2. Oke, T.R. The Energetic Basis of the Urban Heat Island. Q. J. R. Meteorol. Soc. 1982, 108, 1–24. [Google Scholar] [CrossRef]
  3. Ward, K.; Lauf, S.; Kleinschmit, B.; Endlicher, W. Heat Waves and Urban Heat Islands in Europe: A Review of Relevant Drivers. Sci. Total Environ. 2016, 569–570, 527–539. [Google Scholar] [CrossRef]
  4. Liu, W.; Engel, B.A.; Feng, Q. Modelling the Hydrological Responses of Green Roofs under Different Substrate Designs and Rainfall Characteristics Using a Simple Water Balance Model. J. Hydrol. 2021, 602, 126786. [Google Scholar] [CrossRef]
  5. Hart, M.A.; Sailor, D.J. Quantifying the Influence of Land-Use and Surface Characteristics on Spatial Variability in the Urban Heat Island. Theor. Appl. Climatol. 2009, 95, 397–406. [Google Scholar] [CrossRef]
  6. George, L.A.; Becker, W.G. Investigating the Urban Heat Island Effect with a Collaborative Inquiry Project. J. Geosci. Educ. 2003, 51, 237–243. [Google Scholar] [CrossRef] [Green Version]
  7. Santamouris, M. Heat Island Research in Europe: The State of the Art. Adv. Build. Energy Res. 2007, 1, 123–150. [Google Scholar] [CrossRef]
  8. Deutscher Wetterdienst. Available online: https://www.dwd.de/DE/klimaumwelt/klimaforschung/klimawirk/stadtpl/projekt_waermeinseln/sksm/sksm_node.html (accessed on 7 September 2021).
  9. Kendrovski, V.; Baccini, M.; Martinez, G.; Wolf, T.; Paunovic, E.; Menne, B. Quantifying Projected Heat Mortality Impacts under 21st-Century Warming Conditions for Selected European Countries. Int. J. Environ. Res. Public. Health 2017, 14, 729. [Google Scholar] [CrossRef] [PubMed] [Green Version]
  10. Krug, A.; Mücke, H.-G. Auswertung Hitze-Bezogener Indikatoren Als Orientierung Der Gesundheitlichen Belastung. UMID Umw. Und Mensch-Inf. 2018, 2, 70–74. [Google Scholar]
  11. Christenson, E.; Elliott, M.; Banerjee, O.; Hamrick, L.; Bartram, J. Climate-Related Hazards: A Method for Global Assessment of Urban and Rural Population Exposure to Cyclones, Droughts, and Floods. Int. J. Environ. Res. Public Health 2014, 11, 2169–2192. [Google Scholar] [CrossRef] [PubMed]
  12. Gabriel, K.M.A.; Endlicher, W.R. Urban and Rural Mortality Rates during Heat Waves in Berlin and Brandenburg, Germany. Environ. Pollut. 2011, 159, 2044–2050. [Google Scholar] [CrossRef]
  13. United Nations: Department of Economic and Social Affairs, Population Division. World Urbanization Prospects: The 2018 Revision; United Nations: New York, NY, USA, 2019; ISBN 978-92-1-148319-2. [Google Scholar]
  14. Manso, M.; Teotónio, I.; Silva, C.M.; Cruz, C.O. Green Roof and Green Wall Benefits and Costs: A Review of the Quantitative Evidence. Renew. Sustain. Energy Rev. 2021, 135, 110111. [Google Scholar] [CrossRef]
  15. Krayenhoff, E.S.; Broadbent, A.M.; Zhao, L.; Georgescu, M.; Middel, A.; Voogt, J.A.; Martilli, A.; Sailor, D.J.; Erell, E. Cooling Hot Cities: A Systematic and Critical Review of the Numerical Modelling Literature. Environ. Res. Lett. 2021, 16, 053007. [Google Scholar] [CrossRef]
  16. Mentens, J.; Raes, D.; Hermy, M. Green Roofs as a Tool for Solving the Rainwater Runoff Problem in the Urbanized 21st Century? Landsc. Urban Plan. 2006, 77, 217–226. [Google Scholar] [CrossRef]
  17. Filazzola, A.; Shrestha, N.; MacIvor, J.S. The Contribution of Constructed Green Infrastructure to Urban Biodiversity: A Synthesis and Meta-analysis. J. Appl. Ecol. 2019, 56, 2131–2143. [Google Scholar] [CrossRef]
  18. Ran, J.; Yang, Z.; Feng, Y.; Xiong, K.; Tang, M. Energy Performance Assessment and Optimization of Extensive Green Roofs in Different Climate Zones of China. E3S Web Conf. 2020, 172, 16003. [Google Scholar] [CrossRef]
  19. Lee, K.E.; Williams, K.J.H.; Sargent, L.D.; Farrell, C.; Williams, N.S. Living Roof Preference Is Influenced by Plant Characteristics and Diversity. Landsc. Urban Plan. 2014, 122, 152–159. [Google Scholar] [CrossRef]
  20. Lee, K.E.; Sargent, L.D.; Williams, N.S.G.; Williams, K.J.H. Linking Green Micro-Breaks with Mood and Performance: Mediating Roles of Coherence and Effort. J. Environ. Psychol. 2018, 60, 81–88. [Google Scholar] [CrossRef]
  21. Versini, P.-A.; Gires, A.; Tchiguirinskaia, I.; Schertzer, D. Fractal Analysis of Green Roof Spatial Implementation in European Cities. Urban For. Urban Green. 2020, 49, 126629. [Google Scholar] [CrossRef]
  22. Lomba-Fernández, C.; Hernantes, J.; Labaka, L. Labaka Guide for Climate-Resilient Cities: An Urban Critical Infrastructures Approach. Sustainability 2019, 11, 4727. [Google Scholar] [CrossRef] [Green Version]
  23. Yang, J.; Wang, Z.-H. Physical Parameterization and Sensitivity of Urban Hydrological Models: Application to Green Roof Systems. Build. Environ. 2014, 75, 250–263. [Google Scholar] [CrossRef]
  24. Balany, F.; Ng, A.W.; Muttil, N.; Muthukumaran, S.; Wong, M.S. Green Infrastructure as an Urban Heat Island Mitigation Strategy—A Review. Water 2020, 12, 3577. [Google Scholar] [CrossRef]
  25. Vijayaraghavan, K. Green Roofs: A Critical Review on the Role of Components, Benefits, Limitations and Trends. Renew. Sustain. Energy Rev. 2016, 57, 740–752. [Google Scholar] [CrossRef]
  26. Peng, L.; Jim, C. Green-Roof Effects on Neighborhood Microclimate and Human Thermal Sensation. Energies 2013, 6, 598–618. [Google Scholar] [CrossRef] [Green Version]
  27. Morakinyo, T.E.; Dahanayake, K.W.D.; Kalani, C.; Ng, E.; Chow, C.L. Temperature and Cooling Demand Reduction by Green-Roof Types in Different Climates and Urban Densities: A Co-Simulation Parametric Study. Energy Build. 2017, 145, 226–237. [Google Scholar] [CrossRef]
  28. Cascone, S.; Coma, J.; Gagliano, A.; Pérez, G. The Evapotranspiration Process in Green Roofs: A Review. Build. Environ. 2019, 147, 337–355. [Google Scholar] [CrossRef]
  29. Kaiser, D.; Köhler, M.; Schmidt, M.; Wolff, F. Increasing Evapotranspiration on Extensive Green Roofs by Changing Substrate Depths, Construction, and Additional Irrigation. Buildings 2019, 9, 173. [Google Scholar] [CrossRef] [Green Version]
  30. Feng, Y.; Burian, S.; Pardyjak, E. Observation and Estimation of Evapotranspiration from an Irrigated Green Roof in a Rain-Scarce Environment. Water 2018, 10, 262. [Google Scholar] [CrossRef] [Green Version]
  31. Wang, C.; Wang, Z.-H.; Kaloush, K.E.; Shacat, J. Perceptions of Urban Heat Island Mitigation and Implementation Strategies: Survey and Gap Analysis. Sustain. Cities Soc. 2021, 66, 102687. [Google Scholar] [CrossRef]
  32. Beck, H.E.; Zimmermann, N.E.; McVicar, T.R.; Vergopolan, N.; Berg, A.; Wood, E.F. Present and Future Köppen-Geiger Climate Classification Maps at 1-Km Resolution. Sci. Data 2018, 5, 180214. [Google Scholar] [CrossRef] [Green Version]
  33. Wetterdienst.De. Available online: https://www.wetterdienst.de/Deutschlandwetter/Krauchenwies/Klima/ (accessed on 15 October 2021).
  34. Dachbegrünungsrichtlinien—Richtlinien Für Die Planung, Bau Und Instandhaltung von Dachbegrünungen; Landschaftsbau, F.L. (Ed.) Landschaftsentwicklung Landschaftsbau e.V: Bonn, Germany, 2018. [Google Scholar]
  35. RStudio Team. RStudio Desktop; RStudio: Boston, MA, USA, 2020. [Google Scholar]
  36. R Core Team. R: A Language and Environment for Statistical Computing; R Foundation for Statistical Computing: Vienna, Austria, 2020. [Google Scholar]
  37. Kessler, W. Multivariate Datenanalyse: Für die Pharma-, Bio- und Prozessanalytik ein Lehrbuch; Wiley-VCH: Weinheim, Germany, 2008; ISBN 978-3-527-31262-7. [Google Scholar]
  38. Wai, C.M.; Weise, S.E.; Ozersky, P.; Mockler, T.C.; Michael, T.P.; VanBuren, R. Time of Day and Network Reprogramming during Drought Induced CAM Photosynthesis in Sedum Album. PLoS Genet. 2019, 15, e1008209. [Google Scholar] [CrossRef] [PubMed] [Green Version]
  39. Lee, H.S.J.; Griffiths, H. Induction and Repression of CAM in Sedum Telephium L. in Response to Photoperiod and Water Stress. J. Exp. Bot. 1987, 38, 834–841. [Google Scholar] [CrossRef]
  40. Wold, S. PLS for Multivariate Linear Modeling. In Chemometric Methods in Molecular Design; Van de Waterbeemd, H., Ed.; Wiley-VCH Verlag GmbH & Co. KGaA: Weinheim, Germany, 1994; ISBN 3-527-3004-9. [Google Scholar]
  41. Cai, J.; Liu, Y.; Lei, T.; Pereira, L.S. Estimating Reference Evapotranspiration with the FAO Penman–Monteith Equation Using Daily Weather Forecast Messages. Agric. For. Meteorol. 2007, 145, 22–35. [Google Scholar] [CrossRef]
  42. Allen, R.G.; Pereira, L.S.; Raes, D.; Smith, M. Crop Evapotranspiration-Guidelines for Computing Crop Water Requirements; FAO Irrigation and Drainage Paper; repr.; Food and Agriculture Organization of the United Nations: Rome, Italy, 2000; ISBN 978-92-5-104219-9. [Google Scholar]
  43. Mehmood, T.; Sæbø, S.; Liland, K.H. Comparison of Variable Selection Methods in Partial Least Squares Regression. J. Chemom. 2020, 34, e3226. [Google Scholar] [CrossRef] [Green Version]
  44. Liu, L.; Zhang, R.; Zuo, Z. The Relationship between Soil Moisture and LAI in Different Types of Soil in Central Eastern China. J. Hydrometeorol. 2016, 17, 2733–2742. [Google Scholar] [CrossRef]
  45. Jahanfar, A.; Drake, J.; Gharabaghi, B.; Sleep, B. An Experimental and Modeling Study of Evapotranspiration from Integrated Green Roof Photovoltaic Systems. Ecol. Eng. 2020, 152, 105767. [Google Scholar] [CrossRef]
  46. Reyes, R.; Bustamante, W.; Gironás, J.; Pastén, P.A.; Rojas, V.; Suárez, F.; Vera, S.; Victorero, F.; Bonilla, C.A. Effect of Substrate Depth and Roof Layers on Green Roof Temperature and Water Requirements in a Semi-Arid Climate. Ecol. Eng. 2016, 97, 624–632. [Google Scholar] [CrossRef]
  47. Eksi, M.; Rowe, D.B.; Wichman, I.S.; Andresen, J.A. Effect of Substrate Depth, Vegetation Type, and Season on Green Roof Thermal Properties. Energy Build. 2017, 145, 174–187. [Google Scholar] [CrossRef] [Green Version]
  48. Pianella, A.; Aye, L.; Chen, Z.; Williams, N. Substrate Depth, Vegetation and Irrigation Affect Green Roof Thermal Performance in a Mediterranean Type Climate. Sustainability 2017, 9, 1451. [Google Scholar] [CrossRef] [Green Version]
  49. Jim, C.Y.; Peng, L.L.H. Substrate Moisture Effect on Water Balance and Thermal Regime of a Tropical Extensive Green Roof. Ecol. Eng. 2012, 47, 9–23. [Google Scholar] [CrossRef]
  50. Heusinger, J.; Sailor, D.J.; Weber, S. Modeling the Reduction of Urban Excess Heat by Green Roofs with Respect to Different Irrigation Scenarios. Build. Environ. 2018, 131, 174–183. [Google Scholar] [CrossRef]
Figure 1. Experimental setup in Göggingen-Krauchenwies, Germany (48°0′20.27916″ N, 9°12′5.33952″ E).
Land 10 01334 g001
Figure 2. Description of the four different green roof systems used in this study.
Land 10 01334 g002
Figure 3. Development of the vegetation cover of the four different green roofs from April to October 2021. Exemplary photos can be found in Appendix A (Figure A2).
Land 10 01334 g003
Figure 4. Development of the plant area index of the four different green roofs from April to October 2021.
Land 10 01334 g004
Figure 5. Daily averages ± standard deviation (SD) of the soil moisture of the four different green roofs from April to October 2021.
Land 10 01334 g005
Figure 6. Average substrate moisture of the four different green roofs with means ± SD (n = 204 for Garden Roof; n = 205 for other roofs). Different letters above the whiskers indicate significant differences between means (Friedman Test p < 0.01).
Land 10 01334 g006
Figure 7. Average daily evapotranspiration of the four different green roofs with means ± SD from April to September 2021. October is not included here as data were only available for four days in that month.
Land 10 01334 g007
Figure 8. Average daily evapotranspiration of the four different green roofs with means ± SD (n = 121 for Garden Roof; n = 88 for Nature Roof, n = 134 for Economy Roof and n = 141 for Retention Roof). Different letters above the whiskers indicate significant differences between means (Friedman Test p < 0.01).
Land 10 01334 g008
Figure 9. VIP-Scores resulting from the PLS-regression of the different green roof systems. (a) 7 components, evapotranspiration explained: 85.38%, CVadjusted: 0.2538; (b) 4 components, evapotranspiration explained: 62.40%, CVadjusted: 0.2992; (c) 5 components, evapotranspiration explained: 75.42%, CVadjusted: 0.1807 (d) 5 components, evapotranspiration explained: 74.50%, CVadjusted: 0.2128. * Due to sensor failure, the soil heat flux variable did not produce enough values to be included in the regression for the Economy Roof.
Land 10 01334 g009
Figure 10. Substrate temperatures on an average day of the four different green roofs in: (a) April; (b) June. For each single day in April and June, the raw data were aggregated to 24-hourly means. Shown are means ± SD for each hour of 30 days in April and June, respectively (n = 30).
Land 10 01334 g010
Figure 11. Air temperatures at vegetation level on an average day for the four different green roofs in: (a) April; (b) June. For each single day in April and June, the raw data were aggregated to 24-hourly means. Shown are means ± SD for each hour of 30 days in April and June, respectively (n = 30).
Land 10 01334 g011
Table 1. List of parameters measured, the installed measurement devices and approximate position of the sensors.
LayerParameterMeasurement DeviceManufacturer
Atmospheric LayerPrecipitationrain[e]LAMBRECHT meteo GmbH, Göttingen, Germany
Air TemperatureCS215 Temperature and Relative Humidity ProbeCampbell Scientific Inc., Logan, UT, USA
Relative HumidityCS215 Temperature and Relative Humidity ProbeCampbell Scientific Inc., Logan, UT, USA
Short-Wave Solar RadiationCMP10 PyranometerKipp & Zonen B.V., Delft, The Netherlands
Long-Wave RadiationCGR3 Pyrgeometer (facing the sky)Kipp & Zonen B.V., The Netherlands
Wind SpeedWindSonic4 Two-Dimensional Sonic AnemometerCampbell Scientific Inc., USA
Vegetation LayerLeaf Temperature +
Air Temperature
Leaf-&-Air-Temperature Type LAT-B2, BroadleafECOMATIK GmbH, Dachau, Germany
Substrate LayerVolumetric Water ContentCS655 soil water content reflectometerCampbell Scientific Inc., Logan, UT, USA
Substrate Temperature105E Temperature ProbeCampbell Scientific Inc., Logan, UT, USA
Heat FluxHFP01 Heat Flux PlateHukseflux Thermal Sensors B.V., Delft, The Netherlands
Total SetupWeightScale 9392.15.140 (1×) and Scale 9392.16.140 (3×)Soehnle Industrial Solutions GmbH, Backnang, Germany
OutflowSmall Rain Gauge 100.054Pronamic ApS, Ringkoebing, Denmark
Table 2. Total monthly evapotranspiration [mm] 1.
MonthGarden RoofNature RoofEconomy RoofRetention Roof
April47.7n.d.33.758.8
May85.4n.d.102.878.8
June143.2100.380.0146.4
July123.891.089.491.8
August80.858.253.268.0
September45.141.742.648.5
Total (April–September)526n.d.370488
Total (June–September)393291265355
1 All values are extrapolated to the full month to allow for comparison among the roof systems. October is not included here as data were only available for four days in that month.
Publisher’s Note: MDPI stays neutral with regard to jurisdictional claims in published maps and institutional affiliations.

