Article

Evaluation of Soil Quality and Maize Growth in Different Profiles of Reclaimed Land with Coal Gangue Filling

1
School of Environment Science and Spatial Informatics, China University of Mining and Technology, Xuzhou 221000, China
2
Institute of Eco-Environmental Forensics, Shandong University, Qingdao 266237, China
*
Author to whom correspondence should be addressed.
Land 2021, 10(12), 1307; https://doi.org/10.3390/land10121307
Submission received: 23 October 2021 / Revised: 18 November 2021 / Accepted: 24 November 2021 / Published: 27 November 2021
(This article belongs to the Special Issue Managing and Restoring of Degraded Land in Post-mining Areas)

Abstract

:
Reclaiming subsidence and waterlogged zones caused by coal mining to maintain food and feed supplies is an urgent issue in China. Utilizing coal gangue (CG) as a filling matrix to construct different profiles of reclaimed land in coal mining subsidence has downsides, e.g., due to its low conservative capability of water-fertilizer and crop yield, its lack of quantitative evaluation of soil quality, and its limiting factors of crop growth. Quantifying the soil quality by principal component analysis (PCA), obtaining key soil indicators, and a scoring system can clarify the influence of the profile structure on soil quality and limiting productive factors of soil and ascertain the optimal profile. Soil quality was evaluated by the minimum data set (MDS) of soil quality index (SQI) obtained by PCA in seven different profiles of reclaimed plots constructed in a field with maize planting experiments. The agronomic traits of maize were analyzed and compared. The result shows that the pH value contributed highest in surface SQI value. Maximal and minimal SQI value is 0.57 and 0.18, respectively, the variation of SQI between different profiles reveals it increases with the increase in thickness of overburdens and decreases with the increase in soil interlayer depth of reclaimed land. SQI based on MDS has a correlation coefficient of 0.4280 with maize yield and the same sequence with comprehensive growth of maize in reclaimed plots. Agronomic traits of maize are positively correlated with the nutrient index and SM of the surface soil, and negatively correlated with pH, electrical conductivity (EC), and total salt content (TS). Choosing a thicker surface overburden and control pH of CG preceding filling can effectively augment soil quality and maize growth. This study provides the exploratory means and a scientific basis for the management and improvement of filling reclamation.

1. Introduction

The high groundwater level area in the eastern plain of China is a typical coal-grain compound area. Coal mining has caused immense subsidence and waterlogged zones of cultivated land in this area. With the continuous expansion of coal mining subsidence areas, the land reclamation rate of China is about 35%. Subsidence forms permanent basins, drastically disturbs the properties of soil, adversely affects nutrient cycling [1], and restricts plant growth. Therefore, it is urgent to reclaim the subsided land in the coal-grain compound area. CG is a great quantity of solid waste discharged in the process of coal mining and coal washing, currently utilized in applications of power generation, agricultural fertilizer, highway roadbeds, mined land reclamation backfills, brick production, cement production, and concrete production [2,3,4]. Previous research testified that using CG to fill and reclaim subsided land is a feasible way to dispose of this waste, so that it would not cause heavy metal pollution in soil and groundwater after long-term weathering and leaching [5,6,7].
Quantitative evaluation of surface soil quality can determine the appropriate soil profile, which is one of the important indicators to appraise the suitability of coal gangue reclamation land as cultivated land. However, inferring soil quality by merely measuring single or specific soil property is insufficient [8]. Accurate, repeatable, systematic, and transparent quantitative soil quality can enhance the interpretation and comparability between different sites [9]. The primary task of soil quality evaluation, in terms of cultivated land, is to clarify the evaluation objectives mostly focused on the productivity of the soil [10,11]. Influenced by the difference in soil data availability and the idea of minimum data set index screening, the selection of soil quality evaluation indexes in previous studies is different in quantity and type, but there are certain commonalities in the core evaluation indicators [12,13,14]. The indexes with higher frequency include SOM or organic carbon, bulk density, texture, soil thickness, water binding capacity, and total nitrogen (TN) [15,16,17,18,19]. The soil quality evaluation model is mainly based on a comprehensive evaluation, which can use various methods, e.g., principal component analysis [20], factor analysis, and decision function, to screen indexes and give weight to calculate SQI value [21,22]. In the case of few evaluation indexes, the comprehensive evaluation result is the product of continuous multiplication by independent index’ value [10]; additionally, the model can be obtained by using the verified empirical function comprehensive evaluation results of soil quality [23].
The water and fertilizer system need long-term management and recovery after the reclaimed land has been greatly disturbed in the key soil layers, which will lead to low crop yield. Although the input of a nitrogen fertilizer can achieve a substantial increase in food production, the excessive application of nitrogen fertilizer results in ecosystem degradation and environmental pollution [24,25,26], in addition, farmers are supposed to take advantage of their scarce resources to achieve the greatest return in a limited area [27,28]. The production limiting factors of reclaimed land are hence to be explored for improving land productivity and boosting crop growth. Current studies reported that the soil provides anchorage as well as stores nutrients and water required for plant growth [29], that soil properties and texture influenced the phenotypic expression of maize [30] in nitrogen uptake and yield [31,32], leaf area, plant height, and stem diameter [33,34], and moreover, the close association between aboveground biomass accumulation and soil water conditions during the different crop growth stages was revealed [35,36,37,38,39]. Similarly, less precipitation will significantly reduce the grain per spike and dry biomass above ground, and, reduce grain weight [40]. However, investigation on crop growth and limiting factors in the complex and disruptive soil environment of reclaimed land needs to be further expanded.
A platelike soil profile widely exists on the natural and reconstruction of soil profiles. As a practicable and economical profile can improve the conservative capability in water and fertilizer of surface soil, soil profile configuration plays a decisive role in the migration of soil water, fertilizer, gas, and heat, and has significant effects on soil water infiltration, nutrient transfer, solute transport, and root distribution. The properties of CG, low heat capacity, high thermal conductivity, and much higher thermal diffusivity than that of soil [7], will inevitably affect the varied process of surface water and heat, and further affect the movement of water inside the reclaimed soil and the growth of vegetation. Single layer filled reclamation resembles CG overlaid by soil, as reported in literature [41,42]. Few studies focused on multi-layer filling reclamation and the consequent reclaimed effect of the profiles’ contribution.
Globally, increasing energy consumption is bound to destroy more and more land, which is becoming a major global concern combined with food supply in the situation of crisis of farmland destruction. Based on the objective needs of land reclamation and crop yield improvement, as well as the context of related studies, we attempt to interpret the feasibility and suitability of CG filling reclamation from the perspective of soil and agriculture by detecting a variation of characteristic index. Therefore, we propose a variety of sandwich profiles of filling reclamation, utilize an evaluation tool to obtain quantified scores of SQI for the purposes of revealing the correlation between reclamation profile and SQI, explore the effects and limiting factors of crops agronomic traits. These synthetical means can be extensively applied to various land types for the exploration of mechanisms and spatio-temporal effects in surface SQI from the aspect of a multi-layered soil structure.
In this paper, we established a variety of multi-layered profile configurations of CG filling reclaimed plots with maize planting to test the physical and chemical properties of soil and monitor maize growth and yield. The aims of this study were (1) to develop an SQI evaluation process and describe the relationship between the construction of soil profile and surface SQI; (2) to evaluate maize growth and its limiting factors; and (3) to select the suitable profile configuration for future large-scale applications in mining subsidence. Additionally, this study provides a reasonable reference and effective support for the design of soil profile in a reclamation project with CG filling.

2. Materials and Methods

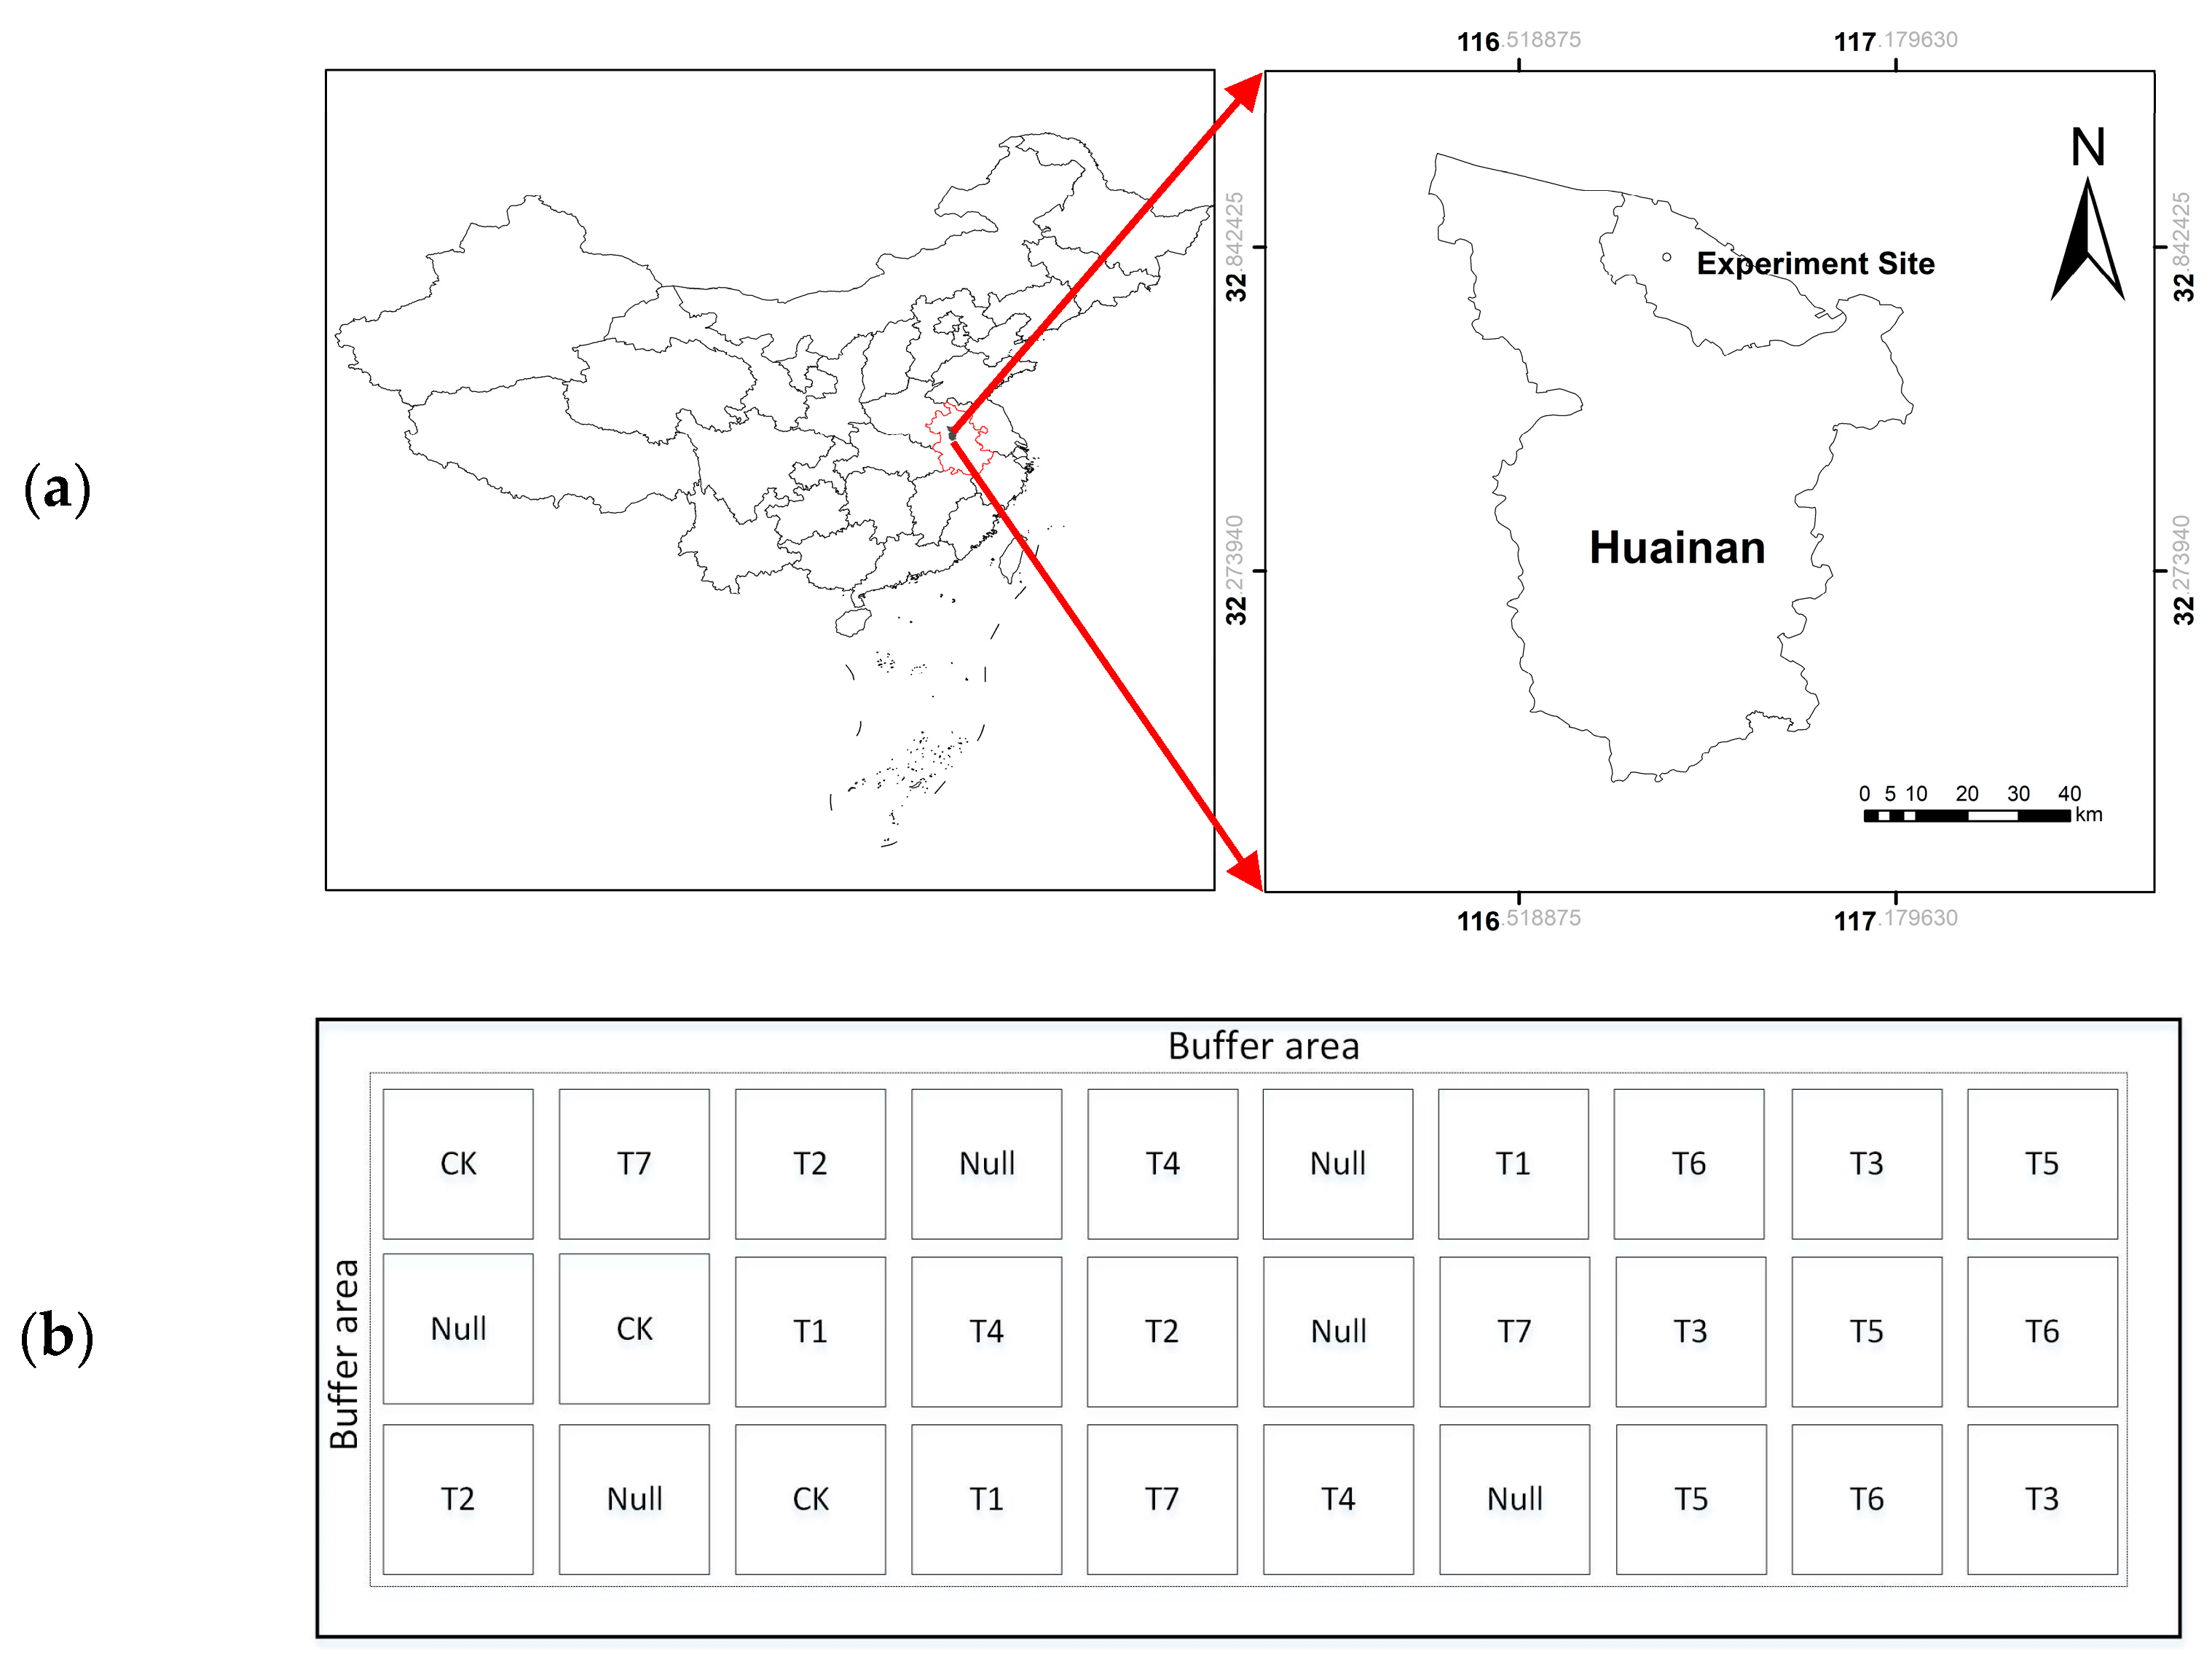
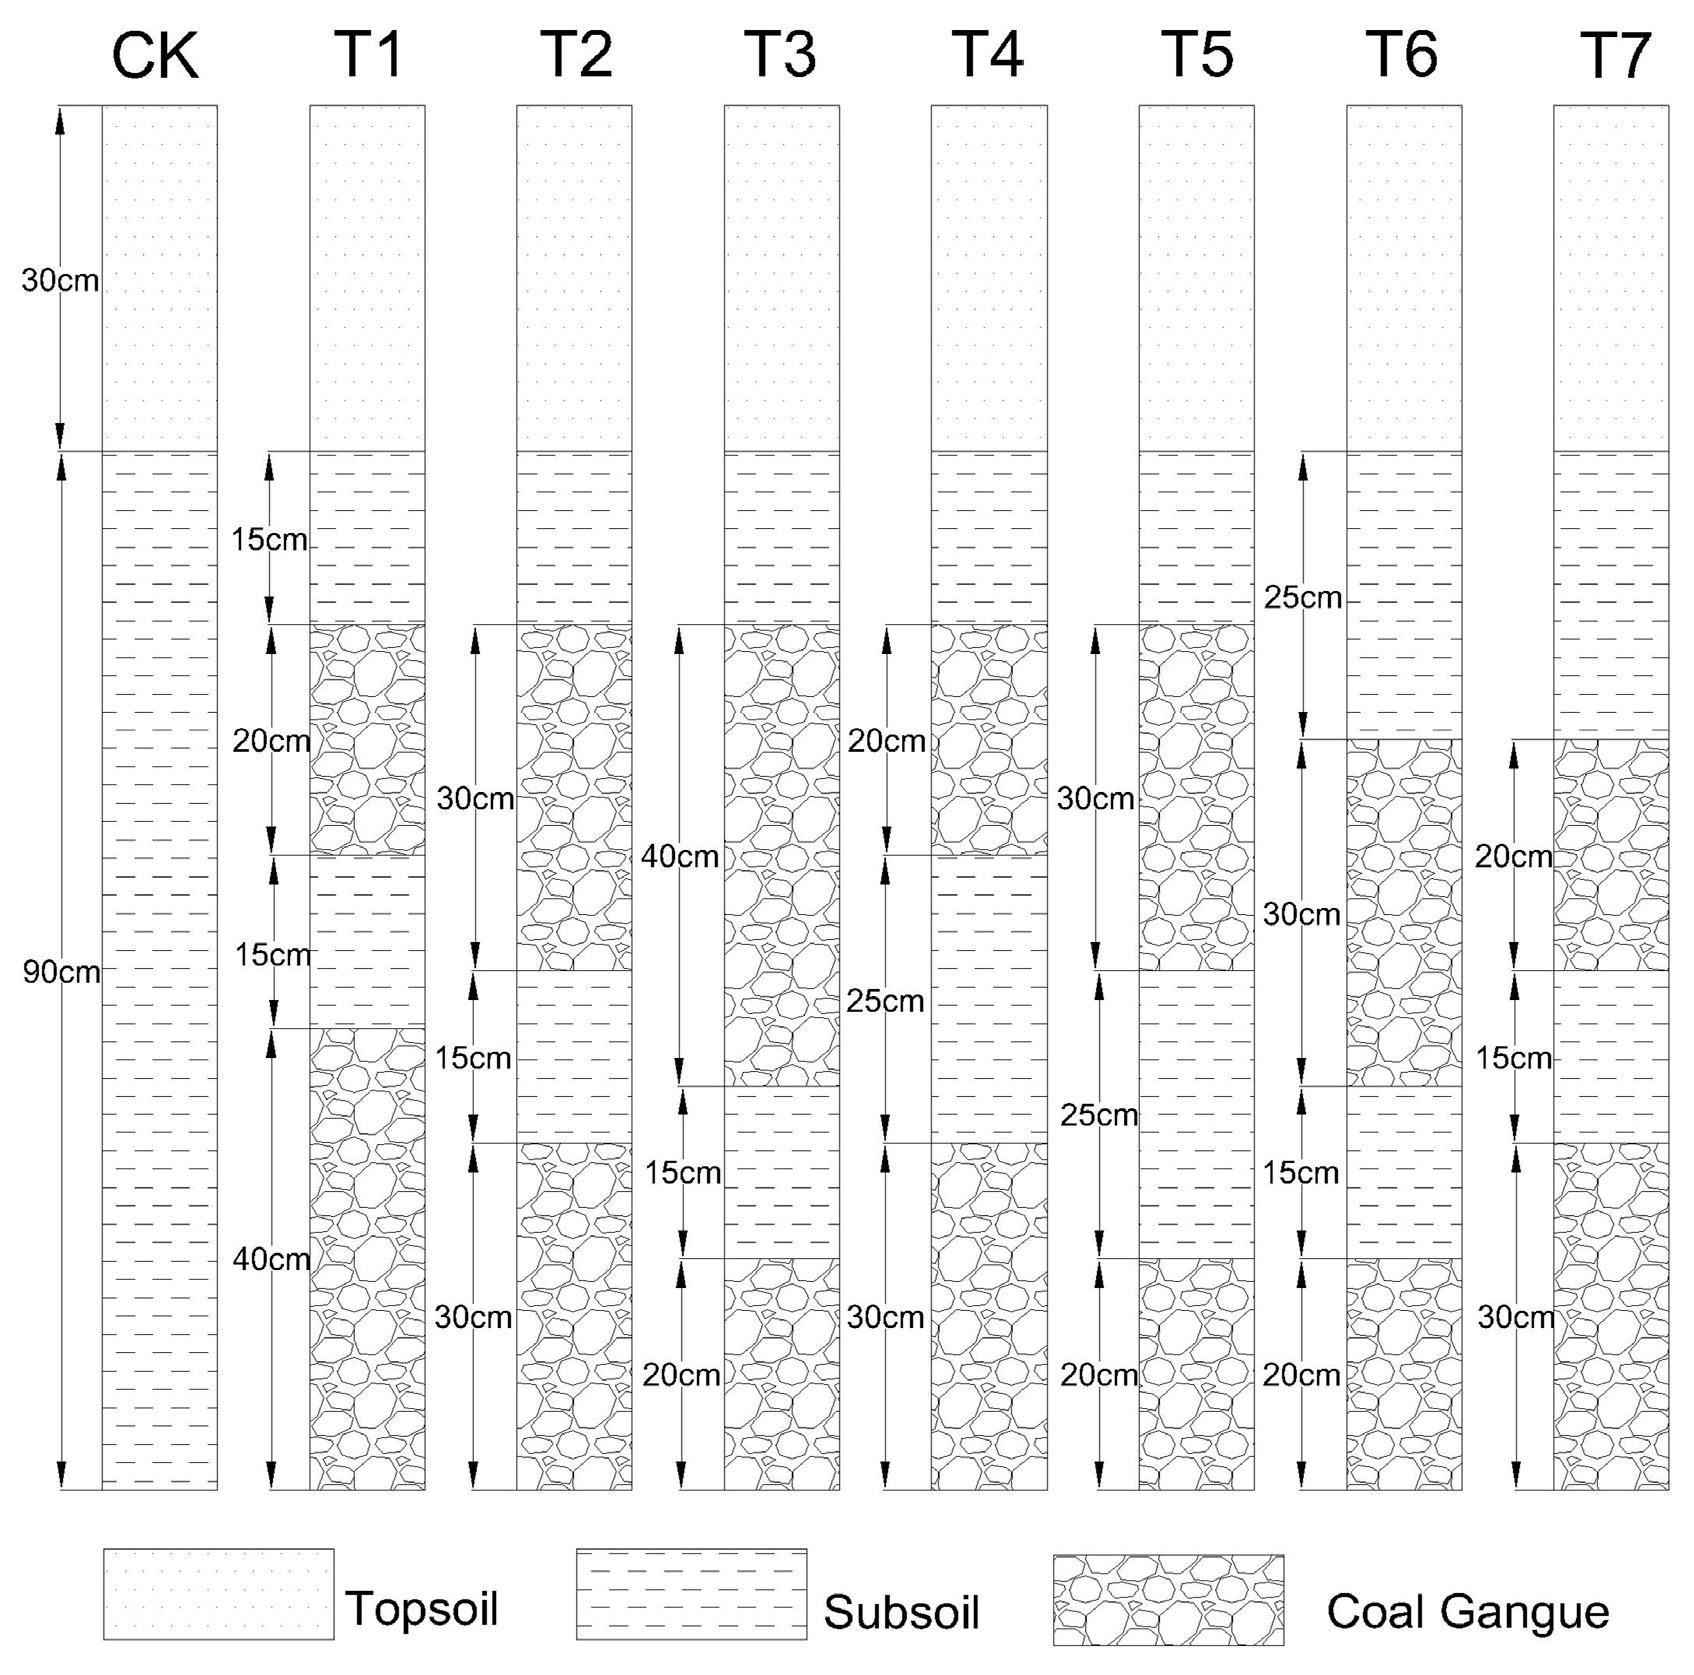
2.1. Experimental Sites

The experimental site was built on 17 January 2018, in the coal gangue reclamation area of Dongchen ecological park, Huainan, Anhui Province (32°79′ N, 116°73′ E) (Figure 1a). Huainan is located in the north-central part of Anhui Province, in the Huainan mining area, an important coal production base of China.
Filled CG is dense, large in size (10–50 mm), and largely lacks available nutrients for plants. The soil types of this area mainly include Shajiang black soil, fluvo-aquic soil, and brown soil. Shajiang black soil is a semi-aqueous soil formed under marsh vegetation on fluvial and lacustrine sediments in warm temperate and semihumid climatic conditions, dominated by montmorillonite [43], which is characterized by heavy texture, wet swelling and shrinking, easy desiccation and waterlogging, and low organic matter content. The existence of obstructive factors, including poor structure, poor air permeability, and low nutrient content, leads to low soil productivity.
A 1 m protective roe is set around the experimental site divided into 8 plots with diverse profiles of 7 m length by 6 m width. Each kind of plot is randomly arranged with 3 replicates, 24 plots in total, and isolated by a 0.5 m wide earth dam around to prevent its independence from the interaction of metastatic nutrients and water. The distribution of the plots is shown in Figure 1b. The soil profile configuration of the field plot is a sandwich-type (Figure 2). Excavators were used to stripe the soil in subsidence into topsoil and subsoil, and fill CG and the soil layer-by-layer according to the profile configuration. The thickness of each layer was determined by the altitude difference of the contiguous layers. CG filled the subsided land, as a substrate can raise the surface elevation from waterlogging risk while saving the soil consumption.

2.2. Sampling and Analysis

Maize was planted on April 4 and harvested on 24 June 2018, with a plant spacing of 30 cm, row spacing of 50 cm, and planting density of 68,400 plants per ha. Monitored growth indicators include plant height, stem thickness, leaf chlorophyll content, and leaf area in the maize tasseling period (73rd day), above-ground dry biomass, and maize yield after harvest. At each plot, in accordance with the diagonal sampling method, five points were distributed in the four corners and the middle of the sampling, which were then chosen to collect composite samples from, using a soil corer for subsequent experiments [41,44]. The properties of soil samples observed at layers H1 (0–15 cm) and H2 (15–30 cm) and interbedded CG samples in different sections and different depths are as follows: SM is determined by the core cutter method, soil pH and EC were determined in a 1:5 soil/water mixture by pH and conductivity meter, respectively [45], TS was measured by mass method [46], SOM was measured by potassium dichromate oxidation [47], total nitrogen (TN) was determined by the Kjeldahl Method and using alkaline hydrolysis diffusion method to determine Alkali-hydrolysable nitrogen (AN) [48], determination of total phosphorus (TP) and available phosphorus (AP) were respectively conducted using alkali fusion-molybdenum antimony colorimetric method and sodium bicarbonate extraction-molybdenum antimony colorimetric method [49], using the alkali fusion-flame photometer method to determine total potassium (TK) and 1 mol/L ammonium acetate leaching method to measure available potassium (AK) [50]. Selected properties of aboriginal soil and gangue before reclamation are shown in Table 1.

2.3. Statistical Analyses

Pearson correlation analysis was performed to reveal the relationships among the measured soil properties. Differences were considered to be significant if p < 0.05. The separation of means among the different sampling seasons was made using the least significant difference (LSD) test at 0.05 probability.
This paper used PCA to recombine multiple correlative indicators of soil attributes to a new set of independent comprehensive indexes to replace the original indexes evaluating the soil quality. The factors with high eigenvalues and soil variables with high factor loading were assumed to be indicators that can foremost represent farmland soil [51], hence the retained principal components are selected according to the eigenvalue >1 [52] and those that explained at least 5% of the variation in the dataset [53]. If a single component contains more than one soil attribute, the multivariate correlation coefficient is used to determine whether the variable is redundant. Only one of the variables with significant correlation is selected for soil quality evaluation, and the rest is eliminated. If the highly weighted variables are not correlated, each variable can be used for soil quality evaluation.
The measurement values of maize agronomic traits are dimensionalized to avoid the influence of different measurement scales [54]. Normalization is a common dimensional processing method and is suitable for comprehensive comparative evaluation, which allows all data with various mathematical units to be compressed in the range of [0, 1], including the two boundary numbers 0 and 1. Certain data will be normalized to 0 provided it is the minimum value, while data will be normalized to 1 provided it is the maximum value. It should be noteworthy that the normalized values do not reflect the magnitude or multiple difference of the original data. Equation (1) is the normalization function, as well as the following Equation (2).
S = ( x x min ) / ( x max x min )
where S is the normalized data of agronomic trait measurement value, x is the value of trait, x min is the minimum value and x max is the maximum value of trait.

2.4. Soil Quality Assessment Methods

The applicability and effectiveness of SQI mainly depends on setting appropriate threshold values of each soil attribute. In this study, the threshold value was obtained by analyzing the surface soil of CK plot (the plot with soil filling structure). The indicators are arranged in ascending or descending order depending on whether the higher soil attribute value was considered as “good” or “bad” in terms of soil function [55]. Generally speaking, the scoring function of the indicator follows the trend of scoring curve of “more is better”, “less is better”, and “optimum”. Use the “more is better” function for soil nutrients [56,57,58,59,60], select the “less is better” function for EC and TS [61,62,63], and use the “optimum” curve to evaluate soil pH and SM.
Equations (2) and (3) are the calculation function of the indicators of “more is better” and “less is better”, respectively. The “optimum” curve function is composed of both, the observation value is rated as “more is better “ if it is lower than the threshold, and rated as “less is better” if it is higher than the threshold [64].
S i = ( x L ) / ( H L )
S i = 1 ( x L ) / ( H L )
where S i is the score of soil variable, x is the value of soil variable, L is the minimum value, and H is the maximum value of soil variable [65].
The index scores are integrated into an additive index, which is calculated by the equation:
S Q I = i n W i S i ,
where W is the weighting factor for the soil variables derived from PCA and S is the index score. The equation is normalized to generate a maximum SQI value of 1.

3. Results

3.1. Selection of Soil Quality Indicators

In the results of PCA, the eigenvalues of the first three components were greater than 1, and each eigenvalue explained more than 5% of the data changes, accounting for 87.83% of the total variance (Table 2). The first principal component variance was 58.88%, in which SOM had the maximum loading value, The loading values of TN, AN, AP, and AK were within 10% of the maximum loading value, while SOM had a high correlation with the other four variables (Table 3), therefore, only SOM in PC1 was selected as the soil quality index; pH had the maximum loading value, 19.18%, in variance of PC2, and EC and TS loading values were within 10% of the maximum loading value. According to Table 3, the correlation coefficients of pH and EC, TS were respectively 0.749 and 0.770, while EC and TS had a high correlation, so pH and EC were selected in PC2. The variance of PC3 was 9.77%, and SM was selected as the soil quality evaluation index depending on the loading value.
Empirically, using CG as the matrix to fill reclaimed farmland has the downside of weak capacity in holding water and fertilizer. Furthermore, CG can easily release components, affecting the surface soil pH, which suffers from leaching and soaking under rainy weather and damp conditions. SOM and SM are basic elements used to maintain crop growth. EC can respond to the salinization of soil. Accordingly, pH, SOM, SM, and EC are suitable and essential for evaluating soil quality of reclaimed farmland. A previous study likewise indicated that SOM, EC, and pH are the common components of various MDS experimentally [55].

3.2. Feature of MDS

The pH of the surface soil in CK, with a depth of 0–30 cm, is significantly lower than or approximate to the soil pH of the sandwich profile as shown in Figure 3. Due to the complete soil structure, the pH of CK does not emerge, fluctuate, or change at different depths as the pH of reclaimed plots. Besides, the pH of layer H1 in reclaimed plots ranges from 7.43 (T6) to 7.67 (T3), and the pH of the interlayered soil (60–70 cm or 80–90 cm) is slightly higher than pH of the surface soil.
EC, SM, and SOM in the surface soil of T1, T2, and T3 show a tendency: as the depth of the interlayered soil increases, the EC increases, while SM and SOM decrease as shown in Figure 4. The thicker interlayered soil of T4, T5, or surface soil of T6, T7 makes EC, SM, and SOM of soil superior to the first three (T1, T2, and T3) types of reclaimed plot. Given layer H1, T3 and T7 possess EC of 102.00 us/cm and 78.00 us/cm, respectively, with 1.62 and 1.24 times as much as EC in CK, T3 contains the least SOM (4.76 g/kg) and T7 contains the highest (5.52 g/kg) in reclaimed plots, account for 76% and 88% of SOM in CK. SM exhibits a slight difference over all plots varying from 24.48% (T3) to 25.43% (T5). Compared to H1, EC and SM in H2 increase in some extent with a maximum increase ratio of 19.57% of EC of CK and 5.97% of SM of T4 over all plots, and SOM demonstrates a decreasing tendency on the contrary.

3.3. Weight Calculation

When performing PCA again for the four selected SQI evaluation indicators, each PC explained a certain amount (%) of the variation in the data set. This percentage, divided by the total percentage of variation explained by all PCs with Eigenvectors > 1.0, provided the weighted factor for variables chosen under a given PC [66]. The statistical descriptions and weights of the four indicators are shown in Table 4.

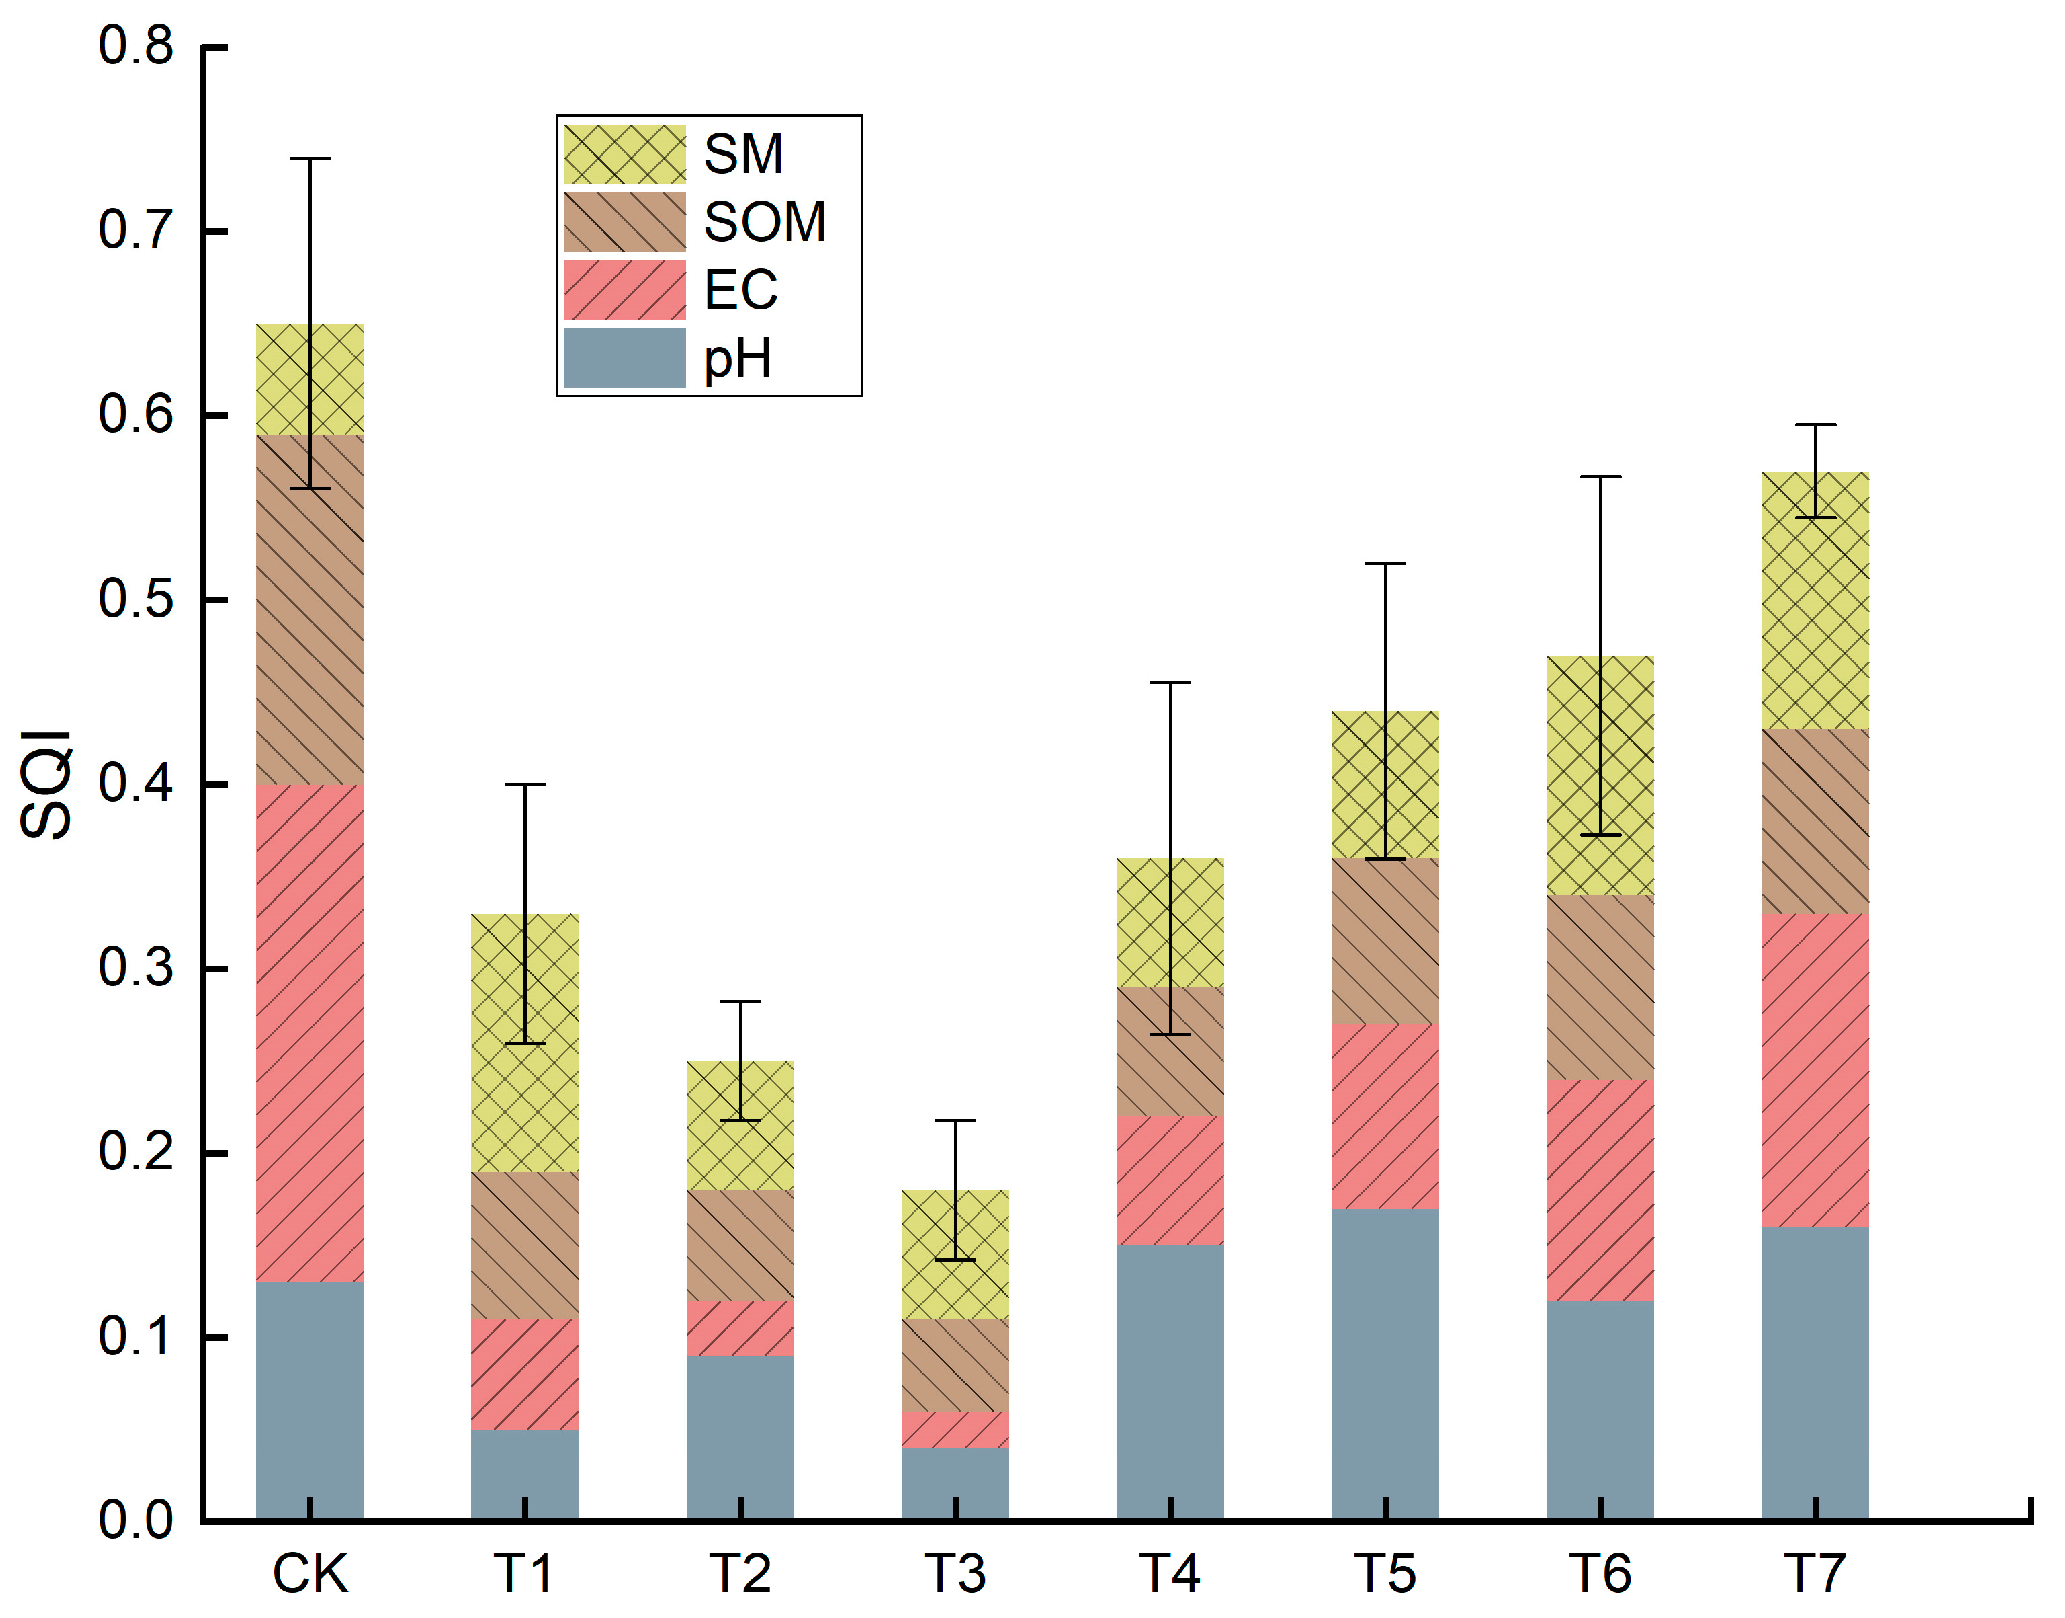
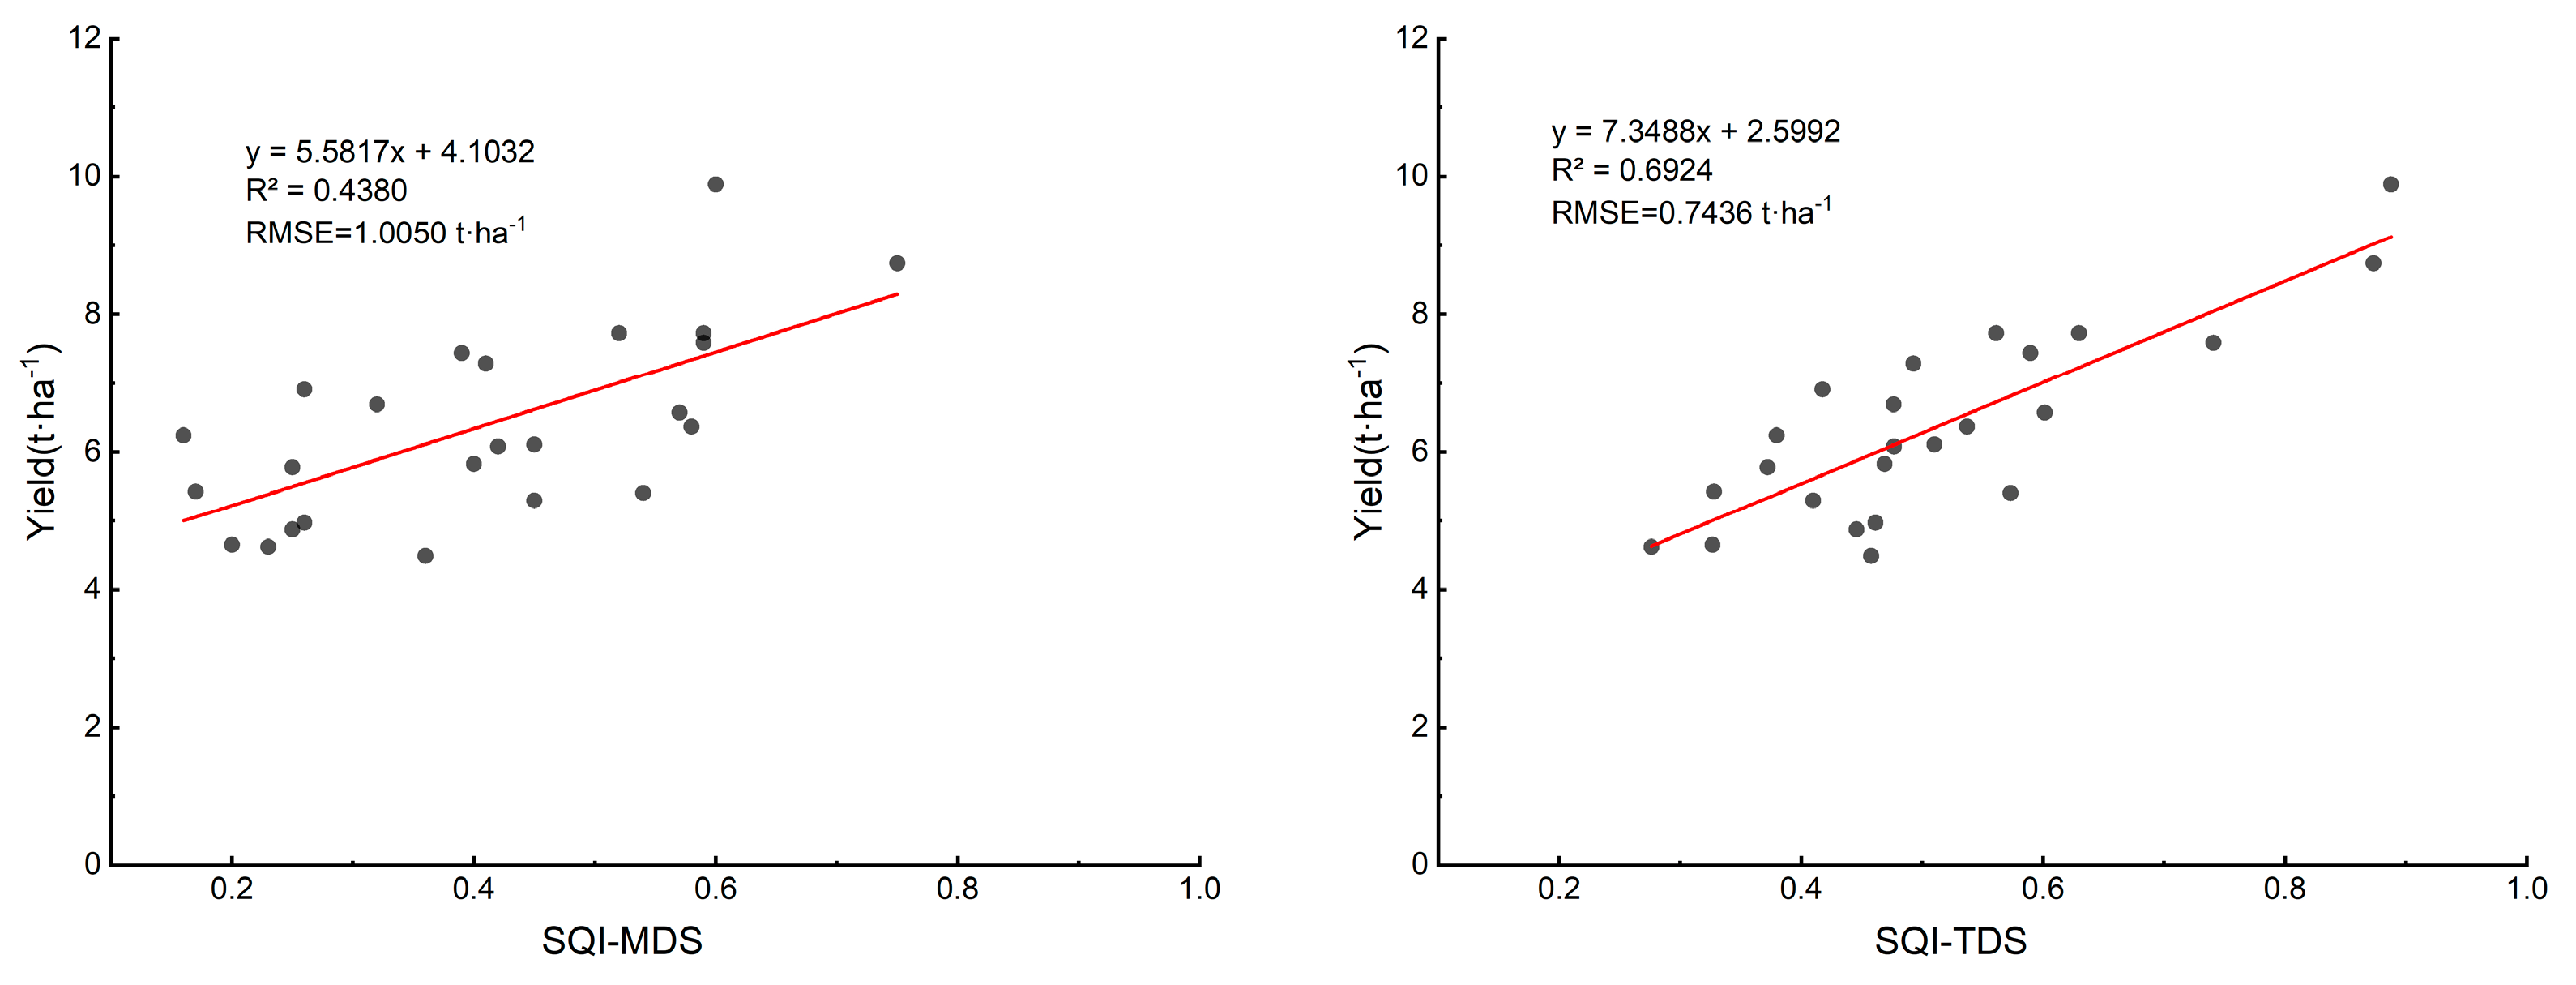
3.4. Soil Quality Assessment

We calculated the scores of each index and sum the weighted scores of each variable to obtain the SQI value of each plot (Figure 5). The H1 SQI value of CK was 0.66. Among seven kinds of soil profiles with CG filling, the H1 SQI value of T7 was the highest at 0.57, while the T3 was the lowest at 0.18. The SQI value of CK is significantly higher than that of the reclaimed land. Figure 5 shows the SQI value of reclaimed plots in different profiles and the specific score of each index, which explicitly reflects the impact of the weighting factor obtained through PCA.
For the seven types of CG filling and reclamation profile configurations, the contribution calculation results manifest a greater impact of pH and SM on SQI. The pH has the highest contribution value in SQI, with an average of 30.94%, followed by SM, with an average contribution value of 23.47%, the average contribution of EC and SOM is 22.53% and 23.07%, respectively. In traditional farming, pH is not considered to be an indicator that affects the SQI. However, in reclaimed land filled with CG, the oxidation process of CG will affect the pH of farmland soil, as carbonates in CG tend to increase in pH as they weather and dissolve into alkaline substances [41].
SQI values of the T6 and T7 plots covered by soil with a thickness of 55 cm are higher than that of the rest of plots with covering soil of 45 cm in thickness, indicating that thickness of overburden is positively correlated with the H1 SQI. Likewise, SQI values of T4, T5, T6, and T7 filled by CG with an overall thickness of 50 cm are higher than that of other plots filled by CG with a thickness of 60 cm, which indicates that CG filling thickness is negatively correlated with the SQI. The position of the interlayered soil identically affects the surface SQI. T1, T2, T3, and T6, T7 have the same thickness of overburden and filled CG but a different profile with interlayer in various depth results in significantly distinguishing SQI values, which are 0.33, 0.24, 0.18, 0.47, 0.57 in order. The variation reports that deeper interlayered soil drives lower surface SQI value. In general, the surface SQI value increases with the increase of the thickness of covering soil and decreases with the increase of the depth of the interlayered soil.
Add all soil properties into the total data system (TDS) to calculate the SQI, achieving better linear fitting with annual crop yield than SQI-MDS with yield. Determination coefficient (R2) and root mean square error (RMSE) are used to depict the fitting effect, as shown in Figure 6. Although the four selected soil indicators can reflect the changing trend of soil quality in different CG filling and reclamation profiles, the addition of the remaining soil indicators can still improve the prediction accuracy of SQI value for crop yields with higher R2 (0.6490) and lower RMSE (0.7443 t/ha).

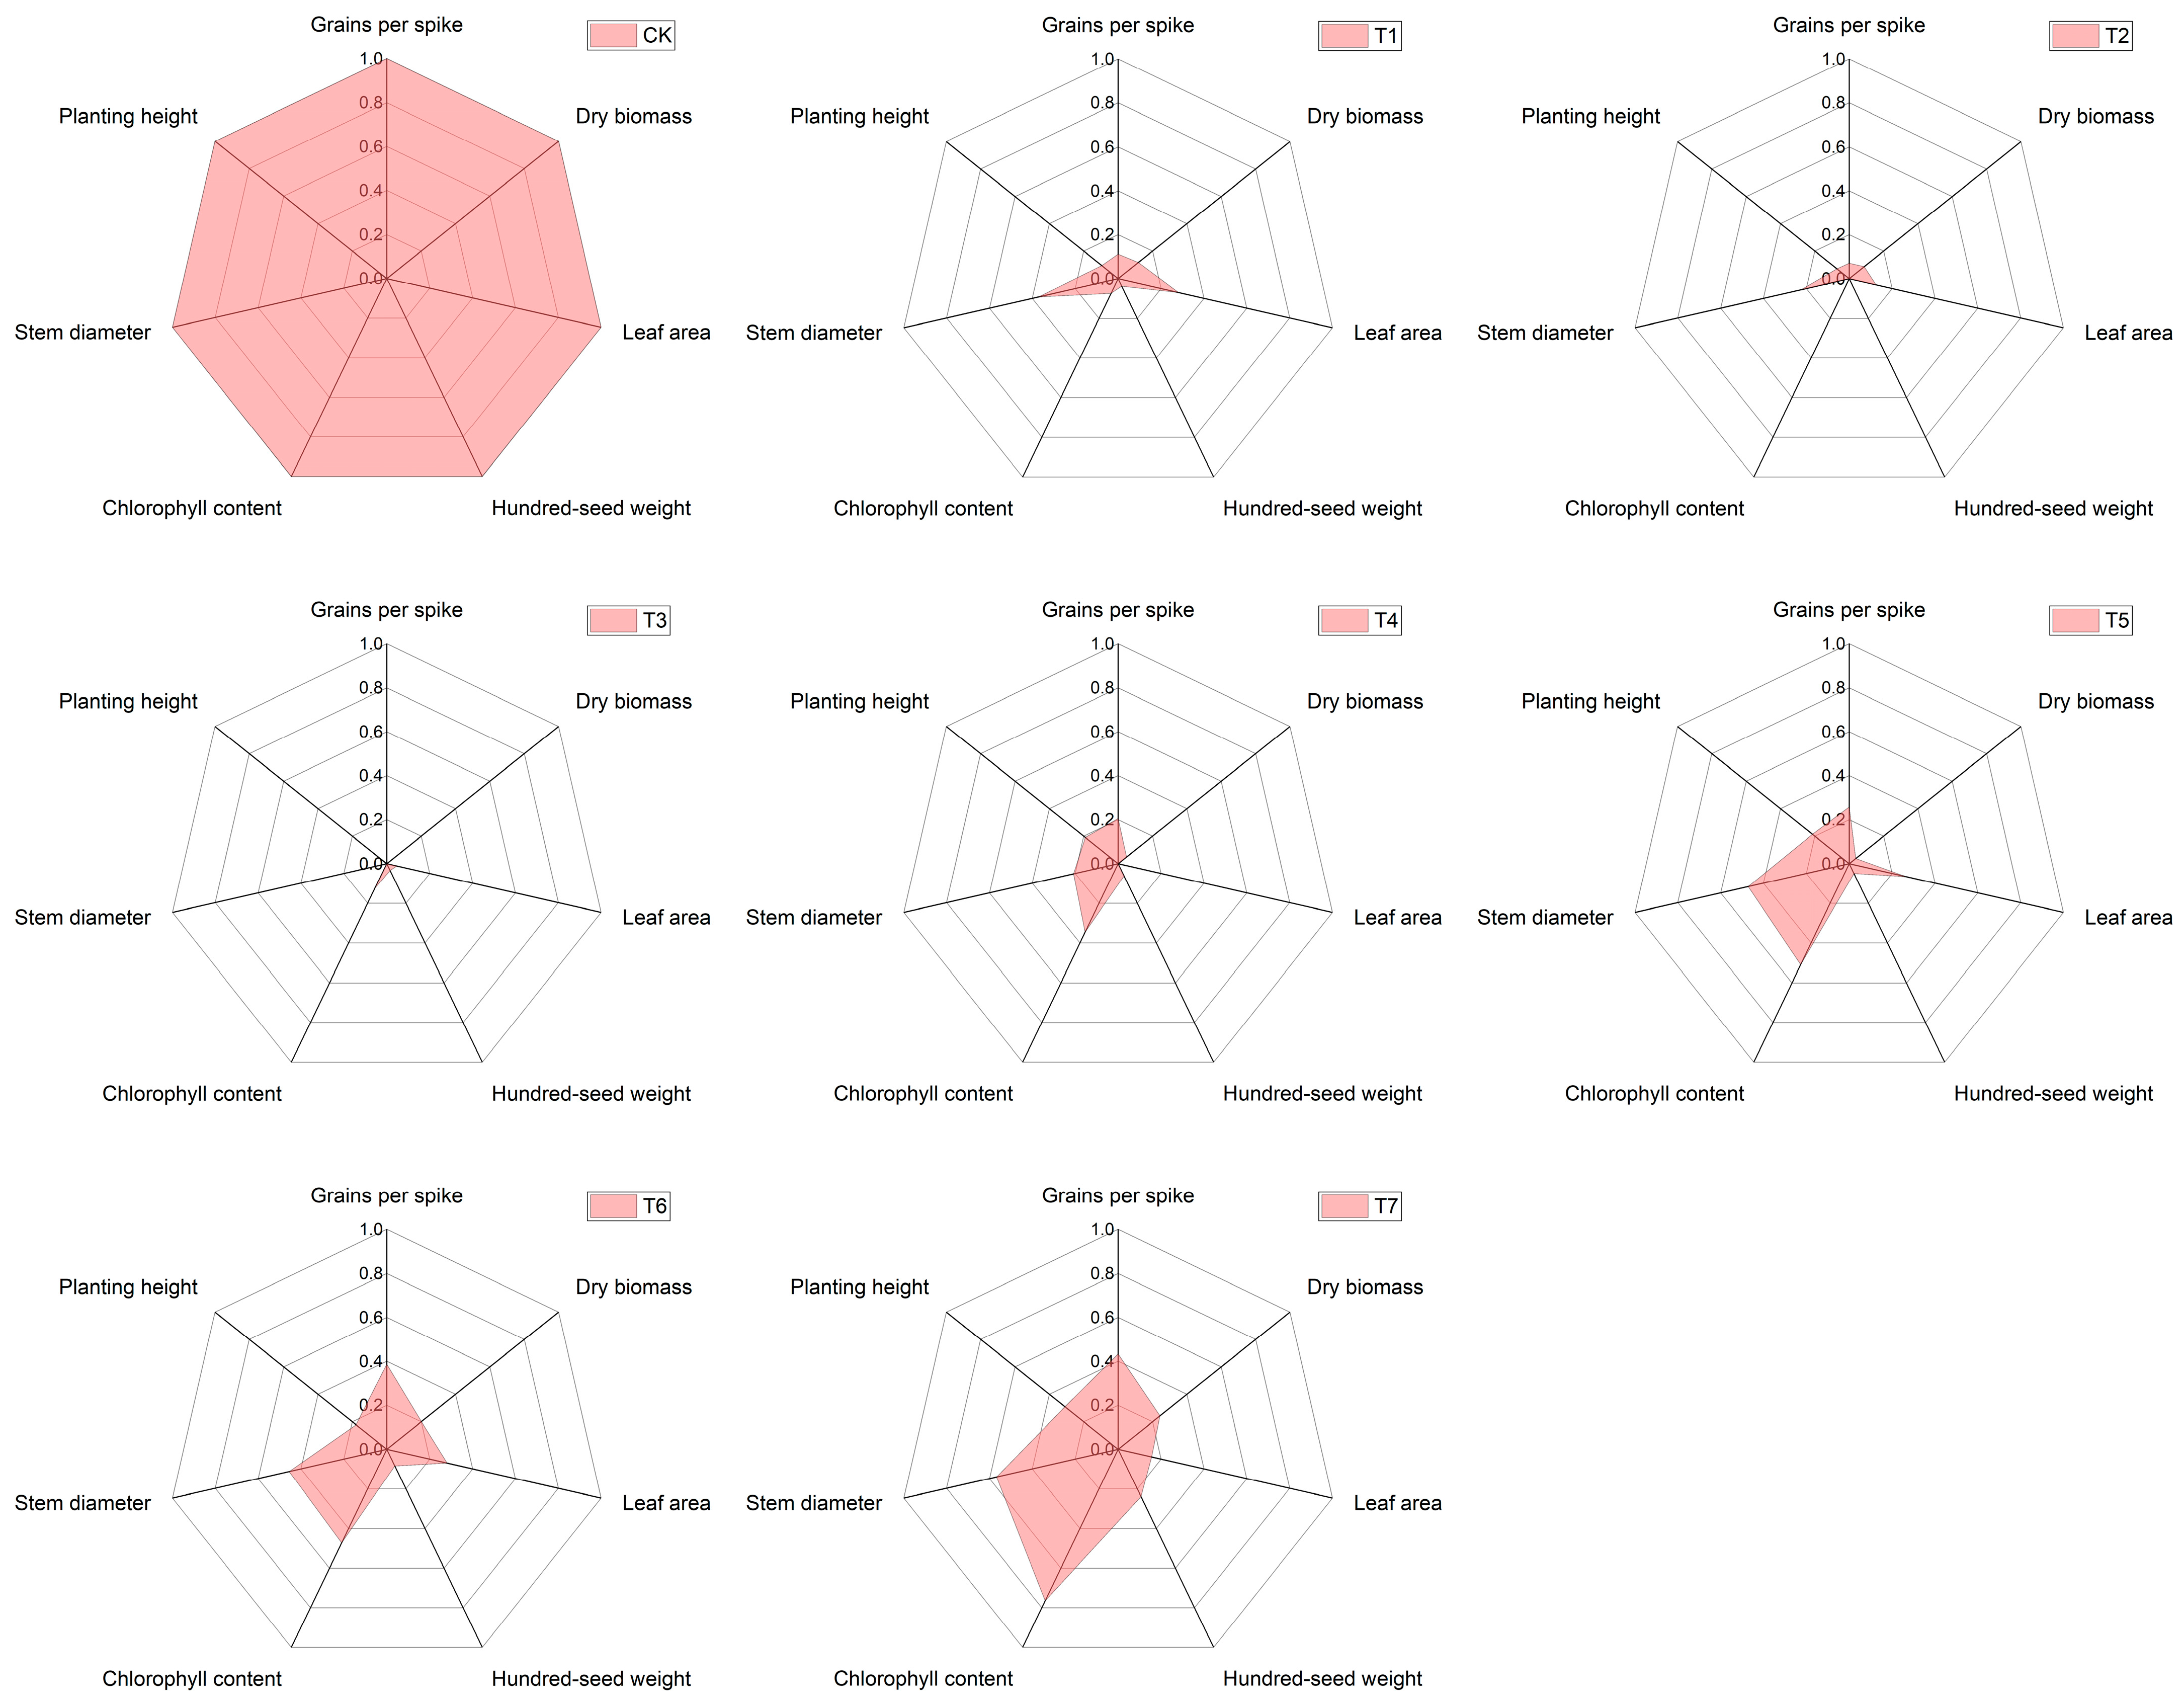
3.5. Agronomic Traits of Maize under Different Profile Configurations

The seven measured data of maize agronomic traits are normalized. As shown in Figure 7, the radar map area of CK and reclaimed plots are in the same sequence as the SQI value, the maize growth of T7 comparatively exceeds among the reclaimed lands, and maize in T3 grows worst. Specifically, maize in T2 has the worst hundred-seed weight and chlorophyll content, maize in T3 has poor grains per spike, dry biomass, stem thickness, and plant height, maize in T4 has the worst performance in leaf area, while maize in T7 is superior in all traits compared with the rest of reclaimed plots. In terms of maize yield components, the average number of grains per spike of maize in CK and reclaimed lands is 559 and 446 respectively, while maize in the T7 plot has the highest number of grains per spike of 490. The average hundred-seed weight of maize in the CK is 26.08 g, which is significantly larger than the average hundred-seed weight of maize in the reclaimed lands (22.60 g) with the largest hundred-seed weight in T7 of 23.23 g.
Whereas dry biomass and hundred-seed weight directly affect maize yield [50], their terrific weak performance on maize planted in reclaimed land deserves expeditious attention along all growth stages of maize.

4. Discussion

4.1. Impact Factors to Physical and Chemical Properties of Surface Soil

The texture, bulk density, and organic content of the filling material affects the hydraulic characteristics of the soil profile. However, the complex interpretation of the PC is more vital regarding their information source on the latent relationship among the individual indicators, including soil forming processes and the impacts of land use [67,68].
Due to the inhomogeneity of the layered soil and the sequence and thickness of the soil layers, the water conservation of the soil layer has abrupt changes at the interface between layers, as the wetting front stops at the fine soil-coarse soil interface because of capillary barrier [69], resulting in hydrological discontinuity and an increase in SM of the upper soil [70]. Shajiang black soil is a kind of black soil that does not secrete silt and has a large mud content and limited water infiltration, which prevents the downward movement of water at the hydrological discontinuity interface between filled CG and the upper soil layer in reclaimed land. Meanwhile, CG, located in the middle layer of the soil profile, inhibits the infiltration process of SM and correspondingly increases the moisture of the upper contiguous soil, resulting in SM in the H2 layer, higher than in the H1 layer. The specific laws and mechanisms in the process of impedance and movement are topics we will explore further. Since the water movement and solute migration in the soil are interrelated and interactive, EC possesses similar distribution characteristics with SM on various soil profiles, as well as the transportation impeded by CG [71]. Accretion of humus may devote the difference of SOM between layers H1 and H2, which is most commonly used as an indicator to characterize the ecosystem function [72,73].
Depending on the contribution rate of SQI of CK plot, EC has the greatest impact on the SQI in the situation where soil indicator values are at a normal level, while a small change in the EC value may cause a sharp change in SQI. An increase in the EC value of soil demonstrates that the field is at a risk of salinization, most likely caused by the shallow groundwater level and limited drainage. The control and management of soil EC value can effectively improve the SQI of cultivated land.
Furthermore, the surface soil is susceptible to be influenced by lower pH of the CG layer, and the pH becomes the crucial indicator of SQI. Prerequisite measures should be implemented consequently to decrease the pH of CG as a filled and reclaimed substrate. The main problem that hinders the land reclamation process is the absolute low quality and long recovery phase of reclaimed soil, which barely conducts restoring the soil to its original level in a short period of time [41]. Furthermore, changes in physical and chemical properties of soil used to monitor SQI require long-term observation for verification of the sustainability of reclaimed land.

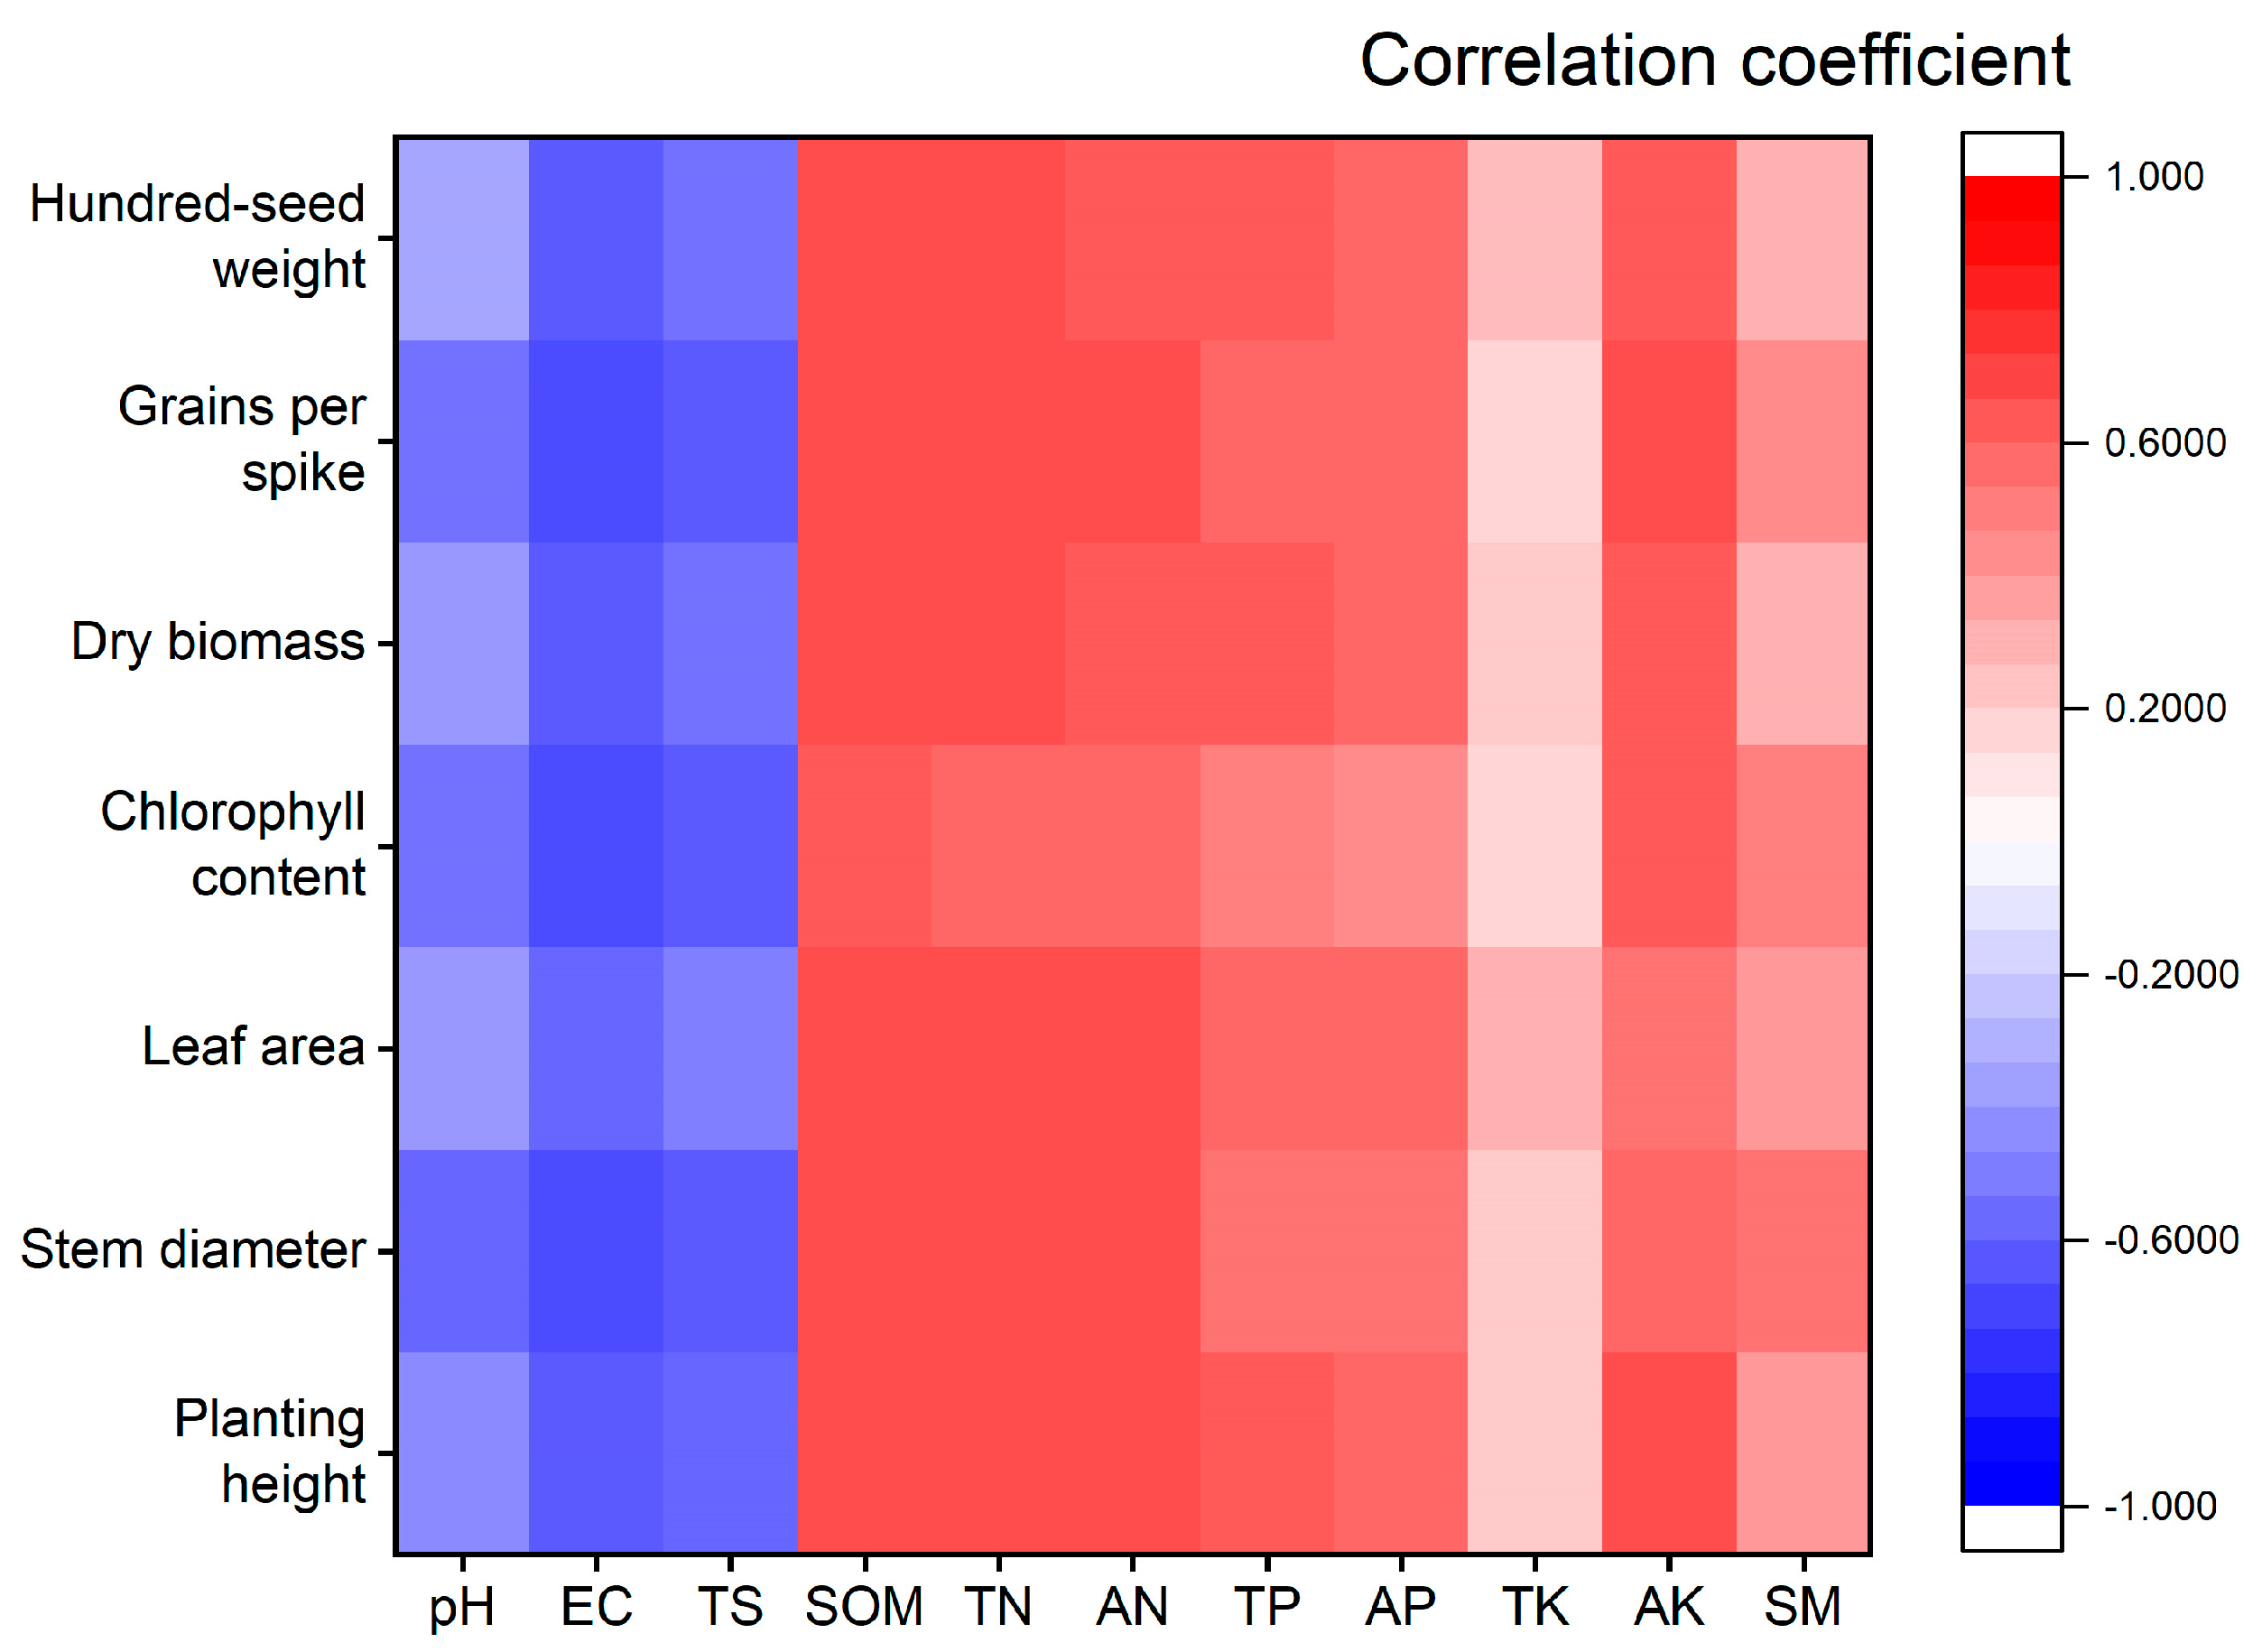
4.2. Correlation between Agronomic Traits of Maize and Properties of Surface Soil

Crop growth status is mainly determined by field crop management, climate, and inherent soil productivity [74]. The experimental sites with different profile configurations are under the same field management and climate environment, so the difference in observed variations of crop growth is mainly caused by the inherent productivity of soil. Previous reports align with the findings in this study [29,30,31,32,33,34].
As shown in Figure 8, all agronomic traits, corn hundred-seed weight, grains per spike, aboveground dry biomass, leaf chlorophyll content, leaf area, stem diameter, and plant height, are positively correlated with nutrients and SM, correlation between stem thickness and AN is maximum with a coefficient of 0.986. All traits are extremely significantly correlated with SOM, TN, AN, and AK, while the correlation with TK is relatively lower than 0.4. All traits are negatively correlated with pH, EC, and TS, the minimum correlation coefficient is −0.979 calculated by grains per spike and EC. The positive correlation between nutrients and growth situation indicates that the increased availability of nutrients has a beneficial effect on maize plants, thus promoting the growth, yield, and yield components of crops, similarly, negative correlation indicates the inhibitory effect on plant growth. Therefore, higher nutrient levels and lower pH, EC, and TS levels of soil in T7 result in a high growth and yield of maize and vice versa for T3. On account of the correlation between plants and soil properties, the level of soil quality can still be differentiated even from the perspective of crop growth. Determining the influencing factors of maize growth can increase maize yields by upgrading soil quality in a targeted manner, for example, by limiting TS and increasing SOM, TN, AN, and AK in topsoil to ameliorate soil properties.

4.3. Design of CG Filling and Reclamation Profile

Platelike soil can improve soil water storage capacity and reduce nutrient loss due to the strong textural contrast created, during both the infiltration and drainage processes [69]. Permeability is a basic soil property depicting the hydraulic activities of unsaturated soils, and it varies wildly in various types of soils such as silty, clay, loamy, and sandy soil [75]. Shajiang black soil exhibits the characteristics of sticky texture, poor water permeability, easy flooding, as well as drought. It is usually disposed with large-particle amendments, e.g., fly ash, straw, biochar, etc. mixing to improve the permeability of Shajiang black soil and ameliorate the drainage of profiles. This study shows that the design of the interlayer should be adapted to soil conditions. For soil with large infiltration rate and poor water-fertility retention, the Shajiang black soil interlayer can be used to improve water and fertility conservation of the soil profile. However, as far as soil with poor water permeability, the profile with interlayered Shajiang black soil should be prudentially selected for enhancing the water permeability to prevent waterlogging in areas with abundant rainfall. On the other hand, the permeability of filling materials and covering soil should be fully compared to analyze the infiltration or storage of water in the design stage of profile.
Moreover, the weaker infiltration performance of CG used in this study with a small particle size (less than 2 cm), as well as the specific attribution of harder texture, lower nutrient content, and greater pH compared to soil, becomes a severe shortage to elevate the SQI value of reclaimed land. Crop roots growth is more unfavorable with the shallower depth of CG buried as a barrier layer. The existence of the CG interlayer has a certain impact on the water supply of the upper soil, the extreme performance of T3 and T7 on SQI value verifies the adverse influence of CG layer. Specifically, the capillary barrier at the interface and the weak water conductivity of CG, as a medium, will weaken the water supply capacity of the lower soil layer and reduce the drought resistance of the reclaimed site during drought weather, so the field moisture of the reclaimed soil should be managed in combination with necessary irrigation measures.

5. Conclusions

The PCA-based SQI presents quantitative results of soil quality of the reclaimed land filled with CG and the foremost leading factor of pH with an average contribution value of 30.94%. Besides, EC, SOM, and SM play an important role in the increment of SQI and crop growth. The thickness of overburden, filled CG, and its depth, affect the SQI values helpfully and adversely in some extent. Regarding the thickness of overburden and the depth of the interlayer, the T7 profile has a peak SQI value of 0.57 and a planted maize growing situation with considered configuration may be suitably applied in filling reclaimed land. This research provides a realized method and approach for the acquisition and processing of soil comprehensive information and crop growth evaluation for relevant investigations aimed at soil quality, crop adaptability, and filling reclamation.
Critically, comprehensive consideration and modification of soil profile are required to rapidly revitalize productivity preceding implementation of reclamation. Conduciveness in water and solute of aboriginal soil can directly affect the design of a profile with thickness of overburden, overall thickness of CG, and position of interlayer soil. The profile also affects the properties of the topsoil, which may lead to even worse effects. This interactive relationship exists with some issues to be further studied, including explicit law of water-solute transportation crossing the interface between soil and CG, refined field means to achieve better crop growing situation, and higher productivity of reclaimed land as arable land.

Author Contributions

Conceptualization, Z.H.; methodology, S.L.; validation, S.L.; formal analysis, S.L.; investigation, Y.G.; resources, Y.G.; data curation, Y.G.; writing—original draft preparation, S.L.; writing—review and editing, Z.H.; visualization, S.L.; supervision, Z.H.; project administration, S.L.; funding acquisition, Z.H. All authors have read and agreed to the published version of the manuscript.

Funding

This research was funded by the National Natural Science Foundation of China (NO. 41771542).

Institutional Review Board Statement

Not applicable.

Informed Consent Statement

Not applicable.

Data Availability Statement

The data presented in this study are available on request from the corresponding author.

Acknowledgments

We thank the National Natural Science Foundation of China for its support of this study. We are grateful to the academic editors and anonymous reviewers for their valuable opinions and comments.

Conflicts of Interest

The authors declare no conflict of interest.

References

  1. Burke, R.A.; Fritz, K.M.; Barton, C.D.; Johnson, B.R.; Fulton, S.; Hardy, D.; Word, D.A.; Jack, J.D. Impacts of mountaintop removal and valley fill coal mining on C and N processing in terrestrial soils and headwater streams. Water Air Soil Pollut. 2014, 225, 1–17. [Google Scholar] [CrossRef]
  2. Wang, J.; Qin, Q.; Hu, S.; Wu, K. A concrete material with waste coal gangue and fly ash used for farmland drainage in high groundwater level areas. J. Clean. Prod. 2016, 112, 631–638. [Google Scholar] [CrossRef]
  3. Haibin, L.; Zhenling, L. Recycling utilization patterns of coal mining waste in China. Resour. Conserv. Recycl. 2010, 54, 1331–1340. [Google Scholar] [CrossRef]
  4. Yu, L.J.; Feng, Y.L.; Yan, W. The current situation of comprehensive utilization of coal gangue in China. Adv. Mater. Res. 2012, 524–527, 915–918. [Google Scholar] [CrossRef]
  5. Qi, J.; Hu, Z.; Zhou, J. Environmental implications of waste coal back-fillings for land reclamation in coal mine areas with shallow water table. China Coal 2002, 10, 39–41. (In Chinese) [Google Scholar] [CrossRef]
  6. Xuan, L.; Wenkai, L.; Hebing, Z.; Haipeng, N. Comprehensive landscape ecology stability assessment of a coal gangue backfill reclamation area. Pol. J. Environ. Stud. 2016, 25, 1305–1314. [Google Scholar] [CrossRef]
  7. Tan, W.-F.; Wang, L.-A.; Huang, C. Environmental effects of coal gangue and its utilization. Energy Sources Part A Recovery Util. Environ. Eff. 2016, 38, 3716–3721. [Google Scholar] [CrossRef]
  8. Obade, V.D.P.; Lal, R. Science of the Total Environment A standardized soil quality index for diverse field conditions. Sci. Total Environ. 2016, 541, 424–434. [Google Scholar] [CrossRef]
  9. De Paul Obade, V.; Lal, R. Using meta-analyses to assess pedo-variability under different land uses and soil management in central Ohio, USA. Geoderma 2014, 232–234, 56–68. [Google Scholar] [CrossRef]
  10. Liu, Z.; Zhou, W.; Shen, J.; Li, S.; Ai, C. Soil quality assessment of yellow clayey paddy soils with different productivity. Biol. Fertil. Soils 2014, 50, 537–548. [Google Scholar] [CrossRef]
  11. Mueller, L.; Schindler, U.; Shepherd, T.G.; Ball, B.C.; Smolentseva, E.; Hu, C.; Hennings, V.; Schad, P.; Rogasik, J.; Zeitz, J.; et al. A framework for assessing agricultural soil quality on a global scale. Arch. Agron. Soil Sci. 2012, 58, S76–S82. [Google Scholar] [CrossRef]
  12. Chahal, I.; Van Eerd, L.L. Quantifying soil quality in a horticultural-cover cropping system. Geoderma 2019, 352, 38–48. [Google Scholar] [CrossRef]
  13. Shi, Z.; Bai, Z.; Guo, D.; Chen, M. Develop a Soil Quality Index to Study the Results of Black Locust on Soil Quality below Different Allocation Patterns. Land 2021, 10, 785. [Google Scholar] [CrossRef]
  14. D’Hose, T.; Cougnon, M.; De Vliegher, A.; Vandecasteele, B.; Viaene, N.; Cornelis, W.; Van Bockstaele, E.; Reheul, D. The positive relationship between soil quality and crop production: A case study on the effect of farm compost application. Appl. Soil Ecol. 2014, 75, 189–198. [Google Scholar] [CrossRef]
  15. Salvati, L.; Ferrara, C.; Corona, P. Indirect validation of the Environmental Sensitive Area Index using soil degradation indicators: A country-scale approach. Ecol. Indic. 2015, 57, 360–365. [Google Scholar] [CrossRef]
  16. Stone, D.; Costa, D.; Daniell, T.J.; Mitchell, S.M.; Topp, C.F.E.; Griffiths, B.S. Using nematode communities to test a European scale soil biological monitoring programme for policy development. Appl. Soil Ecol. 2016, 97, 78–85. [Google Scholar] [CrossRef]
  17. Kibblewhite, M.G. Definition of priority areas for soil protection at a continental scale. Soil Use Manag. 2012, 28, 128–133. [Google Scholar] [CrossRef]
  18. Bünemann, E.K.; Bongiorno, G.; Bai, Z.; Creamer, R.E.; De Deyn, G.; de Goede, R.; Fleskens, L.; Geissen, V.; Kuyper, T.W.; Mäder, P.; et al. Soil quality—A critical review. Soil Biol. Biochem. 2018, 120, 105–125. [Google Scholar] [CrossRef]
  19. Juhos, K.; Czigány, S.; Madarász, B.; Ladányi, M. Interpretation of soil quality indicators for land suitability assessment—A multivariate approach for Central European arable soils. Ecol. Indic. 2019, 99, 261–272. [Google Scholar] [CrossRef]
  20. Chen, J.; Qu, M.; Zhang, J.; Xie, E.; Huang, B.; Zhao, Y. Soil fertility quality assessment based on geographically weighted principal component analysis (GWPCA) in large-scale areas. Catena 2021, 201, 105197. [Google Scholar] [CrossRef]
  21. Vasu, D.; Singh, S.K.; Ray, S.K.; Duraisami, V.P.; Tiwary, P.; Chandran, P.; Nimkar, A.M.; Anantwar, S.G. Soil quality index (SQI) as a tool to evaluate crop productivity in semi-arid Deccan plateau, India. Geoderma 2016, 282, 70–79. [Google Scholar] [CrossRef]
  22. Andrés-Abellán, M.; Wic-Baena, C.; López-Serrano, F.R.; García-Morote, F.A.; Martínez-García, E.; Picazo, M.I.; Rubio, E.; Moreno-Ortego, J.L.; Bastida-López, F.; García-Izquierdo, C. A soil-quality index for soil from Mediterranean forests. Eur. J. Soil Sci. 2019, 70, 1001–1011. [Google Scholar] [CrossRef]
  23. Calzolari, C.; Ungaro, F.; Filippi, N.; Guermandi, M.; Malucelli, F.; Marchi, N.; Staffilani, F.; Tarocco, P. A methodological framework to assess the multiple contributions of soils to ecosystem services delivery at regional scale. Geoderma 2016, 261, 190–203. [Google Scholar] [CrossRef]
  24. Lam, S.K.; Chen, D.; Norton, R.; Armstrong, R.; Mosier, A.R. Nitrogen dynamics in grain crop and legume pasture systems under elevated atmospheric carbon dioxide concentration: A meta-analysis. Glob. Chang. Biol. 2012, 18, 2853–2859. [Google Scholar] [CrossRef]
  25. Roy, A.K.; Wagner-Riddle, C.; Deen, B.; Lauzon, J.; Bruulsema, T. Nitrogen application rate, timing and history effects on nitrous oxide emissions from corn (Zea mays L.). Can. J. Soil Sci. 2014, 94, 563–573. [Google Scholar] [CrossRef] [Green Version]
  26. Gregorich, E.; Janzenx, H.H.; Helgason, B.; Ellert, B. Nitrogenous Gas Emissions from Soils and Greenhouse Gas Effects. Adv. Agron. 2015, 132, 39–74. [Google Scholar] [CrossRef]
  27. Guan, Q.; Wang, F.; Xu, C.; Pan, N.; Lin, J.; Zhao, R.; Yang, Y.; Luo, H. Source apportionment of heavy metals in agricultural soil based on PMF: A case study in Hexi Corridor, northwest China. Chemosphere 2018, 193, 189–197. [Google Scholar] [CrossRef]
  28. Yang, C.; Fan, Z.; Chai, Q. Agronomic and Economic Benefits of Pea/Maize Intercropping Systems in Relation to N Fertilizer and Maize Density. Agronomy 2018, 8, 52. [Google Scholar] [CrossRef] [Green Version]
  29. Chukwudi, U.P.; Kutu, F.R.; Mavengahama, S. Influence of Heat Stress, Variations in Soil Type, and Soil Amendment on the Growth of Three Drought–Tolerant Maize Varieties. Agronomy 2021, 11, 1485. [Google Scholar] [CrossRef]
  30. Widowati; Sutoyo; Karamina, H.; Fikrinda, W. Soil amendment impact to soil organic matter and physical properties on the three soil types after second corn cultivation. AIMS Agric. Food 2020, 5, 150–168. [Google Scholar] [CrossRef]
  31. Fang, J.; Su, Y. Effects of Soils and Irrigation Volume on Maize Yield, Irrigation Water Productivity, and Nitrogen Uptake. Sci. Rep. 2019, 9, 1–11. [Google Scholar] [CrossRef]
  32. Van Es, H.M.; Yang, C.L.; Geohring, L.D. Maize Nitrogen Response as Affected by Soil Type and Drainage Variability. Precis. Agric. 2005, 6, 281–295. [Google Scholar] [CrossRef]
  33. Akinyele, B.O.; Adigun, A.B. Soil Texture and the Phenotypic Expression of Maize (Zea mays L.). Res. J. Bot. 2006, 1, 139–143. [Google Scholar] [CrossRef]
  34. Kwon, S.J.; Kim, H.R.; Roy, S.K.; Kim, H.J.; Boo, H.O.; Woo, S.H.; Kim, H.H. Effects of Nitrogen, Phosphorus and Potassium Fertilizers on Growth Characteristics of Two Species of Bellflower (Platycodon grandiflorum). J. Crop Sci. Biotechnol. 2019, 22, 481–487. [Google Scholar] [CrossRef]
  35. Liu, C.A.; Jin, S.L.; Zhou, L.M.; Jia, Y.; Li, F.M.; Xiong, Y.C.; Li, X.G. Effects of plastic film mulch and tillage on maize productivity and soil parameters. Eur. J. Agron. 2009, 31, 241–249. [Google Scholar] [CrossRef]
  36. Zhang, S.; Lövdahl, L.; Grip, H.; Tong, Y.; Yang, X.; Wang, Q. Effects of mulching and catch cropping on soil temperature, soil moisture and wheat yield on the Loess Plateau of China. Soil Tillage Res. 2009, 102, 78–86. [Google Scholar] [CrossRef]
  37. Zhang, W.; Xu, M.; Wang, B.; Wang, X. Soil organic carbon, total nitrogen and grain yields under long-term fertilizations in the upland red soil of southern China. Nutr. Cycl. Agroecosystems 2008, 84, 59–69. [Google Scholar] [CrossRef]
  38. Zhang, Y.; Han, H.; Zhang, D.; Li, J.; Gong, X.; Feng, B.; Xue, Z.; Yang, P. Effects of ridging and mulching combined practices on proso millet growth and yield in semi-arid regions of China. Field Crop. Res. 2017, 213, 65–74. [Google Scholar] [CrossRef]
  39. Zhang, Z.; Whish, J.P.M.; Bell, L.W.; Nan, Z. Forage production, quality and water-use-efficiency of four warm-season annual crops at three sowing times in the Loess Plateau region of China. Eur. J. Agron. 2017, 84, 84–94. [Google Scholar] [CrossRef]
  40. Wang, Y.; Wang, C.; Zhang, Q. Synergistic effects of climatic factors and drought on maize yield in the east of Northwest China against the background of climate change. Theor. Appl. Climatol. 2021, 143, 1017–1033. [Google Scholar] [CrossRef]
  41. Fang, L.; Xinju, L.; Le, H.; Anran, S. A long-term study on the soil reconstruction process of reclaimed land by coal gangue filling. Catena 2020, 195, 104874. [Google Scholar] [CrossRef]
  42. Zhang, K.; Xu, L.J.; Huang, G.D.; Meng, X.Y.; Yao, J.X.; Jiang, B.X. Coupled variations of soil temperature and moisture in reclaimed fields filled with coal gangue of different grain size distributions. J. Soils Sediments 2020, 20, 2248–2259. [Google Scholar] [CrossRef]
  43. Liu, L.W. Formation and evolution of Vertisols in Huaibei Plain. Pedosphere 1991, 1, 3–15. (In Chinese) [Google Scholar]
  44. Liu, J.; Wu, L.; Chen, D.; Yu, Z.; Wei, C. Development of a soil quality index for Camellia oleifera forestland yield under three different parent materials in Southern China. Soil Tillage Res. 2018, 176, 45–50. [Google Scholar] [CrossRef]
  45. Tian, Y.; Xin, J.; Ren, Y. NY/T 1121.2-2006: Soil Testing Part 2: Method for Determination of Soil pH; Ministry of Agriculture and Rural Affairs of the People’s Republic of China: Beijing, China, 2006.
  46. Zhou, F.; Zhang, W.; Yang, G. LY/T1251-1999: Analysis Methods of Water Soluble Salts of Forest Soil; National Forestry and Grassland Administration: Beijing, China, 1999.
  47. Ren, Y.; Xin, J.; Tian, Y. NY/T1121.6-2006: Soil Testing Part 6: Method for Determination of Soil Organic Matter; Ministry of Agriculture and Rural Affairs of the People’s Republic of China: Beijing, China, 2006.
  48. Jiao, R.; Dong, Y.; Sun, Q. LY/T 1228-2015: Nitrogen Determination Methods of Forest Soils; National Forestry and Grassland Administration: Beijing, China, 2015.
  49. Jiao, R.; Dong, Y.; Sun, Q. LY/T 1232-2015: Phosphorus Determination Methods of Forest Soils; National Forestry and Grassland Administration: Beijing, China, 2015.
  50. Jiao, R.; Dong, Y.; Sun, Q. LY/T 1234-2015: Potassium Determination Methods of Forest Soils; National Forestry and Grassland Administration: Beijing, China, 2015.
  51. Raiesi, F. A minimum data set and soil quality index to quantify the effect of land use conversion on soil quality and degradation in native rangelands of upland arid and semiarid regions. Ecol. Indic. 2017, 75, 307–320. [Google Scholar] [CrossRef]
  52. Brejda, J.J.; Moorman, T.B.; Karlen, D.L.; Dao, T.H. Identification of Regional Soil Quality Factors and Indicators I. Central and Southern High Plains. Soil Sci. Soc. Am. J. 2000, 64, 2115–2124. [Google Scholar] [CrossRef]
  53. Zuber, S.M.; Behnke, G.D.; Nafziger, E.D.; Villamil, M.B. Multivariate assessment of soil quality indicators for crop rotation and tillage in Illinois. Soil Tillage Res. 2017, 174, 147–155. [Google Scholar] [CrossRef]
  54. Ilarslan, R.; Kaya, Z.; Kandemir, I.; Bretting, P.K. Genetic variability among Turkish pop, flint and dent corn (Zea mays L. spp. mays) races: Morphological and agronomic traits. Euphytica 2002, 128, 173–182. [Google Scholar] [CrossRef]
  55. Andrews, S.S.; Karlen, D.L.; Mitchell, J.P. A comparison of soil quality indexing methods for vegetable production systems in Northern California. Agric. Ecosyst. Environ. 2002, 90, 25–45. [Google Scholar] [CrossRef]
  56. Wang, L.; Wang, F.; Wang, S.; Huang, Y.; Zhang, Z.; Bai, Z.; Cao, Y. Analysis of differences in chemical properties of reconstructed soil under different proportions of topsoil substitute materials. Environ. Sci. Pollut. Res. 2021, 28, 31230–31245. [Google Scholar] [CrossRef]
  57. Andrews, S.S.; Karlen, D.L.; Cambardella, C.A. The Soil Management Assessment Framework. Soil Sci. Soc. Am. J. 2004, 68, 1945–1962. [Google Scholar] [CrossRef]
  58. Navas, M.; Benito, M.; Rodríguez, I.; Masaguer, A. Effect of five forage legume covers on soil quality at the Eastern plains of Venezuela. Appl. Soil Ecol. 2011, 49, 242–249. [Google Scholar] [CrossRef]
  59. Li, Y.; Dong, S.; Wen, L.; Wang, X.; Wu, Y. Assessing the soil quality of alpine grasslands in the Qinghai-Tibetan Plateau using a modified soil quality index. Environ. Monit. Assess. 2013, 185, 8011–8022. [Google Scholar] [CrossRef] [PubMed]
  60. Zhang, G.; Bai, J.; Xi, M.; Zhao, Q.; Lu, Q.; Jia, J. Soil quality assessment of coastal wetlands in the Yellow River Delta of China based on the minimum data set. Ecol. Indic. 2016, 66, 458–466. [Google Scholar] [CrossRef] [Green Version]
  61. Wang, Z.; Chang, A.C.; Wu, L.; Crowley, D. Assessing the soil quality of long-term reclaimed wastewater-irrigated cropland. Geoderma 2003, 114, 261–278. [Google Scholar] [CrossRef]
  62. Mandal, U.K.; Warrington, D.N.; Bhardwaj, A.K.; Bar-Tal, A.; Kautsky, L.; Minz, D.; Levy, G.J. Evaluating impact of irrigation water quality on a calcareous clay soil using principal component analysis. Geoderma 2008, 144, 189–197. [Google Scholar] [CrossRef]
  63. Yao, R.J.; Yang, J.S.; Zhang, T.J.; Gao, P.; Yu, S.P.; Wang, X.P. Short-term effect of cultivation and crop rotation systems on soil quality indicators in a coastal newly reclaimed farming area. J. Soils Sediments 2013, 13, 1335–1350. [Google Scholar] [CrossRef]
  64. Liebig, M.A.; Varvel, G.; Doran, J. A simple performance-based index for assessing multiple agroecosystem functions. Agron. J. 2001, 93, 313–318. [Google Scholar] [CrossRef] [Green Version]
  65. Masto, R.E.; Chhonkar, P.K.; Singh, D.; Patra, A.K. Alternative soil quality indices for evaluating the effect of intensive cropping, fertilisation and manuring for 31 years in the semi-arid soils of India. Environ. Monit. Assess. 2008, 136, 419–435. [Google Scholar] [CrossRef]
  66. Bhardwaj, A.K.; Jasrotia, P.; Hamilton, S.K.; Robertson, G.P. Ecological management of intensively cropped agro-ecosystems improves soil quality with sustained productivity. Agric. Ecosyst. Environ. 2011, 140, 419–429. [Google Scholar] [CrossRef]
  67. Vinhal-Freitas, I.C.; Corrêa, G.F.; Wendling, B.; Bobuľská, L.; Ferreira, A.S. Soil textural class plays a major role in evaluating the effects of land use on soil quality indicators. Ecol. Indic. 2017, 74, 182–190. [Google Scholar] [CrossRef]
  68. Raiesi, F.; Kabiri, V. Identification of soil quality indicators for assessing the effect of different tillage practices through a soil quality index in a semi-arid environment. Ecol. Indic. 2016, 71, 198–207. [Google Scholar] [CrossRef]
  69. Wang, X.; Zhao, Y.; Liu, H.; Xiao, W.; Chen, S. Evaluating the water holding capacity of multilayer soil profiles using hydrus-1d and multi-criteria decision analysis. Water 2020, 12, 773. [Google Scholar] [CrossRef]
  70. Wang, Y.; Li, Y.; Wang, X.; Chau, H.W. Finger Flow Development in Layered Water-Repellent Soils. Vadose Zone J. 2018, 17, 170171. [Google Scholar] [CrossRef] [Green Version]
  71. Beibei, Z.; Ming’An, S.; Mingxia, W.; Quanjiu, W.; Horton, R. Effects of coal gangue content on water movement and solute transport in a China Loess plateau soil. Clean Soil Air Water 2010, 38, 1031–1038. [Google Scholar] [CrossRef]
  72. Nabiollahi, K.; Taghizadeh-Mehrjardi, R.; Kerry, R.; Moradian, S. Assessment of soil quality indices for salt-affected agricultural land in Kurdistan Province, Iran. Ecol. Indic. 2017, 83, 482–494. [Google Scholar] [CrossRef]
  73. Biswas, S.; Hazra, G.C.; Purakayastha, T.J.; Saha, N.; Mitran, T.; Singha Roy, S.; Basak, N.; Mandal, B. Establishment of critical limits of indicators and indices of soil quality in rice-rice cropping systems under different soil orders. Geoderma 2017, 292, 34–48. [Google Scholar] [CrossRef]
  74. An, N.; Wei, W.; Qiao, L.; Zhang, F.; Christie, P.; Jiang, R.; Dobermann, A.; Goulding, K.W.T.; Fan, J.; Fan, M. Agronomic and environmental causes of yield and nitrogen use efficiency gaps in Chinese rice farming systems. Eur. J. Agron. 2018, 93, 40–49. [Google Scholar] [CrossRef]
  75. Singh, V.K.; Kumar, D.; Kashyap, P.S.; Singh, P.K.; Kumar, A.; Singh, S.K. Modelling of soil permeability using different data driven algorithms based on physical properties of soil. J. Hydrol. 2020, 580, 124223. [Google Scholar] [CrossRef]
Figure 1. The location of the experiment site (a) and schematic diagram of different profiles in the field experiment (b).
Land 10 01307 g001
Figure 2. The design of the multi-layered profiles.
Land 10 01307 g002
Figure 3. The pH of soil or coal gangue in different depths with different profile configurations.
Land 10 01307 g003
Figure 4. Surface soil properties of different profile configurations.
Land 10 01307 g004
Figure 5. SQI of layer H1 in different profile configurations.
Land 10 01307 g005
Figure 6. The linear relationships between the SQI (based on MDS, TDS).
Land 10 01307 g006
Figure 7. Normalized values of measured maize agronomic traits.
Land 10 01307 g007
Figure 8. Correlation between maize agronomic traits and H1 soil properties.
Land 10 01307 g008
Table 1. Selected chemical and physical properties of aboriginal soil, and coal gangue.
PropertiesTexturepHSOM
(g/kg)
TN
(g/kg)
AN
(mg/kg)
TP
(g/kg)
AP
(mg/kg)
TK
(g/kg)
AK
(mg/kg)
Sand (%)Silt
(%)
Clay
(%)
Topsoil8.3573.9817.677.626.990.7112.560.160.88241.127.93
Subsoil9.1174.1416.757.675.080.6013.210.151.46247.2846.31
Coal gangueGravel10.0482.718.471.251.2513.2313.23352.32
Table 2. Principal component analysis of properties.
PC1PC2PC3
Eigenvalue6.482.111.08
Variance (%)58.8819.189.77
Cumulative (%)58.8878.0687.83
VariableComponent Correlation Scores
pH−0.37 0.85−0.08
SM (%)0.11 0.20 0.96
EC (us/cm)−0.71 0.63−0.15
TS (g/kg)−0.67 0.67−0.12
SOM (g/kg)0.940.02 −0.09
TN (g/kg)0.920.21 −0.15
AN (mg/kg)0.940.03 −0.15
TP (g/kg)0.71 0.54 0.15
AP (mg/kg)0.910.15 −0.17
TK (g/kg)0.74 0.29 0.11
AK (mg/kg)0.930.23 0.01
The variable corresponding to the bold value is selective further due to its relative high scores.
Table 3. Correlations matrix for measured soil variables across the study depths (0–30 cm layer) and sites (n = 24).
VariablepHSMECTSSOMTNANTPAPTKAK
pH
SM0.067
EC0.749 **−0.074
TS0.770 **−0.0520.909 **
SOM−0.332 *0.036−0.600 **−0.600 **
TN−0.1300.028−0.485 **−0.478 **0.876 **
AN−0.280−0.020−0.618 **−0.588 **0.887 **0.899 **
TP0.1200.287 *−0.159−0.1700.659 **0.729 **0.607 **
AP−0.2090.002−0.510 **−0.481 **0.875 **0.909 **0.861 **0.685 **
TK−0.0440.180−0.423 **−0.2460.677 **0.637 **0.694 **0.628 **0.619 **
AK−0.1450.152−0.539 **−0.462 **0.863 **0.915 **0.850 **0.781 **0.890 **0.715 **
** Correlation is extremely significant at p < 0.01 (2-tailed); *, correlation is significant at p < 0.05 (2-tailed).
Table 4. Statistical description and weighting of MDS soil properties.
Soil PropertiesMinimumMaximumMeanOptimumWeight
pH 7.217.837.51 7.40.250
SM (%)23.4627.5125.33 25.370.274
EC (us/cm)60.55121.0690.79 630.284
SOM (g/kg)3.746.364.97 6.260.192
Publisher’s Note: MDPI stays neutral with regard to jurisdictional claims in published maps and institutional affiliations.

