
Effect of Urban-Rural Income Gap on the Population Peri-Urbanization Rate in China


Abstract
:1. Introduction
2. Materials and Methods
2.1. Materials
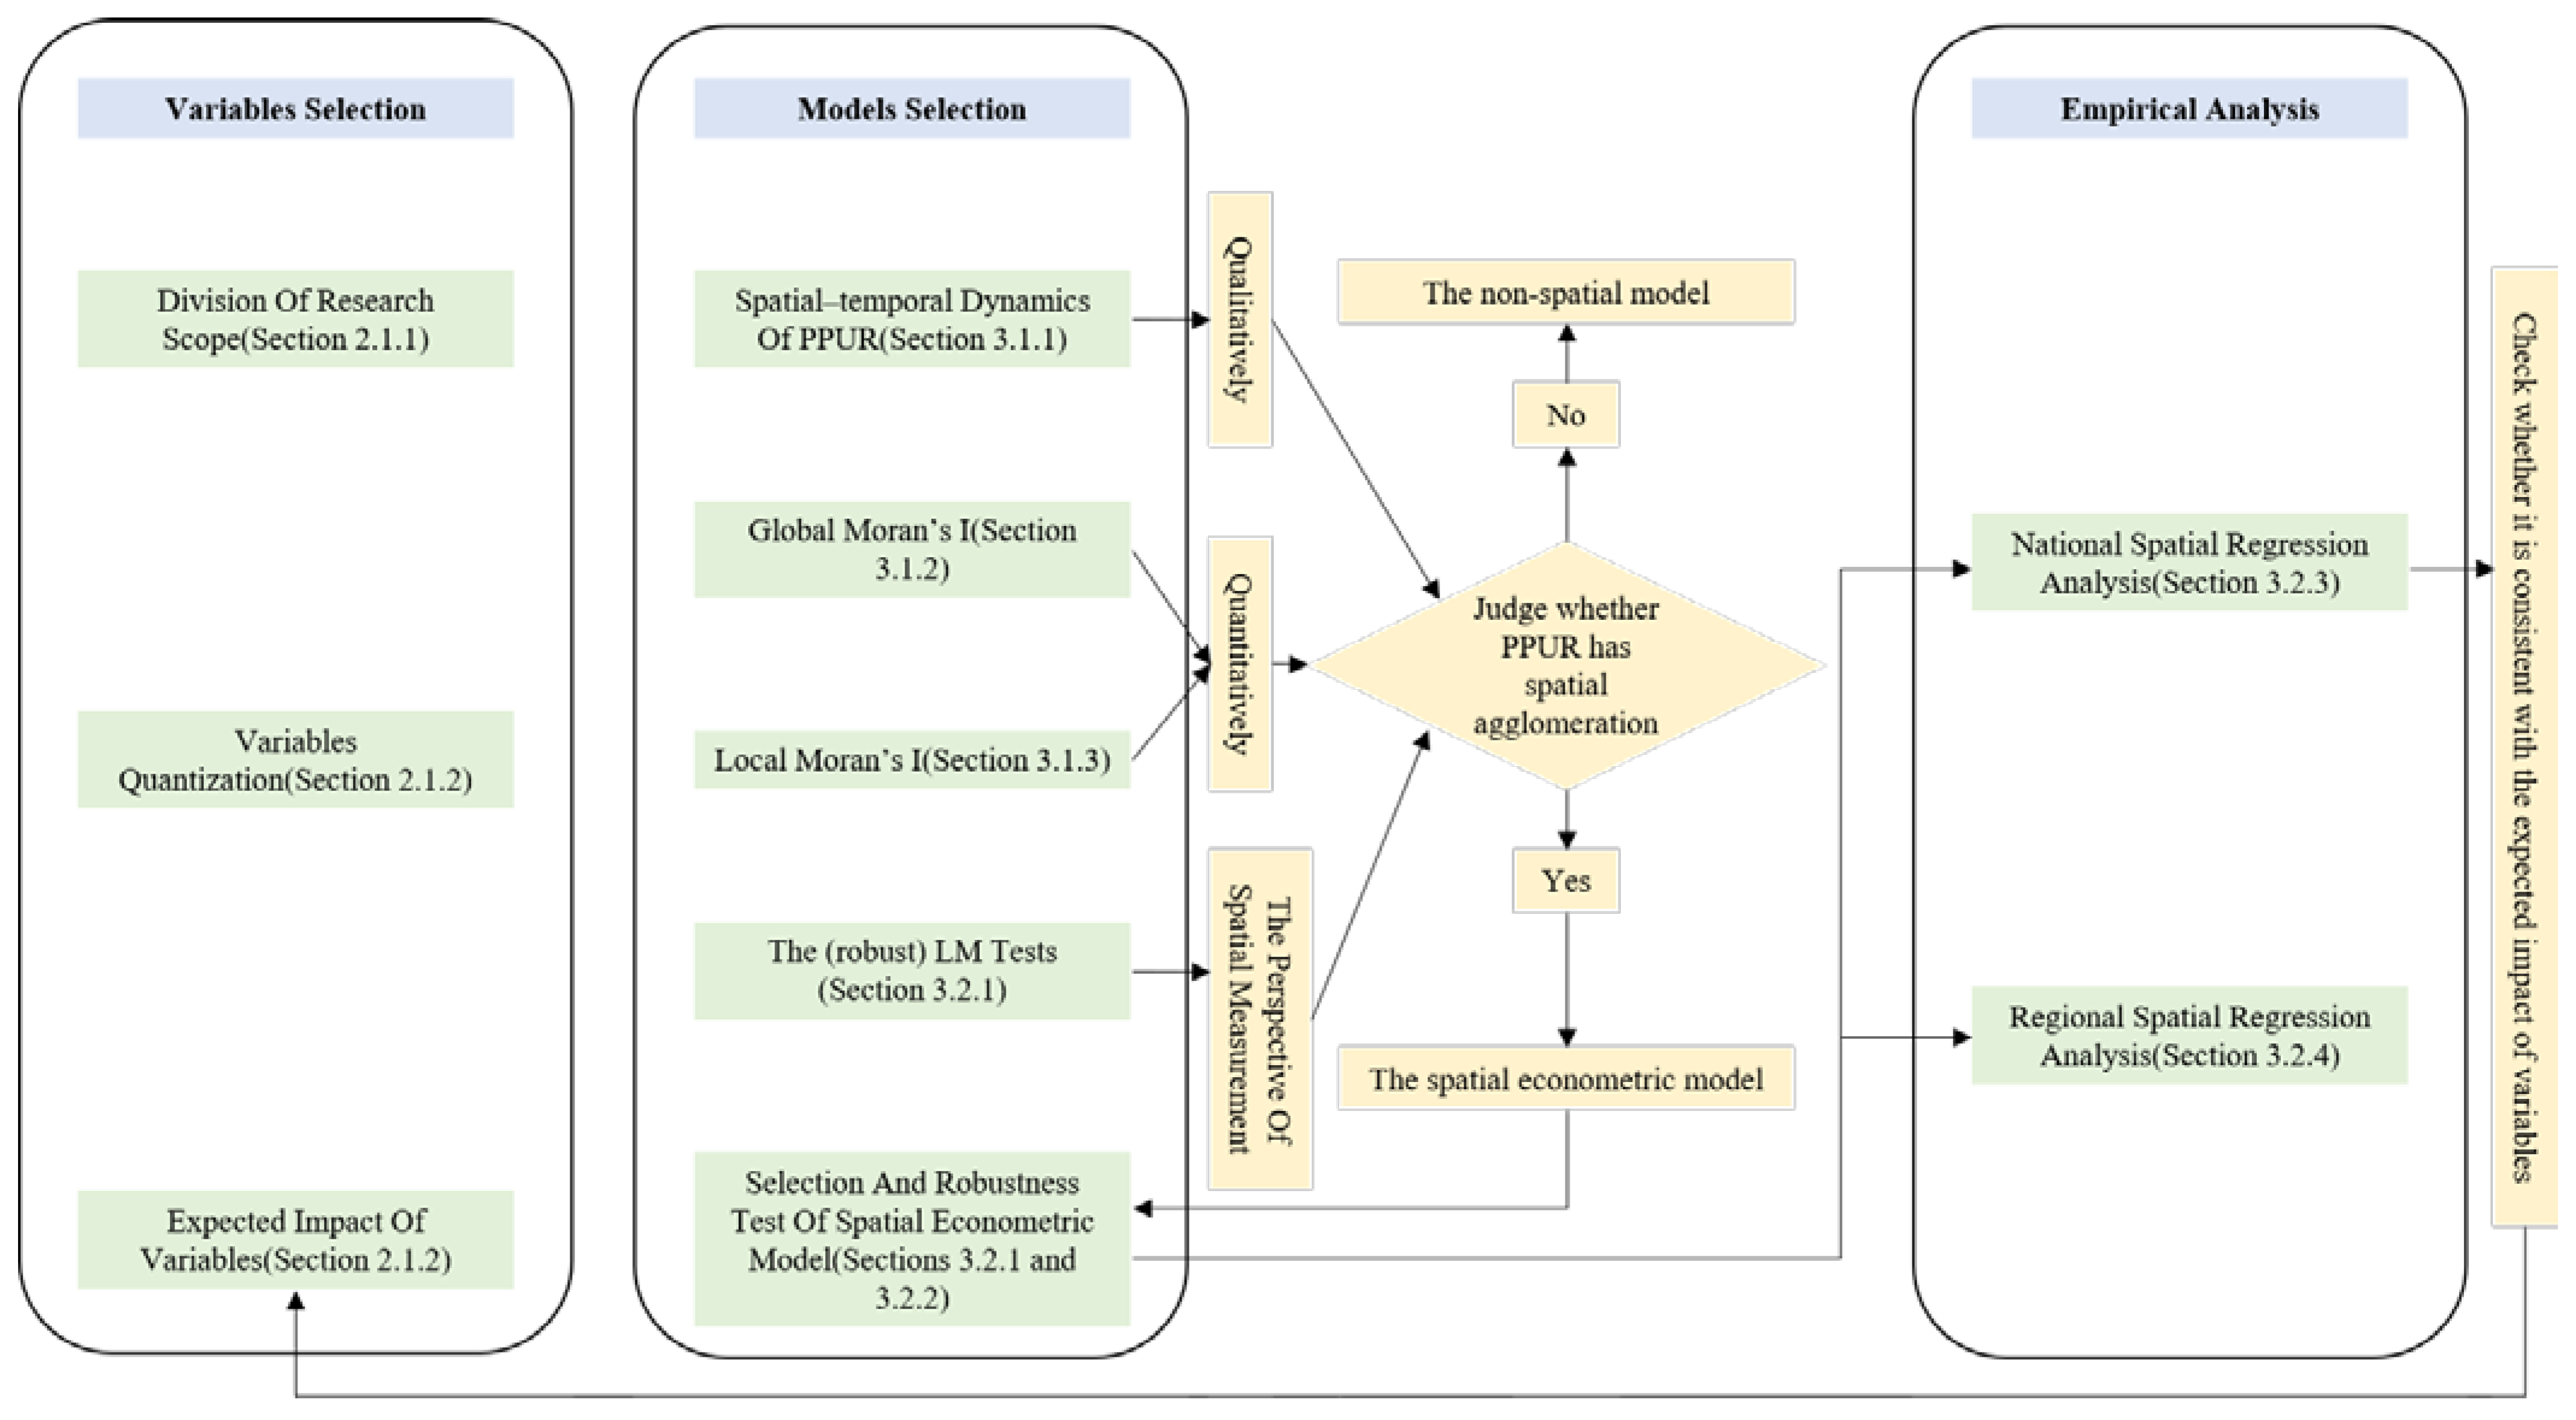
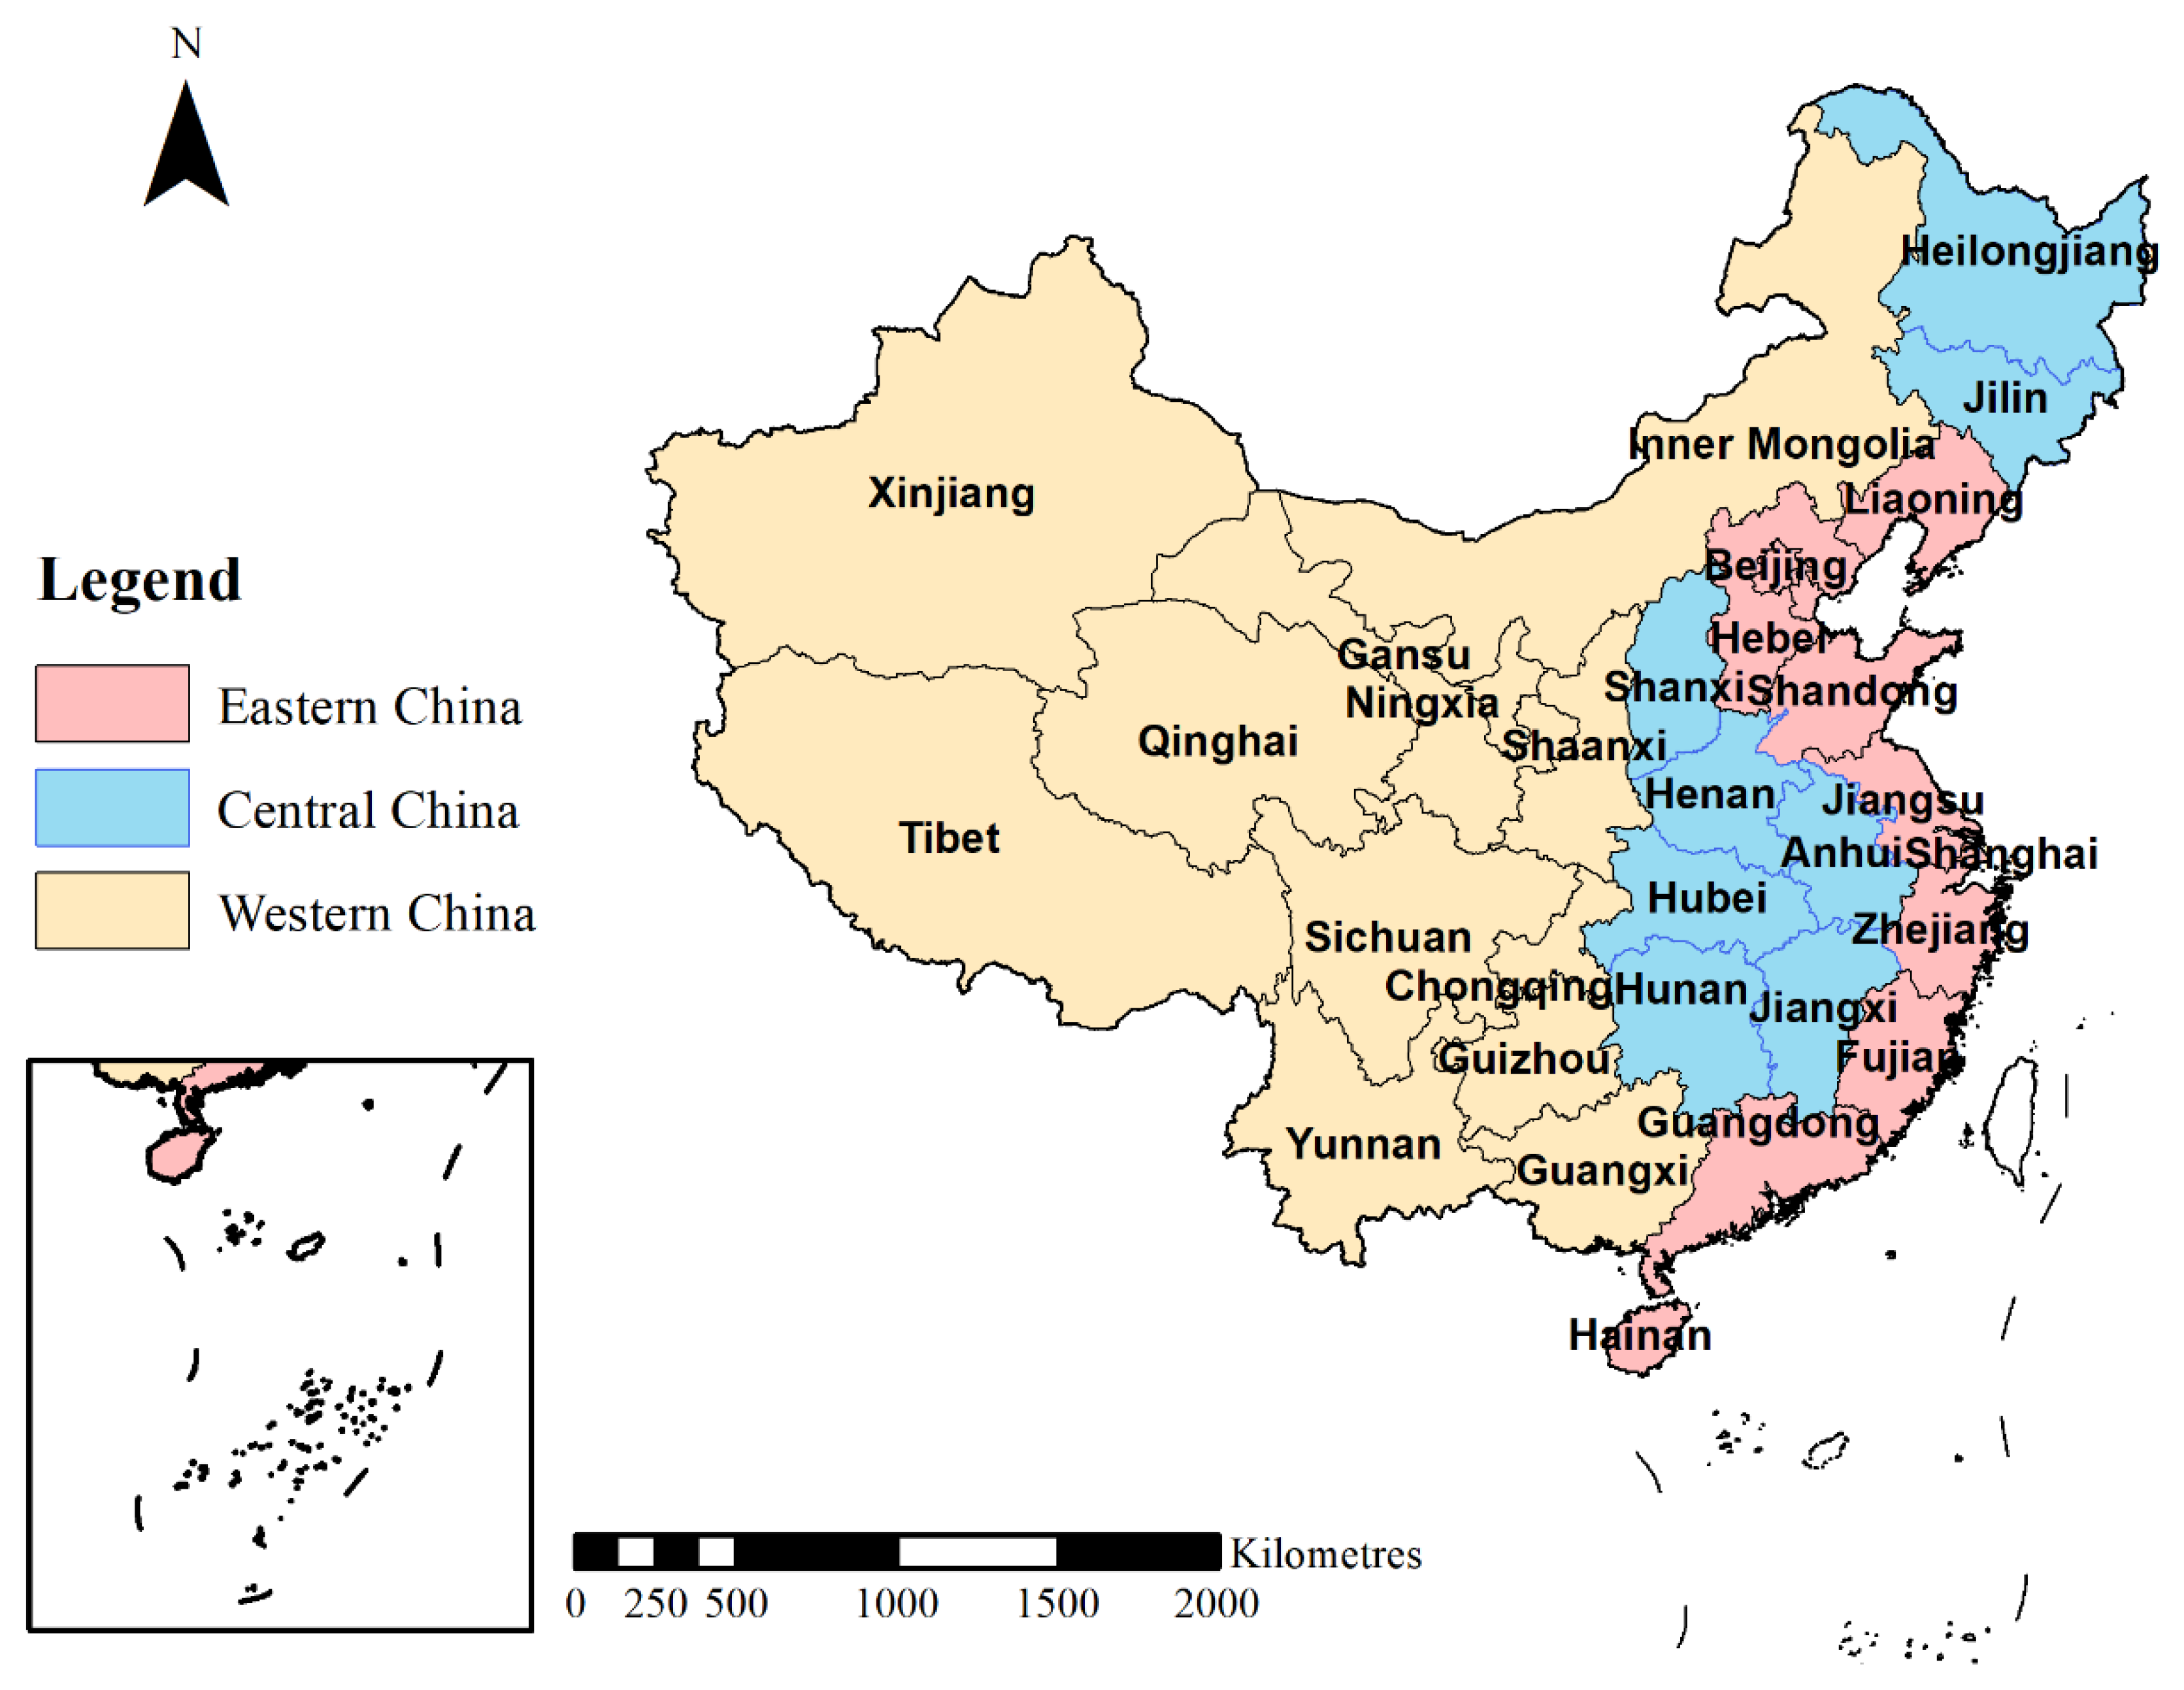
2.1.1. Research Framework and Study Area
2.1.2. Variable Selection
2.1.3. Variable Descriptive Statistics
2.2. Methods
2.2.1. Global Moran’s I
2.2.2. Local Moran’s I
2.2.3. Spatial Weight Matrix
2.2.4. Spatial Econometric Models
3. Results
3.1. Exploratory Data Analysis
3.1.1. Spatial–Temporal Dynamics of PPUR
3.1.2. Global Autocorrelation Analysis
3.1.3. Local Autocorrelation Analysis
3.2. Driving Force Analysis Based on URIG
3.2.1. Non-spatial Regression Model Analysis
3.2.2. Robustness Test
3.2.3. Comparative Analysis of Direct and Indirect Effects
3.2.4. Regional Spatial Regression Analysis
4. Discussion
4.1. The Nationwide Influence of URIG and Other Factors
4.2. Spatial Differences amongst Regions
4.3. Policy Implications
4.4. Contributions, Limitations, and Future Research
5. Conclusions
Author Contributions
Funding
Data Availability Statement
Conflicts of Interest
References
- Statistical Yearbook of China. Statistical Bulletin of National Economic and Social Development of the People’s Republic of China in 2019; National Bureau of Statistics: 2020. Available online: http://www.stats.gov.cn/tjsj/zxfb/202002/t20200228_1728913.html (accessed on 22 January 2021).
- Lu, J.; Li, B.; Li, H. The influence of land finance and public service supply on peri-urbanization: Evidence from the counties in China. Habitat Int. 2019, 92, 13. [Google Scholar] [CrossRef]
- Liu, X.; Cao, G.; Liu, T.; Liu, H. Semi-urbanization and evolving patterns of urbanization in China: Insights from the 2000 to 2010 national censuses. J. Geogr. Sci. 2016, 26, 1626–1642. [Google Scholar] [CrossRef]
- Saunders, D. Arrival City; Pantheon Books: New York, NY, USA, 2010. [Google Scholar]
- Chen, M.X.; Liu, W.D.; Lu, D.D.; Chen, H.; Ye, C. Progress of China’s new-type urbanization construction since 2014: A preliminary assessment. Cities 2018, 78, 180–193. [Google Scholar] [CrossRef]
- Chen, M.X.; Liu, W.D.; Lu, D.D. Challenges and the way forward in China’s new-type urbanization. Land Use Policy 2016, 55, 334–339. [Google Scholar] [CrossRef]
- Gottmann, J. Megalopolis or the urbanization of the northeastern Seaboard. Econ. Geogr. 1957, 33, 189. [Google Scholar] [CrossRef]
- McGee, T.G. The Emergence of Desakota Regions in Asia: Expanding a Hypothesis; University of Hawail Press: Honolulu, HI, USA, 1991. [Google Scholar]
- Phillips, D.; Williams, K.; Smith, D. Literature Review on Peri-Urban Natural Resource Conceptualisation and Management Approaches; University of Nottingham: Nottingham, UK; University of Liverpoo: Liverpool, UK, 1999. [Google Scholar]
- Webster, D.; Muller, L. Challenges of Peri-Urbanization in the Lower Yangtze Region: The Case of the Hangzhou-Ningbo Corridor; Asia/Pacific Research Center, Stanford University: Stanford, CA, USA, 2002. [Google Scholar]
- Webster, D. On the Edge: Shaping the Future of Peri-urban East Asia; Asia/Pacific Research Center, Stanford University: Stanford, CA, USA, 2002. [Google Scholar]
- Webster, D.; Cai, J.; Muller, L.; Luo, B. Emerging Third Stage Peri-Urbanization Functional Specialization in the Hangzhou Peri-Urban Region; Asia-Pacific Research Center, Stanford University: Stanford, CA, USA, 2003. [Google Scholar]
- Zhu, J.; Hu, T. Disordered Land Rent Competition in China’s Peri-urbanization. Soc. Sci. Electron. Publ. 2008, 41, 1–28. [Google Scholar] [CrossRef]
- Tian, L. Land use dynamics driven by rural industrialization and land finance in the pen-urban areas of China: “The examples of Jiangyin and Shunde”. Land Use Policy 2015, 45, 117–127. [Google Scholar] [CrossRef]
- Tian, L.; Ge, B.; Li, Y. Impacts of state-led and bottom-up urbanization on land use change in the peri-urban areas of Shanghai: Planned growth or uncontrolled sprawl? Cities 2017, 60, 476–486. [Google Scholar] [CrossRef]
- Wang, C. A Study of Floating Rural People’s “Semi-urbanization”. Sociol. Stud. 2006, 5, 107–122+244. (In Chinese) [Google Scholar]
- Kontgis, C.; Schneider, A.; Fox, J.; Saksena, S.; Spencer, J.H.; Castrence, M. Monitoring peri-urbanization in the greater Ho Chi Minh City metropolitan area. Appl. Geogr. 2014, 53, 377–388. [Google Scholar] [CrossRef]
- Hao, L. Cumulative Causation of Rural Migration and Initial Peri-Urbanization in China. Chin. Sociol. Rev. 2012, 44, 6–33. [Google Scholar] [CrossRef] [Green Version]
- An, H.; Pi, Y. Research on peri-urbanization and population urbanization. Rev. Econ. Manag. 2013, 3, 5–10. (In Chinese) [Google Scholar]
- Ji, M.; Zhong, M. Influence of Farmers’ Income on Semi-Urbanization Rate—Based on SDM. J. Soc. Sci. 2018, 6, 39–51. (In Chinese) [Google Scholar]
- Zhou, T.; Jiang, G.H.; Zhang, R.J.; Zheng, Q.Y.; Ma, W.Q.; Zhao, Q.L.; Li, Y.L. Addressing the rural in situ urbanization (RISU) in the Beijing-Tianjin-Hebei region: Spatio-temporal pattern and driving mechanism. Cities 2018, 75, 59–71. [Google Scholar] [CrossRef]
- Chen, Y.; Luo, P.; Chang, T. Urbanization and the Urban-Rural Income Gap in China: A Continuous Wavelet Coherency Analysis. Sustainability 2020, 12, 8261. [Google Scholar] [CrossRef]
- Tan, C. Introduction to Development Economics; Wuhan University Press: Wuhan, China, 2008. (In Chinese) [Google Scholar]
- National Bureau of Statistics of China. Statistical Bulletin of National Economic and Social Development of the People’s Republic of China in 2020; National Bureau of Statistics: Beijing, China, 2021. Available online: http://www.stats.gov.cn/tjsj/zxfb/202102/t20210227_1814154.html (accessed on 26 October 2021).
- Han, J.; Miao, J.; Shi, Y.; Miao, Z. Can the semi-urbanization of population promote or inhibit the improvement of energy efficiency in China? Sustain. Prod. Consum. 2021, 26, 921–932. [Google Scholar] [CrossRef]
- Zeng, C.; Zhang, A.; Xu, S. Urbanization and administrative restructuring: A case study on the Wuhan urban agglomeration. Habitat Int. 2016, 55, 46–57. [Google Scholar] [CrossRef]
- Ye, C.H.; Sun, C.W.; Chen, L.T. New evidence for the impact of financial agglomeration on urbanization from a spatial econometrics analysis. J. Clean. Prod. 2018, 200, 65–73. [Google Scholar] [CrossRef]
- Elhorst, J.P. Applied Spatial Econometrics: Raising the Bar. Spat. Econ. Anal. 2010, 5, 9–28. [Google Scholar] [CrossRef]
- Elhorst, J.P. Matlab Software for Spatial Panels. Int. Reg. Sci. Rev. 2014, 37, 389–405. [Google Scholar] [CrossRef] [Green Version]
- Lesage, J.; Pace, R.K. Introduction to Spatial Econometrics; Chapman and Hall/CRC: Boca Raton, FL, USA, 2009. [Google Scholar]
- Wooldridge, J.M. Introduction to Econometrics; Renmin University Press of China: Beijing, China, 2010; p. 825. (In Chinese) [Google Scholar]
- Lu, H.; Xie, H.; Yao, G. Impact of land fragmentation on marginal productivity of agricultural labor and non-agricultural labor supply: A case study of Jiangsu, China. Habitat Int. 2018, 83, 65–72. [Google Scholar] [CrossRef]
- Wang, X.R.; Hui EC, M.; Sun, J.X. Population migration, urbanization and housing prices: Evidence from the cities in China. Habitat Int. 2017, 66, 49–56. [Google Scholar] [CrossRef]
- Chen, C.; Zhao, M. The undermining of rural labor out-migration by household strategies in China’s migrant-sending areas: The case of Nanyang, Henan Province. Cities 2017, 60, 446–453. [Google Scholar] [CrossRef]
- Mohabir, N.; Jiang, Y.; Ma, R. Chinese floating migrants: Rural-urban migrant labourers’ intentions to stay or return. Habitat Int. 2017, 60, 101–110. [Google Scholar] [CrossRef]
- Wu, X.; Treiman, D.J. The household registration system and social stratification in China: 1955–1996. Demography 2004, 41, 363–384. [Google Scholar] [CrossRef] [PubMed] [Green Version]


| Variables | Descriptions | Definitions | Data Sources | Expected Influence |
|---|---|---|---|---|
| URPP | Urbanization rate of permanent population | (urban permanent population/the total urban and rural population) * 100% | China Statistical Yearbook | |
| URHRP | Urbanization rate of household registration population | (local urban household registration population/the total urban and rural population) * 100% | China Population Statistics Yearbook China Population and Employment Statistics Yearbook | |
| PPUR | An indicator of peri-urbanization from the perspective of demography | URPP-URHRP | ||
| URIG | An indicator to measure the income gap between urban and rural areas | per capita disposable income of urban households/per capita net income of rural households | China Statistical Yearbook | positive |
| NS | An indicator that indicates the proportion of the industrial structure of a region | the output values of the secondary and tertiary industries/GDP | China Statistical Yearbook | positive |
| AF | An indicator to measure job opportunities | the total fixed capital formation/GDP | China Statistical Yearbook | positive |
| FS | An indicator to measure the carrying capacity of the city | per capita municipal road area | China Statistical Yearbook | positive |
| MR | An indicator to measure the cost of living | the number of beds per 1000 population medical institutions | China Statistical Yearbook | positive |
| HJ | An indicator to measure the degree of control of household registration system | the city’s annual change of naturalized population/the number of new subscribers of mobile telephones | China City Statistical Yearbook | negative |
| LAND | An indicator to measure the level of land urbanization | built-up area of municipal district/area of municipal district | China City Statistical Yearbook | positive |
| Variable | Unit | Obs | Mean | Std. Dev. | Min | Max |
|---|---|---|---|---|---|---|
| PPUR | % | 310 | 13.004 | 6.961 | −5.590 | 32.350 |
| URIG | — | 310 | 2.990 | 0.578 | 1.852 | 4.594 |
| NS | — | 310 | 0.884 | 0.058 | 0.664 | 0.995 |
| AF | — | 310 | 0.643 | 0.197 | 0.093 | 1.242 |
| FS | m2/person | 310 | 12.795 | 4.019 | 4.040 | 25.770 |
| MR | beds/per 1000 people | 310 | 3.662 | 0.953 | 1.651 | 6.221 |
| HJ | — | 310 | 1.137 | 8.143 | 0.001 | 97 |
| LAND | — | 310 | 0.067 | 0.050 | 0.005 | 0.271 |
| Year | 2005 | 2006 | 2007 | 2008 | 2009 |
| Moran’s I | 0.119 * (1.806) | 0.158 ** (2.244) | 0.165 ** (2.285) | 0.184 ** (2.469) | 0.170 ** (2.282) |
| Year | 2010 | 2011 | 2012 | 2013 | 2014 |
| Moran’s I | 0.205 *** (2.703) | 0.230 *** (2.957) | 0.233 *** (2.976) | 0.233 *** (2.955) | 0.190 ** (2.476) |
| Variable | No. of Fixed Effect | Spatial Fixed Effects | Time Fixed Effects | Dual Fixed Effects |
|---|---|---|---|---|
| Intercept | −11.596 (−1.523) | -- | -- | -- |
| URIG | −1.256 (−1.517) | 2.740 *** (3.592) | −1.055 (−1.379) | 3.528 *** (4.095) |
| NS | 32.872 *** (4.171) | 30.553 *** (3.291) | 33.778 *** (4.649) | 37.347 *** (3.765) |
| AF | 12.814 *** (5.220) | 5.894 *** (4.424) | 6.202 ** (2.513) | 7.527 *** (5.317) |
| FS | 0.208 ** (2.023) | 0.130 * (1.656) | 0.016 (0.161) | 0.117 (1.496) |
| MR | −2.652 *** (−5.036) | 1.503 *** (4.512) | −5.235 *** (−8.861) | 1.605 *** (3.955) |
| HJ | −1.768 *** (−3.018) | −0.328 (−1.598) | −1.272 ** (−2.309) | −0.381 * (−1.842) |
| LAND | −21.412 ** (−2.584) | 39.071 *** (5.013) | −27.820 *** (−3.638) | 39.813 *** (5.047) |
| R-squared | 0.189 | 0.592 | 0.264 | 0.315 |
| Log likelihood | −1008.400 | −633.455 | −981.211 | −627.571 |
| LM spatial lag | 4.346 ** | 21.032 *** | 0.243 | 22.397 *** |
| Robust LM spatial lag | 0.006 | 7.684 *** | 0.005 | 4.014 ** |
| LM spatial error | 4.621 ** | 13.665 *** | 0.309 | 18.398 *** |
| Robust LM spatial error | 0.282 | 0.317 | 0.072 | 0.015 |
| LR-test joint significance | Fixed effect | Statistic | Degrees of freedom | Probability |
| Spatial fixed effects | 707.280 | 31 | 0.000 | |
| Time fixed effects | 11.767 | 10 | 0.301 |
| Test | Statistic | Probability |
|---|---|---|
| Wald spatial lag (Hypothesis 1) | 29.230 | 1.314 × 10⁻⁴ |
| Wald spatial error (Hypothesis 2) | 30.517 | 7.631 × 10⁻⁵ |
| Hausman test | 15.883 | 0.390 |
| Variable | Geographic Adjacency Matrix | Geographic Distance Matrix | Economic Distance Matrix |
|---|---|---|---|
| URIG | 3.058 *** (3.105) | 3.442 *** (4.265) | 2.958 *** (3.640) |
| NS | 32.602 *** (3.287) | 37.373 *** (3.892) | 33.820 *** (3.594) |
| AF | 7.019 *** (4.845) | 6.325 *** (4.673) | 5.801 *** (4.252) |
| FS | 0.128 (1.570) | 0.205 ** (2.529) | 0.136 * (1.719) |
| MR | 1.504 *** (2.728) | 1.426 *** (3.729) | 1.695 *** (4.185) |
| HJ | −0.311 (−1.474) | −0.336 * (−1.663) | −0.214 (−1.075) |
| LAND | 39.590 *** (4.804) | 40.268 *** (5.166) | 48.697 *** (5.783) |
| W*URIG | −2.899 * (−1.844) | −4.293 *** (−3.077) | −0.964 (−0.738) |
| W*NS | 23.974 (1.260) | −15.274 (−0.918) | −33.042 ** (−2.187) |
| W*AF | −6.751 ** (−2.520) | 3.731 (1.495) | 2.507 (1.122) |
| W*FS | 0.162 (1.028) | −0.192 (−1.380) | −0.320 ** (−2.103) |
| W*MR | −0.585 (−0.658) | −0.721 (−1.023) | 0.919 (1.447) |
| W*HJ | −0.075 (−0.167) | 0.511 (1.511) | 0.688 ** (2.242) |
| W*LAND | −4.892 (−0.351) | 11.808 (0.912) | 22.064 ** (2.028) |
| 2.7 × 10⁻⁵ (3.46 × 10⁻⁴) | −0.184 ** (−2.542) | −0.233 *** (−3.787) | |
| R-squared | 0.930 | 0.937 | 0.939 |
| N | 310 | 310 | 310 |
| Log likelihood | −628.564 | −614.832 | −611.667 |
| Variable | Effect | Geographic Adjacency Matrix | Geographic Distance Matrix | Economic Distance Matrix |
|---|---|---|---|---|
| URIG | Direct effect | 3.109 *** (3.094) | 3.696 *** (4.510) | 3.119 *** (3.631) |
| Indirect effect | −2.967 * (−1.837) | −4.418 *** (−3.439) | −1.503 (−1.214) | |
| Total | 0.142 (0.087) | −0.722 (−0.574) | 1.616 (1.479) | |
| NS | Direct effect | 33.038 *** (3.300) | 38.051 *** (3.862) | 37.975 *** (3.815) |
| Indirect effect | 24.695 (1.357) | −18.861 (−1.281) | −38.049 ** (−2.694) | |
| Total | 57.733 *** (2.807) | 19.190 (1.342) | −0.074 (−0.005) | |
| AF | Direct effect | 7.091 *** (5.022) | 6.176 *** (4.495) | 5.779 *** (4.179) |
| Indirect effect | −6.840 ** (−2.455) | 2.391 (1.073) | 1.015 (0.493) | |
| Total | 0.251 (0.089) | 8.567 *** (3.606) | 6.794 *** (3.349) | |
| FS | Direct effect | 0.122 (1.471) | 0.219 ** (2.635) | 0.170 ** (2.050) |
| Indirect effect | 0.172 (1.085) | −0.213 * (−1.713) | −0.319 ** (−2.263) | |
| Total | 0.294 * (1.755) | 0.006 (0.040) | −0.148 (−1.053) | |
| MR | Direct effect | 1.490 ** (2.721) | 1.464 *** (3.709) | 1.665 *** (4.065) |
| Indirect effect | −0.596 (−0.646) | −0.887 (−1.423) | 0.450 (0.761) | |
| Total | 0.893 (1.105) | 0.577 (0.895) | 2.116 *** (3.568) | |
| HJ | Direct effect | −0.323 (−1.558) | −0.354 * (−1.735) | −0.292 (−1.461) |
| Indirect effect | −0.088 (−0.120) | 0.504 (1.657) | 0.679 ** (2.396) | |
| Total | −0.411 (−0.831) | 0.150 (0.499) | 0.388 (1.260) | |
| LAND | Direct effect | 39.150 *** (4.712) | 40.481 *** (5.012) | 48.009 *** (5.426) |
| Indirect effect | −5.037 (−0.357) | 4.026 (0.369) | 9.713 (0.963) | |
| Total | 34.113 ** (2.042) | 44.507 *** (3.377) | 57.723 *** (6.140) |
| Variable | Effect | Eastern China | Central China | Western China |
|---|---|---|---|---|
| URIG | Direct effect | −3.130 ** (−2.338) | 0.220 (0.099) | 5.195 *** (4.645) |
| Indirect effect | −7.044 *** (−3.609) | −12.479 *** (−3.541) | 4.235 * (2.069) | |
| Total | −10.174 *** (−4.919) | −12.259 ** (−2.821) | 9.430 *** (4.323) | |
| NS | Direct effect | 75.542 *** (4.465) | 24.342 (1.380) | 14.228 (0.867) |
| Indirect effect | 32.454 (1.289) | 19.016 (0.602) | −27.591 (−0.953) | |
| Total | 107.996 *** (3.807) | 43.358 (1.010) | −13.363 (−0.457) | |
| AF | Direct effect | 2.037 (1.415) | 11.784 ** (3.126) | 6.267 * (2.138) |
| Indirect effect | 0.416 (0.226) | −13.225 * (−1.972) | 17.561 *** (3.250) | |
| Total | 2.453 (1.089) | −1.441 (−0.170) | 23.827 *** (4.415) | |
| FS | Direct effect | 0.149 * (1.909) | 0.467 * (2.062) | 0.244 * (1.960) |
| Indirect effect | −0.302 (−1.780) | 0.543 (1.011) | 0.046 (0.184) | |
| Total | −0.152 (−0.988) | 1.009 (1.584) | 0.290 (1.062) | |
| MR | Direct effect | −0.489 (−0.687) | 4.294 *** (4.137) | 0.612 (0.888) |
| Indirect effect | 2.820 ** (2.842) | −1.331 (−0.706) | −0.510 (−0.422) | |
| Total | 2.331 *** (4.164) | 2.963 (1.518) | 0.102 (0.072) | |
| HJ | Direct effect | 0.276 (1.425) | −0.726 (−1.762) | −0.003 (−0.185) |
| Indirect effect | −0.376 (−1.402) | 0.044 (0.063) | −0.096 (−1.363) | |
| Total | −0.100 (−0.344) | −0.682 (−0.826) | −0.099 (−1.297) | |
| LAND | Direct effect | −7.369 (−0.864) | 156.412 *** (3.474) | 65.046 *** (6.367) |
| Indirect effect | −2.526 (−0.181) | −209.939 * (−1.889) | 21.830 (1.520) | |
| Total | −9.895 (−0.687) | −53.527 (−0.409) | 86.875 *** (4.500) | |
| −0.345 *** (−3.566) | −0.258 * (−1.908) | 0.111 (1.155) | ||
| R-squared | 0.981 | 0.970 | 0.940 | |
| N | 110 | 80 | 120 | |
| Log likelihood | −166.136 | −122.154 | −224.119 | |
Publisher’s Note: MDPI stays neutral with regard to jurisdictional claims in published maps and institutional affiliations. |
© 2021 by the authors. Licensee MDPI, Basel, Switzerland. This article is an open access article distributed under the terms and conditions of the Creative Commons Attribution (CC BY) license (https://creativecommons.org/licenses/by/4.0/).
Share and Cite
Han, B.; Ma, Z.; Liu, Y.; Wang, M.; Lin, Y. Effect of Urban-Rural Income Gap on the Population Peri-Urbanization Rate in China. Land 2021, 10, 1255. https://doi.org/10.3390/land10111255
Han B, Ma Z, Liu Y, Wang M, Lin Y. Effect of Urban-Rural Income Gap on the Population Peri-Urbanization Rate in China. Land. 2021; 10(11):1255. https://doi.org/10.3390/land10111255
Chicago/Turabian StyleHan, Bingyang, Zhili Ma, Yong Liu, Mengmeng Wang, and Yingchao Lin. 2021. "Effect of Urban-Rural Income Gap on the Population Peri-Urbanization Rate in China" Land 10, no. 11: 1255. https://doi.org/10.3390/land10111255
APA StyleHan, B., Ma, Z., Liu, Y., Wang, M., & Lin, Y. (2021). Effect of Urban-Rural Income Gap on the Population Peri-Urbanization Rate in China. Land, 10(11), 1255. https://doi.org/10.3390/land10111255