1. Introduction
Urban sprawl is defined as a specific urban form where development areas are characterized by single use-zoning, reduced accessibility, and increased car dependency. The area covered by urban sprawl has risen considerably in recent decades [
1,
2,
3]. The concept of the neighborhood has been defined in Western urban literature, particularly by American scholars [
4,
5]. The neighborhood is described as a primary social or special unit of an urban area that is larger than a household and smaller than a city [
5].
The different characteristics of urban forms can influence mobility and social interactions. Masoumi (2019) has explored how neighborhood size and center can affect urban social and travel behavior in cities in the Middle East and North Africa (MENA). A neighborhood contains many complex mechanisms and interrelations that give rise to specific behaviors and perceptions among residents. In order to shape sustainable transportation systems and cities—in other words, to promote less energy-intensive travel—it is necessary to understand how and why residents choose their destinations for recreational and social activities. Social activity in cities is critical to sustainable development and so it is important to know how neighborhoods can be self-sufficient. A large body of research has found that traditional neighborhoods with higher density, compact forms, a greater sense of identity, and social ties based on ethnicity or religion make a greater contribution to urban sustainability goals and are more self-sufficient [
6,
7,
8,
9]. The economic, social and physical characteristics of the built environment have an impact on the capacity of a neighborhood to meet the needs of residents and are thus associated with a sense of belonging and social cohesion. Jacob (1961) explored the impacts of mixed land use in neighborhood structure and design on the reinforcement of a sense of community.
This paper focuses on two types of neighborhood—traditional, compact neighborhoods and modern, sprawled ones. We look at the various impacts of these two neighborhood types on travel behavior and social interactions in Pakistani cities as examples of the South Asian context. While urban sprawl is a development pattern that has transformed cities and suburbs in developing countries, there is currently a lack of research available on South Asia. Recently, there have been a few studies investigating the relationship between different urban forms and travel patterns and socioeconomic features in emerging markets [
10,
11,
12,
13]. However, in order to generate tailored urban and transport planning policies and solutions, there is a need for more studies into this relationship in emerging markets and developing countries. In particular, there is currently a limited understanding of the associations between different neighborhood types and social interactions, neighborhood self-sufficiency, sense of community, social preferences, and residents’ attitudes in emerging markets. With the transformation of neighborhoods from traditional, compact forms to modern, sprawled districts, the role of neighborhoods in meeting the social and economic needs of residents has been called into question, particularly in developing countries.
There is a need to better understand the role of neighborhoods in non-commuting trips and social activities in different contexts in order to achieve a balance between social and environmental sustainability on the one hand, and accessibility and transportation on the other. The objective of this paper is to examine the “neighborhood effect” and the potential of compact and sprawled urban forms to keep non-commuting trips inside neighborhoods. In other words, the aim is to define the determinants of non-commuting trips that lead to self-sufficient neighborhoods. In order to reach sustainable development goals, neighborhoods must be able to meet the social and recreational needs of residents while at the same time reducing trips to other parts of cities, particularly through the use of motorized vehicles.
The rest of the paper is organized as follows.
Section 2 reviews the literature on the concept of the neighborhood, urban forms and travel behavior. In
Section 3, we briefly outline the methods applied in the paper.
Section 4 presents a summary of findings from statistical models. In
Section 5, we discuss the differences and similarities in shopping and recreational trips between compact and sprawled neighborhoods, and we compare findings for high-income and Western countries with those for developing countries. Finally,
Section 6 contains the conclusion.
2. Sustainable Neighborhoods
The urban village concept is an approach for strengthening neighborhoods based on well-designed, mixed land-use, and sustainable planning that was initially developed in the UK in the 1990s. It is similar to New Urbanism or Nontraditional Development in the United States [
14]. Handy et al. (2001) argued that neighborhoods with local shopping areas and mixed land-use can reduce car dependency. In this approach, travel destinations are designed within walking or cycling distance of residential areas in order to reduce car dependency in urban areas, particularly in sprawled, single land-use developments [
15]. Researchers and urban planners in New Urbanist and urban village movements have also been concerned with social activity and sustainable transportation. Unlike traditional and nontraditional models, sprawled neighborhoods, which are characterized by low-density, dispersed development, and single land-use or low levels of mixed land-use, are correlated with longer commute distances and higher car use [
16]. The social cognitive theory looks at how individual behavior is influenced by built environment characteristics and personal factors. In this way, the socioeconomic status of people who live in a neighborhood may affect travel behavior such as choice of destination and mode [
17]. A large body of research has explored neighborhood types and their effects on travel patterns in developed countries [
18,
19,
20,
21].
Neighborhood self-sufficiency refers to the ability of a neighborhood to meet a range of needs, including social interaction, energy supply, and administrative and economic requirements. Urban scholars have studied various aspects of neighborhood self-sufficiency in developed countries. Tait investigated how the urban village concept could enhance self-sufficiency and integrated communities in different urban neighborhoods in West London [
22]. According to a study of Australian cities, characteristics of built-up areas such as density, distance to the city center, and land-use are correlated with self-sufficient neighborhoods because of reduced travel needs [
23]. Convery et al. (2019) studied the relationship between non-commuting journeys and land-use/transport configurations. They showed there is a significant association between non-commuting travel patterns and income and car ownership in Dublin, Ireland [
24].
Compact and traditional neighborhoods with higher population density and mixed land-use for shopping centers, retail shops, and recreational facilities, such as bars, restaurants, and small parks, generate a greater sense of neighborhood belonging and keep daily trips for non-commuting purposes inside neighborhoods. Urban researchers in the Western context have studied the sense of community [
25,
26]. Park (2017) argued that “compactness” does not necessarily give rise to a strong sense of community in Texas, USA, and that people prefer to continue to live in suburban neighborhoods for longer than in New Urbanist ones [
27]. The social outcomes for different types of neighborhood are not clear, particularly in different socioeconomic contexts. A study in California showed that levels of satisfaction among residents in compact districts are higher than in sprawled ones [
28].
The relationship between individual socioeconomic and social features and the self-efficiency of neighborhoods has been studied in developed countries [
29,
30,
31]. Browning et al. (2002) used collective efficacy and social disorganization theory and collective efficacy theory to explain physical activity levels in neighborhoods in Chicago [
32]. Collective efficacy theory focuses on network ties that generate mutual trust among neighborhood residents (social cohesion) and result in action (social control) [
33]. While there are some studies on neighborhood effect, self-sufficiency, and self-efficacy in neighborhoods in developed countries, there is a significant gap in research in these areas in developing countries. The gap is particularly marked in South Asian cities where the concept of neighborhood has transformed as a result of modernization [
8,
9].
Pakistan is facing rapid urbanization in the context of an agrarian economy. The structure of Pakistani cities has changed dramatically as cars have been increasingly used in densely populated neighborhoods [
34]. Development in new areas has not kept up with the rate of urbanization (through natural growth and migration). As a result, services remain poor in the slums, suburbs, and sprawled neighborhoods, which have developed particularly on the edges of large cities [
34]. There have been studies into the associations between built-up areas, socioeconomic features, and travel habits in developing countries [
8,
9,
11,
35]. For instance, Al-Rashid et al. (2020) investigated the psychological aspects of public transport use among older Pakistan residents. The findings showed there was a significant relationship between negative attitudes towards public transport and social exclusion among older adults in Lahore [
36]. However, there is a real need for more research into mobility, urban forms, the perceptions of residents and the relationship between social activity and different types of neighborhoods in order to tackle problems in new and rapidly expanding urban areas.
One of the aims of this paper is to understand how the quality of facilities and amenities in new development areas affects non-commuting trips, i.e., trips for shopping and entertainment purposes. The differences between compact and sprawled areas and their associations with socioeconomic features, travel patterns, and the perceptions of residents is a neglected topic in cities in emerging markets in South Asia, including Pakistan. Although urban sprawl has been the subject of research in South Asia and emerging markets, these studies have focused on the long-term transformation of land and the natural environment [
37,
38].
There has also been a considerable amount of research into urban sprawl using satellite images and predictions via artificial neural networks [
39]. Nevertheless, the relationship between urban sprawl as a new urban form and social, psychological, and transport-related behavior is still unclear. There is also a lack of research using a mathematical model to analyze the correlation between different urban forms and social interactions, attitudes, and the perceptions of residents regarding the quality of facilities in South Asian cities.
3. Methodology
3.1. Research Questions and Hypothesis
This paper aims to answer the following questions in order to better understand the potential of different urban forms to influence shopping and recreational activities inside neighborhoods in the understudied context of South Asia:
Are there any differences in the socioeconomic features, and the perceptions of people living in compact and sprawled neighborhoods in Lahore and Rawalpindi?
How do travel behavior, socioeconomic features, and the perceptions of residents define shopping trips inside neighborhoods in Lahore and Rawalpindi?
How do socioeconomic, perceptions, and travel behavior variables characterize entertainment/recreational trips inside neighborhoods in Lahore and Rawalpindi?
What are the differences in non-commuting travel behavior, i.e., shopping and entertainment trips, for those living in compact and sprawled neighborhoods in Lahore and Rawalpindi?
We hypothesize that there is a relationship between, on the one hand, living in different urban forms and, on the other, the socioeconomic features and perceptions of people in Lahore and Rawalpindi. In addition, we hypothesize that there is a correlation between the capacity of neighborhoods to keep non-commuting trips within their boundaries and (a) the socioeconomic status of residents—including their age, gender, income, and car ownership—(b) travel behavior, and (c) the perceptions of residents toward, the attractiveness of shops, sense of belonging to the neighborhood, length of time living in the current home and residential location choice. This paper assumes that the socioeconomic, perception, and travel behavior determinants of the non-commuting trip have different patterns and correlations in sprawled versus compact neighborhoods.
3.2. Data and Variables
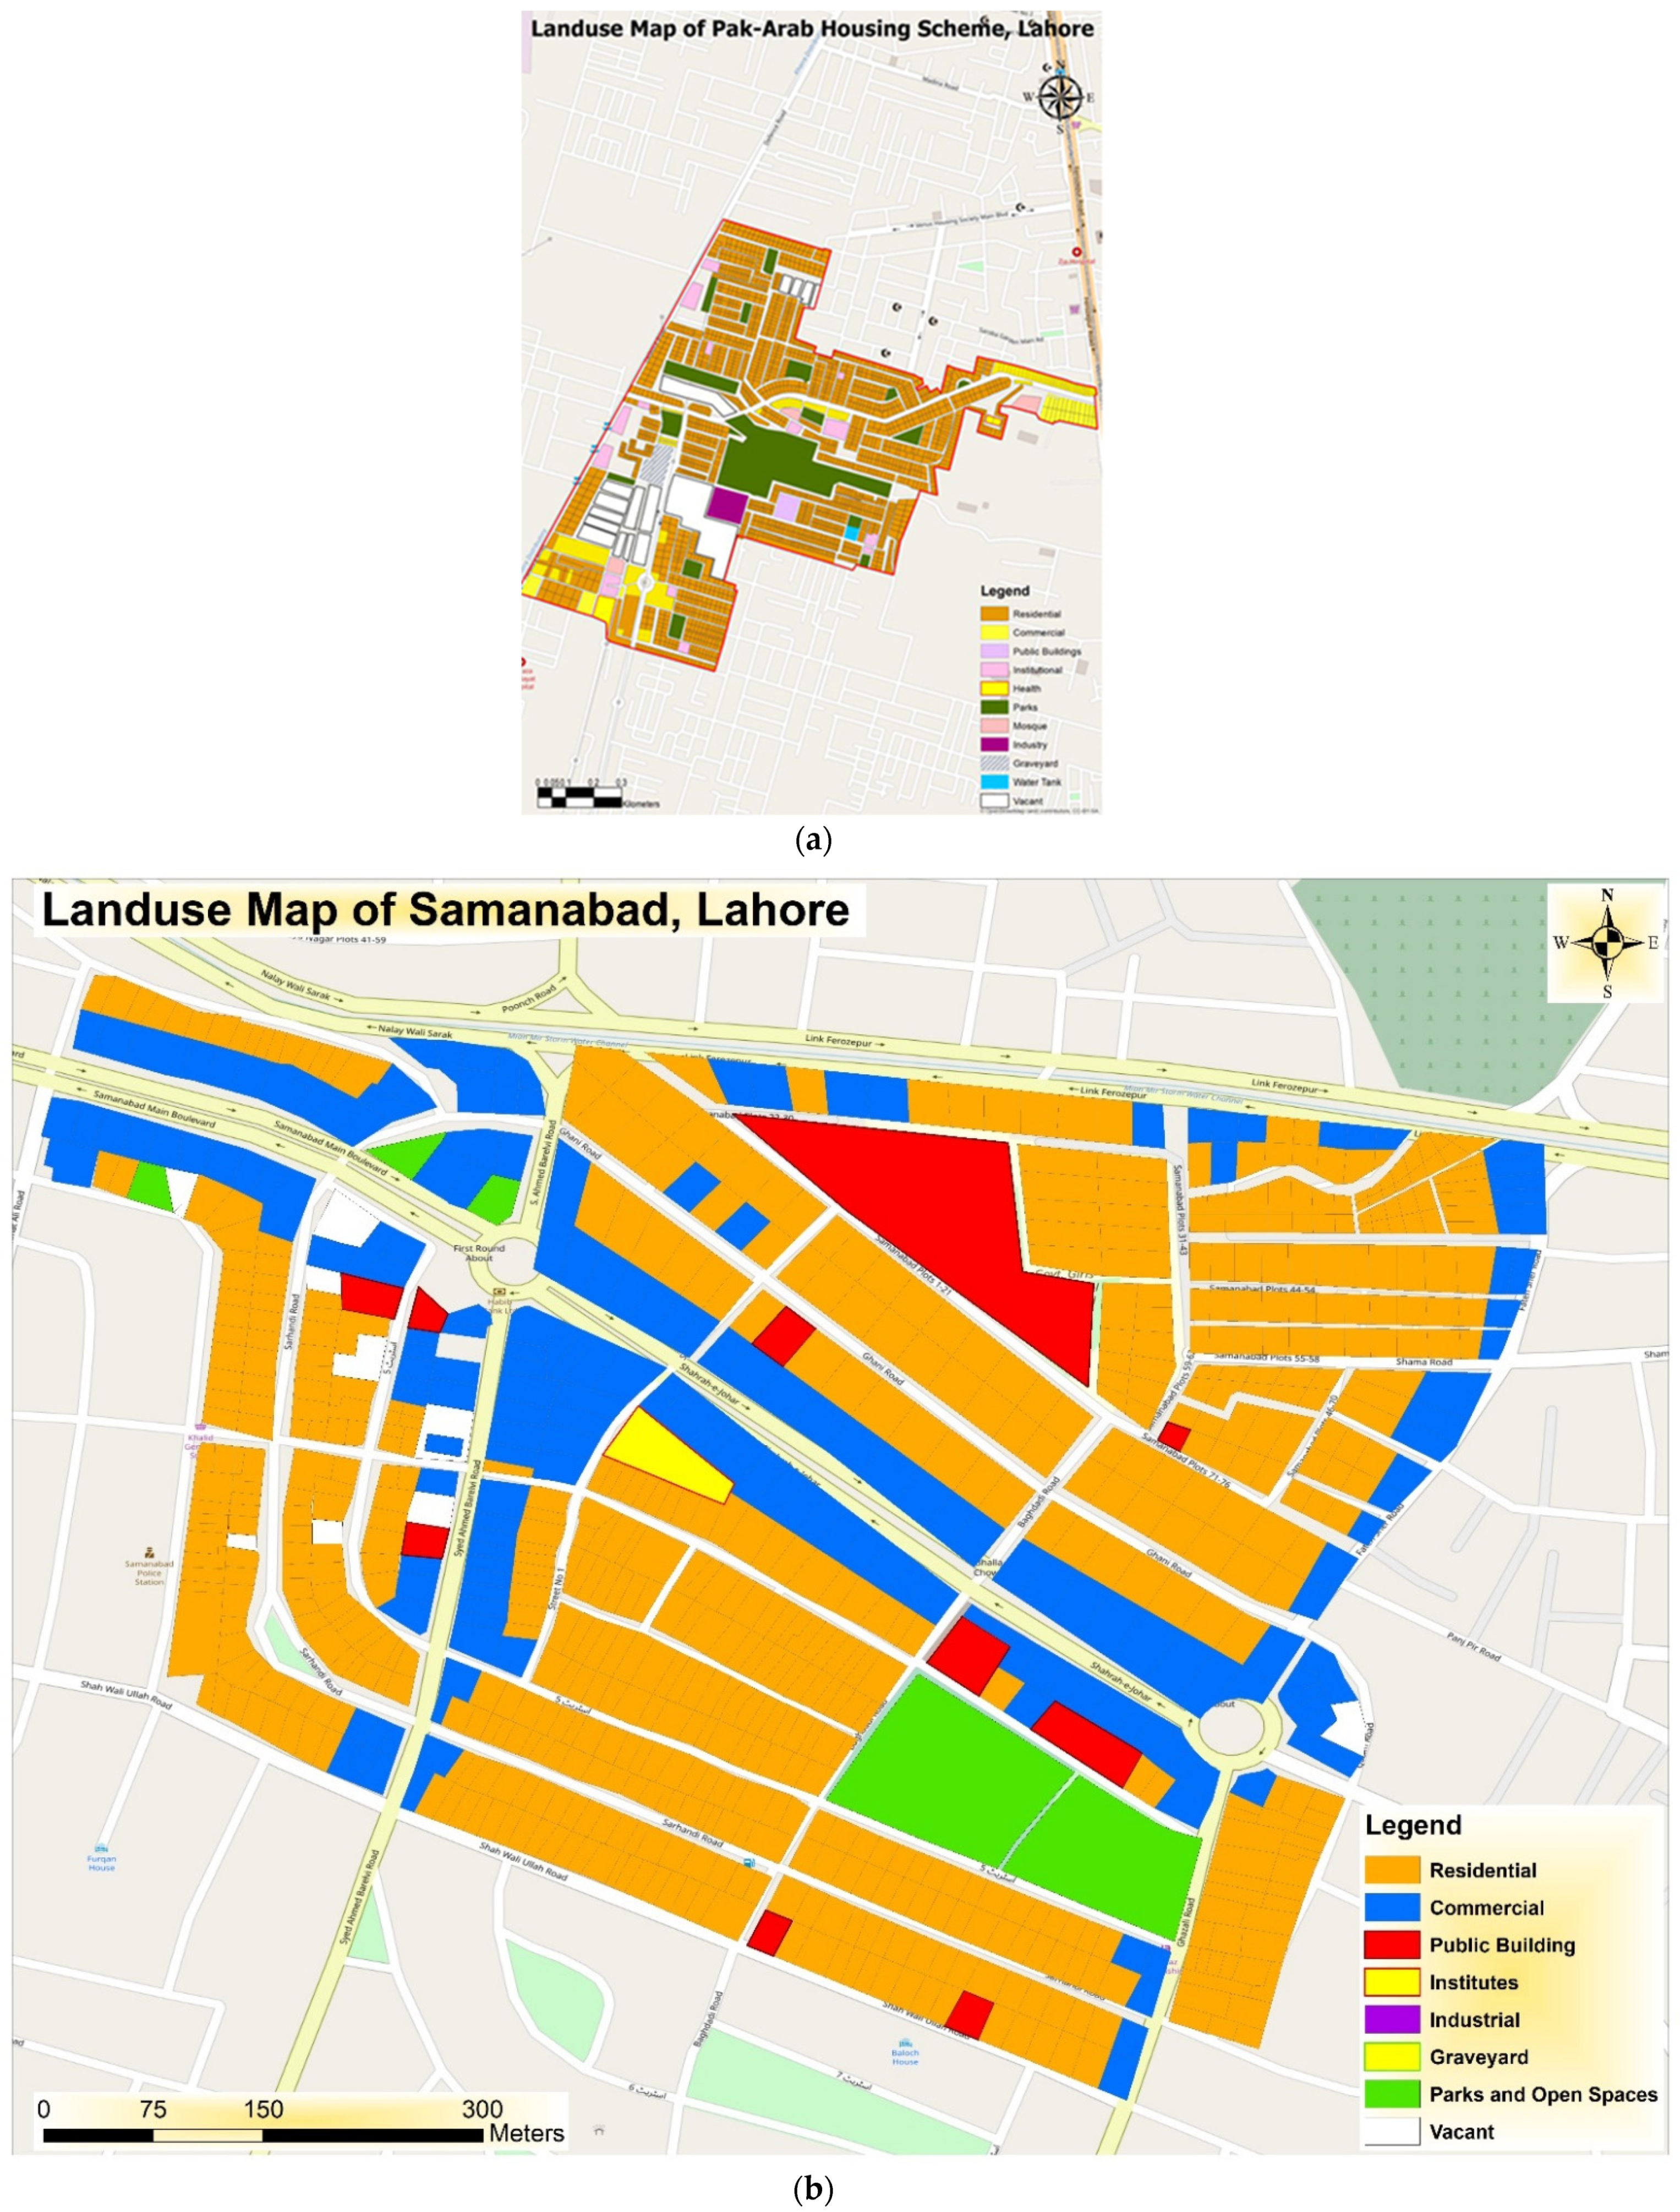
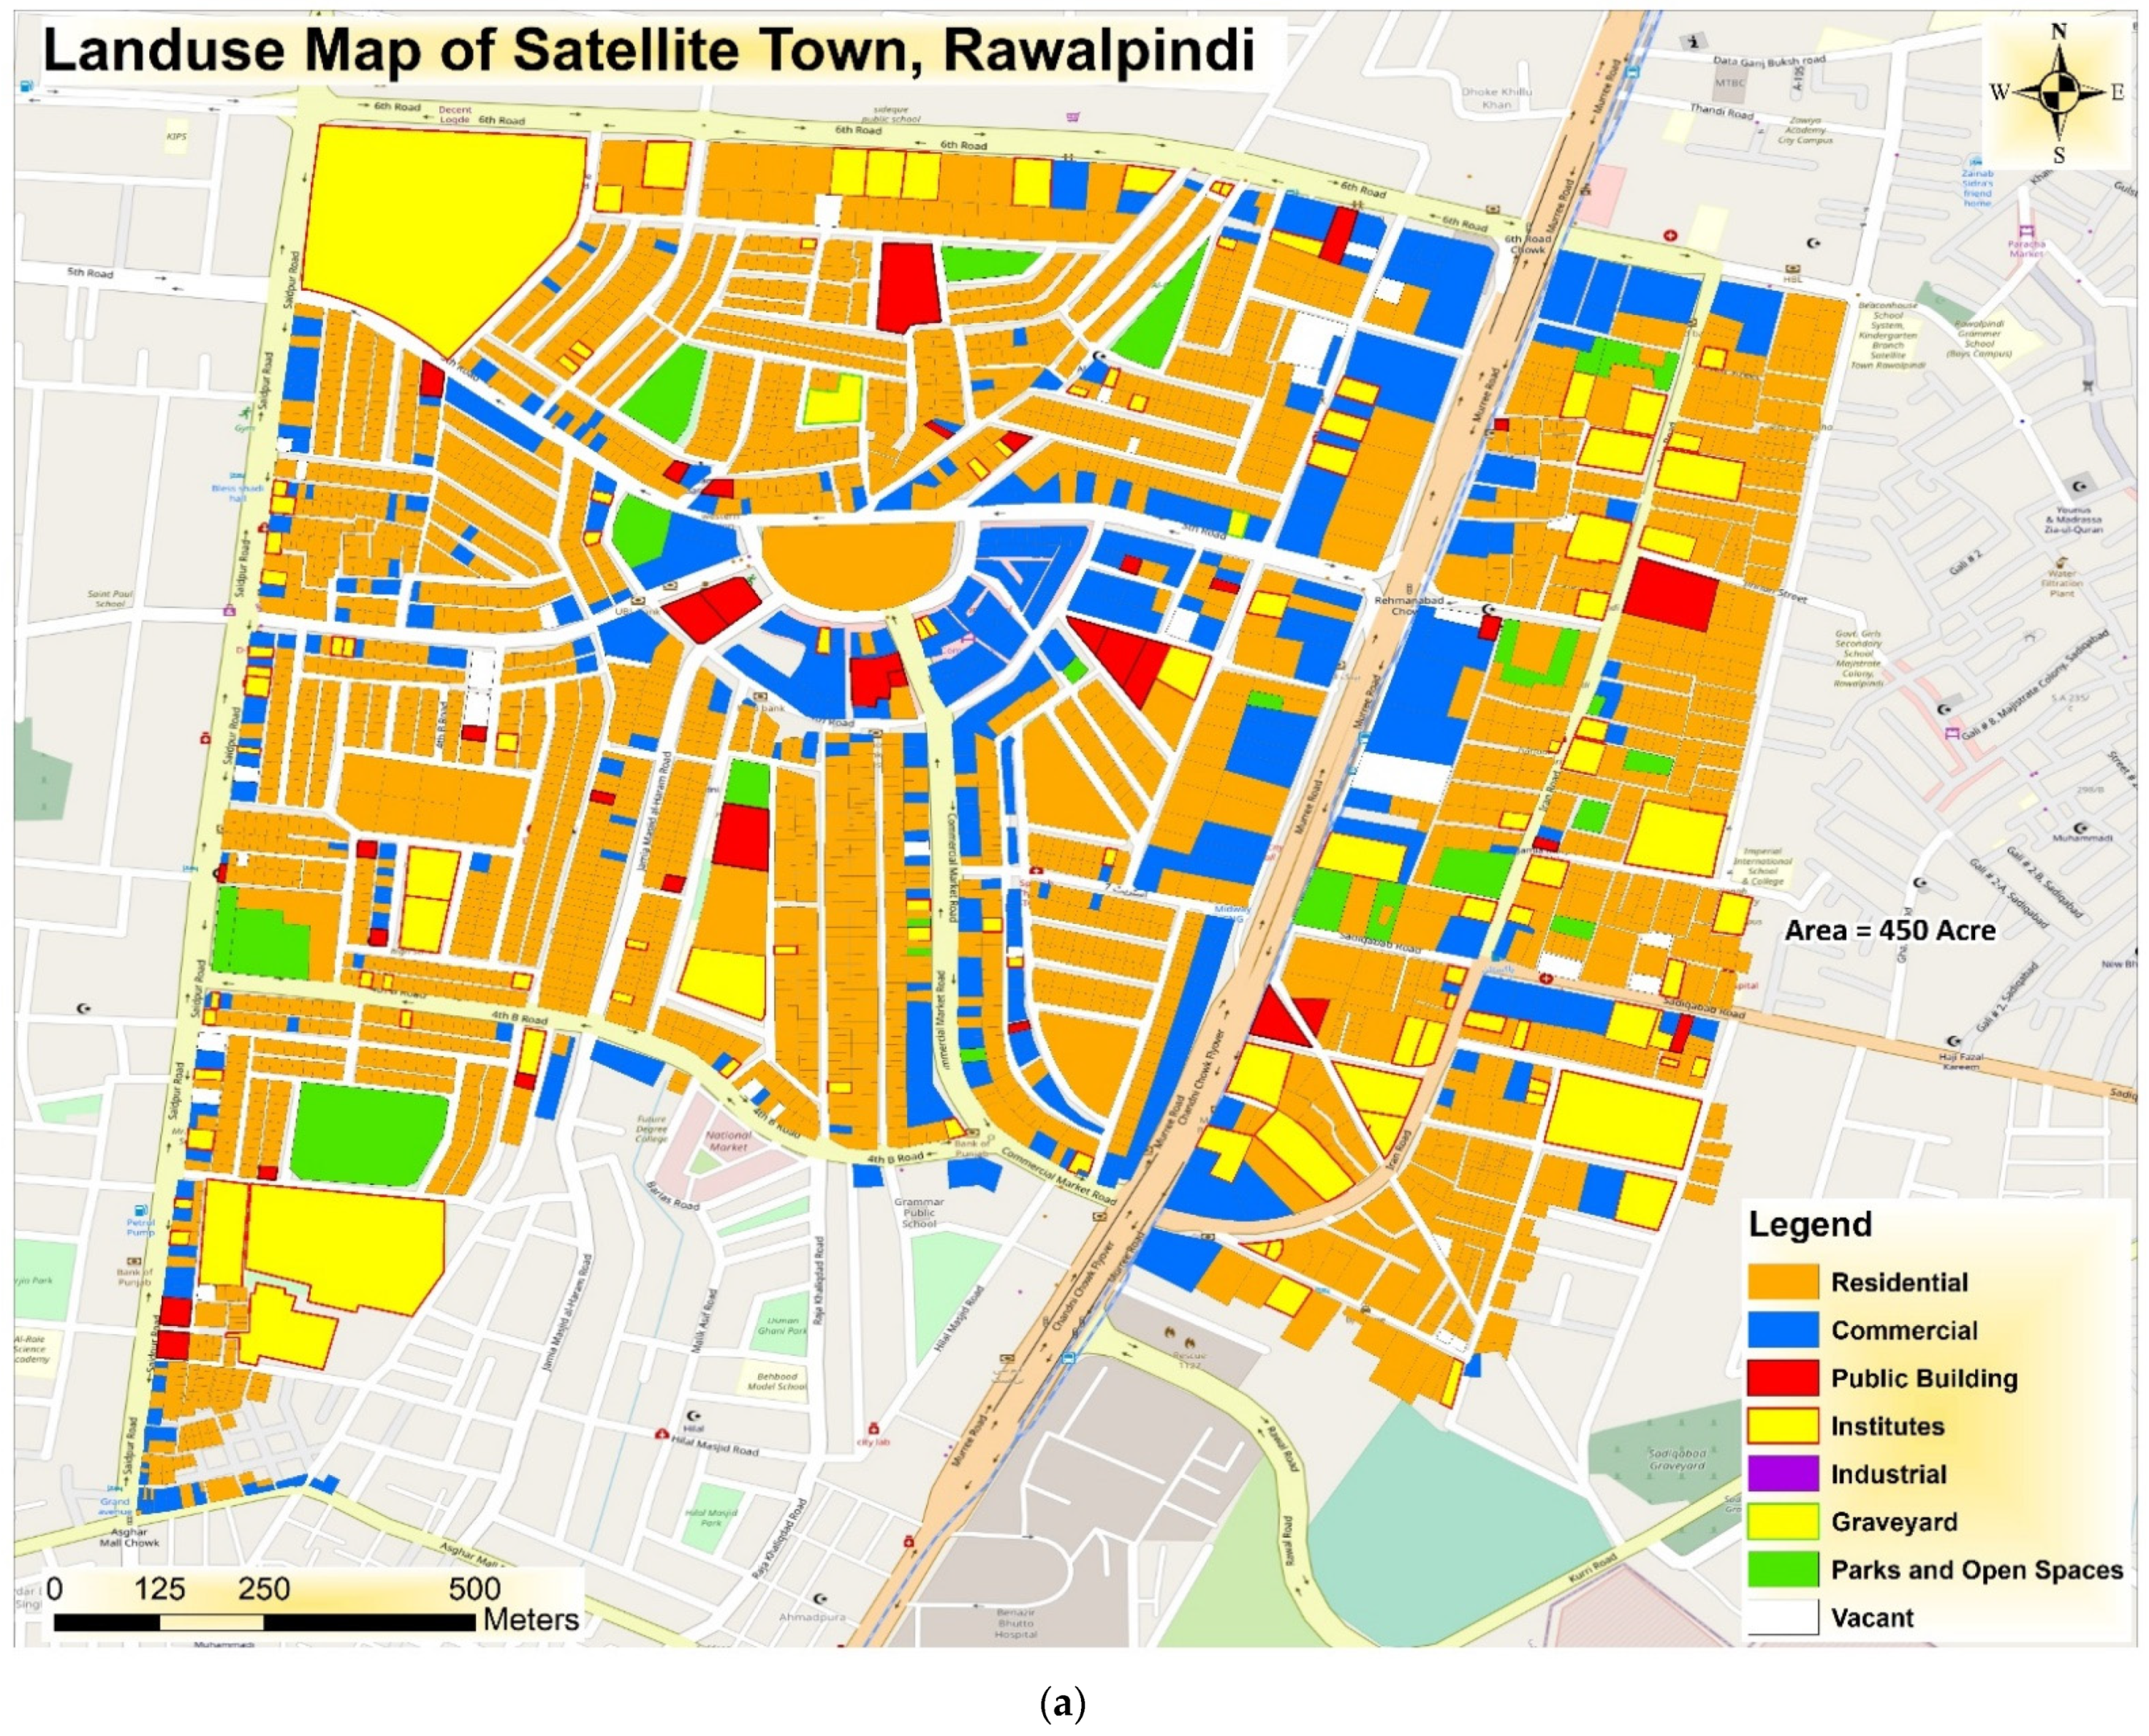
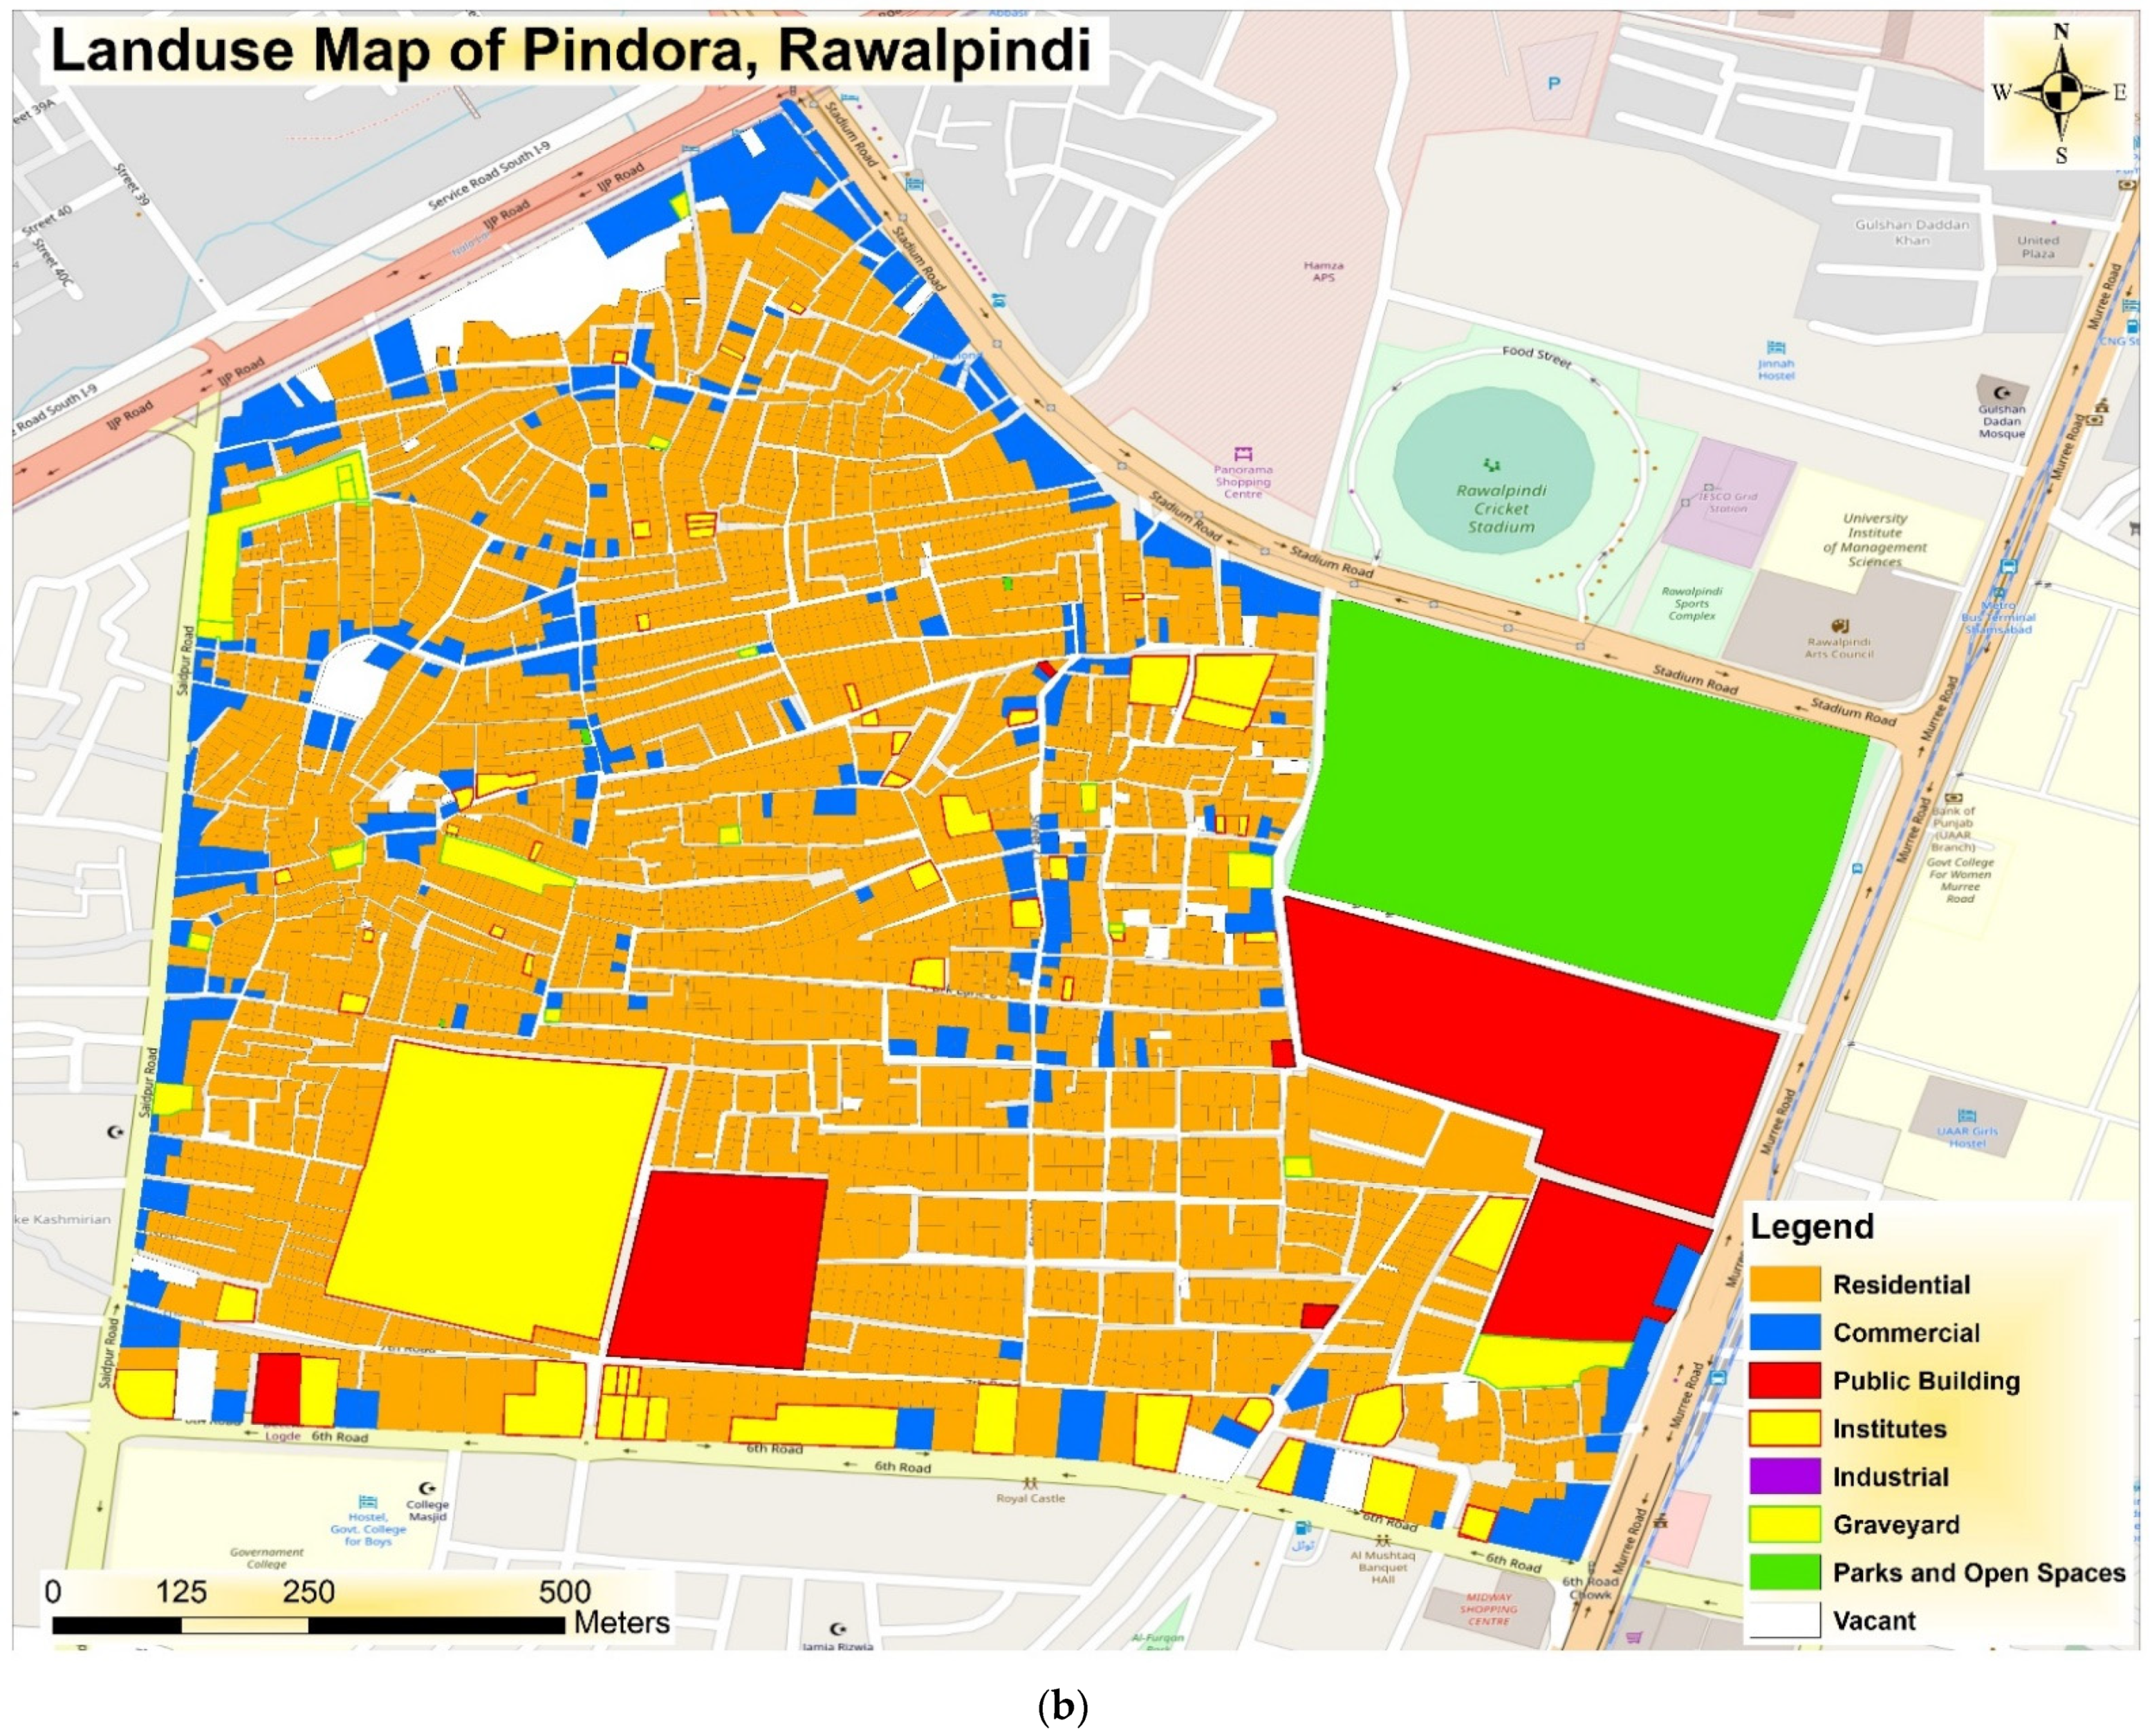
This study employed a dataset from two surveys conducted in Lahore and Rawalpindi in 2018 and 2020, respectively. In each city, two different neighborhoods were selected—a sprawled neighborhood and a compact one. The surveys involved face-to-face interviews in order to fill out a questionnaire in Urdu. In Lahore, the neighborhoods of Samanabad and Pak Arab Housing Scheme were selected. Samanabad is in central Lahore and has a regular street pattern, a dense residential area and mixed land-use. Pak Arab, on the other hand, is a comparatively new development area located in the suburbs and is largely residential. In Rawalpindi, Pindora was chosen as a compact district with mixed land-use and an irregular street pattern. Satellite Town, on the other hand, is a comparatively new development area with a regular street pattern. As its name suggests, it is located on the outskirts of Rawalpindi. Both the selected neighborhoods in Rawalpindi are contiguous to each other and are located on the boundary of Rawalpindi from the northern end with the sister city of Islamabad (The capital of Pakistan).
The criteria for selecting these two neighborhoods was not the geographic location within the city, rather the characteristics of the built-up area, which help identify them as sprawled or compact neighborhoods. Low-density development areas with poorly mixed land use structures and poor street connectivity were considered as sprawled neighborhoods in this paper. There were 461 complete questionnaires after data had been validated from 500 participants in Lahore. Four hundred respondents participated in the survey in Rawalpindi across both neighborhoods. The total sample size was therefore 861 across the two cities. The sample size is representative at the level of sprawled and compact neighborhood types, according to Cochran (1963). This paper is only exploratory research aimed to investigate neighborhood effects on attracting non-commuting trips and provide insights into travel behavior, socioeconomic status of different types of the neighborhood in large Pakistani cities as an example for large South Asian cities.
Socioeconomic characteristics, travel behavior, and participants’ perception variables are presented in
Table 1. The variables are categorized into three types: continuous, binary, and categorical variables. Continuous variables are the number of non-commuting trips per week, the number of driver’s licenses in a household, car ownership, and the length of time living in the current home. Gender, daily activity, possession of a driver’s license, sense of belonging to the neighborhood, and attractiveness of shops and commercial centers are dummy variables. Categorical variables are age, monthly income, mode choice for non-commuting trips inside the neighborhood, mode choice for non-commuting trips outside the neighborhood, frequency of public transport use, quality of facilities in the neighborhood, and residential location choice.
3.3. Case Study
Lahore and Rawalpindi were selected as case studies for the potential of sprawled and compact neighborhoods to meet residents’ needs and keep non-commuting trips within the neighborhood. These cities are taken to represent large cities in Pakistan, and South Asia more generally. Pakistan has the highest rate of urbanization in South Asia, and the overall population is predicted to reach 335 million by 2050. Punjab is the most populous province in Pakistan [
40]. Lahore is the second-largest city in the country and the capital city of Punjab. It is the main center for commerce and trade in the region. The city has emerging challenges, including inadequate infrastructure, uncontrolled urban growth, lack of an efficient planning system, and slums brought about by rapid urbanization.
The built-up area of Lahore has doubled in size in just over a decade (1999–2011) [
41]. In 2013, the population of the city was 17.11 million, with 82% living in urban areas and the rest residing in peri-urban areas. Lahore covers an area of 1790 square kilometers [
42,
43]. Rawalpindi is the fourth largest city in Pakistan and is also located in Punjab. It is an industrial, military, and commercial hub [
44]. The city has experienced rapid urbanization and land transformation as a result of natural processes, migration and governance. Rawalpindi covers an area of 5286 square kilometers. Traditional neighborhoods in the city are characterized by short, narrow and unnamed streets in residential areas [
40].
Figure 1 and
Figure 2 show selected neighborhoods in Lahore and Rawalpindi. In Pakistani cities, minibuses, wagons, small pick-up vans, and Chingqis (motorcycles) are used as public transport modes in the fixed routes. In Rawalpindi, Metro Bus Service runs through different neighborhoods. The Lahore Metrobus is a bus rapid transit service running in Lahore and crossing Lahore district with connection to suburban areas.
3.4. Analysis Methods
3.4.1. Establishing a Relationship between Urban Forms and the Socioeconomic Characteristics and Perceptions of Residents
We used a Chi-square test to determine the existence of a relationship between the categorical variables. In order to answer the first research question, we applied a Chi-square test to the variables age, gender, daily activity, monthly income of a household, attractiveness of shops in the neighborhood, location of entertainment activities, daily shopping location, quality of facilities in the neighborhood, sense of belonging to the neighborhood, and residential location choice. We tested the differences between sprawled and compact neighborhoods across these variables. The null hypothesis was that there was no significant correlation between socioeconomic characteristics and the perceptions of residents, on the one hand, and whether they lived in sprawled or compact neighborhoods on the other. The alternative hypothesis was that there was a significant relationship between these variables and neighborhood types. p-values of less than 0.05 would give cause to reject the null hypothesis and accept the alternative hypothesis. The Proportional Reduction in Error (PRE) test indicates the extent to which a dependent variable be predicted by an independent variable. In other words, PRE shows how strongly two categorical variables are associated with each other. We used Phi for dummy variables and Cramer’s V for categorical variables. The strength of the relationship between variables is classed as weak (indicated by a value of Phi and Cramer’s V of between 0.0 and 0.10), moderate (between 0.10 and 0.30), and strong (higher than 0.30).
3.4.2. Neighborhood Effect on Non-Commuting Trips
To answer the remaining research questions, we developed four binary logistic (BL) regression models using daily shopping and entertainment destinations as the dependent variables. We analyzed the dataset for Pakistan by neighborhood type. For compact neighborhoods, two BL regression models were generated for daily shopping and entertainment destinations; we then repeated this process for sprawled neighborhoods. The four BL models for Lahore and Rawalpindi showed how different urban forms can keep non-commuting trips within the neighborhood. Through the four models, the determinants of the neighborhood effect were established based on socioeconomic characteristics, travel patterns, and the perceptions of residents. The first round of BL models used 17 variables as independent variables. Variables were then eliminated from the BL models based on the highest p-value. This procedure was repeated until a suitable model was obtained based on significant variables, and a higher value of Nagelkerke’s R2. An Omnibus test demonstrates the validity of the BL models with significant variables (p-values of less than 0.05) and higher Nagelkerke’s R2 values.
4. Findings
4.1. Descriptive Statistics
The survey respondents were residents in two different types of neighborhoods: sprawled and compact. In terms of gender, 67% of respondents were men and 33% were women. They came from different age groups, with the least represented group being the under-17s and the majority of respondents aged between 18 and 30 at the time of the survey. Disregarding neighborhood type, almost 60% of participants obtained their daily essentials from shopping areas or retail shops inside the neighborhood, while 53% of respondents chose entertainment destinations outside the neighborhood. Only 7.7% of respondents found the quality of facilities in neighborhoods very attractive, while 24.2% thought the facilities in neighborhoods were not attractive at all.
Table 2 and
Table 3 show the descriptive statistics of continuous variables and the frequency of using different mode choices of transportation regarding two different types of neighborhoods in Lahore and Rawalpindi, respectively.
4.2. The Relationship between Urban Forms and the Socioeconomic Characteristics and Perceptions of Residents
Chi-square tests are used to determine whether two categorical variables are likely to be related or not. In this paper, neighborhood form (i.e., compact or sprawled) is the first categorical variable, while the second categorical variable is comprised of socioeconomic characteristics, mobility (i.e., travel behavior), and perceptions.
Table 2 shows the chi-square results. A
p-value of less than 0.05 indicates a significant difference between living in a sprawled as opposed to a compact neighborhood in terms of socioeconomic characteristics, mobility, and the perceptions of residents. We fail to reject the null hypothesis for age and attractiveness of shops on the basis that these variables have
p-values greater than 0.05. Gender, monthly income, and quality of social/recreational facilities have a moderate relationship with neighborhood form, with Phi or Cramer’ V coefficients of 0.2, 0.24, and 0.21, respectively.
Table 4 shows that there is a strong association between living in a compact or sprawled neighborhood in the two cities and daily activity, sense of belonging to the neighborhood, and residential location choice.
The number of men who live in compact areas of Rawalpindi and Lahore is more than women in compact areas. While there are no considerable differences between numbers of men and women in sprawled areas. 83% of respondents in sprawled areas work or study, while 43% of survey participants who live in compact areas have daily activity. 96% of respondents who live in sprawled areas have a monthly income of more than 152 euros. On the other hand, 16% and 84% of people who have monthly income less and more than 152 euros, respectively, live in compact areas. A total of 40% of survey participants who live in compact areas use public transport every day or a few times per week. While 21% of respondents in sprawled areas use public transport every day or a few times per week. A total of 21% and only 1% of survey participants who never use public transport were living in sprawled and compact areas, respectively. Residents in compact areas have more sense of belonging to neighborhoods than those who live in sprawled areas in two large Pakistani cities. Eighty-four percent and 16% of residents in compact areas select the current residential location for affordable prices or short commuting distance in Lahore and Rawalpindi, while people who live in sprawled areas have different reasons for choosing their current home. For example, 15% of them selected the current home for attractive green surrounding views or 3% of respondents selected the current location because of higher prices in the future.
4.3. Model Fit
We developed four BL models for this study. Here we present the final models after the removal of insignificant variables. The implications for further research are then discussed in the following sections.
4.3.1. The Neighborhood Effect on Choice of Destination of Shopping Trips
After running 11 models, the best model for choice of destination of shopping trips for residents of compact neighborhoods was generated with five significant variables and seven categories. The dependent variable is the dummy variable of the choice of destination of shopping trips, and respondents answered either inside or outside their neighborhood. The following variables were each omitted from the model where they had the highest p-value: age, possession of a driver’s license, the attractiveness of shops, daily activity, number of driver’s licenses in a household, number of non-commuting trips per week, gender, number of cars in a household, quality of social/recreational facilities of the neighborhood, and length of time living in the current home. A sense of belonging to the neighborhood has a significant positive correlation with keeping a shopping trip inside a neighborhood. The probable explanation for this is that there is a relationship between feeling a sense of belonging to a neighborhood and staying within the neighborhood to do the daily shopping.
The second category of frequency of public transport use is highly significant in the model. People who rarely use public transport carry out their daily shopping inside the neighborhood more than those with other levels of public transport use. In addition, there is a positive and highly significant correlation between travelling to shops outside the neighborhood and residential location choice due to affordable prices for accommodation in compact districts. As
Table 5 shows, residents who chose walking, cycling and motorbike as the main choice of mode of transportation in non-commuting trips inside the neighborhood are more likely to do their daily shopping within the neighborhood than others. The highest and lowest categories of income have a positive correlation with daily shopping outside the neighborhood. In addition, mode choice of non-commuting trips outside the neighborhood is highly significant in the model but without a significant category. This variable was therefore kept in the model in order to improve the results. Nagelkerk’s R
2 is 0.52 and the model covers 80% of variables correctly.
Table 6 shows the binary logistic model for the choice of destination of shopping trips for those living in sprawled neighborhoods in Lahore and Rawalpindi. Although the categories for mode choice for non-commuting trips outside the neighborhood are insignificant in the model, this variable has been kept because the
p-value is less than 0.05 and this helps obtain a better model. The number of non-commuting trips per week is significant and positive in the model. This means that as the number of non-commuting trips increases, residents are more likely to meet their daily shopping needs outside the neighborhood. There is a significant negative relationship between rarely and almost never using public transport and shopping outside the neighborhood. This can be interpreted to mean that residents in sprawled districts who almost never or rarely use public transport meet their daily needs from shops inside the neighborhood. The attractiveness of shops and income between 152 and 254 euros per month are highly significant in the model. The odds ratio is less than one for the attractiveness of shops and therefore indicates a negative correlation. The Hosmer–Lemeshow test gives a
p-value of more than 0.05 and therefore shows the model is significant. Nagelkerke’s R
2 value shows the model performs acceptably well.
4.3.2. The Neighborhood Effect on Choice of Destination of Trips for Entertainment
The binary logistic model for the choice of destination of trips for entertainment purposes by those living in compact neighborhoods was generated using the following highly significant (
p-value of less than 0.05) and marginally significant (0.05 <
p-value < 0.1) variables: age, gender, possession of a driver’s license, monthly income, number of non-commuting trips per week, number of driver’s licenses and cars in the household, mode choice for non-commuting trips outside the neighborhood, and attractiveness of shops in the neighborhood. The different age groups have positive and highly significant correlations with the choice of destination of entertainment trips for those living in compact neighborhoods in Lahore and Rawalpindi. The odds ratio for the possession of a driver’s license is less than one, indicating a negative correlation between independent and dependent variables. The two categories of income, including income less than 50 euro and income between 50 and 101 euro per month, have a positive relationship with traveling to entertainment locations outside compact neighborhoods. The highly positive association between the number of non-commuting trips and choosing outside destinations for entertainment activities can be interpreted to mean that as the number of non-commuting trips increases, the likelihood that a resident carries out recreational activities outside the neighborhood also increases. The same association and interpretation apply to the number of cars in a household. The Omnibus and Hosmer–Lemeshow tests confirm the model is significant; Nagelkerke’s R
2 and the correct overall percentage of variables in the model show the model is an acceptably good fit (
Table 7).
The binary logistic model for choice of destination of entertainment location for those living in sprawled neighborhoods in Lahore and Rawalpindi was developed after removing the following insignificant variables with a
p-value of more than 0.05: age, mode choice for non-commuting trips inside and outside the neighborhood, number of driver’s licenses, length of time living in the current home, and frequency of public transport use (
Table 8). The negative association between gender and entertainment destinations outside neighborhoods can probably be interpreted that women who live in sprawled neighborhoods prefer to carry out entertainment activities to men. The odds ratio of greater than 1 for the sense of belonging to the neighborhood indicates a positive correlation with choosing outside destinations for entertainment activities. This probably means that people who feel a sense of belonging to a neighborhood choose inside destinations for entertainment more than those without sense of belonging to the neighborhood. There is one highly significant and two marginally significant measures of the quality of social and recreational faculties of neighborhoods. This means that people who find the quality of facilities very attractive, acceptably attractive, or medium are more likely to choose a destination for entertainment activities inside the neighborhood. Daily activity has a marginally significant positive correlation with entertainment outside the neighborhood, so it was kept in the model in order to achieve a higher value of Nagelkerke’s R
2. The model covers 71% of variables correctly and is, therefore, a good fit for the data.
5. Discussion and Policy Recommendations
Percentage correct is correlated with a sense of belonging to the neighborhood, frequency of public transport use, residential location choice, mode choice for non-commuting trips inside and outside the neighborhood, and monthly income. In sprawled neighborhoods, the choice of destination of shopping areas is associated with the number of non-commuting trips, the mode choice for non-commuting trips outside the neighborhood, frequency of public transport use, the attractiveness of shops, and monthly income. While there are similarities in some significant variables, the two BL models confirm that differences in travel behavior, socioeconomic characteristics, and the perception of residents probably have an impact on the neighborhood effect in the two different types of the neighborhood. A sense of belonging to the neighborhood is a significant variable for compact neighborhoods and indicates that high-density neighborhoods with mixed land-use can influence the sense of belonging and neighborhood self-sufficiency. This finding is in line with a study on the relationship between urban form and social sustainability in the UK [
45].
The number of non-commuting trips in sprawled neighborhoods has a positive correlation with shopping destinations outside neighborhoods. While this variable is not a significant determinant for compact districts in Lahore and Rawalpindi, it might indicate how single use-zoning in sprawled districts with low levels of mixed land-use correlates with a higher number of non-commuting trips for shopping destinations outside neighborhoods. This would be consistent with a study in Germany showing that the volume of non-commuting journeys increased in sprawled regions [
46].
On the other hand, this finding is inconsistent with the results of a study by Handy et al. (2001) in six American neighborhoods, where the authors argued that promoting local shopping areas was not an effective strategy for reducing travel distance. Walking, cycling, and traveling by motorbike for non-commuting trips inside neighborhoods is associated with meeting daily needs from shopping areas inside compact neighborhoods. However, this pattern was not observed in sprawled neighborhoods in Lahore and Rawalpindi. These findings confirm the results of several studies in developed countries, which demonstrated a positive relationship between active mobility and living in compact districts [
15,
47,
48,
49,
50].
The findings show that there is a negative association between possessing a driver’s license and traveling to inside destinations for entertainment activities in compact and sprawled neighborhoods in Lahore and Rawalpindi. This can be interpreted as indicating that the possession of a driver’s license leads people to choose entertainment destinations located away from residential areas. A driver’s license is an important determinant in predicting the location of entertainment activities. The number of non-commuting trips is positively correlated with carrying out entertainment activities outside the neighborhood in both sprawled and compact districts. As with the driver’s license, this shows how the determinants of socioeconomic characteristics and travel behavior can influence residents’ choices in Pakistan. The findings show a positive relationship between the perception of residents regarding the attractiveness of shops and the choice of entertainment locations outside sprawled and compact neighborhoods. Sense of belonging to the neighborhood is also a significant determinant of choice of entertainment destination in sprawled neighborhoods. People’s perceptions are therefore crucial in predicting the choice of non-commuting destinations in Pakistani cities.
The results of this paper are based on four BL models and Chi-square tests; they show that the characteristics of different urban forms have impacts on travel behavior and neighborhood effect. The differences between the distribution of socioeconomic characteristics travel behavior, and the perception of people in the two neighborhoods was proved by Chi-square tests for gender, daily activity, monthly income, frequency of public transport use, sense of belonging to the neighborhood, quality of social/recreational facilities, and residential location choice.
Perry (1929) defined the neighborhood unit using neighborhood theory. According to this theory, a good neighborhood is achieved on the basis of several principles, including a good design and a sufficient number of schools based on population density [
51]. Isaacs (1948) defined the neighborhood as a basic unit with the physical and social amenities of a town, where residents can experience friendliness, convenience, and safety and have adequate scope for self-expression and citizenship [
52]. The negative correlations in this paper between the sense of belonging to a neighborhood and choosing outside destinations for shopping and recreational activities are in keeping with this conception of neighborhood theory from an American city in 1948. Self-sufficient neighborhoods are neighborhoods that meet the needs and energy supply of residents. In the current paper, we consider the determinants of non-commuting trips for achieving sustainable neighborhoods with fewer non-commuting trips to destinations outside the neighborhood boundaries. A better understanding of the determinants of non-commuting trips in Pakistani cities may help policymakers develop efficient strategies for creating more effective neighborhoods. The findings of this paper show how the socioeconomic characteristics, travel habits, and perceptions of residents in sprawling and compact neighborhoods have correlations with non-commuting trips inside the neighborhoods.
In order to tackle the challenges in sprawling areas and reduce journey times and distances traveled by car, it is necessary to consider the determinants of non-commuting trips by residents of sprawled neighborhoods of Lahore and Rawalpindi. A lack of attractive shops and commercial centers and a sense of dissatisfaction with the quality of recreational facilities in sprawled districts lead people to choose outside destinations for entertainment activities. Urban planners and decision-makers should consider designing neighborhood percentage correct with adequate percentage correct social amenities in order to reduce unnecessary trips outside the neighborhood. The findings of this paper confirm that people in compact neighborhoods use active mobility for shopping trips inside neighborhoods. Pakistani urban strategists could consider well-designed pedestrian and cycle infrastructure in both compact and sprawled areas in order to promote active mobility in non-commuting trips.
Income is a significant variable for non-commuting trips both inside and outside neighborhoods as well as for urban forms. Understanding the impacts of keeping non-commuting trips inside the neighborhood on different income groups is, therefore, key to urban planning in Pakistan. In addition to income, other socioeconomic characteristics that influence the choice of destination of non-commuting trips in Pakistan include gender, age, daily activity, and possession of a driver’s license. In summary, designing or redesigning neighborhoods with attractive social and recreational centers, suitable and adequate walking and cycle ways, and higher density and compact land-use, while considering the needs of different socioeconomic groups, may help promote sustainable and self-sufficient neighborhoods.
The sample size presents a limitation. The data was collected from 861 participants in the survey. A larger sample size could provide a more reliable set of data for modeling non-commuting behavior in Lahore and Rawalpindi. There is, therefore, a need for further research into travel behavior in South Asian cities. This paper has some limitations in collecting data about entertainment and shopping destinations inside and outside the neighborhoods. Further research is necessary to study mobility habits, attitudes, and the perception of residents, demographic and economic features with providing a bigger sample size and representative for the large cities. Furthermore, the number of shopping and entertainment destinations inside and outside the neighborhoods can provide a better understanding of non-commuting trips into inside or outside destinations that can consider in future studies.
6. Conclusions
We generated four percentage-correct binary logistics (BL) models for sprawled and compact neighborhoods in Lahore and Rawalpindi in order to model non-commuting trips inside neighborhoods. A sense of belonging to a neighborhood, frequency of public transport use, residential location choice, mode choice of non-commuting trips to destinations inside and outside neighborhoods, and monthly income are determinants for shopping trips inside compact neighborhoods. Non-commuting trips for shopping activities among those living in sprawled districts correlate with the number of non-commuting trips, mode choice of non-commuting trips outside the neighborhood, frequency of public transport use, attractiveness of shops and income.
We developed two BL models for analyzing the choice of destination of entertainment activities in the two different types of neighborhoods in Lahore and Rawalpindi. There are some similarities and differences in the determinants of choice of destination for entertainment activities between sprawled and compact areas. Age, gender, driver’s license, income, number of non-commuting trips, mode choice for non-commuting trips outside neighborhoods, car ownership and attractiveness of shops in the neighborhood are associated with choosing locations for entertainment activities inside the neighborhood in compact areas. The choice of entertainment destinations for those living in sprawled areas is related to the perceptions of people, including the attractiveness of shops, the quality of social and recreational facilities, a sense of belonging to the neighborhood, and residential location choice. The socioeconomic determinant percentage correct-s of the choice of entertainment locations for residents of sprawled areas are gender, age, driver’s license, number of cars in household and income.
This paper aimed to describe non-commuting travel behavior in two large Pakistani cities as examples of the South Asian context. There is a strong body of research on urban travel in developed countries, while in developing countries, little research has been carried out. Where studies exist, they tend to focus more on commuting trips. While trips to the workplace play an important role in cities, there is a real need for more research into non-commuting trips. Non-commuting trips make up a significant proportion of the total number of trips taken each day in cities. Future studies should attempt to model the relationship between urban forms and travel habits while employing disaggregated data in the context of developing countries.
Author Contributions
Conceptualization, M.M. and H.M.; methodology, M.M.; software, M.M.; validation, M.M., H.M. and A.B.A.; formal analysis, M.M.; investigation, M.M.; resources, M.M. and S.M.G.; data curation, M.M. and S.M.G.; writing—original draft preparation, M.M.; writing—review and editing, H.M. and A.B.A.; visualization, M.M.; supervision, H.M. and A.B.A.; project administration, M.M. All authors have read and agreed to the published version of the manuscript.
Funding
This research received no external funding.
Institutional Review Board Statement
Ethical review and approval were waived for this study.
Informed Consent Statement
Written informed consent has not been obtained from the respondents of the interviews of this study, due to the cultural and socio-political conditions of the countries, in which data were collected.
Data Availability Statement
The data have not been collected using public funds.
Conflicts of Interest
The authors declare no conflict of interest.
Note
| 1 | The data for monthly income was gathered based on the currency of Pakistan (Pakistani Rupee) and then calculated according to the exchange rate in December 2019. |
References
- Morland, K.; Wing, S.; Diez Roux, A.; Poole, C. Neighborhood characteristics associated with the location of food stores and food service places. Am. J. Prev. Med. 2002, 22, 23–29. [Google Scholar] [CrossRef]
- Sampson, R.J.; Morenoff, J.D.; Gannon-Rowley, T. Assessing “Neighborhood Effects”: Social Processes and New Directions in Research. Annu. Rev. Sociol. 2002, 28, 443–478. [Google Scholar] [CrossRef] [Green Version]
- Azmi, D.I.; Karim, H.A. Implications of Walkability Towards Promoting Sustainable Urban Neighbourhood. Procedia Soc. Behav. Sci. 2012, 50, 204–213. [Google Scholar] [CrossRef]
- Jacobs, J. The Death and Life of Grate American Cities; Vintage Book Company: New York, NY, USA, 1961; ISBN 067974195X. [Google Scholar]
- Hunter, A. The Urban NeighBorhood Its Analytical and Social Contexts. Urban Aff. Q. 1979, 14, 267–288. [Google Scholar] [CrossRef]
- Duany, A.; Plater-Zyberk, E.; Speck, J. Suburban Nation: The Rise of Sprawl and the Decline of the American Dream; Macmillan: New York, NY, USA, 2001; ISBN 0865475571. [Google Scholar]
- Khattak, A.J.; Stone, J.R. Traditional Neighborhood Development Trip Generation Study; No. FHWA/NC/2005-05; Letchworth, W.E., Rasmussen, B.K., Schroeder, B.J., Eds.; North Carolina Department of Transportation, Research and Analysis Group: Raleigh, NC, USA, 2005.
- Masoumi, H.E. Neighborhood size in planning large cities of the Middle East and North Africa: Insights to mobility and social interactions. GeoJournal 2019, 84, 257–272. [Google Scholar] [CrossRef]
- Masoumi, H.E. A discrete choice analysis of transport mode choice causality and perceived barriers of sustainable mobility in the MENA region. Transp. Policy 2019, 79, 37–53. [Google Scholar] [CrossRef]
- Mehriar, M.; Masoumi, H.; Nosal-Hoy, K. Correlations of urban sprawl with transport patterns and socioeconomics of university students in cracow, Poland. Sci. J. Silesian Univ. Technol. Ser. Transp. 2020, 108, 159–181. [Google Scholar] [CrossRef]
- Mehriar, M.; Masoumi, H.; Mohino, I. Urban Sprawl, Socioeconomic Features, and Travel Patterns in Middle East Countries: A Case Study in Iran. Sustainability 2020, 12, 9620. [Google Scholar] [CrossRef]
- Acheampong, R.A. Spatial structure, intra-urban commuting patterns and travel mode choice: Analyses of relationships in the Kumasi Metropolis, Ghana. Cities 2020, 96, 102432. [Google Scholar] [CrossRef]
- Obregón-Biosca, S.A.; Romero-Navarrete, J.A.; Mendoza-Sanchez, J.F.; Betanzo-Quezada, E. Impact of Mobility Induced by Urban Sprawl: Case Study of the Querétaro Metropolitan Area. J. Urban Plan. Dev. 2016, 142, 501–505. [Google Scholar] [CrossRef]
- Franklin, B.; Tait, M. Constructing an Image: The Urban Village Concept in the UK. Plan. Theory 2002, 1, 250–272. [Google Scholar] [CrossRef]
- Handy, S.L.; Clifton, K.J. Local shopping as a strategy for reducing automobile travel. Transportation 2001, 28, 317–346. [Google Scholar] [CrossRef]
- Zhao, P. Sustainable urban expansion and transportation in a growing megacity: Consequences of urban sprawl for mobility on the urban fringe of Beijing. Habitat Int. 2010, 34, 236–243. [Google Scholar] [CrossRef]
- Morris, K.S.; McAuley, E.; Motl, R.W. Neighborhood satisfaction, functional limitations, and self-efficacy influences on physical activity in older women. Int. J. Behav. Nutr. Phys. Act. 2008, 5, 13. [Google Scholar] [CrossRef] [PubMed] [Green Version]
- Manaugh, K.; El-Geneidy, A. The importance of neighborhood type dissonance in understanding the effect of the built environment on travel behavior. J. Transp. Land Use 2015, 8, 8. [Google Scholar] [CrossRef] [Green Version]
- Mouratidis, K.; Ettema, D.; Næss, P. Urban form, travel behavior, and travel satisfaction. Transp. Res. Part A Policy Pract. 2019, 129, 306–320. [Google Scholar] [CrossRef]
- Cervero, R. Built environments and mode choice: Toward a normative framework. Transp. Res. Part D Transp. Environ. 2002, 7, 265–284. [Google Scholar] [CrossRef]
- Raktim, M.; Ron, N.B. The influence of neighborhood environment and household travel interactions on school travel behavior: An exploration using geographically-weighted models. J. Transp. Geogr. 2014, 36, 69–78. [Google Scholar] [CrossRef]
- Tait, M. Urban villages as self-sufficient, integrated communities: A case study in London’s Docklands. Urban Des. Int. 2003, 8, 37–52. [Google Scholar] [CrossRef]
- Biermann, S.; Martinus, K. Sufficiency of Employment Self-sufficiency Targets in Reducing the Need to Travel. In Proceedings of the State of Australian Cities Conference 2013 Conference, Sydney, Australia, 26–29 November 2013. [Google Scholar]
- Convery, S.; Williams, B. Determinants of Transport Mode Choice for Non-Commuting Trips: The Roles of Transport, Land Use and Socio-Demographic Characteristics. Urban Sci. 2019, 3, 82. [Google Scholar] [CrossRef] [Green Version]
- Lund, H. Pedestrian Environments and Sense of Community. J. Plan. Educ. Res. 2002, 21, 301–312. [Google Scholar] [CrossRef]
- Rogers, G.O.; Sukolratanametee, S. Neighborhood design and sense of community: Comparing suburban neighborhoods in Houston Texas. Landsc. Urban Plan. 2009, 92, 325–334. [Google Scholar] [CrossRef]
- Park, Y. Does new urbanist neighborhood design affect neighborhood turnover? Land Use Policy 2017, 68, 552–562. [Google Scholar] [CrossRef]
- Lovejoy, K.; Handy, S.; Mokhtarian, P. Neighborhood satisfaction in suburban versus traditional environments: An evaluation of contributing characteristics in eight California neighborhoods. Landsc. Urban Plan. 2010, 97, 37–48. [Google Scholar] [CrossRef]
- Boardman, J.D.; Robert, S.A. Neighborhood Socioeconomic Status and Perceptions of Self-Efficacy. Sociol. Perspect. 2000, 43, 117–136. [Google Scholar] [CrossRef]
- Morenoff, J.D.; Sampson, R.J.; Raudenbush, S.W. Neighborhood inequality, collective efficacy, and the spatial dynamics of urban violence. Criminology 2001, 39, 517–558. [Google Scholar] [CrossRef]
- Dupéré, V.; Leventhal, T.; Vitaro, F. Neighborhood processes, self-efficacy, and adolescent mental health. J. Health Soc. Behav. 2012, 53, 183–198. [Google Scholar] [CrossRef]
- Browing, C.R.; Cagney, K.A. Neighborhood Structural Disadvantage, Collective Efficacy, and Self-Rated Physical Health in an Urban Setting. J. Health Soc. Behav. 2002, 43, 383–399. [Google Scholar] [CrossRef]
- Sampson, R.J.; Morenoff, J.D.; Earls, F. Beyond Social Capital: Spatial Dynamics of Collective Efficacy for Children. Am. Sociol. Assoc. 1999, 64, 633–660. [Google Scholar] [CrossRef]
- Aziz, A.; Ahmad, I.; Mayo, S.M.; Hameed, R.; Nadeem, O. Urbanization and Its Impacts on Founded Areas of Big Cities in Pakistan: Case Studies of “Ichra” and “Sanda” Areas in Lahore. Tech. J. Univ. Eng. Technol. Taxila Pak. 2015, 20, 71–75. [Google Scholar]
- Soltani, A.; Pojani, D.; Askari, S.; Masoumi, H.E. Socio-demographic and built environment determinants of car use among older adults in Iran. J. Transp. Geogr. 2018, 68, 109–117. [Google Scholar] [CrossRef] [Green Version]
- Al-Rashid, M.A.; Goh, H.C.; Harumain, Y.A.S.; Ali, Z.; Campisi, T.; Mahmood, T. Psychosocial Barriers of Public Transport Use and Social Exclusion among Older Adults: Empirical Evidence from Lahore, Pakistan. Int. J. Environ. Res. Public Health 2020, 18, 185. [Google Scholar] [CrossRef]
- Ranagalage, M.; Wang, R.; Gunarathna, M.H.J.P.; Dissanayake, D.M.S.L.B.; Murayama, Y.; Simwanda, M. Spatial Forecasting of the Landscape in Rapidly Urbanizing Hill Stations of South Asia: A Case Study of Nuwara Eliya, Sri Lanka (1996–2037). Remote Sens. 2019, 11, 1743. [Google Scholar] [CrossRef] [Green Version]
- Aldogom, D.; Aburaed, N.; Al-Saad, M.; Al Mansoor, S.; Al Shamsi, R. Multi temporal satellite images for growth detection and urban sprawl analysis; Dubai City, UAE. In Proceedings of the Remote Sensing Technologies and Applications in Urban Environments, Strasbourg, France, 2 October 2019; Maazmi, A., Ahmed, A., Eds.; SPIE: Bellingham, WA, USA, 2019. [Google Scholar]
- Saini, V.; Tiwari, R.K. A systematic review of urban sprawl studies in India: A geospatial data perspective. Arab. J. Geosci. 2020, 13, 1–21. [Google Scholar] [CrossRef]
- Anwar, N.; Sawas, A.; Mustafa, D.; Viqar, S.; Iqtidar, H. Urbanization, Gender and Violence in Rawalpindi and Islamabad: A Scoping Study; SAIC Scoping Study; King’s College London, Department of Geography: London, UK, 2014; pp. 2–124. [Google Scholar] [CrossRef]
- Rana, I.A.; Bhatti, S.S. Lahore, Pakistan—Urbanization challenges and opportunities. Cities 2018, 72, 348–355. [Google Scholar] [CrossRef]
- Bhatti, S.S.; Tripathi, N.K.; Nitivattananon, V.; Rana, I.A.; Mozumder, C. A multi-scale modeling approach for simulating urbanization in a metropolitan region. Habitat Int. 2015, 50, 354–365. [Google Scholar] [CrossRef] [Green Version]
- Pakistan Bureau of Statistics. Population of Major Cities Census; Pakistan Bureau of Statistics: Islamabad, Pakistan, 2017.
- Ul Haq, F.; Naeem, U.A.; Gabriel, H.F.; Khan, N.M.; Ahmad, I.; Ur Rehman, H.; Zafar, M.A. Impact of Urbanization on Groundwater Levels in Rawalpindi City, Pakistan. Pure Appl. Geophys. 2021, 178, 491–500. [Google Scholar] [CrossRef]
- Bramley, G.; Power, S. Urban form and social sustainability: The role of density and housing type. Environ. Plan. B 2009, 36, 30–48. [Google Scholar] [CrossRef]
- De Ridder, K.; Lefebre, F.; Adriaensen, S.; Arnold, U.; Beckroege, W.; Bronner, C.; Damsgaard, O.; Dostal, I.; Dufek, J.; Hirsch, J.; et al. Simulating the impact of urban sprawl on air quality and population exposure in the German Ruhr area. Part II: Development and evaluation of an urban growth scenario. Atmos. Environ. 2008, 42, 7070–7077. [Google Scholar] [CrossRef]
- Marquet, O.; Miralles-Guasch, C. The Walkable city and the importance of the proximity environments for Barcelona’s everyday mobility. Cities 2015, 42, 258–266. [Google Scholar] [CrossRef]
- Loo, B.P.Y. Realising car-free developments within compact cities. Proc. Inst. Civ. Eng. Munic. Eng. 2018, 171, 41–50. [Google Scholar] [CrossRef] [Green Version]
- Satariano, W.A.; Ivey, S.L.; Kurtovich, E.; Kealey, M.; Hubbard, A.E.; Bayles, C.M.; Bryant, L.L.; Hunter, R.H.; Prohaska, T.R. Lower-body function, neighborhoods, and walking in an older population. Am. J. Prev. Med. 2010, 38, 419–428. [Google Scholar] [CrossRef] [PubMed]
- Vich, G.; Marquet, O.; Miralles-Guasch, C. Green streetscape and walking: Exploring active mobility patterns in dense and compact cities. J. Transp. Health 2019, 12, 50–59. [Google Scholar] [CrossRef]
- Perry, C.A. City Planning for Neighborhood Life. Soc. Forces 1929, 8, 98–100. [Google Scholar] [CrossRef]
- Isaacs, R.R. The Neighborhood Theory: An Analysis of its Adequacy. J. Am. Inst. Plan. 1948, 14, 15–23. [Google Scholar] [CrossRef]
| Publisher’s Note: MDPI stays neutral with regard to jurisdictional claims in published maps and institutional affiliations. |
© 2021 by the authors. Licensee MDPI, Basel, Switzerland. This article is an open access article distributed under the terms and conditions of the Creative Commons Attribution (CC BY) license (https://creativecommons.org/licenses/by/4.0/).


