1. Introduction
In recent decades, in many countries, interest has increased regarding studies examining the influence of modern climate warming on the evolution of the thermal state of the upper horizons of the permafrost under natural conditions and in disturbed areas. It has become one of the priorities of geocryological research, which is of great scientific and practical importance.
According to the results of long-term observations in different regions, researchers have established the effects of modern climate warming on the thermal state of permafrost, and consider the warming of permafrost to be a fact [
1,
2,
3,
4,
5,
6,
7]. Etzelmuller et al. [
1] analyzed the dynamics of the cryolithozone in mountainous regions of Europe over the past 20 years via seven boreholes with a depth of at least 100 m. At a depth of 20 m, the increase in ground temperature was 1.5 °C in Spitsbergen and 0.4 °C in the Alps. The active layer thickness in all areas increased from 10 to 200% [
1]. According to in situ measurements on 124 undisturbed sites in the north-west of Canada, Kokelj et al. [
2] found a change in the mean annual ground temperature from −3 °C in boreal forests to −7 °C in shrub tundra. The increase in ground temperature is caused by disturbances in natural conditions, such as landslides, lake drainage, forest fires, mud ponds, and roadslides. In this region, the thermal disequilibrium in permafrost in the highly icy peatlands of forest ecosystems was noted by Mors et al. [
3]. The increase in active layer thickness over 41 years in the north of Sweden, 23 years in the northeast of Greenland, and 19 years in central Svalbard was indicated by Strand et al. [
4], showing the difference in the interannual variability of the active layer’s thickness in neighboring areas under the influence of snow cover and relief. The relationship between climate change and ground temperature has also been analyzed [
5,
6,
7].
In the context of significant climatic changes in recent decades in Central Yakutia, the most densely populated and promising region for agricultural and industrial development, constant information about the response of the cryolithozone to modern warming is essential.
The first systematic temperature observations in boreholes up to 10–15 m deep were carried out by permafrost scientists in 1935. Research has revealed patterns of temperature and thawing depth changes under the influence of vegetation and snow cover, the “culture layer”, and geological and geomorphological conditions [
8,
9]. In the 1940s, at the experimental plots of the Yakutsk research permafrost station, year-round experimental observations of changes in the temperature regime of soils under natural conditions, under heat-insulating coatings, while removing snow and grass cover, were organized [
10,
11,
12]. In the 1950s and 1960s, more detailed complex thermophysical observations of the formation of the thermal regime of rocks were organized under the leadership of N.S. Ivanov [
13], according to an improved method, on the experimental plots of the north-eastern branch of the Permafrost Institute of the USSR Academy of Sciences (MPI SB RAS).
Local and regional patterns of formation in the ground thermal regime have been revealed at great detail with the widespread use of seasonal stationary research methods [
14,
15]. In the 1960–1980s, a significantly expanded program of year-round heat balance studies was carried out at the Yakutsk, Syrdakh, Zeleny Lug, and Chabyda stations [
16,
17,
18,
19]. Natural and disturbed landscapes were assessed, and daily, seasonal, and annual courses of heat exchange were studied in detail. In addition, several new mathematical models of the freezing–thawing of soils were developed. The duration of laborious stationary year-round observations did not exceed six years. The hydrothermal regime in cropland and reclamation area soils was assessed at the seasonal stations of Khatassy, Khorobut, and Amga [
20,
21]. In the 1990s, experimental studies at the Spasskaya Pad and Neleger stations were started under the international programs “GEWEX-GAME” and “JST-CREST”, with joint Russian–Japanese and Russian–Dutch control. Based on these works, the long-term dynamics of the upper horizons of permafrost temperature, the soil moisture regime, the active layer’s thickness, the water–heat balance, and the carbon flows were studied [
22]. At present, monitoring studies for ground thermal regimes are being carried out by the MPI SB RAS at the stations Chabyda and Yakutsk, on the following sites: the northern section of the railroad routes Tommot-Yakutsk, Yukechi, Umaibyt, Kerdyugen, and others.
The results of studies on the thermal state of ground evolution for the period from the III International Geophysical Year (1957/59) to the IV International Polar Year (2007/08) in Russian territory were summarized by Pavlov [
23]. Romanovsky et al. [
24] estimated the thermal state of the permafrost zone in Russia over the past 20–30 years, but Central Yakutia was not included in this review. Changes in climate and the thermal state of the permafrost’s upper horizons in Central Yakutia under natural conditions over the last 30–40 years were studied by Varlamov et al. [
25,
26,
27,
28] and Skachkov et al. [
29]. The results of geocryological monitoring have been released by the Federal Service for Hydrometeorology and Environmental Monitoring [
30,
31]. A significant number of long-term observation series have been collected that have no analogues in Central Yakutia. The information obtained makes it possible to assess the response of the upper horizons of the permafrost to the climatic fluctuations of the last few decades.
Since the early 1990s, a unified system for observing the state of the geological environment in the territory that undergoes perennial and seasonal freezing of the Earth’s crust, as well as assessing, monitoring, and predicting its changes under the influence of natural, climatic, and technogenic factors, began to be defined as the monitoring of the permafrost zone. Thus, permafrost monitoring makes it possible to determine the evolution of permafrost under a changing climate and with human activities [
23,
32].
Active layer thickness (ξ), mean annual ground temperatures at the bottom of the active layer thickness (Tξ), and depth of zero amplitude (T0) are the main thermal parameters that can indicate the thermal evolution of the upper horizons of permafrost under climate warming.
The main purpose of this article is to assess the spatiotemporal variability in the thermal state of grounds in valley landscapes, as the most inhabited and fertile lands in Yakutia. The informational basis of the ground thermal regime was the materials taken from the Yakutsk stations on a low above-floodplain terrace (1968–1979; since 1995, observations have been taken at two sites: meadow and forest) and Zeleny Lug in the floodplain (1977–1978 and 1986–1989), as well as from polygons and sites on a low above-floodplain terrace in the Tuymaada Valley (1986–2016).
Our study carried out the following: a route survey of the landscape conditions of the territory, the selection of objects, the organization of an observation network system, the analysis of data from long-term observations of meteorological stations, the conducting of routine observations at monitoring sites, generalization, and the analysis of the materials obtained.
2. Research Objects and Methods
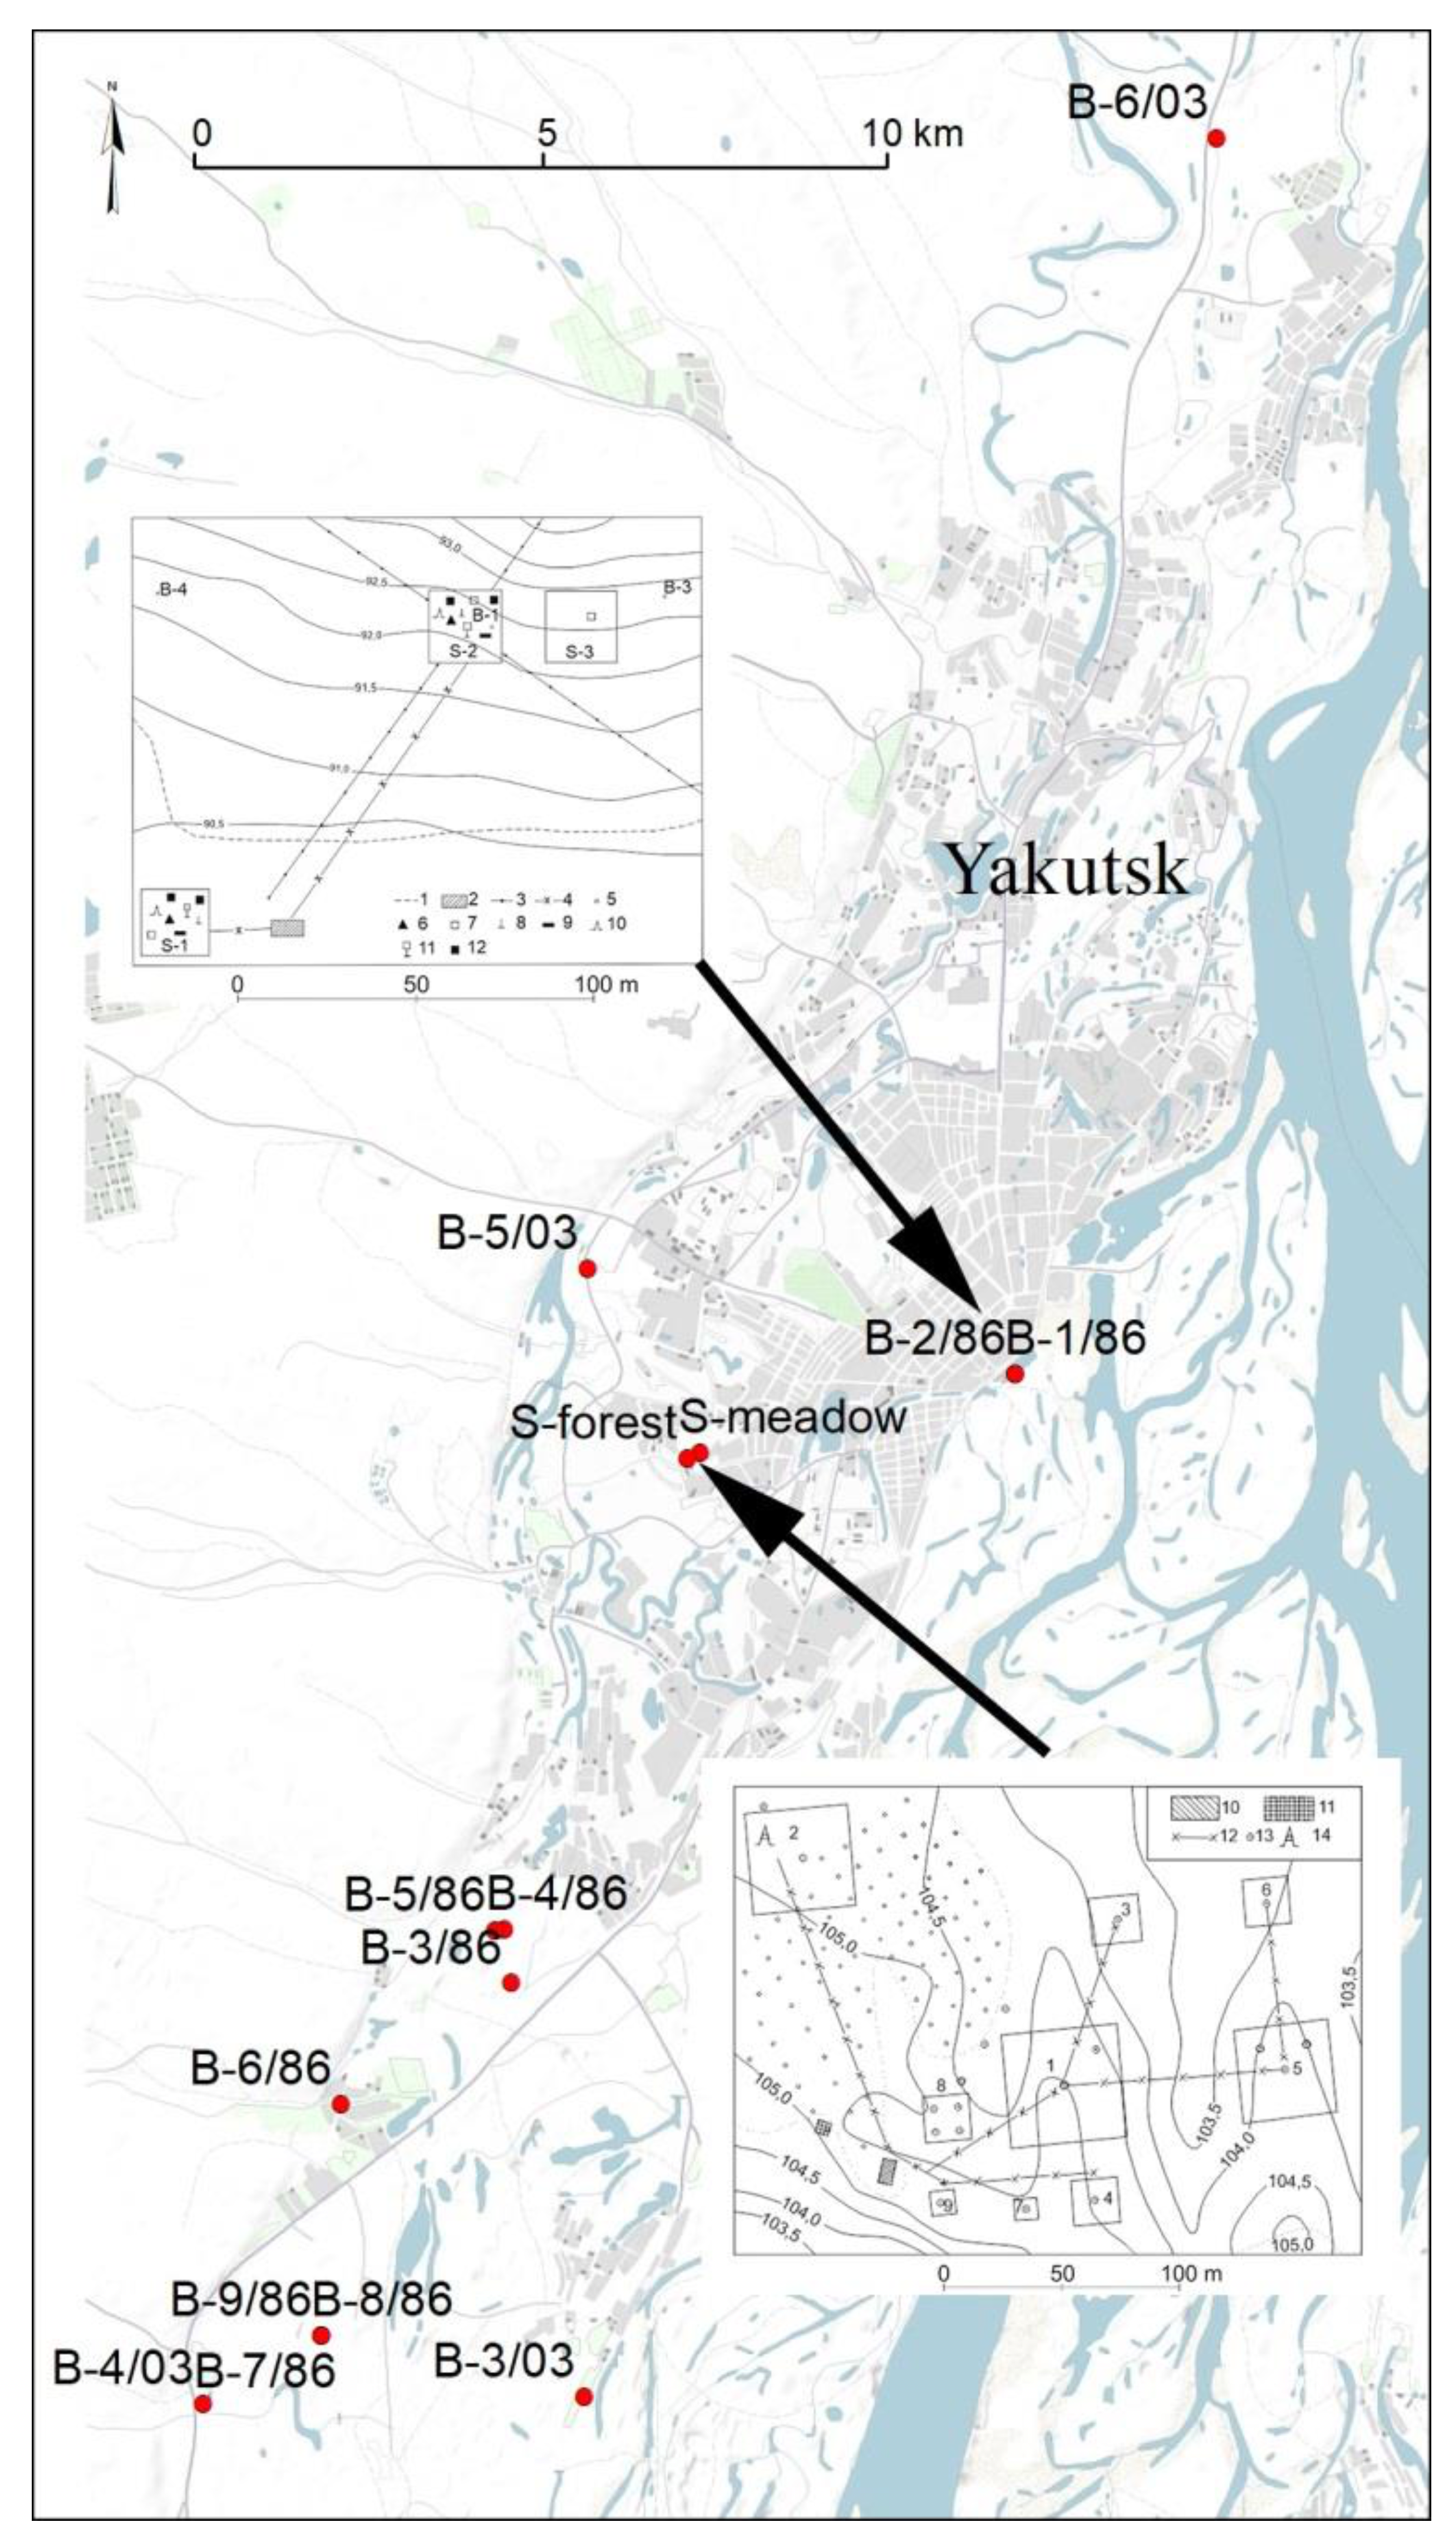
The Tuymaada Valley is located in the middle taiga zone at the same latitude as Yakutsk. It is characterized by valley meadow and forest landscape complexes of floodplain and above floodplain–low-terraced areas (
Figure 1). Several publications have described these observation sites and their locations [
18,
19]. The objects of our research are the depth of zero amplitude and the layer of annual temperature fluctuations (upper 10–15 m).
Investigations of the ground thermal regime have been carried out based on landscape and monitoring methods. Landscape research involves remote and terrestrial study, landscape systematization, and cartographic generalization. The selection of objects and the organization of the monitoring of the thermal state of the upper horizons of permafrost are based on landscape investigation. Experimental studies were organized on two types of terrain: floodplain and above floodplain–low-terraced areas in the Yakutsk area.
The Yakutsk station (renamed “Tuymaada” in 2006), established in 1968 under the leadership of A.V. Pavlov [
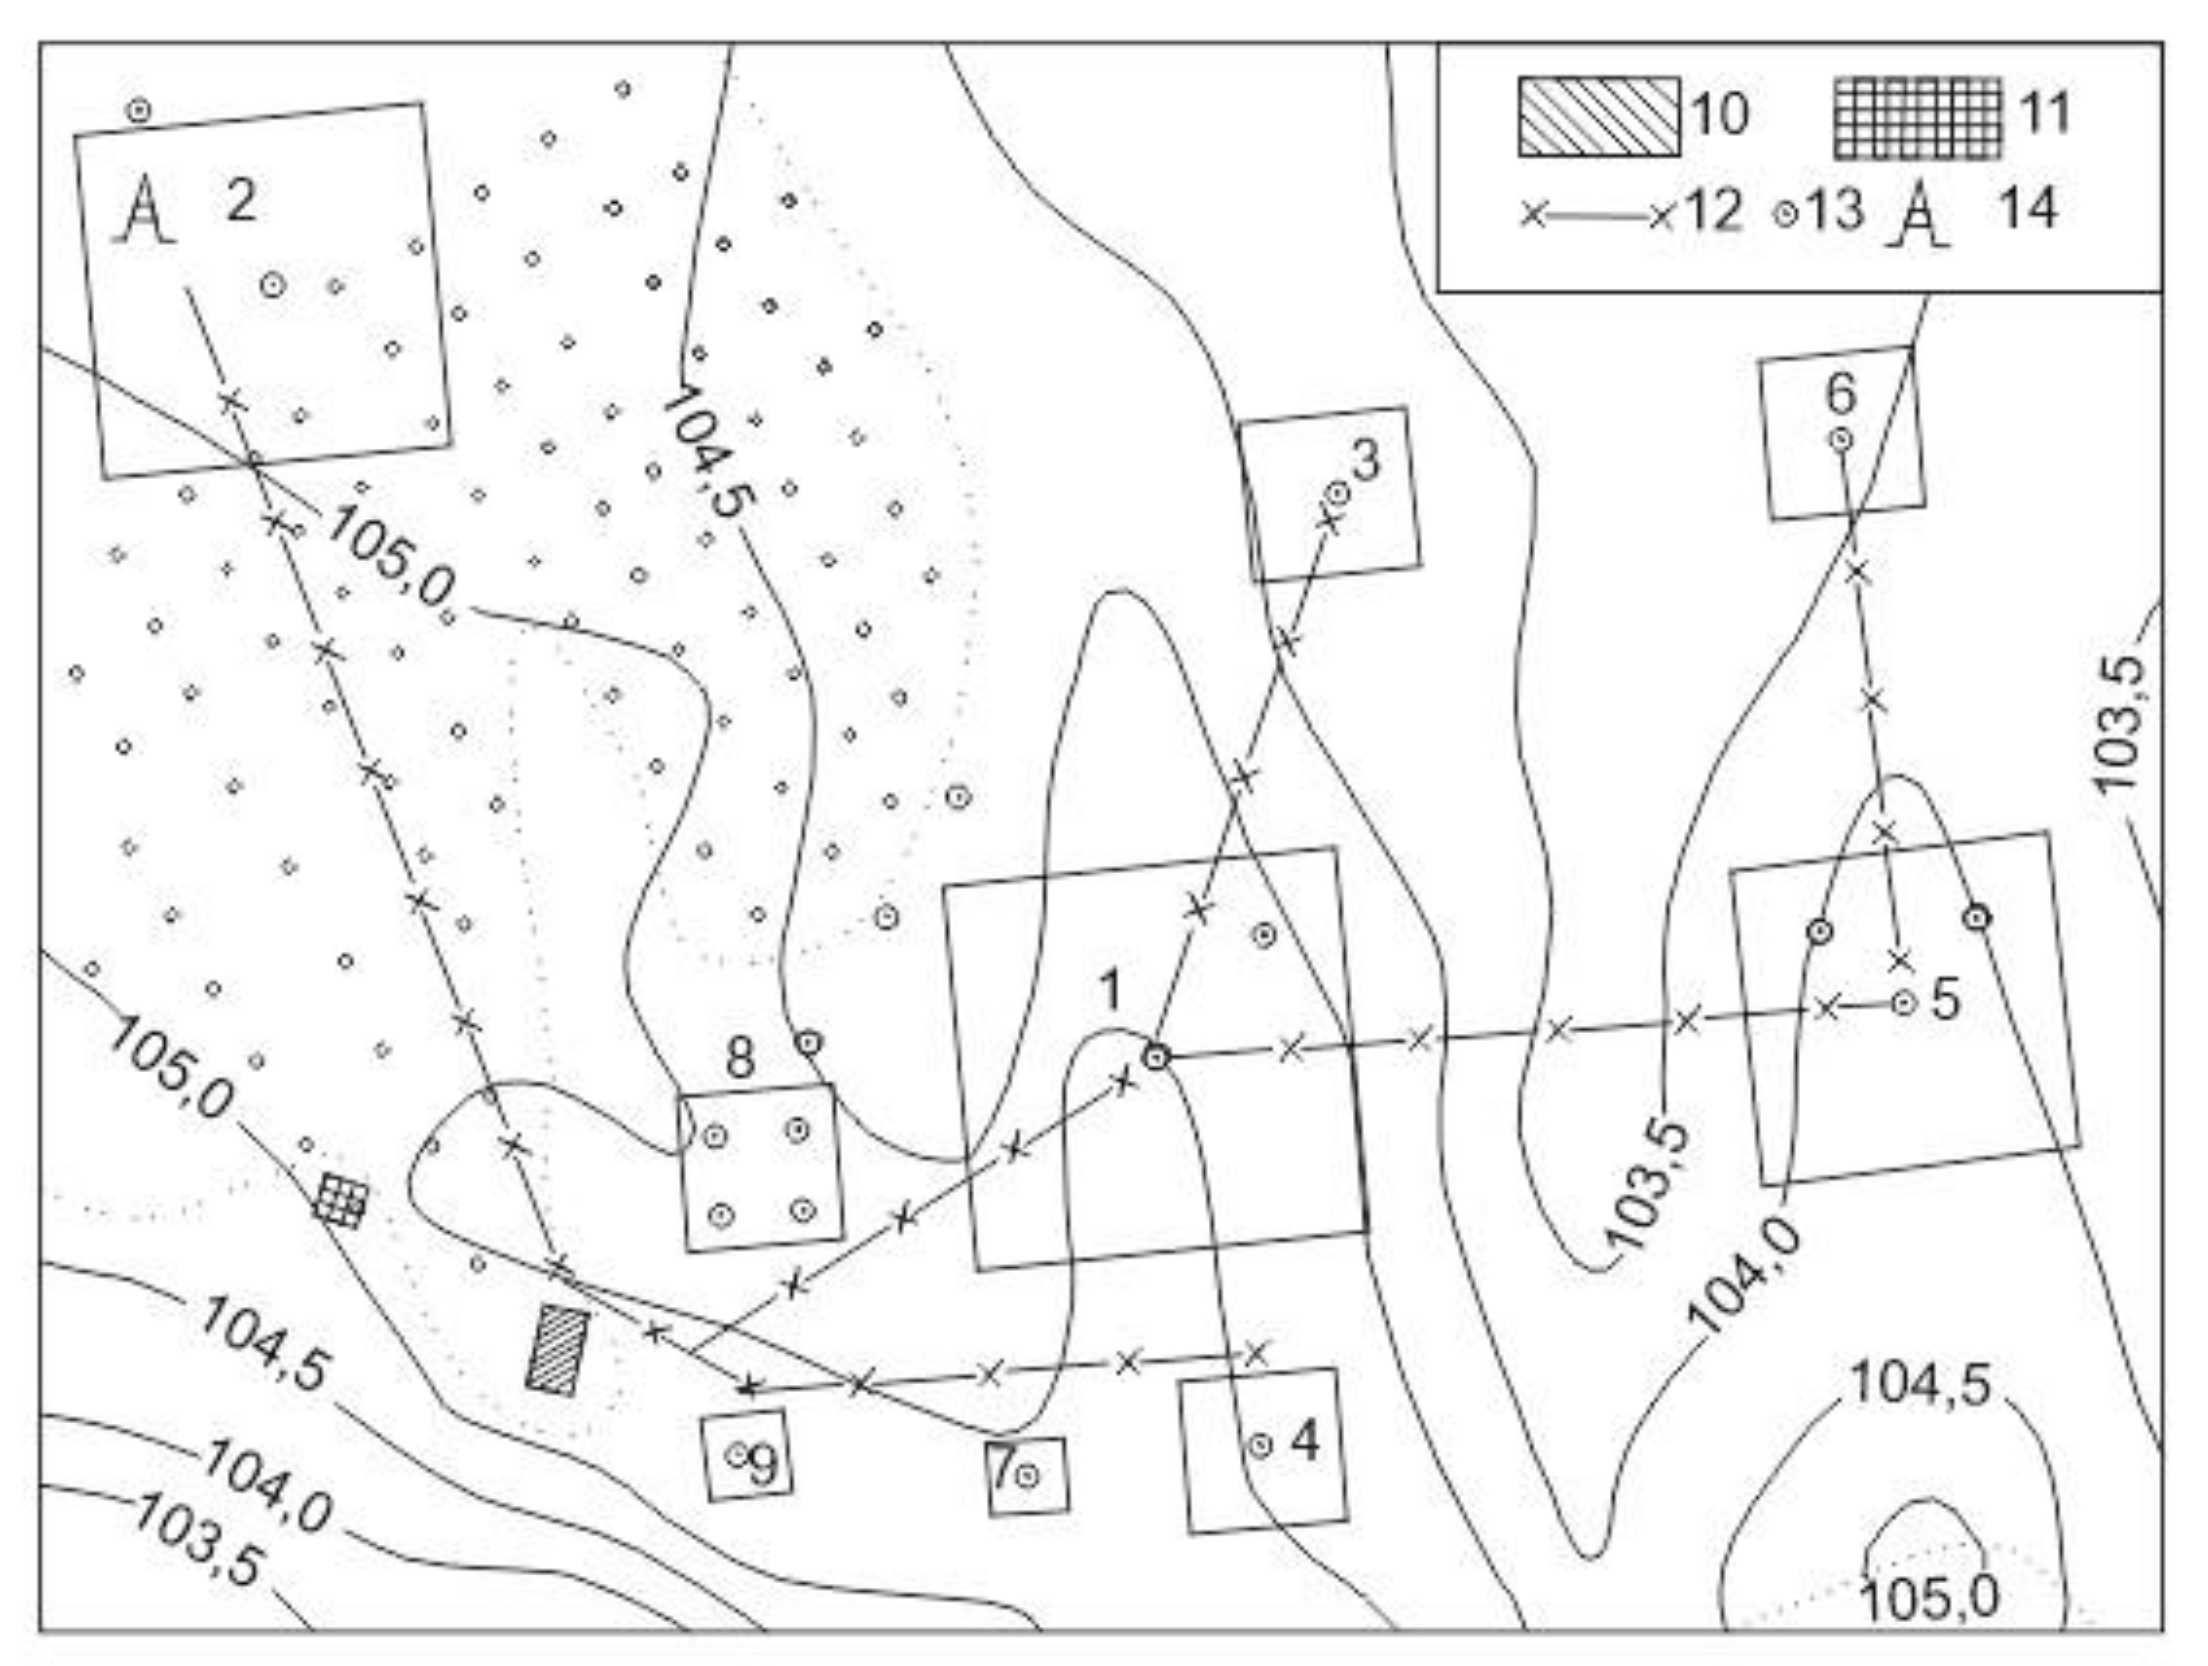
16], was designed to solve the problems of agricultural production, mining, and road and hydraulic engineering in Yakutia. The station is located on the second terrace of the Lena River on the territory of the Melnikov Permafrost Institute of the Siberian Branch of the Russian Academy of Sciences (
Figure 2). Observations began in 1969 at nine specially equipped experimental plots with the following: (1) natural grass and undisturbed snow cover, (2) in a pine forest, (3) stripped surface, (4) asphalted, (5,6,7) coatings made of synthetic materials (polystyrene, films), (8) plank flooring in the form of a canopy, and (9) artificial moisture. In the research, which continued until 1979, the daily, seasonal, and annual heat exchange variations were studied in detail, and several new mathematical models of the freezing–thawing of grounds were developed. The observations’ results have been summarized in numerous publications, including five monographs by Pavlov [
16,
17,
23,
33,
34].
Plot 1 is a natural plot located in the middle of a clearing on the elevated surface of the mane above the floodplain terrace. The grass cover is not closed and is represented by grains and forbs. The lithological section of deposits within the sand ridge is relatively homogeneous: it has a 0.2–0.3 m sod–vegetation layer; a 0.2–0.3 to 0.6 m sand silt layer; and then a sand layer that is fine-grained at the beginning with interlayers of sandy loam, before comprising plant detritus and pebbles. Areas 4, 5, 7, 8, and 9 are located on a sand ridge with a similar grass cover to site 1. Areas 3 and 6 are located in an interridge depression, between the crests of the same meadow with abundant grass.
Plot 2 is located on a sand ridge in a pine forest, 200 m from site 1. The taxation characteristics of the pine forest are as follows: age 50–70 years, bonitet V, crown closure 0.3–0.4, the average height of trees is 9–10 m, the overall trunk diameter is 10–15 cm, and the number of trunks per hectare is 1200–1300 without regrowth. In the grass cover under the forest canopy, forbs are found, but bearberry predominates; the soil coverage is about 70%. Therefore, the forest is bearberry pine. The forest litter consists of needles, moss, roots, and various rotten and semi-rotten remains; it has a thickness of only 0.02–0.03 m.
One of the possible options for the expansion of the city of Yakutsk is the construction of a residential microdistrict on the flooded territory of the river Lena, called “Zeleny Lug” (“Green Meadow”). The construction was supposed to be carried out by creating an alluvial embankment on an area of hundreds of hectares. A huge reclamation project in an area of permafrost has been carried out for the first time.
In 1977–1978, an embankment 6.5 m high in the central part was built using two-stage hydraulic flooding on a section of the Lena River floodplain, adjacent to the eastern outskirts of Yakutsk. Sand for reclamation was taken from the bottom of the city channel of the Lena River. On the embankment and the adjacent territory of the natural floodplain, the Permafrost Institute of the Siberian Branch of the USSR Academy of Sciences (PI SB USSR AS) carried out a series of thermophysical studies in 1978–1980. Their main task was to determine the parameters (moisture, density, and thermophysical characteristics of the alluvial and natural peat soils of the floodplain; radiation characteristics; snow cover; and permafrost state of the underlying soils) that determine the thermal regime of the embankment, which serves as the foundation of structures. Additionally, an assessment of the changes in the thermal regime of the embankment and its underlying grounds was modelled for the next 10–20 years. The calculation of changes in the permafrost regime of the embankment and the underlying floodplain grounds was carried out on a computer [
35].
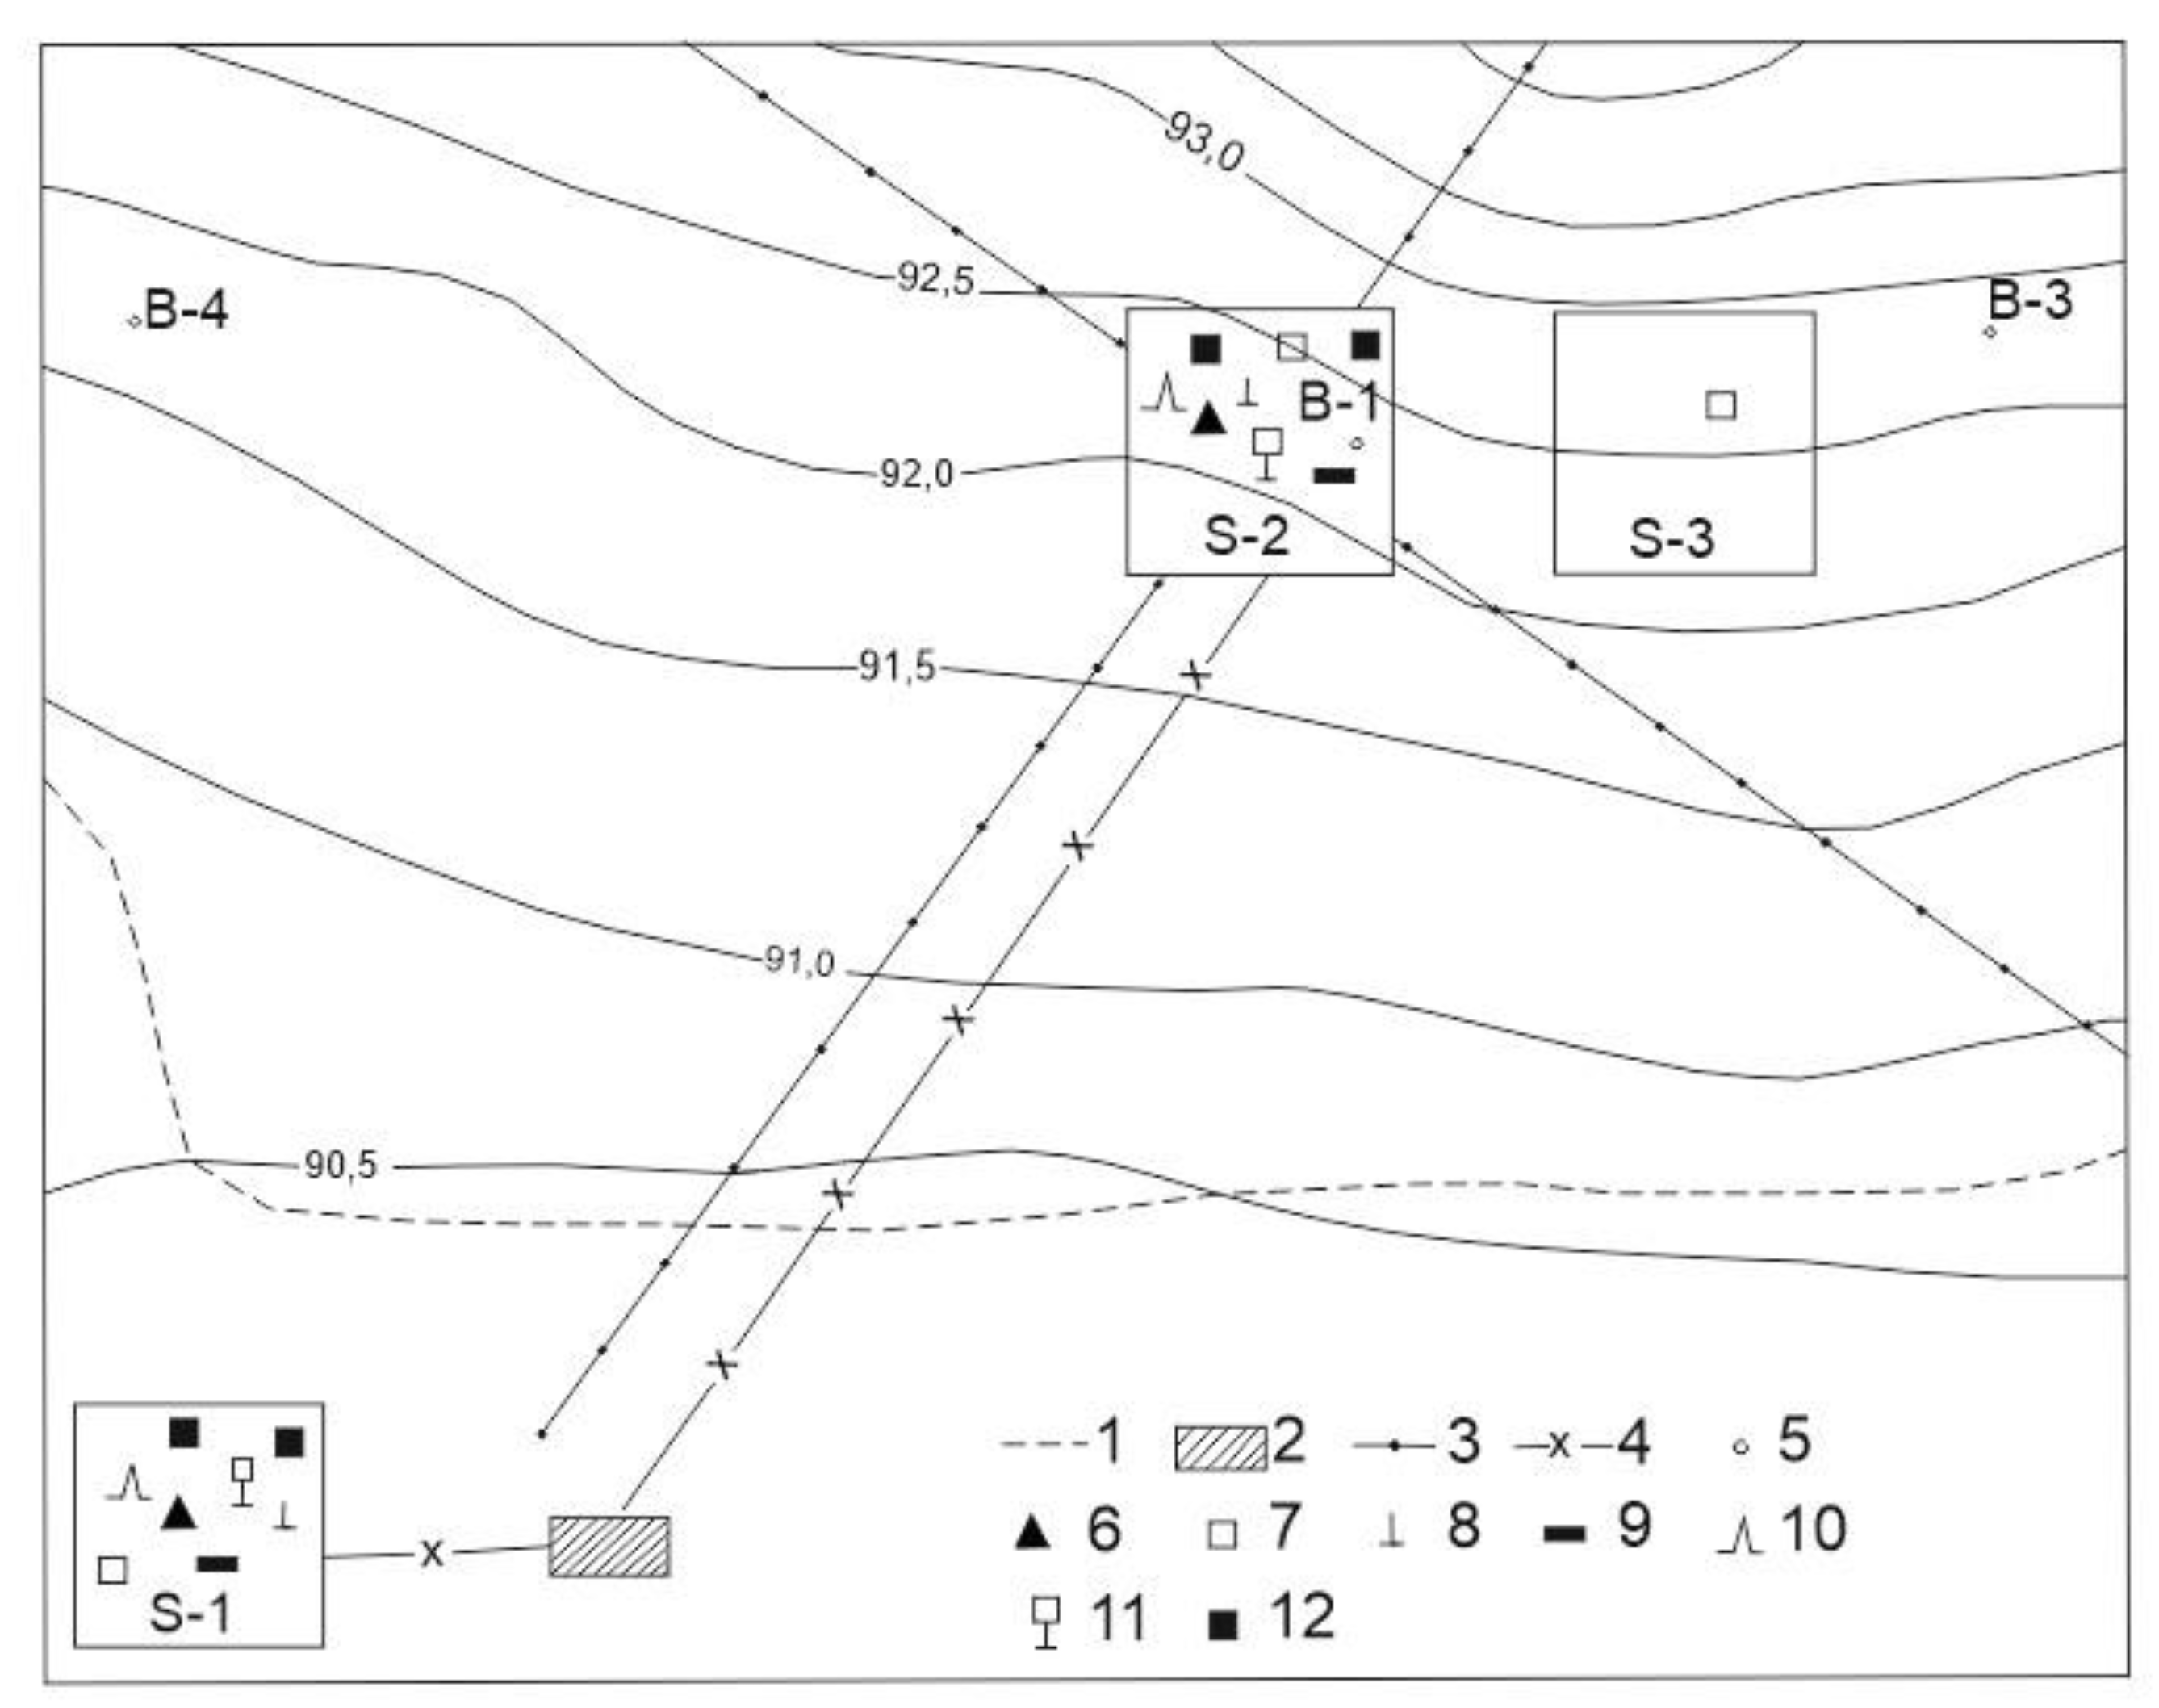
The solution of these problems required the construction of a heat balance station, drilling deep boreholes (one 100 m deep) and performing geothermal observations, undertaking laboratory and fieldwork to study the thermal conductivity of soils, and preparing an engineering forecast for the temperature regime of the embankment and foundation. At the heat balance station, two main experimental sites were performed: (1) on a natural floodplain meadow, and (2) on a section of an experimental embankment with a 3.5 m thick reclaimed layer. At additional site 3 (
Figure 3), with periodically compacted snow cover, observations were made regarding the freezing–thawing of grounds and the snow cover.
The annual cycle of studies carried out by PI SB USSR AS in the vicinity of Yakutsk in October 1986–September 1987 makes it possible to estimate the spatial and temporal variability in the parameters of the ground thermal regime in the floodplain and in the low-terraced terrain. In the summer of 1986, nine experimental sites were established, where 10-m thermometric boreholes were drilled, of which two were located near the Zeleny Lug station (see
Figure 1). Temperature measurements were taken once a decade, from August 1986 to September 1987.
At the Tuymaada station, ground temperature measurements were carried out in 15 m deep boreholes on two plots using a thermistor. Frequency of measurements: once a month (15th day). In winter, in parallel, observations were made of the snow cover dynamics on the plots and the active layer thickness at the end of the warm period (September). In 2009, a 70-m thermometric borehole was drilled at the Lug site to determine the penetration depth of the current climatic warming.
Since 1995, the authors have conducted 25 annual observations at the station on ground temperatures and active layer thickness. The material collected, to date, makes it possible to estimate the depth of zero amplitude and to determine the tendencies in the thermal state of the upper horizons of the permafrost.
The series of observations made at monitoring sites includes permafrost landscapes, cryogenic processes and phenomena, composition, structure, temperature, moisture content and volumetric weight, the thawing of grounds, the thermal conductivity of organic covers and soil, and the thickness and density of snow cover.
We used semiconductor thermistors (MMT-4) for ground temperature recording, with a measurement accuracy of 0.1 °C. In the boreholes, ground temperature measurements were taken with thermistor strings at depths of 1, 2, 3, 4, 6, 8, and 10 m. In these boreholes, thermistors have been permanently installed, i.e., their trunks have been filled with previously extracted soil. The seasonal thaw depth is determined by probing with a metal probe and by hand drilling. The generalization and analysis of observations made at different monitoring stages are presented in several articles [
18,
19].
Thermal observations were carried out according to a more abbreviated program, on the 15th day of each month. Measurements of ground temperature taken once in the middle of the month at a depth below 1 m can be considered representative for a comparative analysis [
19]. Furthermore, the snow depth was observed monthly in winter, and active layer thickness was observed at the end of the warm season. Thus, the geothermal monitoring method has shown its reliability, and it can be successfully used in different natural and climatic conditions.
3. Research Results and Discussion
The formation of the thermal regime is influenced by external (solar radiation, air temperature, and precipitation) and internal (soil moisture content and lithological composition) factors. In addition, snow, vegetation, and ground cover play important roles.
3.1. Dynamics of the Modern Climate
In Central Yakutia, since the second half of the 1960s, one of the highest trends in Russian mean annual air temperature (up to 0.07 °C/year) has been observed [
37]. The beginning of the 21st century (2001–2019) was the warmest period in the entire history of meteorological observations in Yakutsk, namely −7.7 °C, with a norm of 10.0 °C. The assessment of expected trends in air temperature change in the 21st century is ambiguous. Climate change predictions, compiled by Voeikov’s Main Geophysical Observatory (MGO), based on the results of the extrapolation of climatic characteristics, show that the observed increasing trend in the mean annual air temperature in Russia by 2010–2015 will remain, and will lead to an increase (in comparison with 2000) of 0.6 ± 0.2 °C, reaching 1.5 °C by 2030. A further increase in precipitation is also predicted, mainly due to its growth in the cold period. An increase in winter precipitation of 7–9% in the north of Eastern Siberia is expected, and an increase in snow accumulation by 2–4% is also expected [
38]. At the end of the 21th century in Eastern Siberia, an increase of 6.1 ± 1.6 °C in the mean annual air temperature is expected, compared with the average values of the last two decades of the 20th century [
39]. The forecast of changes in the mean annual air temperature in Yakutsk up until 2015, compiled at the MPI SB RAS via harmonic analysis, almost coincides with the forecast of the MGO, after which cooling by 2–3 °C is expected up until the middle of the 21st century [
40,
41]. According to the forecast of Neradovsky and Skachkov [
42], by 2050, the increase in the mean annual air temperature will exceed the achieved climatic level by no more than 0.7–1.0 °C. Researchers are particularly concerned about the projected increase in winter precipitation and snow accumulation, which are the primary influences in the rise in ground temperature.
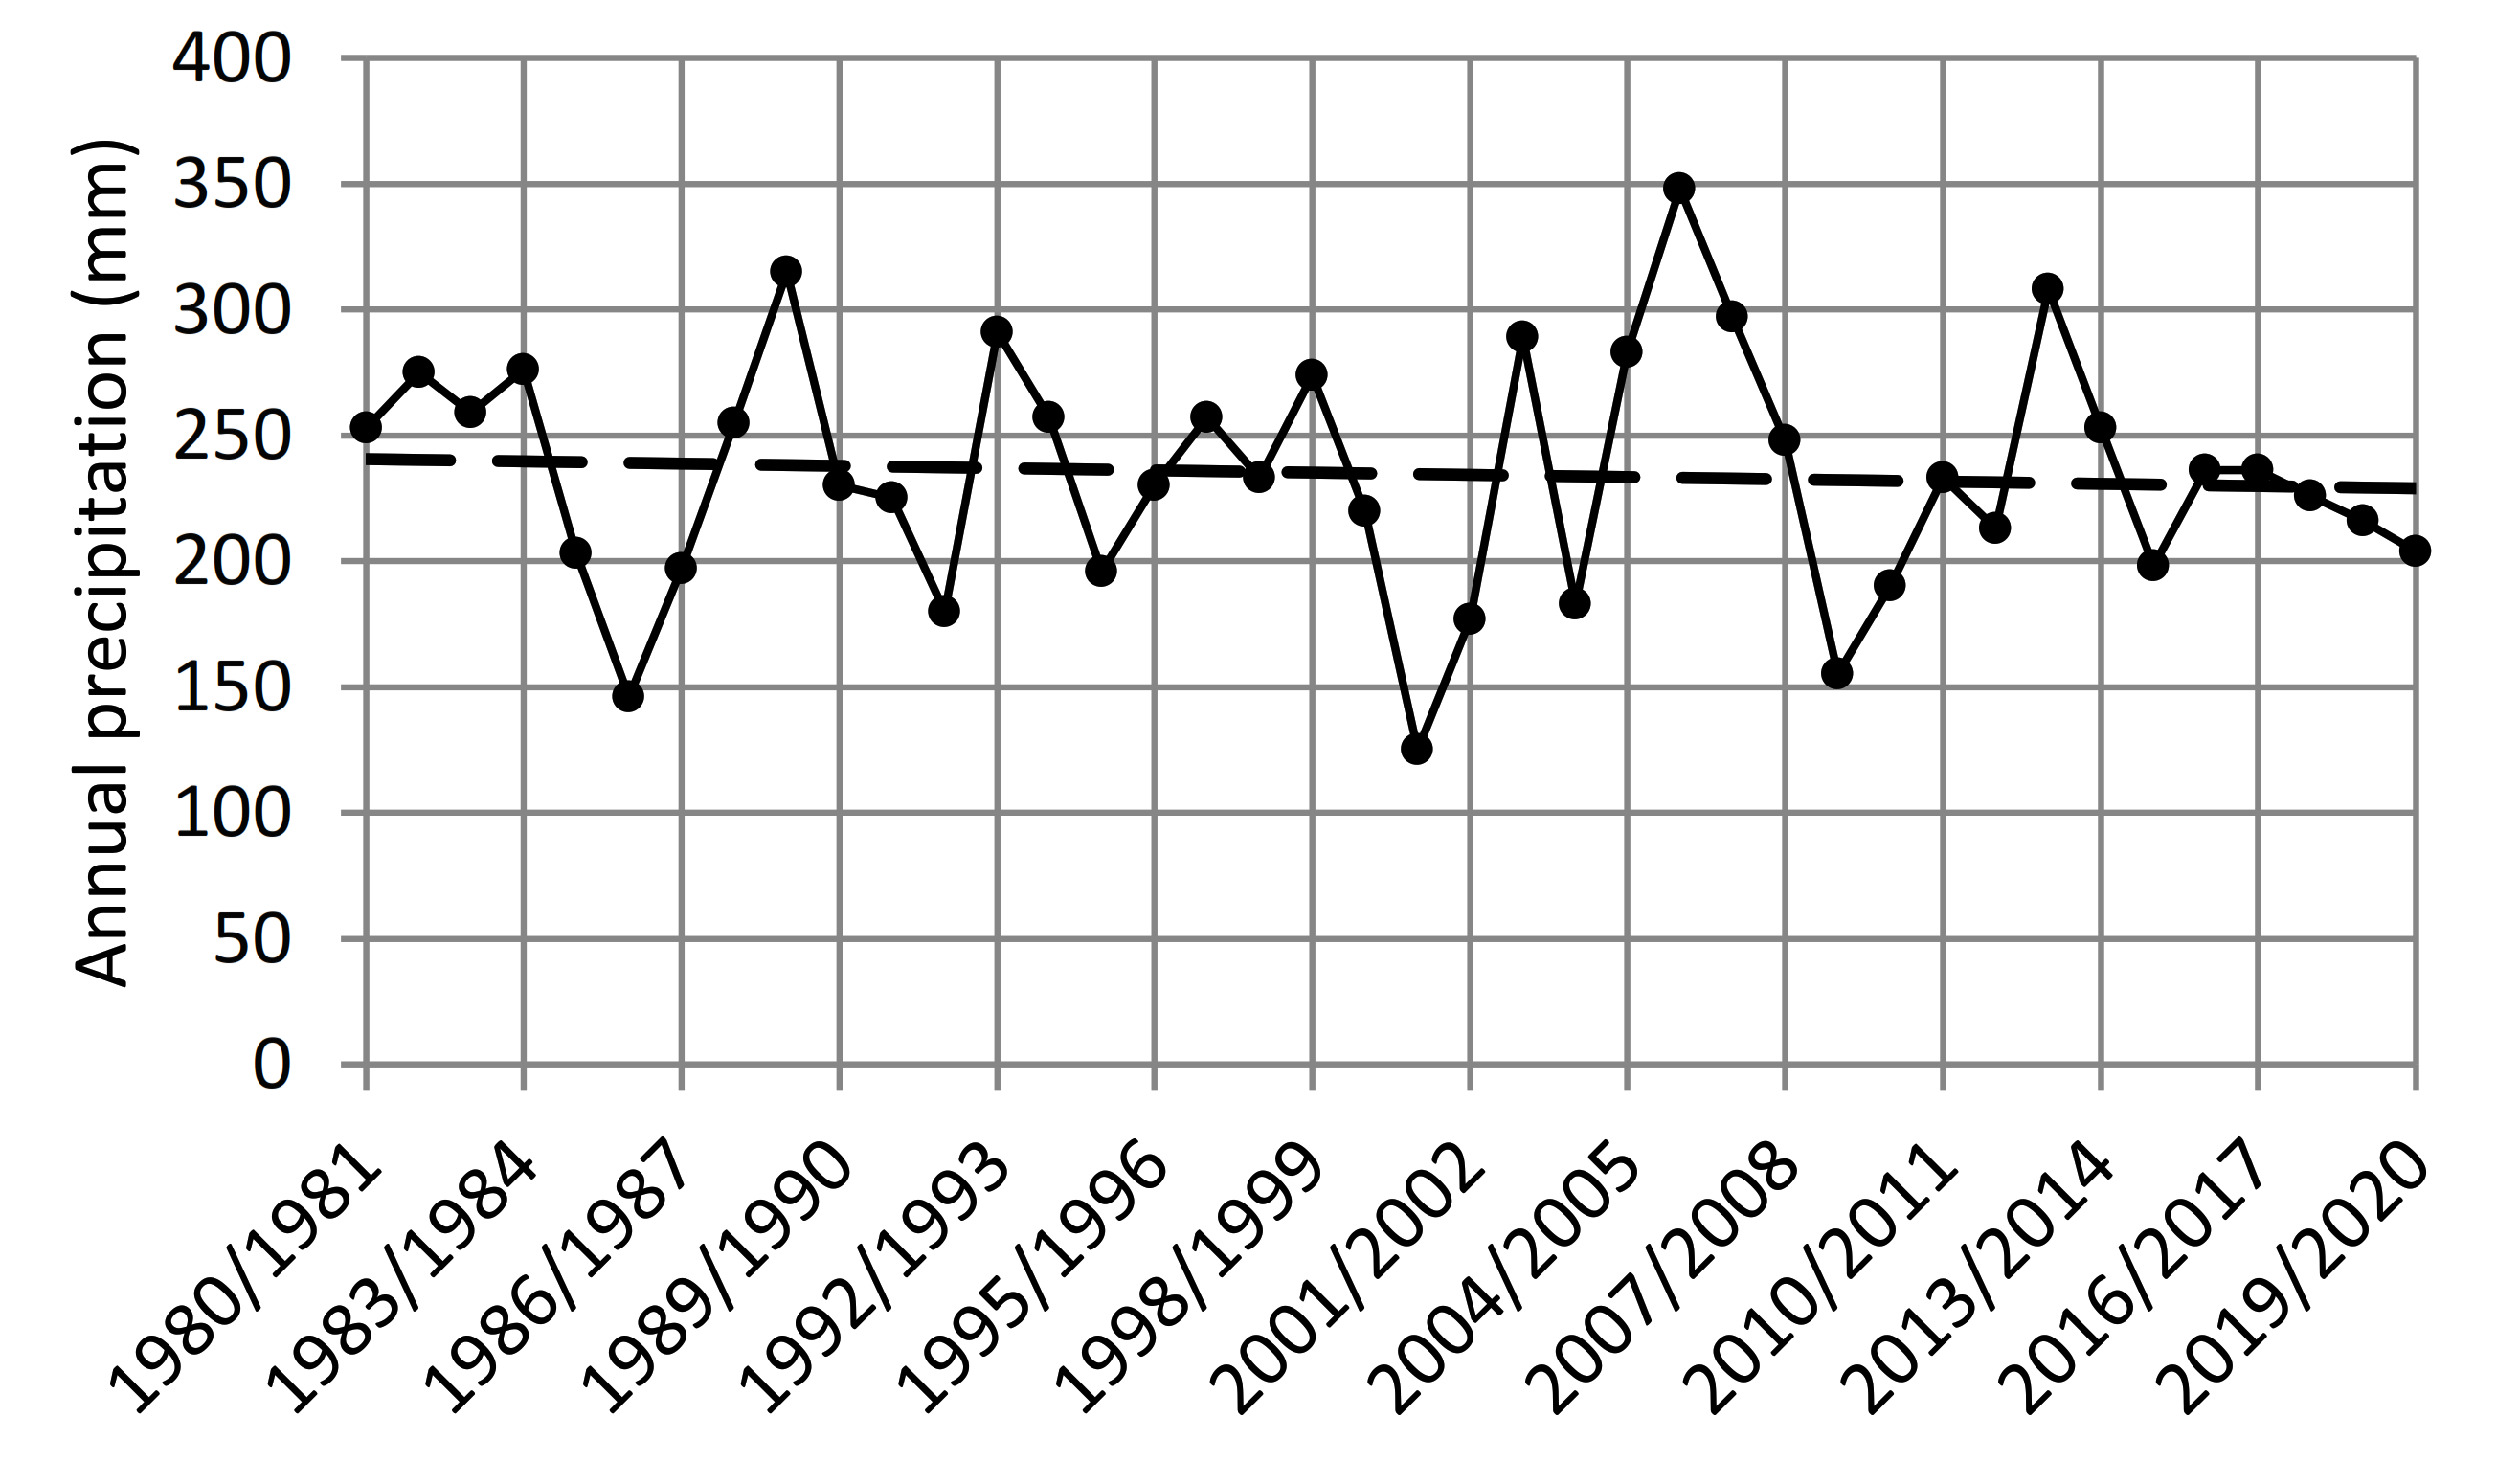
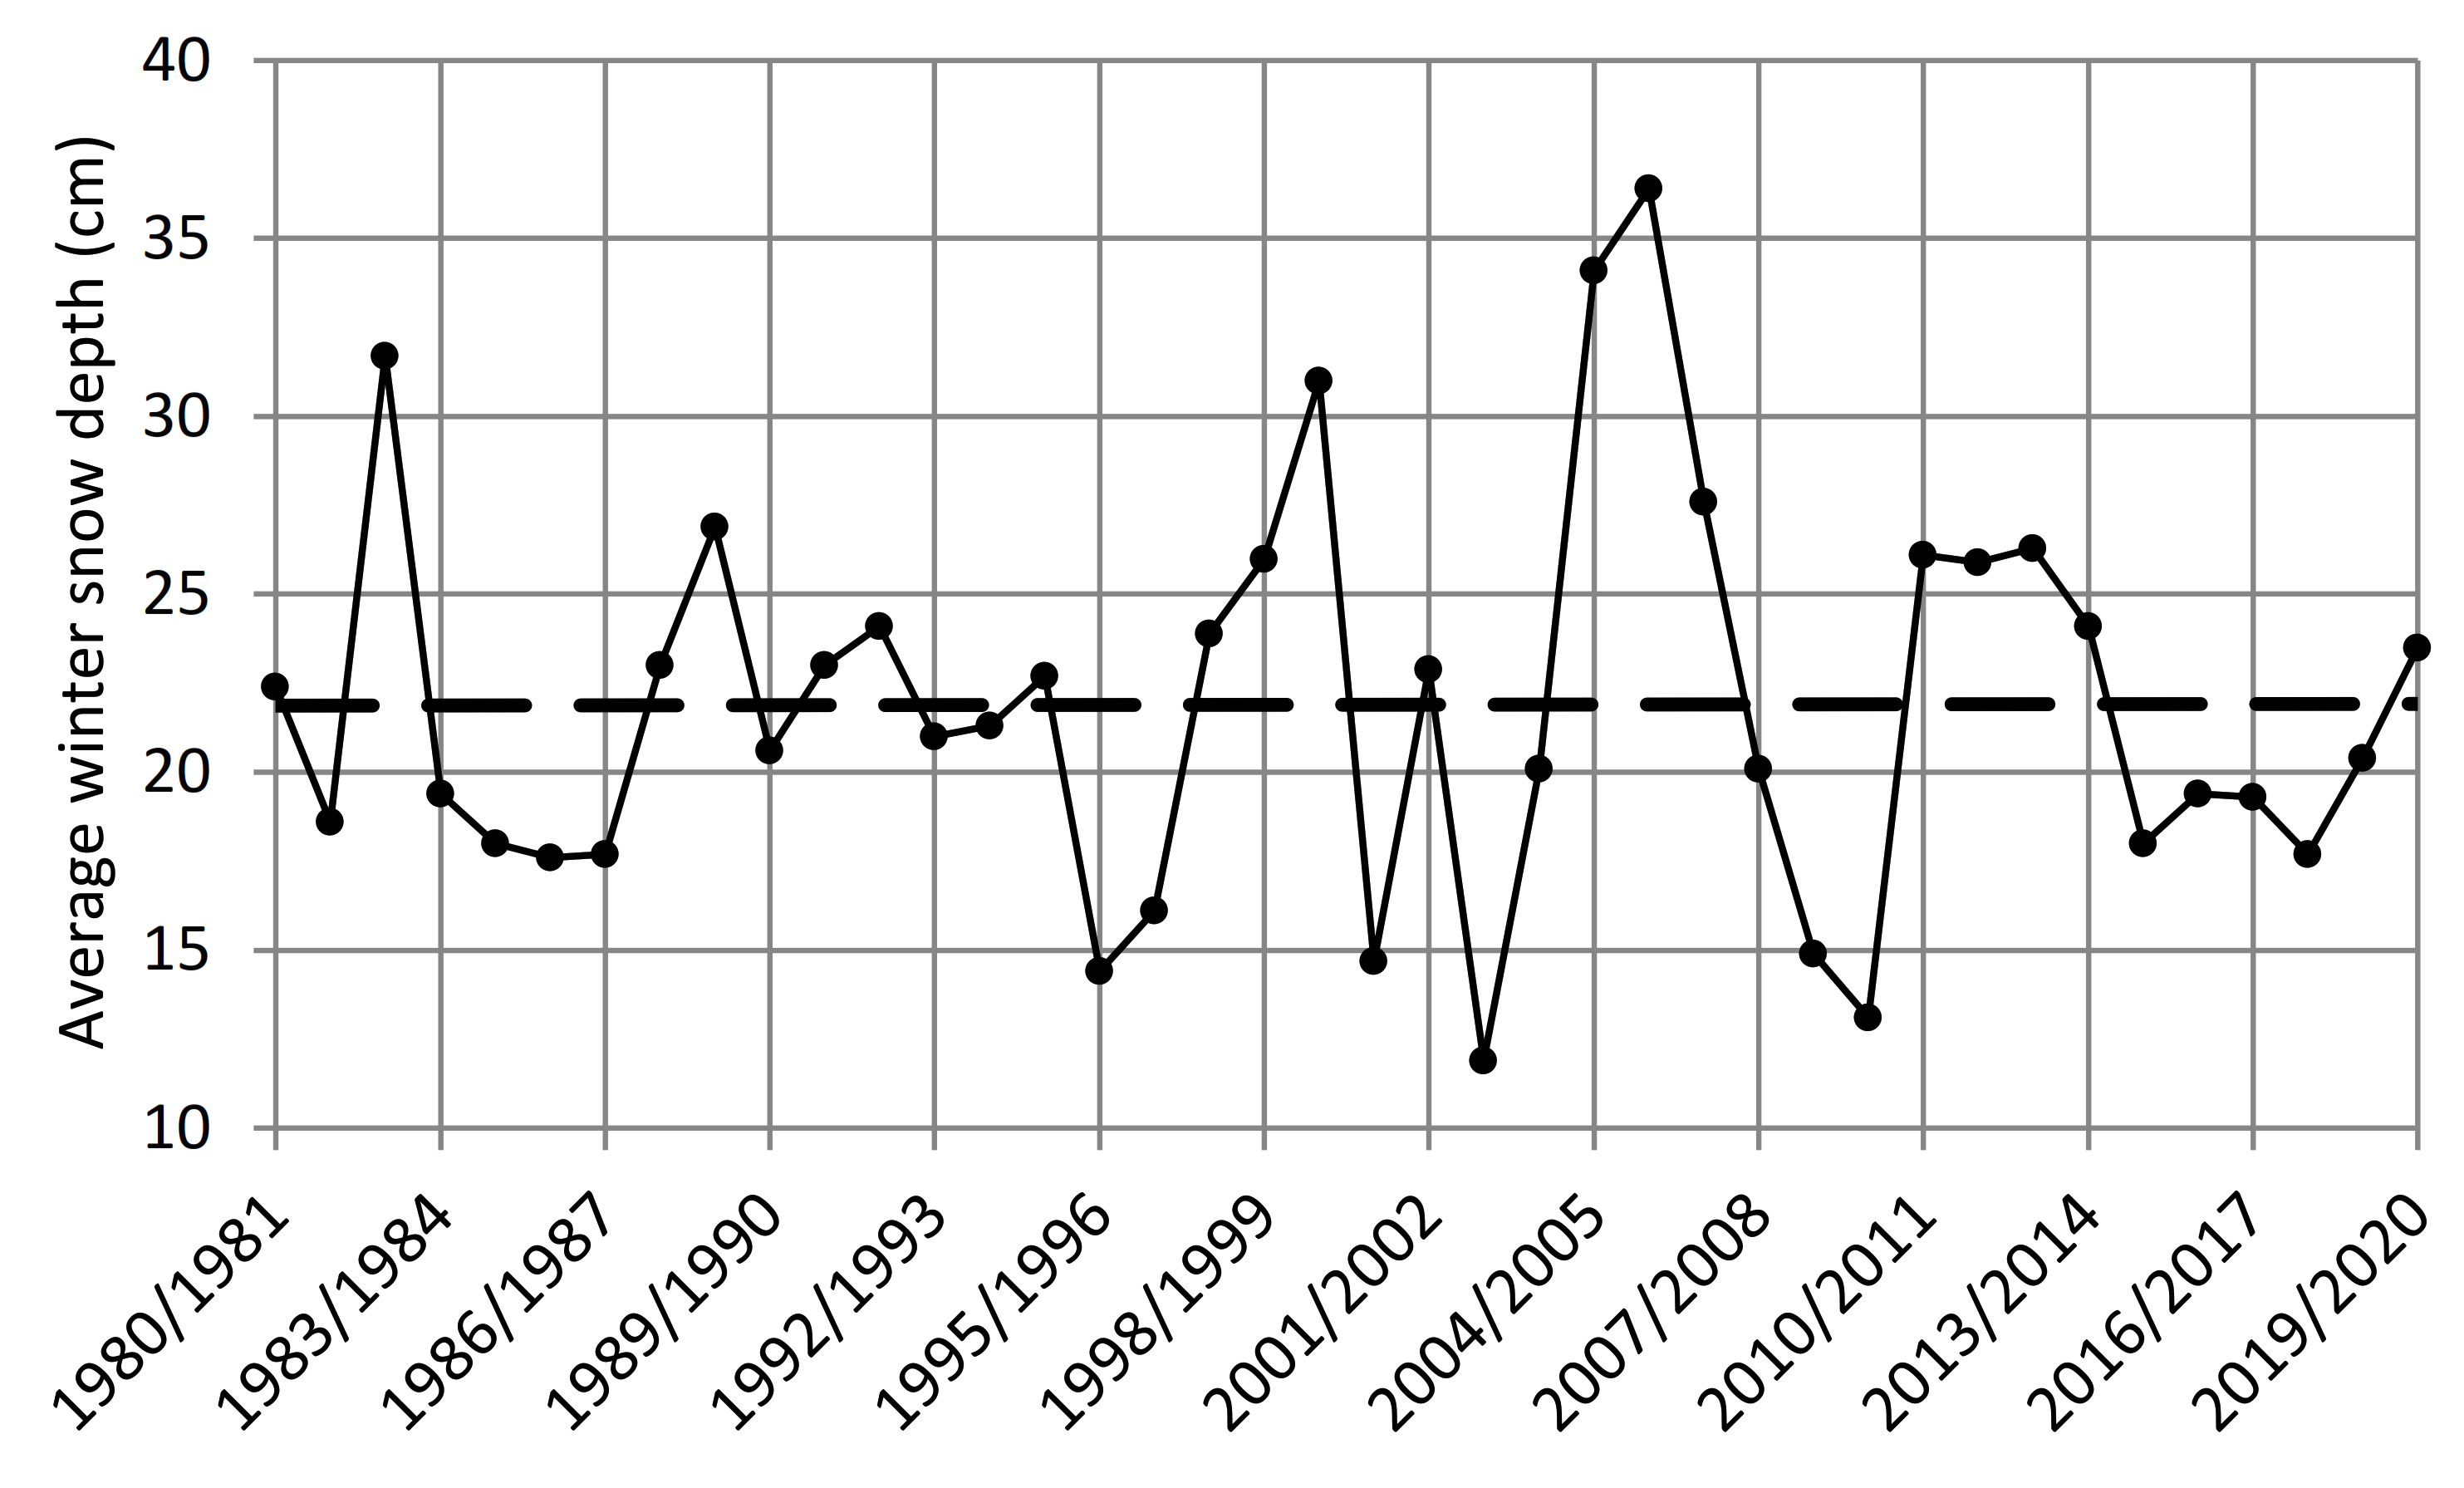
The variability of the main elements of the climate (air temperature, precipitation, and snow cover) can be traced according via the data of the meteorological station in Yakutsk (
Figure 4,
Figure 5 and
Figure 6). It should be noted that there is a high correlation between Yakutsk and other meteorological stations in Central Yakutia [
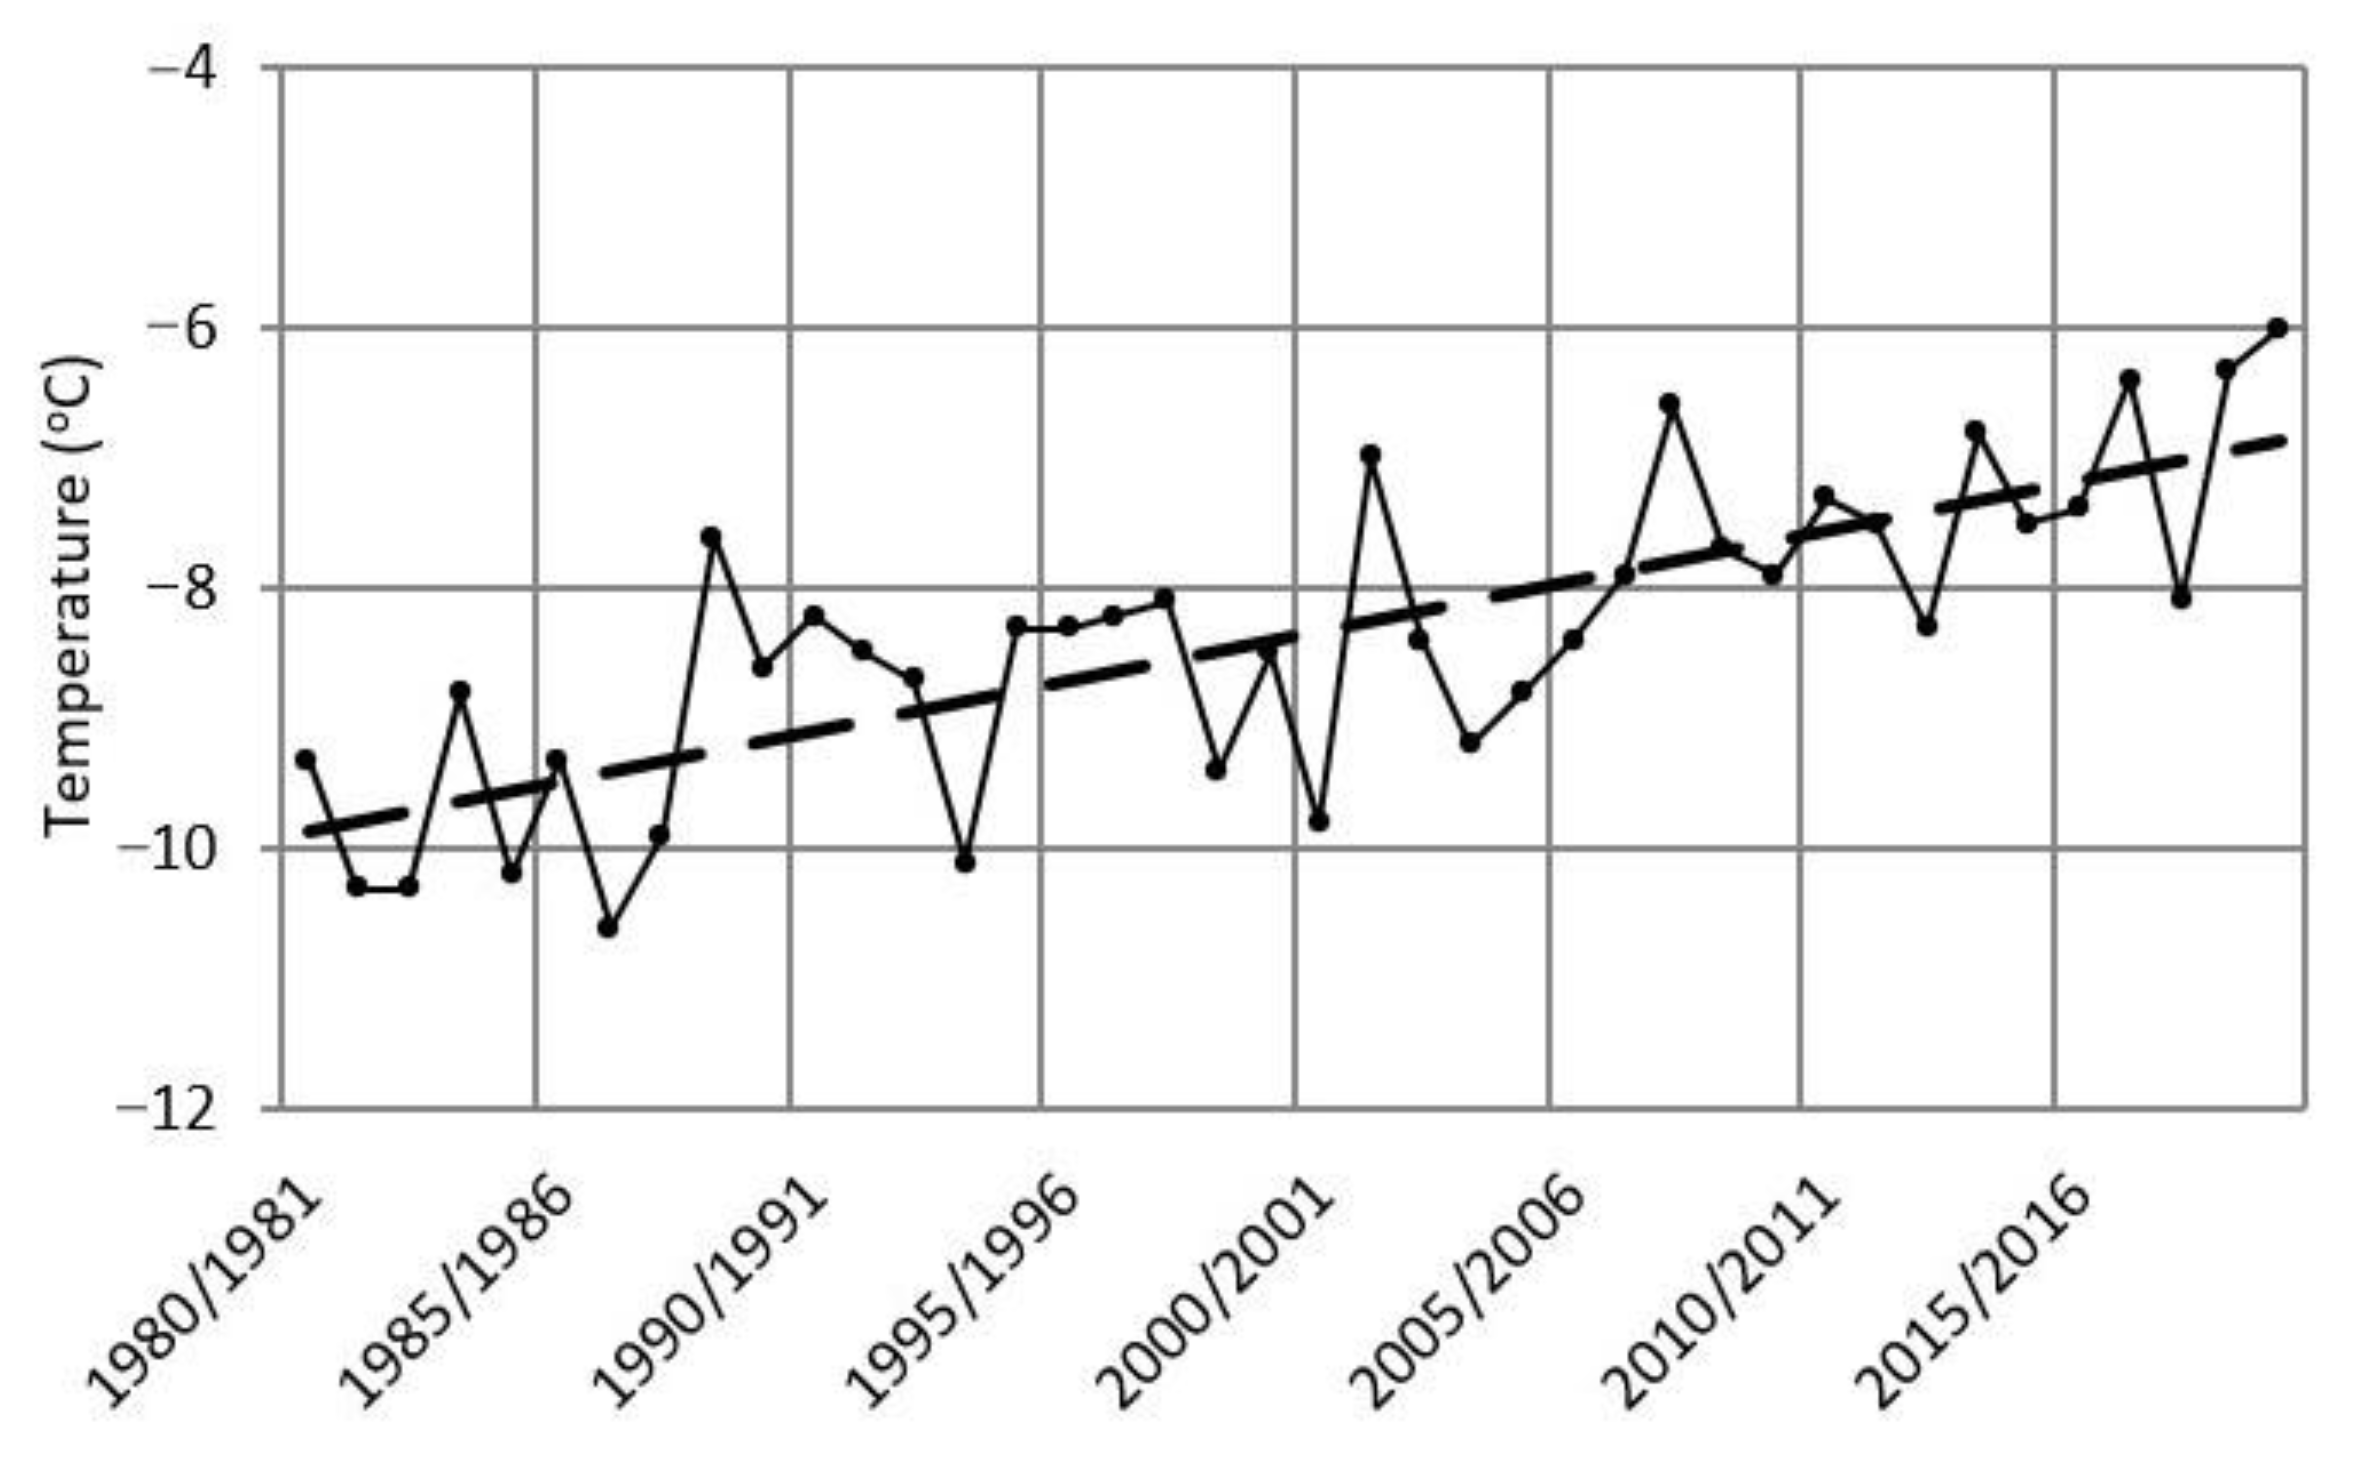
37]. The mean annual air temperature (the norm for the period 1961–1990) in Yakutsk is −10.0 °C, and the average annual precipitation is 235 mm. In 1991–2020, the mean annual air temperature increased, reaching −8.0 °C, while the average annual precipitation did not change. Snow cover characteristics generally remained at the level of multiyear averages. There is no clear evidence of the average winter snow depth increase or decreasing. At the same time, in the first decade of this century, anomalous interannual variability was noted.
As
Figure 4 shows, the trend in the mean annual air temperature has undergone a steady increase. This increase is mainly due to the warming of the winter seasons (October–April). In the summer seasons (May–September), the warming was less significant.
The data in
Figure 5 show that over the past few decades, there have been significant interannual fluctuations in annual precipitation, but in general, this has not increased in Yakutsk. The amount of precipitation observed over the last 40 years by month and by year were close to the norms. Nevertheless, it should be noted that in some years (1989, 1993, 2005–2007, and 2013), there were anomalously high levels of precipitation and anomalously low (1986, 2001, and 2004) levels of precipitation.
3.2. “Yakutsk” Station
The formation of the ground thermal regime is determined by the influence of the following hydrometeorological, heat balance, and lithological factors.
During the period of observation, the mean annual air temperature deviated from the norm within 0.9–1.4 °C. The warmest was the 1973 summer season, when the sum of summer temperatures exceeded the long-term average by almost 12%. The winter season of 1970–1971 showed abnormally high precipitation, while the next two winter seasons were characterized by low precipitation, i.e., reduced height of snow cover. On average, over a three-year cycle of regime observations (from 1 May 1970 to 30 April 1973), the snow depth was close to the multiyear average [
16].
The influence of snow and vegetation cover on the thermal regime of the grounds in Central Yakutia was estimated. We studied the influence of technogenic impacts (removal of snow and organic cover, and the laying of film, heat-insulating, asphalt, and concrete coatings) on the processes of heat exchange with the atmosphere and the hydrothermal regime of the soils.
Radiation balance is the result of the consumption of solar energy by the Earth’s surface, and is determined by the following equation:
where
Q is total radiation;
S is reflected radiation;
Jef is effective radiation, or the balance of long-wave radiation equal to the difference between the surface radiation and atmospheric radiation; and
R is the radiation balance.
The components of heat and moisture exchange between the Earth’s surface and the atmosphere are expressed by the heat balance equation:
where
P is turbulent heat exchange,
LE is heat consumption for evaporation (
E is amount of evaporation and
L is the heat of the vaporization of water), and
B is heat exchange in the ground.
Here, we briefly characterize the radiation regime of the region according to actinometric data from the Yakutsk meteorological station [
18]. The intake of short-wave radiation by season depends on the height of the sun, cloud cover, and the length of the day. The arrival of total radiation varies within wide limits: from 17 (December) to 620–712 MJ/m
2 (June). The annual total radiation is 3745 MJ/m
2. About 34% of the incoming radiation per year is reflected back into the atmosphere. Significant energy losses (75–85%) are observed in winter, while lower losses (18–22%) occur in summer. About 1/3 of the incoming radiation per year is lost as a result of effective radiation. Heat losses from effective radiation increase in proportion to the increase in the Earth’s surface temperature, from 29–63 MJ/m
2 in the winter months to 167–188 MJ/m
2 in the summer. In winter, due to heat loss via radiation with insignificant contributions of solar energy, the radiation balance is negative. A positive balance emerges from the end of March to the second half of October. In general, the annual radiation balance is 904 MJ/m
2, or 33% of the total radiation.
Studies at the Yakutsk station have revealed that, during the cold period, all the components of the heat balance are half an order or a whole order of magnitude lower than during the warm period [
16]. Therefore, the features of the components of the heat balance in various landscapes are more pronounced in the warm season.
The albedo of the snow cover for the entire period was 67%. Heat consumption via effective radiation was approximately two times lower than via reflection. The heat consumption via evaporation comprises 11% of the total radiation. During the period of seasonal thawing, the radiation balance was half of the total radiation. The main components were the consumption of heat for evaporation (
LE) and turbulent heat exchange (
P). The value of
P was 1.8 times greater than that of
LE. The heat flux into soil (
B) was only 3.4% of
Q. This is explained by the low values of the thermal conductivity coefficient and the insufficient levels of soil moisture (
Table 1).
On average, the albedo of the pine forest crown was 13.5% per year, i.e., 2.4 times lower than for the forb meadow. The annual radiation balance of the pine forest crown, on average, exceeded the radiation balance of the meadow 1.62-fold. The effective radiation of the forest cover was 31–33% of the total radiation. During the warm period, 50% of radiation penetrated through the forest canopy every year and 47% during the year. During the warm period, 50% of radiation penetrates under the forest canopy and 47% year. Turbulent heat exchange under the forest canopy decreased in the summer season by 22% on average, and the soil evaporation here was less than 1/3 of that in the meadow.
The mean annual ground temperature in the layer of zero amplitude in the forest was lower than in the forb meadow. While the active layer thickness in the meadow was 1.8–1.9 m, that in the forest was 1.6–1.7 m.
With the constant removal of snow cover, the heat turnover in the ground increased 1.42 times. The mean annual ground temperatures at a depth of 10 m dropped by 1.2 °C. On the bare site, the active layer thickness for 1971–1973 increased by 0.05–0.21 m.
These research results help develop methods for predicting changes in the ground thermal regime [
16]. The proposed forecasting methods were included in the recommendations for engineering and geocryological work during the construction and operation of the Baikal−Amur railway structures, the development of placers, and the solution of other practical problems in cold regions.
3.3. “Zeleny Lug” Station
The natural floodplain grounds at the embankment construction site are represented by alluvial mixed-grained sands and sandy silts to a depth of 15–38 m (peaty and silted in the surface layer, with inclusions of boulders and pebbles at deeper layers, and siltstone interlayers). The sands are underlain by bedrocks (fractured sandstones). The active layers of the ground (up to 1.5–1.6 m thick) are characterized by significant gravimetric moisture contents in both summer and winter due to periodic flooding during spring and the accumulation of rainfall.
The grounds in the floodplain had higher temperatures. In the reclamation area adjacent to the city canal, the value of
t0 (Boreholes 1–3) was −0.2–0.3 °C; outside this area (Borehole 4),
t0 = −1.4–1.5 °C. When drilling Borehole 1 (100 m deep), an aquifer talik horizon (or a closed aquifer lens) was discovered at a depth of 25–30 m; taliks were not identified by the other boreholes. Even the deepest borehole did not reach the bottom surface of the permafrost; measurements here, at a depth of 100 m, showed a temperature of −0.8 °C after the borehole was cured [
36].
The embankment was washed in July 1977 (to a height of 3 m) and in July 1978 (by another 1–3 m). At the time of the first reclamation, the active layer depth was 0.9 m, i.e., almost ½ of its maximum value (in autumn) in the embankment. As a result of the reclamation, the frozen soils of the floodplain thawed to a depth exceeding the depth of thawing at the end of summer (under natural conditions). Before the second alluvion, a frozen layer from 1–1.5 to 2–2.5 m was found in the embankment, then a talik was found at a depth of 5–6 m. As a result of the reclamation, the frozen layer in the embankment thawed completely, and the floodplain soils also thawed. The depth of the subsidence of their upper boundary, resulting from the warming effect of the two alluvials, depended on the thickness of the embankment. This varied from 3 to 3.5 m (from the day surface of the floodplain to the alluvium) with an embankment height of 5–6.5 m, and up to 1 m with an embankment height of 2.2 m. The thickness of the talik, taking into account the accumulated layer, varied from 3 to 9 m. In one place it reached 10–11 m [
36].
By the beginning of July 1978, 3 weeks after the second alluvion, the groundwater level was already approximately 1 m from the day surface; by the end of summer, it dropped by another 2 m. Thus, the dehydration of the washed-up sands occurred relatively quickly. Water loss during the dehydration period significantly affects the heat transfer in the embankment. In the winter of 1978/79, the groundwater level remained slightly below the contact surface between the embankment and the floodplain soils. In June 1979, due to the spring flooding of the floodplain, the groundwater level at site 2 slightly increased—up to 2.5 m from the surface [
36].
Field experiments carried out by A.A. Mandarov and P.N. Skryabin showed that the coefficient of thermal conductivity of alluvial sands in the thawed state (at average moisture w = 5% and bulk density of the skeleton
γbh = 1500 kg/m
3) is 0.99 W/(m·K) [
43]. The thermal conductivity coefficient of frozen sands with the same defining parameters is, on average, 0.87 W/(m·K), i.e., it decreases by 12%. Laboratory experiments revealed the values of the thermal conductivity coefficient of alluvial sands following a wide range of changes in the bulk density of their skeleton and moisture state [
43]. With variations in
γc and
w, the value of
λm was less than
λt. Thus, as the value of
λm <
λt is higher than the capillary border, the heat-insulating effect of the embankment in winter is more pronounced than in summer.
The freezing of the embankment is mainly determined by the climatic conditions of the winter period and the thermophysical characteristics of the soils. Heavy snow and the poor thermal conductivity of sands in the embankment caused relatively shallow freezing of the talik in the winter of 1978/79, amounting to 2.8–3.2 m. This layer of frozen soil was not preserved during the summer season of 1979; its complete thawing was completed on 22–27 July. In the winter of 1979/80, the soil was frozen up to 3.6 m.
Field studies have established that the periodic compaction of the snow cover (via the passage of caterpillar vehicles) is not an effective means of increasing the intensity of freezing in the embankment. In one of the small areas where this technique was tested, the snow depth by the end of the 1978/79 winter had decreased by 0.12 m, and the density had increased from 190 to 290 kg/m3. However, the depth of the seasonal freezing of soils increased by only 0.3–0.5 m.
The reflectivity of the surface at site 1 was the lowest during flooding. The albedo of the floodplain meadow was 7% during the flooding period and 18–23% in the subsequent summer period after the natural discharge of water. The albedo of the embankment (light-colored sand) was much higher—28–39%. Due to the lower surface temperature of the meadow in comparison with the sand embankment, the effective radiation at site 1 was 1.2–3.2 times less than at site 2. The radiation balance in the meadow was 55–85% of the total radiation (
Q) during the warm period (2/3 on average). In accordance with the increase in effective radiation, the radiation balance of the embankment was reduced 1.3–1.7-fold compared with area 1, and was only 40–49% [
36].
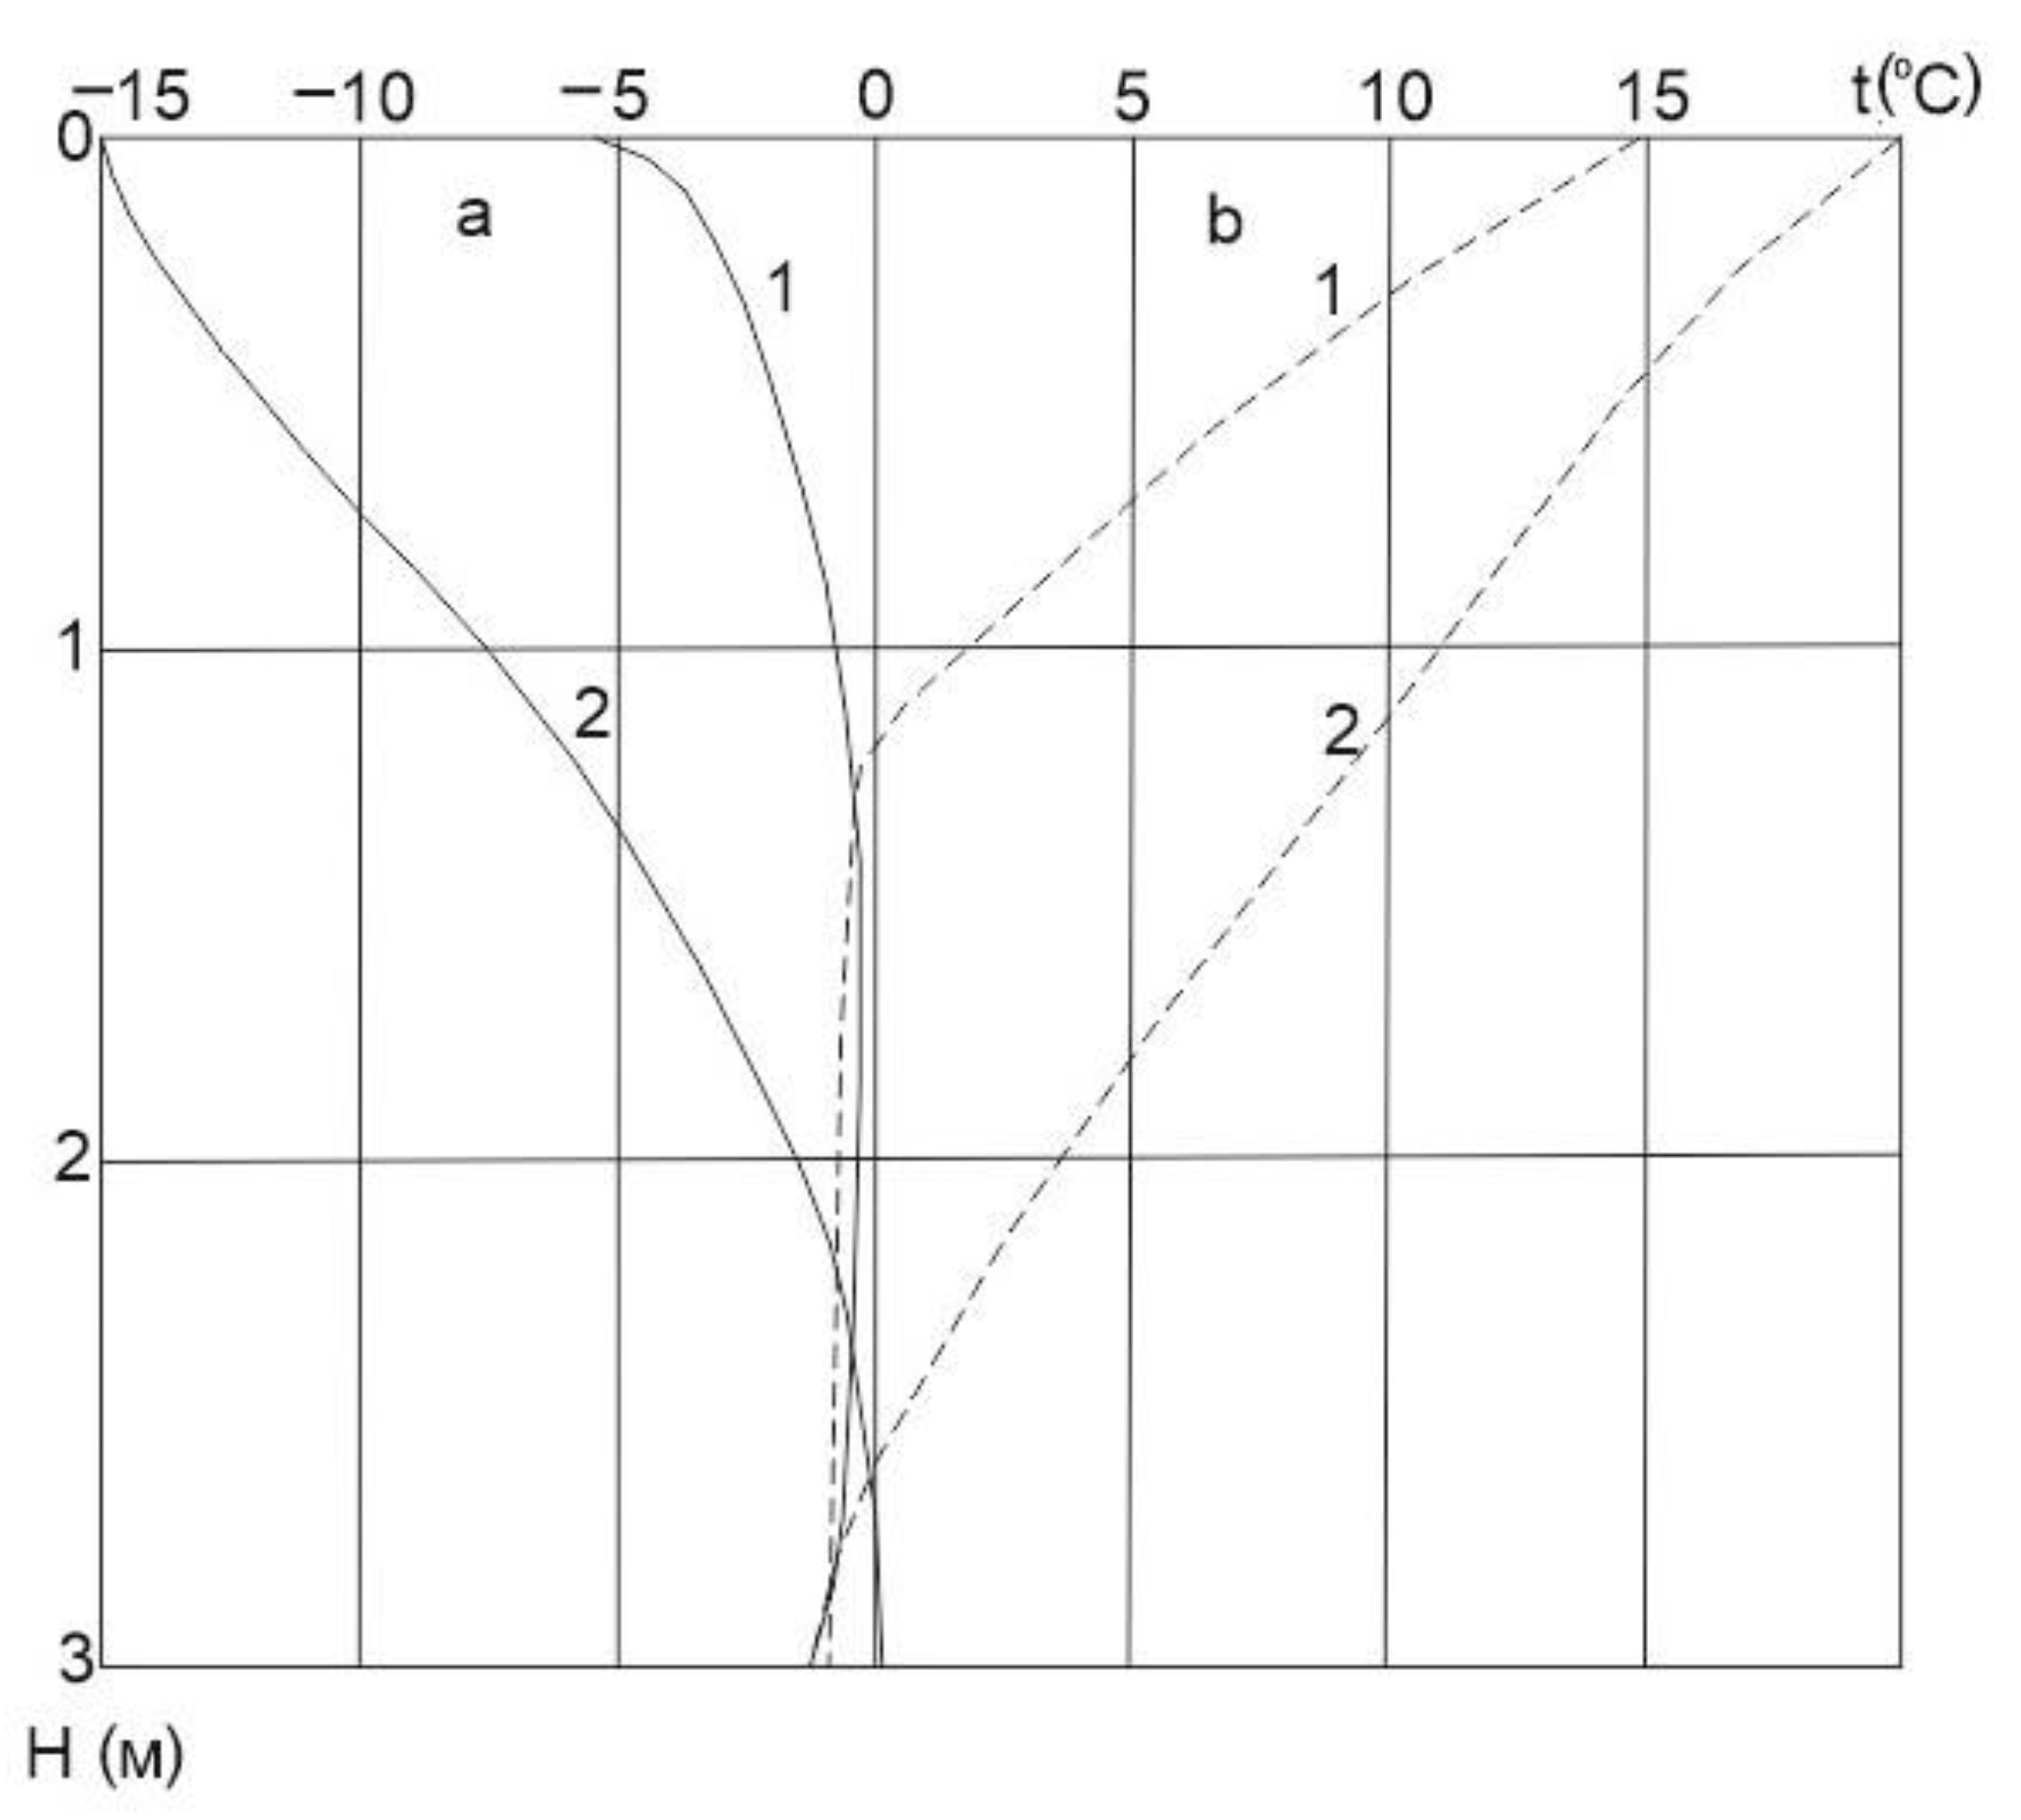
The swampy soils of the floodplain are characterized by a markedly lower temperature in the surface and in the entire active layer in comparison with the sandy loam and loamy soils of the above-floodplain terrace of the Lena River (
Figure 7). The seasonal thaw depth is 0.1–0.3 m shallower on the floodplain. However, the difference in temperature regime of the floodplain soils and alluvial sands differs (
Figure 8). During the flood period, the difference between the temperature of the soil surface on the embankment and the floodplain was 20 °C; after the discharge of water, this difference was usually 12–15 °C. In summer, the average monthly surface temperature (
ts) at site 1 was always lower than the air temperature, while at site 2 it was higher. On average, over the summer season, the difference in
ts at both plots reached 4.2 °C.
The evaporation from a sand embankment is about four times lower than from a floodplain meadow. Heat fluxed into the soil during May–August at site 1, due to the high moisture content, and consequently, the thermal conductivity exceeded the fluxes at site 2. In total, for the entire summer season, heat accumulation in the sandy ground of the alluvion embankment was 1.3 times lower due to the poorer thermal conductivity of the sands compared with site 1.
The results of the calculations give a clear idea of the nature and intensity of the thermal processes in the body of the embankment and its underlying grounds. Naturally, in all variants, there is a gradual reduction in temperature and in the thawed layer.
Thus, the natural freezing of the embankment (5–7 m high) and the thawing of the upper layer of permafrost during alluvial formation will continue for decades. Even with an embankment height of only 3 m, the freezing time of the talik will reach 8–10 years. With just a shallow reclaimed sand layer, not exceeding 2.5 m, the talik will completely freeze during the summer reclamation in just 1–3 years.
The freezing of the embankment can be accelerated by clearing off the snow cover in the winter before reclamation, and reclaiming as early as possible (March and April), before the warming and thawing of the ground. In this case, freezing will occur not only from above but also from below. In variant 5, the freezing of the thawed layer at 7 m occurred in just 3.5 years. Consequently, a simple reclamation procedure of periodically clearing the snow in the winter before the alluvium will make it possible to reduce the freezing time of an embankment with a height of 6–7 m and the talik formed under it as a result of the reclamation.
To increase the freezing rate in all variants, a one-stage reclamation as early as possible is preferable. The construction of buildings with underground ventilation will also contribute to the improvement of the permafrost state of soils.
The results of comprehensive studies have been used in the design of the new Yakutsk Microdistricts 201–203 built on alluvion grounds, and can be used in the north in regulations for the preparation of foundations via the alluvion method.
3.4. Sites and Plots of the Tuymaada Valley
Using 11 regime regions as an example, we considered spatial variations in the thawing depth (
ξ) and average annual temperature of the active layer (
tξ), as well as thickness (
H0) and temperature at zero amplitude (
t0); soil moisture in the active layer (
Wst); seasonally frozen layer (
Wsf); and in the permafrost (
Wpf), height (
hs), and density (
ρ) of snow. (
Table 2).
Snow cover is one of the most essential meteorological characteristics affecting the formation of the thermal regime of grounds in open areas of the valley. In the floodplain and terrace, steppe and meadow complexes predominate; the overwintering and compaction of the snow cover as a result of wind during the period of maximum snow accumulation (late March-early April) are common. This period is characterized by the most significant variability in the thickness (18–31 cm) and density (170–337 kg/m3) of the snow cover (see
Table 2).
The moisture content of seasonally thawing and freezing soils is one of the most critical factors determining the formation of the thermal regime in these layers, due to the significant heat consumption for phase transitions. The spatial variability of Wst and Wpf in the types of terrain under consideration is 9 to 27%, while the moisture content of permafrost soils ranges from 29 to 46%.
The processes of the thawing and freezing of soils are closely related to moisture. In terrace locations, the active layer’s thickness varies from 1.8 to 2.1 m, and in the floodplain from 1.5 to 1.8 m. Here, the exception is the seasonally freezing layer on inter-ridge depressions, where the thickness increases to 3.0 m.
The floodplain and terrace are characterized by relatively large spatial variations in the parameters of
tξ,
H0, and
t0, which are primarily associated with changes in the composition and moisture content of soils:
tξ = −0.4 to −3.8 °C,
H0 = 4 to 15 m,
t0 = −0.5 to −3.7 °C. Moreover, even in the same tract (ridges with a solid sedge steppe), due to the uneven distribution of the snow cover, the variability in
tξ can be significant (see
Table 2). Another example with an abnormal spatial variability in its parameters is the low terrace. In thin aquiferous taliks, the values ξ, t
ξ, H
0, and t
0 differ significantly from the background values.
In the valley, depending on the landscape conditions (the nature of the vegetation and ground cover), the active layer thickness varies from 1.5 to 3.0 m. As a result, the mean annual ground temperature at a depth of 10 m varies from −0.5 to −3.4 °C.
3.5. “Tuymaada” Station
In 1995, by the initiative of the authors, temperature observations at the Tuymaada station on the plots “meadow” and “forest” were resumed (see
Figure 1 and
Figure 2) within the framework of monitoring the thermal state of grounds in Central Yakutia. The study’s aim was to assess the interannual and long-term variability in the thermal regime of grounds during modern climate warming.
In the last 30–35 years, a noticeable increase in the mean annual air temperature has been observed in Yakutsk, mainly due to the warming of winter [
45]. In addition, the first decade of this century has shown large interannual variability in snow cover characteristics (see
Figure 6). These are the main factors that form the thermal regime of the layer of zero amplitude.
The mean annual ground temperature is one of the most important parameters of the temperature field. It changes from year to year, along with the profile of the entire layer of zero amplitude, depending on the variability of the above factors. This parameter is vital to permafrost scientists involved in calculations and models of the thermal processes of permafrost, as well as to designers and builders. In addition, it is necessary to know the amplitude of ground temperature fluctuations and their extremes. Many researchers refer to the data of the Yakutsk meteorological station. Unfortunately, the data on ground temperature obtained by the exhaust thermometers at this station in recent decades are not conditioned, due to the watering of the adjacent territory [
23]. Therefore, they cannot be used to analyze interannual variability.
In light of the above, the information presented in
Table 3 is of some interest. Observations over the past 25 years have made it possible to reveal the interannual variability in the ground temperature at the 1–15 m section, and have been compared with the results of temperature observations obtained by A.V. Pavlov during the period of heat balance observations made in 1971–1973 [
16].
The first comparisons of the averaged observational data for two cycles, 1971–1975 and 1995–1999 [
46], led to a paradoxical result. It was found that, despite the obvious increase in the mean annual air temperature in Yakutsk over the past few decades, the ground temperature not only did not rise, but it actually decreased—in the meadow by 0.2–0.5 °C, and in the pine forest by 0.1–0.2 °C. It should be noted that the meteorological conditions in 1971–1975 were more severe than in the period 1995–1999. The mean annual air temperature and winter seasons 24 years ago were colder than modern ones, and the snow cover was about the same. What was the reason for the cooling of the ground? In the Yakutsk area, from 1970 to 2000, there was an apparent reduction in snow cover thickness (see
Figure 6), which was especially noticeable in the first half of winter, and this reduced the heat-insulating effect. During the same period, there was a pronounced increase in the snow depth in the second half of April, i.e., when the radiation balance exceeded zero and snow came to have a cooling effect on the soils. In addition, there was a clear tendency for the melting of snow to slow [
47].
All of the above factors have influenced the ground temperature in these decades, although they are perhaps not the only ones. Subsequent observations in the 21st century have made it possible to reveal significant interannual changes in ground temperature, caused by a series of abnormally heavy and light snowy winters. For example, the highly snowy winter of 2002–2003 (compared with the average December snow depth, which is only 0.12 m, at a rate of 0.23 m) also set a record for the duration of snow cover: 172 days at a rate of 202. As a result, the soils cooled to the lowest values of the entire observation period [
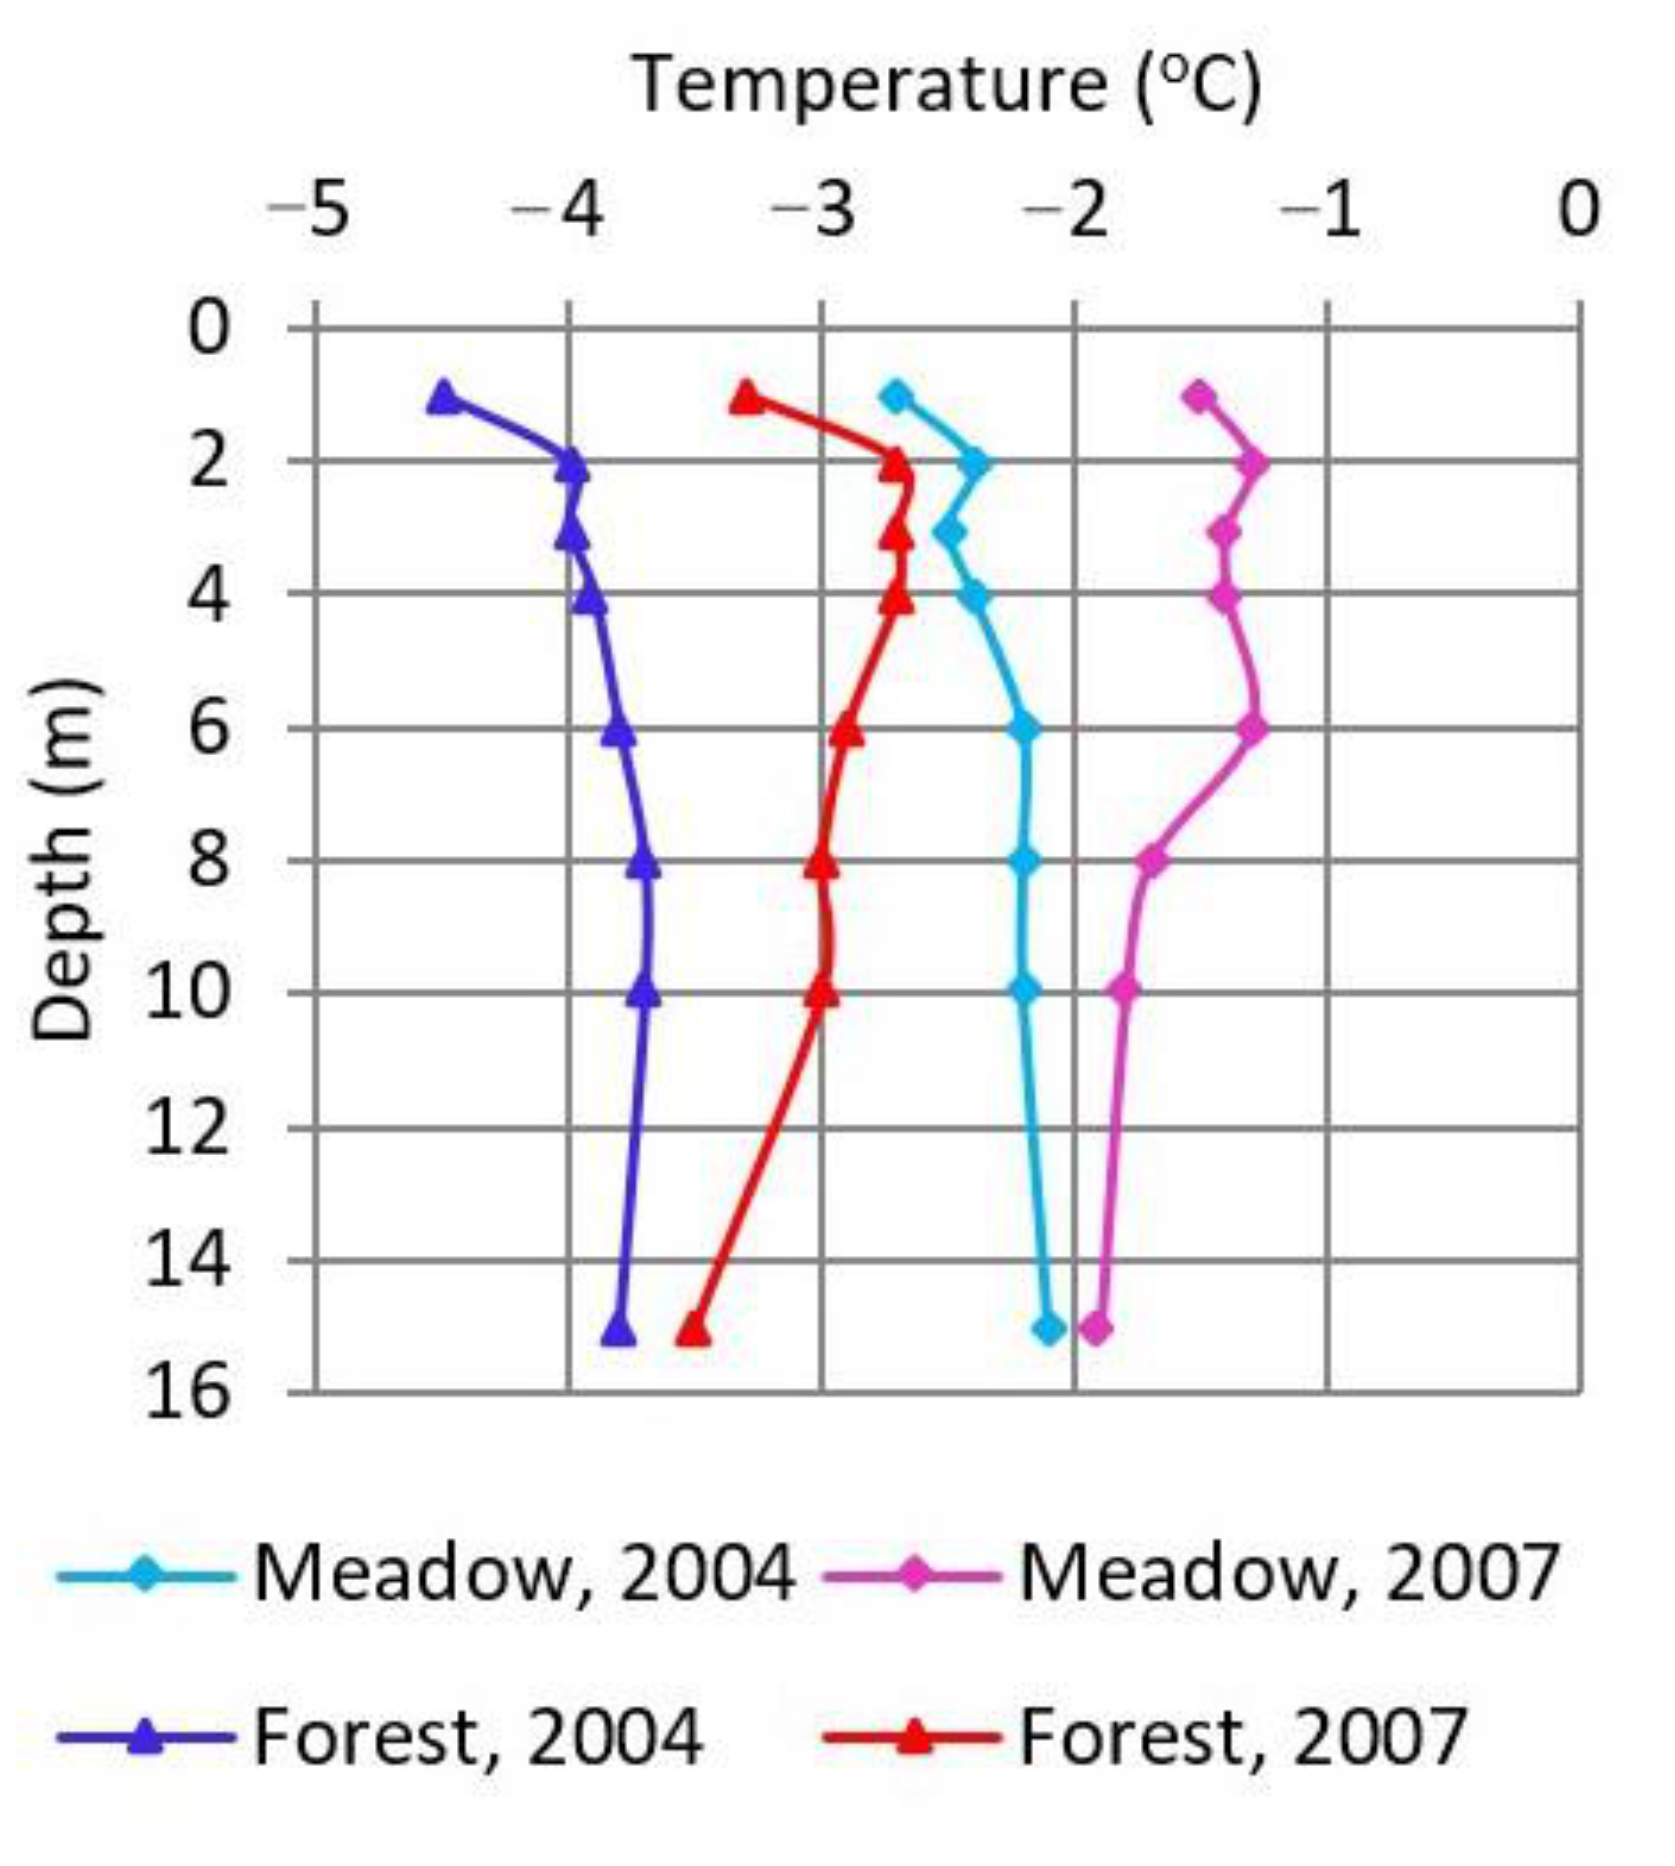
47]. Vice versa, the consecutive abnormally snowy winters of 2005–2007 produced the opposite effect, increasing the mean annual ground temperature, in both the meadow (at a depth of 2 m—from −2.7 °C to −1.6 °C; at 5 m—from −2.3 °C to −1.4 °C; at 10 m—from −2.1 °C to −1.8 °C) and the forest (at a depth of 2 m—from −4.1 °C to −2.7 °C; at 5 m—from −3.8 °C to −2.8 °C; at 10 m—from −3.6 °C to −3.0 °C) (
Figure 9).
However, the winter season of 2009–2010 produced abnormally little snow, practically returning the mean annual ground temperature throughout the section “to square one”.
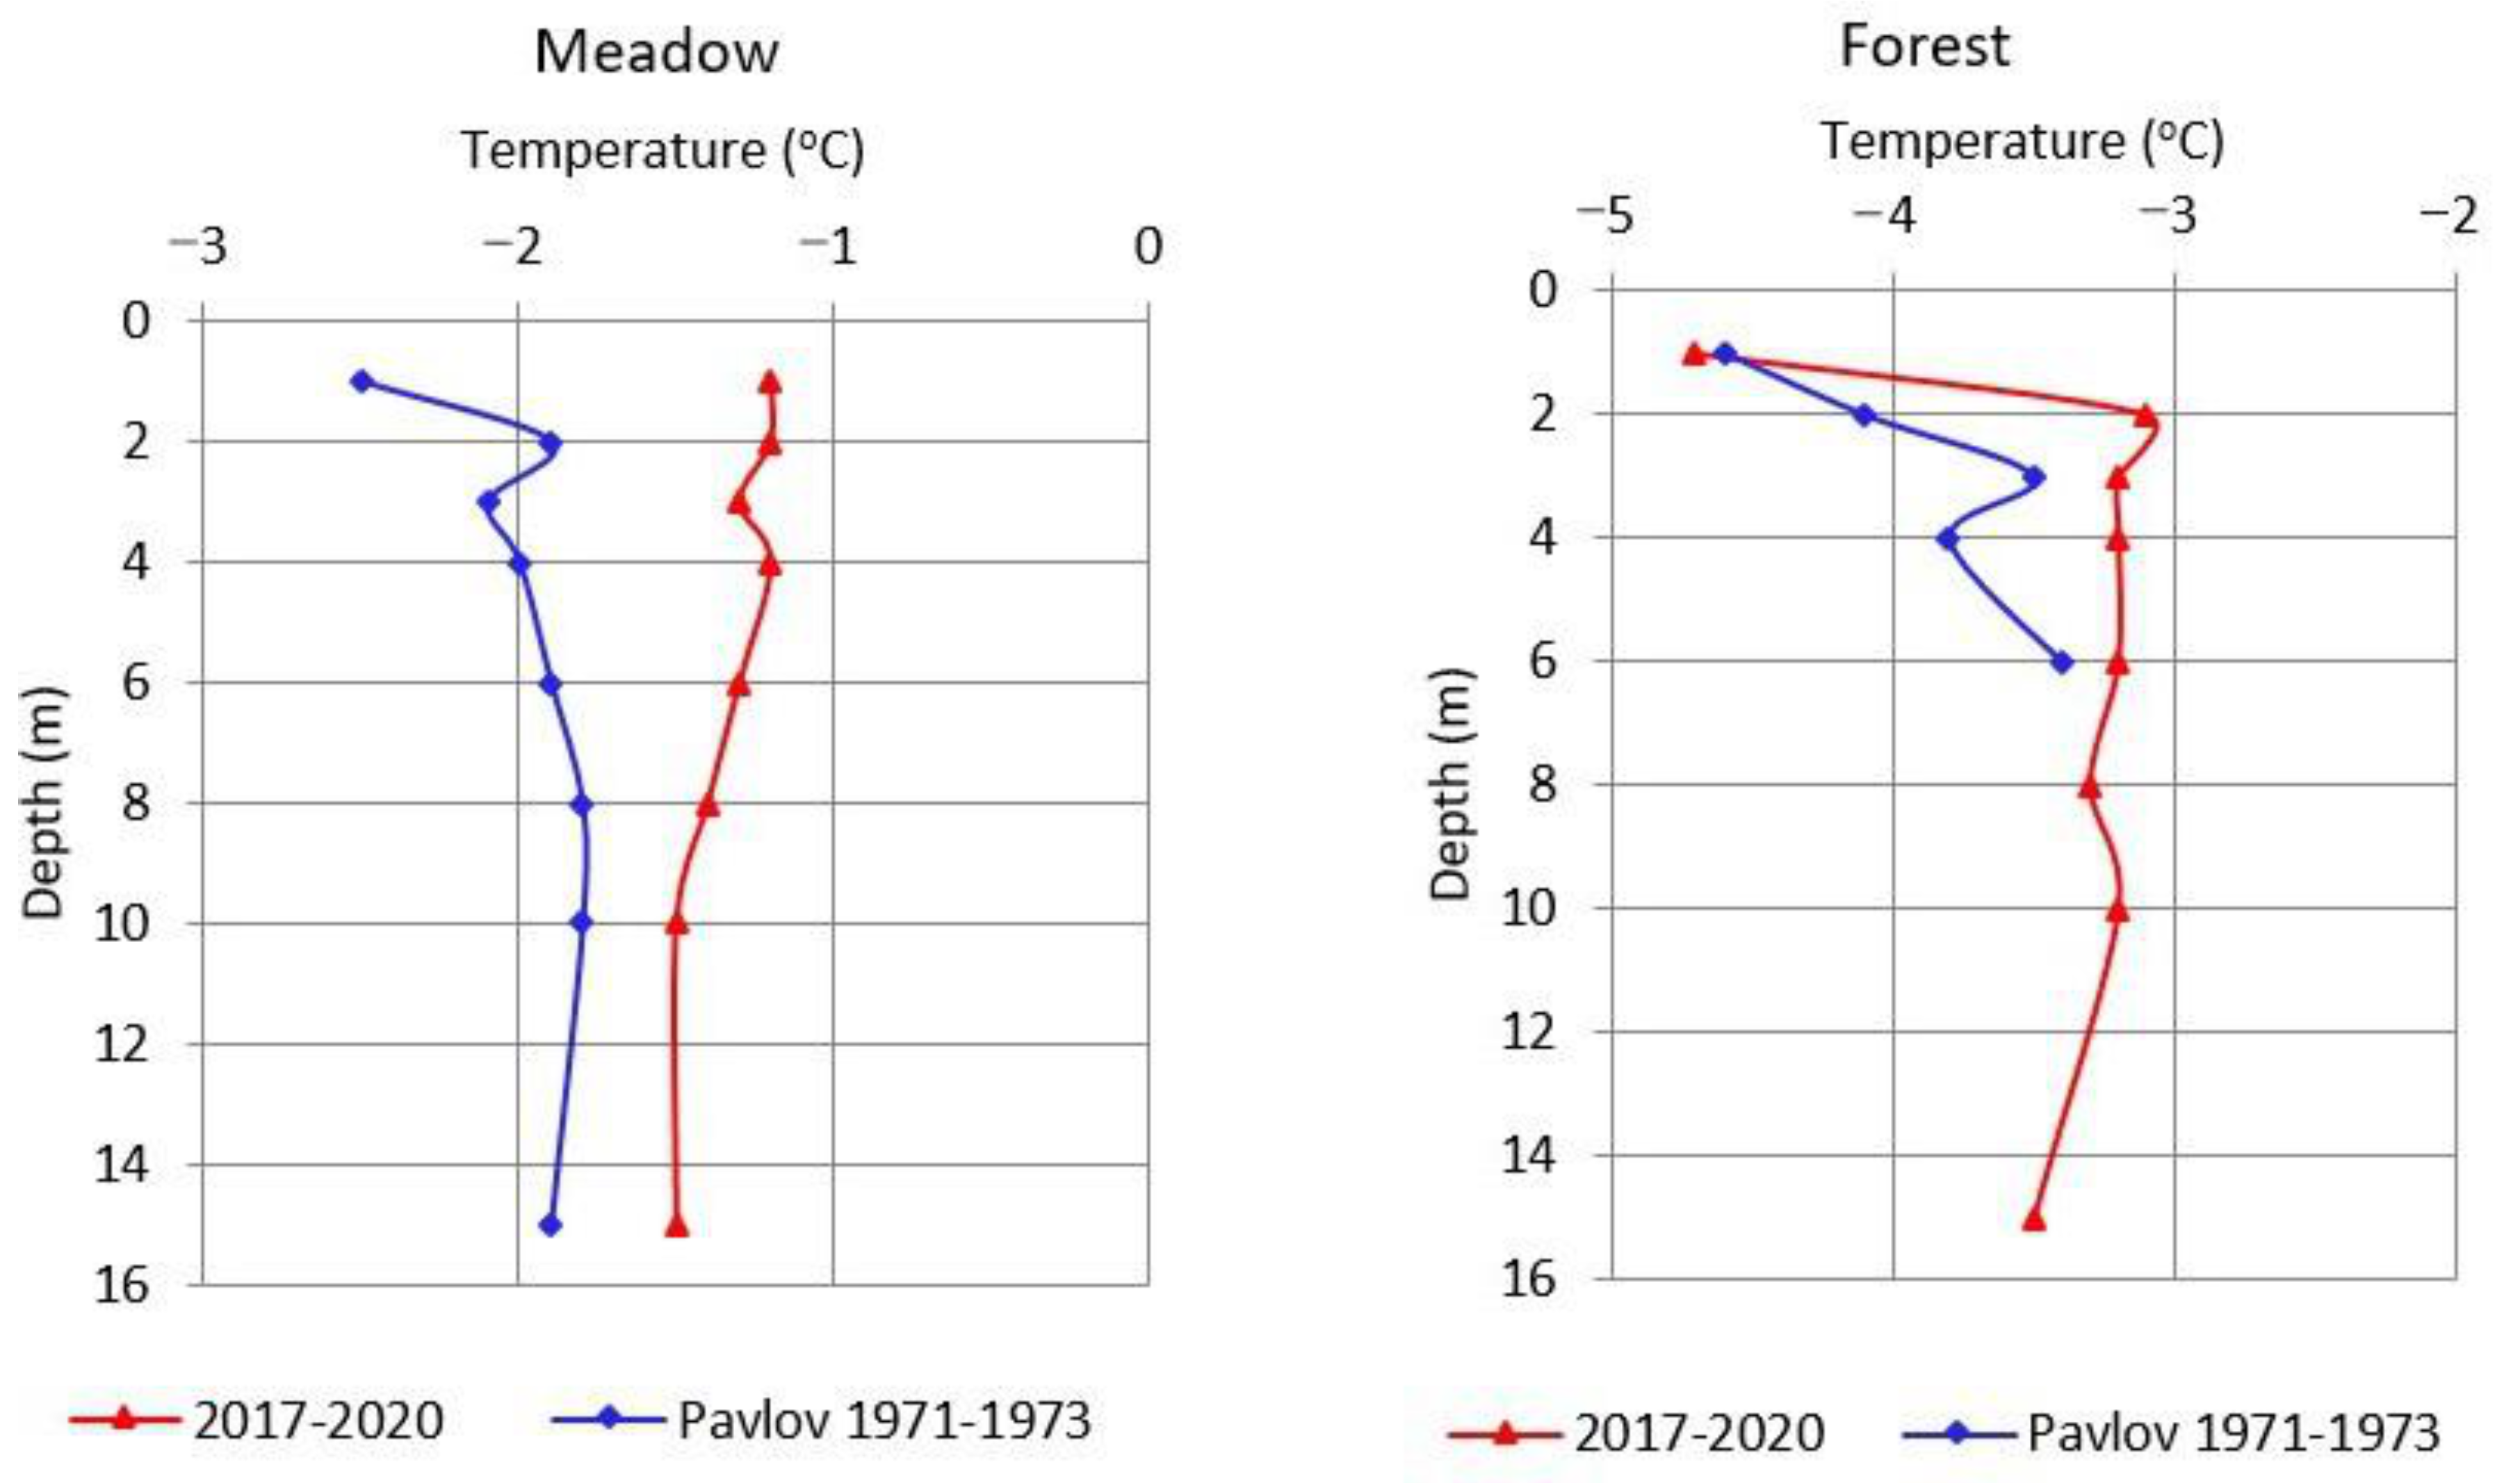
It is interesting to compare the average temperatures of sections over the last 45 years. Let us first turn to the meteorological conditions of the selected periods. As shown in
Table 4, in recent years, all months were warmer than they were in 1971–1975, and the mean annual air temperature was 3 °C higher, mainly due to the warmer winter months. At the same time, the average snow depth in 1971–1975 was 0.3 m, and in the period 2016–2020 it was 0.33 m.
In the meadow site, at 1 and 2 m depths, the mean annual ground temperature warmed by 1.3 and 0.7 °C (2016–2020), respectively. At depths of 3–6 and 8–15 m, the temperature increased by 0.8–1.6 and 0.4–0.3 °C, respectively (
Figure 10). In the forest, the changes in ground temperature were much less noticeable; at a depth of 6 m, the increase was only 0.2 °C.
Thus, the ground temperatures in the observed natural forest landscapes over the past 45 years, which experienced significant short-period fluctuations in the layer of zero amplitude, remained practically unchanged in terms of average annual values.
However, in open meadow complexes, the tendencies for an increase in ground temperature in the upper horizons of the permafrost were more significant, and confirmed the earlier conclusion made by Fedorov et al. [
48], that in the period 1980–2010, the rise in soil temperature was 1 °C in the treeless landscapes of Central Yakutia.
In general, in 1996–2019, the ground temperature increase trends at a depth of 10 m were 0.4 °C/10 years in a meadow and 0.2 °C/10 years in a forest (
Figure 11). The ground temperatures below 60 m remained stationary (
Table 5).
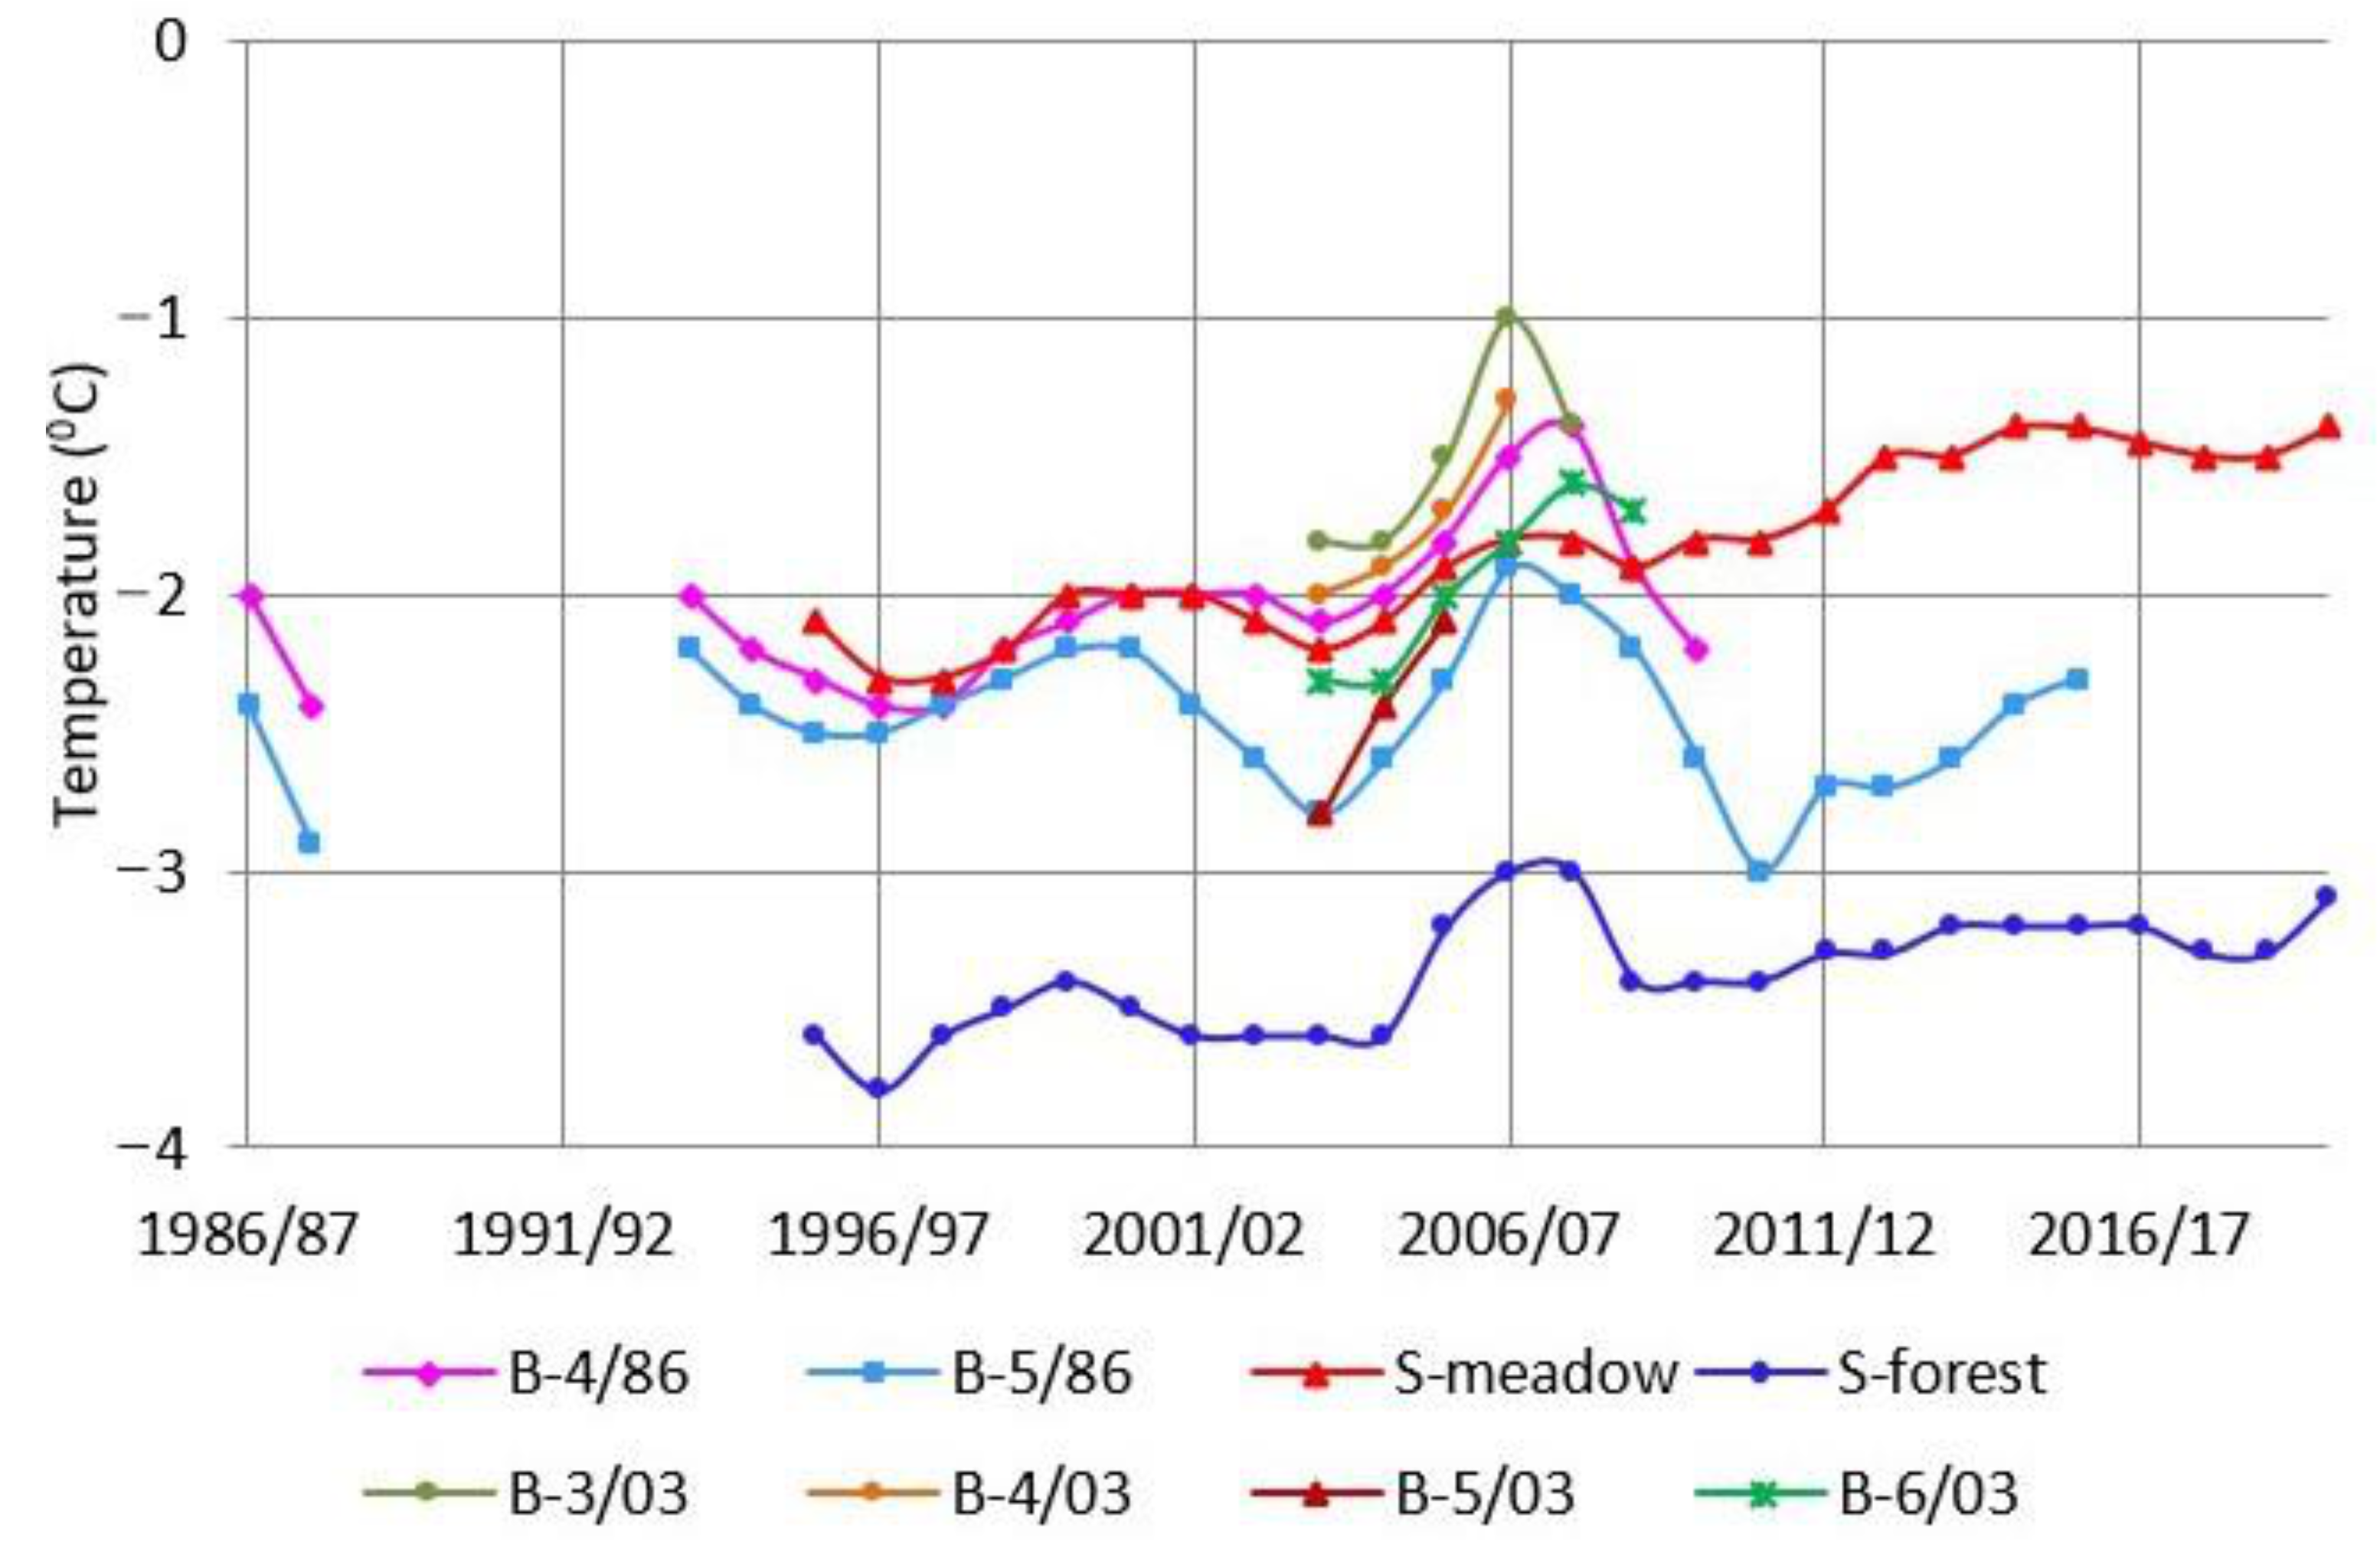
The nature of the long-term variability in the mean annual ground temperature at a depth of 10 m on the experimental plots of the Tuymaada station (see
Figure 11) confirms the data obtained at other sites in the vicinity of Yakutsk (
Figure 12). Thus, the long-term variability in the mean annual ground temperature is estimated to be up to 1.1 °C. In the vicinity of the city, the duration of the operation of thermometric boreholes is insufficient due to the allotment of land to other business entities, the repair of linear structures (roads, pipelines, etc.), or cases of vandalism.
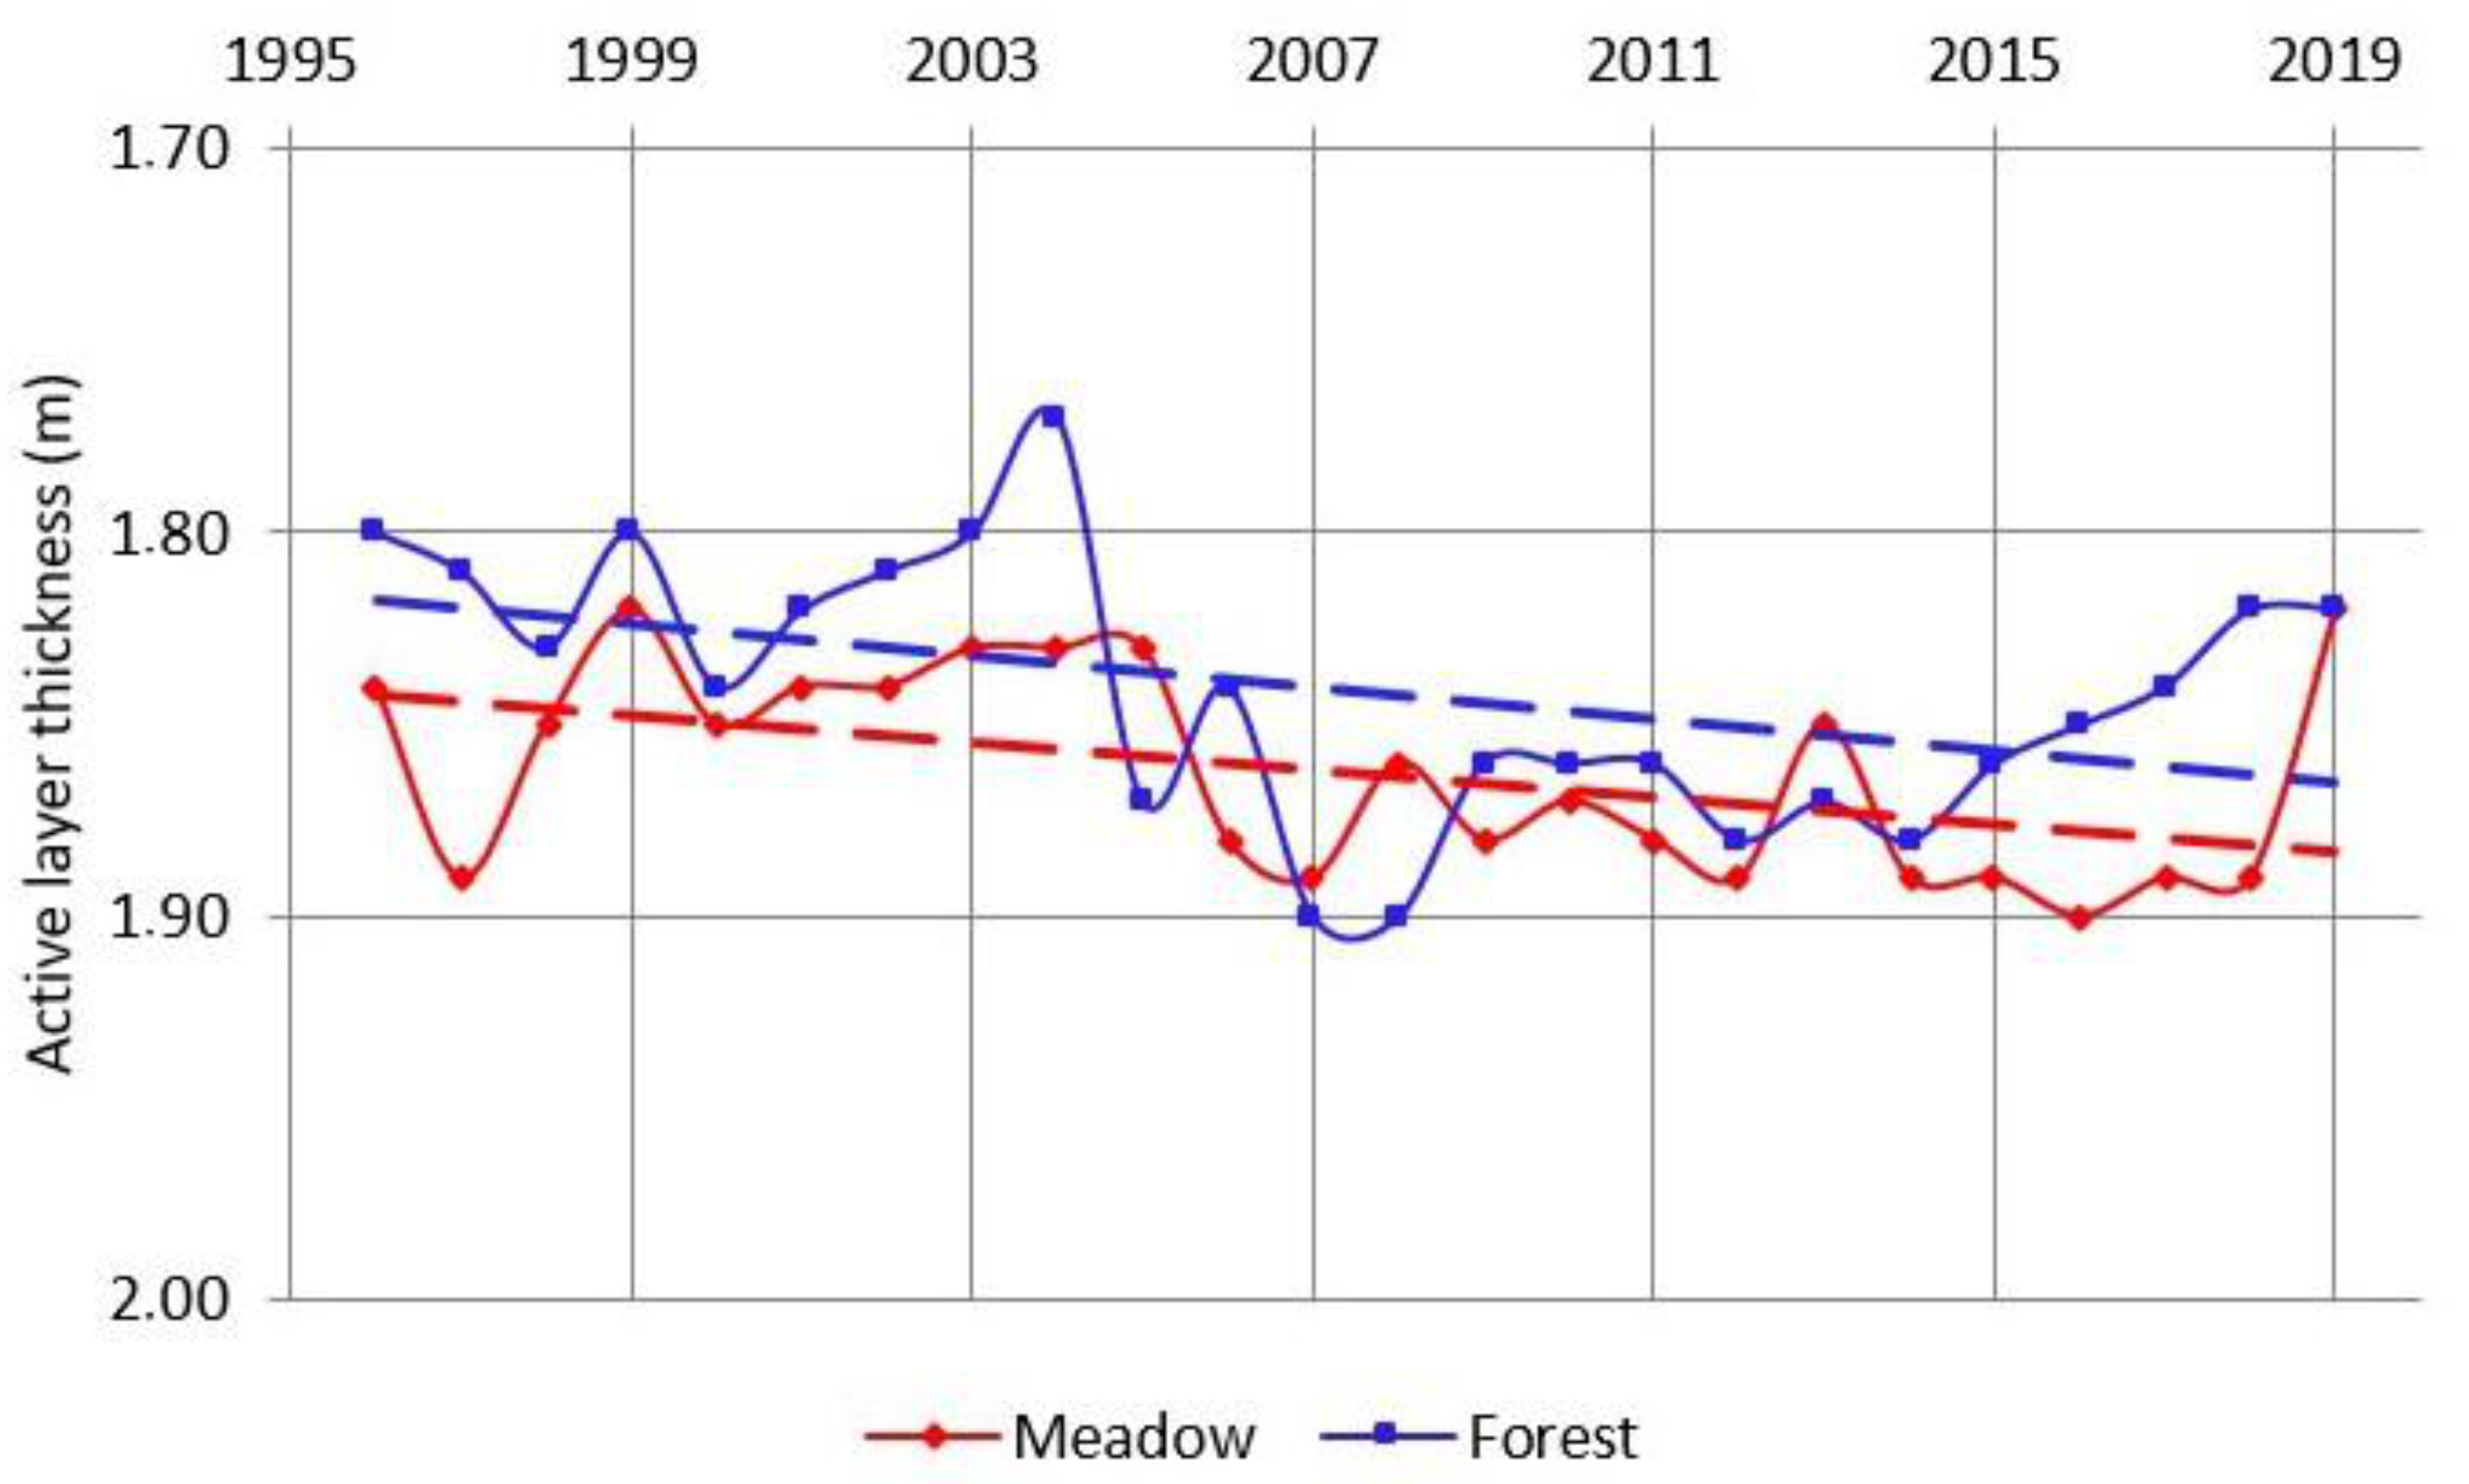
While the ground temperature of the layer of zero amplitude is characterized by a high interannual variability, the same cannot be said about the active layer thickness (ξ)—one of the main indicators of the thermal state of the upper layer of permafrost. Over the past 24 years, the value of ξ in the meadow varied within 1.82–1.90 m, averaging 1.86 m. In the forest, ξ changed from 1.77 m to 1.90 m, averaging 1.84 m. In general, for the period 1996–2019, the trends in the increase in active layer thickness were insignificant, and amounted to 2 cm/10 years in the forest and 1.8 cm/10 years in the meadow (
Figure 13). For comparison, from 1968 to 1976, ξ in the meadow varied from 1.73 to 1.95 m [
17], and the interannual variability was greater than in the last 24 years.


