Article

A Spatial Typography of Environmentally Friendly Common Agricultural Policy Support Relevant to European Green Deal Objectives

by
Roman Rudnicki
,
Łukasz Wiśniewski
* and
Mirosław Biczkowski
Department of Spatial Planning and Tourism, Faculty of Earth Sciences and Spatial Management, Nicolaus Copernicus University in Toruń, Lwowska 1, 87-100 Toruń, Poland
*
Author to whom correspondence should be addressed.
Land 2021, 10(10), 1092; https://doi.org/10.3390/land10101092
Submission received: 27 September 2021 / Revised: 12 October 2021 / Accepted: 12 October 2021 / Published: 15 October 2021
(This article belongs to the Special Issue Rural Space Modeling)

Abstract

:
The European Union (EU), through its implementation of the Common Agricultural Policy (CAP), is increasingly emphasising the development of environmentally friendly forms of agriculture. This is confirmed by, for example, the new European Green Deal (EGD). In Poland, the most important forms of CAP support for the environmentally friendly management of agricultural land were the following measures: agri-environment-climate measures (AECM) and organic farming (OF). These aid instruments facilitated the use of a range of packages and variants, which resulted in the pro-environmental forms of support offered by the CAP support having a very diverse internal structure. This study therefore attempts to synthesise the diversity of CAP financial support using spatial typology methods. The researched support measures were divided into three basic directions for developing agriculture: ecology, environment and habitat. The research procedure involved the D’Hondt method, the normalisation method, standardisation and correlation. The study was conducted on the example of Poland, and the basic territorial unit of analysis was the commune. It was shown that support for environmentally friendly activities in Poland related to almost 10% of the total farm area. The utilised agricultural area (UAA) covered by subsidies can be broken down as follows: organic farming—32.7%, environmental farming—31.8%, habitat farming—35.5%. The detailed results of the typology indicate the complexity of the spatial distribution of environmentally friendly CAP funds, which is defined by environmental determinants and the characteristics of the farms themselves. Farm-specific, non-environmental determinants were found to be the most significant, including farm size and managerial expertise.

1. Introduction

Implementing sustainable agricultural development requires a compromise between agricultural producers, who mainly aim to maximise outputs, and societal interests, among which care for the environment is growing in importance. Under the conditions of the Common Agricultural Policy (CAP), this is leading to a redefinition of the concept of agriculture, from the typical production approach to the holistic, sustainable and rational management of natural resources that are considered to be public goods subject to special protection [1,2].
This approach prioritises climate change mitigation, making the maintenance of extensive and biodiverse agricultural systems more important than the production (market) outputs of agriculture [3,4]. This justifies the expenditure of EU funds to support environmentally friendly activities in agriculture [5,6,7]. However, some studies to date have indicated that the current mechanism of EU payments in this area does not always guarantee that the assumed environmentally friendly changes will happen [8,9].
The issue of sustainable agriculture development also occupied an important place in the European Commission’s communication on the European Green Deal (EGD) published in December 2019—a new growth strategy that aims to transform the EU into a just, prosperous society, living in a modern, resource-efficient and competitive economy [10]. Implementing this plan will require that several green challenges be tackled (e.g., achieving net zero greenhouse gas emissions by 2050) to modernise the social and economic systems of Member States [11].
Particularly large changes will be required in agriculture, as evidenced by the future CAP’s premise that as much as 40% of total funds will be allocated to supporting climate-related goals [12]. In this respect, it is of key importance to implement the “Farm to Fork” strategy, which assumes, among other aspects, particularly strong support for areas used for organic farming, such that, by 2030, they constitute 25% of the agricultural land area [13,14,15]. This percentage compared to the area of organic farms in Poland and their small share in the total utilised agricultural area (about 3.0%) necessitates major scientific work (including spatial studies of agriculture). This indicates the need to develop a new, environmentally friendly model of agriculture that increasingly makes agriculture a sphere for producing environmental public goods [16,17].
It is assumed that implementing the EGD will be a major impetus for the development of Polish agriculture, which is distinguished by its predominance of small family farms (averaging c. 10 ha) and agricultural production that is often extensively used and preserves biodiversity [18].
The authors agree with Pe’re et al. [19] that it is necessary to search for new, more appropriate tools that can reliably assess initiatives undertaken to rationally manage natural resources in the agricultural sector [20]. The typology drawn up in this work (using an appropriate methodology) is part of the search for and development of appropriate instruments for assessing the implementation of environmentally friendly CAP measures.
Two CAP instruments implemented in Poland under the Rural Development Programme for 2014-20 (RDP 2014-20), i.e., the agri-environment–climate measure (AECM) and organic farming (OF), were adopted as the basis for this targeted research. They are a continuation of similar payments being implemented since Poland’s accession to the EU, i.e., the years 2004-06 and 2007-13. Their formal and legal characteristics are detailed in the relevant ordinances of the Minister of Agriculture and Rural Development [21,22]. The above green measures are part of the trend towards sustainable development, as they contribute to promoting practices designed to protect: soil; water and climate; valuable natural habitats and endangered species of birds; landscape diversity; and endangered genetic resources of crops and animals [23]. They constitute an important financial instrument for encouraging farmers to apply practices leading to the greening of agricultural production. Farmers receive financial resources as remuneration for undertaking specific actions in support of the natural environment as compensation for any potential loss in income in transitioning from intensive to extensive farming [24,25]. The analysed RDP instruments encourage farmers to act to protect the environment and biodiversity and to preserve the landscape, thereby raising their environmental awareness.
Because AECM and OF goals have not been universally achieved—especially within the scope discussed in this article—further research is needed to answer difficult questions. This applies both to the search for optimal solutions based on a catalogue of good agricultural practices and to scientific evidence. Farmer et al. [26] noted that research is needed that addresses the spatial correlation between the implementation of the agri-environment–climate measure (AECM; including organic farming) and environmental indicators at large spatial scales, to elucidate the impact of Agri-environmental payments on ecological targets. This points to a current research gap in the assessment of the rationality of spending CAP funds on green forms of agriculture, especially in the context of the natural predispositions of a given area. In connection with the above, the authors propose to extend the traditional spatial analysis of farmland covered by CAP payments (concerning individual measures, packages, variants) with a synthetic approach based on a tripartite division, involving support for three basic types of agriculture: ecological, environmental and habitat. This division is the basis for the spatial typology developed by the authors, which aims to systematise the various types of support offered under the CAP.
The main objective of the present research is to spatially delimit the selected types of environmentally friendly subsidies and to assess them in terms of the impact of environmental conditions and selected agricultural characteristics. This targeted analysis is also a preliminary part of wider research that aims to identify the mechanism shaping the spatial distribution of land covered by environmentally friendly CAP subsidies, which is the basis for inferring how to potentially increase their share in the total area of agricultural land, in line with the premises of the EGD.

2. Materials and Methods

2.1. Scope and Data

The study is limited to two measures of RDP 2014-20, namely AECM and OF, which were spatially analysed based on their total coverage of nearly 1.285 million hectares of utilised agricultural area (UAA). These comprise a complex system of pro-environmental payments covering seven basic categories (packages) and including 40 various forms of payment (variants, schemes; see Appendix A).
To simplify this complex system in a way that reflected the specifics of the individual measures (packages), the subsidised UAA areas were expertly divided by the type of agriculture supported, i.e.,
-
organic farming (O)—one package: the RDP 2014–20 measure;
-
environmental farming (E)—four AECM packages in total: sustainable agriculture; protection of soils and waters; preservation of traditional orchards; preservation of endangered plant genetic resources in agriculture;
-
habitat farming (H)—two AECM packages in total: valuable habitats and endangered bird species in Natura 2000 areas; valuable habitats outside Natura 2000 areas.
The proposed division approximates the level of greening of farming, which results from the requirements that the packages impose on farmers. The intensity of activities is reflected in the subsidy rates, the highest being for organic farming and the lowest for the sustainable agriculture package.
The determined spatial systems were assessed using a range of diagnostic attributes aggregated into two groups of conditions: environmental determinants and agricultural characteristics. On this basis, we attempted to answer the question: does a tract of farmland’s coverage by pro-environmental payments result from its environmental conditions or from the nature of the agricultural activity?
The study covers the territory of Poland, according to its system of 16 provinces (tabular presentation) subdivided into a total of 2477 communities (Pol. gmina) (cartographic presentation). Spatial analysis was based on the 2282 communities in which there was land subsidised by the various green measures (in 195 communities, no financial support from these measures was recorded).
The timeframe related to the CAP 2014-20 financial framework. Given that pro-environmental payments and commitments are long-term in nature (generally 5 years), the analysis was based on long-term average areas of subsidised land (AECM—2015-20; OF—2017-20).
The source material used comprised public data from the Local Data Bank of Statistics Poland (LDB)(Pol. BDL GUS) in Warsaw (PSR 2010) and the Institute of Soil Science and Plant (Pol. IUNiG) in Puławy (for environmental conditions) and data provided by the Agency for Restructuring and Modernisation of Agriculture (ARMA)—the disburser of CAP funds in Poland.

2.2. Methods

The study primarily employed two methods.
The first was to normalise the diagnostic attributes and present them as averaged values (the Perkal index) [27,28]. This entailed a synthetic approach to environmental determinants and selected agricultural characteristics. Calculations were made according to the formula:
Z j i = ( X j i a v g . X i ) δ i ,
where: Z j i —normalised value of diagnostic feature “ i ” in spatial unit “ j ”; X j i —value of diagnostic feature “ i ” in spatial unit “ j ”; a v g . X i —mean value of diagnostic feature “ i ”; δ i —standard deviation of diagnostic feature i ”.
The baseline values (national averages) of the indices so constructed were used as the basis for the spatial delimitation of values. In the cartographic presentation—assuming a threshold of ±0.5 of a standard deviation (δ)—four classes were distinguished, while in the statistical analyses (see tables), the indices for spatial units were generalised into two groups: above the national average (↑) and below (↓).
The second method was the D’Hondt method [29], which allows any structure to be objectively examined [30,31]. The method is practically applied, among others, to distributing seats in the electoral systems of many countries [32]. In this case, it consists, in essence, of dividing each absolute value or percentage assigned to O, E and H by the integers 1 to 6, producing a set of 18 quotients. Then, the six largest quotients are selected from this set. Next, each tested element (O, E and H) is assigned a weighting corresponding directly numerically to how many of these six largest quotients belong to it (i.e., if one of the six largest quotients belongs to O, O is weighted as 1, etc.). The analysed distributions were spatially delimited based on this weighting, conventionally reflecting the share of a given element as: 1—very low, 2—low, 3—significant, 4—high, 5—very high, 6—total dominance in the distribution. The predominant number of quotients was adopted as the criterion, and the number of quotients was aggregated into two groups (of 1, 2, 3, 4 quotients, and of 5 and 6 quotients), and this was used as the basis of the spatial typology of the breakdown of subsidised land by type of pro-environmental payments. This division into two groups of quotient numbers highlighted areas with the highest shares of a given type of support. Attempts to use a larger number of quotient groups (e.g., first group—1 and 2 quotients; second group—3 and 4 quotients; third group—5 and 6 quotients) significantly increased the number of sub-types, thereby worsening the readability and making spatial interpretation difficult.
The discussed method was used mainly for its modifiability (aggregation into a system of two groups) and the clarity of interpretation of results, i.e., the identification and characterisation of individual types. The typology was based on an a posterioriapproach that consists of distinguishing typological classes and identifying types [33].
The research also used Pearson’s linear correlation coefficient (r). This made it possible to assess the strength and direction of the relationship between the structure and the level of support for the researched measures and the determinants of the green development of agriculture in Poland.

2.3. Identification of Determinants: Planes for the Evaluation of Pro-Environmental Payments

To more fully interpret the spatial differentiation of farmland covered by pro-environmental payments, diagnostic attributes were distinguished that were expressed as average normalised values and then used as the basis for assessing the environmental determinants and the level of selected characteristics of farms.
Environmental determinants were analysed using three diagnostic attributes, i.e.,
-
less favoured areas (LFA), as % of total area (according to ARMA, as of 2019);
-
protected areas, as % of total area (according to BDL GUS, as of 2019);
-
soils of the lowest soil quality classes (V, VI), as % of UAA (according to IUNiG, as of 2010).
In addition to environmental determinants, the research also attempted to assess the impact of selected non-environmental characteristics. Despite the numerous determinants featured in the literature (level of socio-economic development, state agropolitics, sales markets, level of urbanisation) [34], this was done using only the following three diagnostic farm characteristics:
-
average farm area (according to ARMA): because payment sizes depend on UAA, this is an important financial stimulus in the adoption of agri-environmental obligations.
-
share of farm managers with higher education (according to PSR 2010): educational level affects the level of ecological awareness, and is relevant to green activities in agriculture.
-
level of land productivity (total agricultural production in PLN per 1 ha of UAA): a determinant of the extensification of agricultural production. Land productivity was calculated by multiplying the areas of specific crops by the 2010 Standard Output (SO) coefficient. Standard Output is calculated by Poland’s Institute of Agricultural and Food Economics National Research Institute (Instytut Ekonomiki Rolnictwa i Gospodarki ŻywnościowejPaństwowy Instytut Badawczy) as the 5-year average of production per hectare of crop in regional average production conditions.
Furthermore, it should be emphasised that the spatial differentiation of the characteristics taken into account is a result of economic history and dates back to the 18th century [35]. At that time, Poland underwent what is referred to as the three ‘Partitions’, which involved the loss of rule to Russia, Prussia and Austria, as a result of which the area of Poland was shrinking gradually until the Polish state ceased to exist altogether after the third Partition. The more than 120 years of foreign rule resulted in the socio-economic polarisation of Polish territory. The divides between the eastern, western and southern parts of the Polish territory were so deep, strong and conspicuous that they are still perceivable today, such as in the structure of agriculture and agricultural practices [36].

3. Results

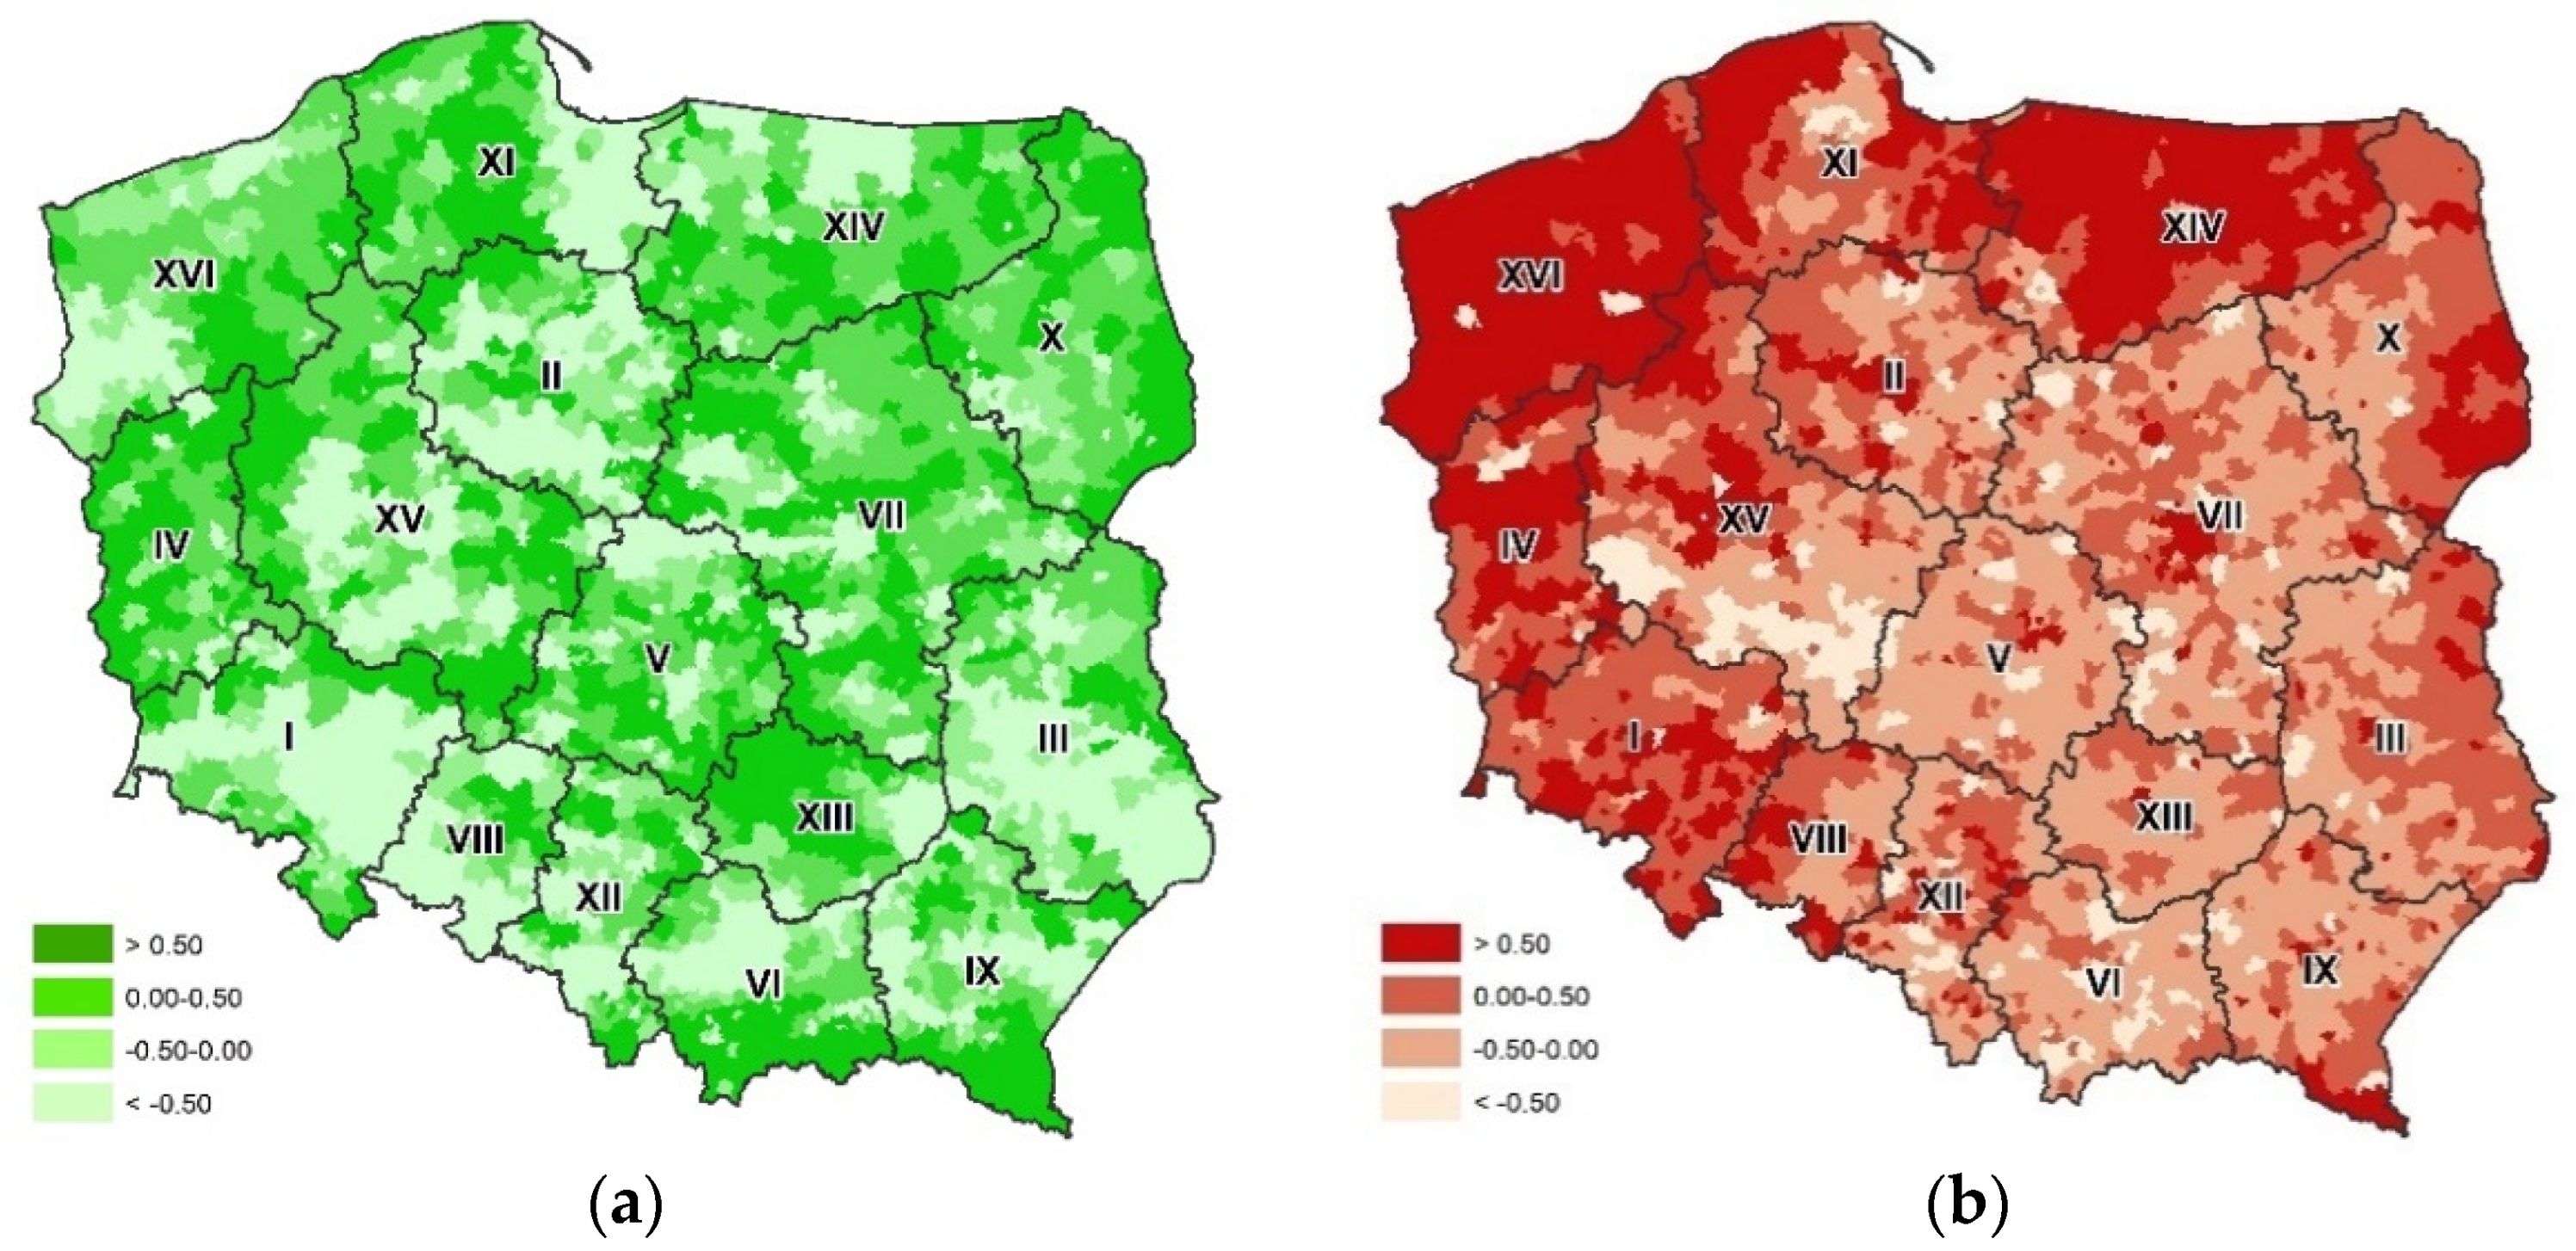
3.1. Determinants of Green Agricultural Development in Poland

The quality of the natural environment was assumed to determine the intensity and direction of development of a green agricultural management system. Support may provide a special alternative to the traditional (high-productivity) approach of farms in less favoured areas (that often have lower productivity), including those with poor-quality soils. On the other hand, the introduction of environmentally friendly agricultural practices should be particularly important in areas of high natural value containing legally protected areas.
The analysis showed that the three diagnostic attributes (see Section 2.3) determined the environmental determinants index, which stands out as being highly spatial and regionally differentiated (from −0.46 in Lower Silesia Province and −0.49 in Opole Province to 0.47 in Lubusz Province—see Table 1), and above all in the distribution of communities (see Figure 1a). The level of environmental determinants (index below −0.50) was low in 832 communities (33.6% of the total) usually located within the borders of the provinces of Lower Silesia and Lublin. Conversely, the index was high (above 0.50, indicating a significant agricultural predisposition to environmentally friendly activities) in 621 communities (25.1% of the total), which were most numerous in the provinces of Central Poland—Łódź and Masovia (see Figure 1a).
The agricultural characteristics index exhibited a similarly strong spatial differentiation (see Figure 1b).There were 163 communities (6.6% of total) with a low index (below −0.50), with the most being in the provinces of Lesser Poland, Masovia and Greater Poland. By contrast, the 0.50 threshold was exceeded (i.e., high index values), indicating favourable agricultural determinants, in 523 communities (21.1% of the total) concentrated in three provinces of Northern and Western Poland: Lower Silesia, Warmia-Masuria and West Pomerania (see Figure 1b).
Of the 2282 surveyed communities receiving pro-environmental subsidies, only 252 (11.0%) had high levels of both environmental determinants and the selected agricultural characteristics. These areas are particularly predestined for the development of green management methods. By contrast, only 153 communities (6.7%) had low scores.

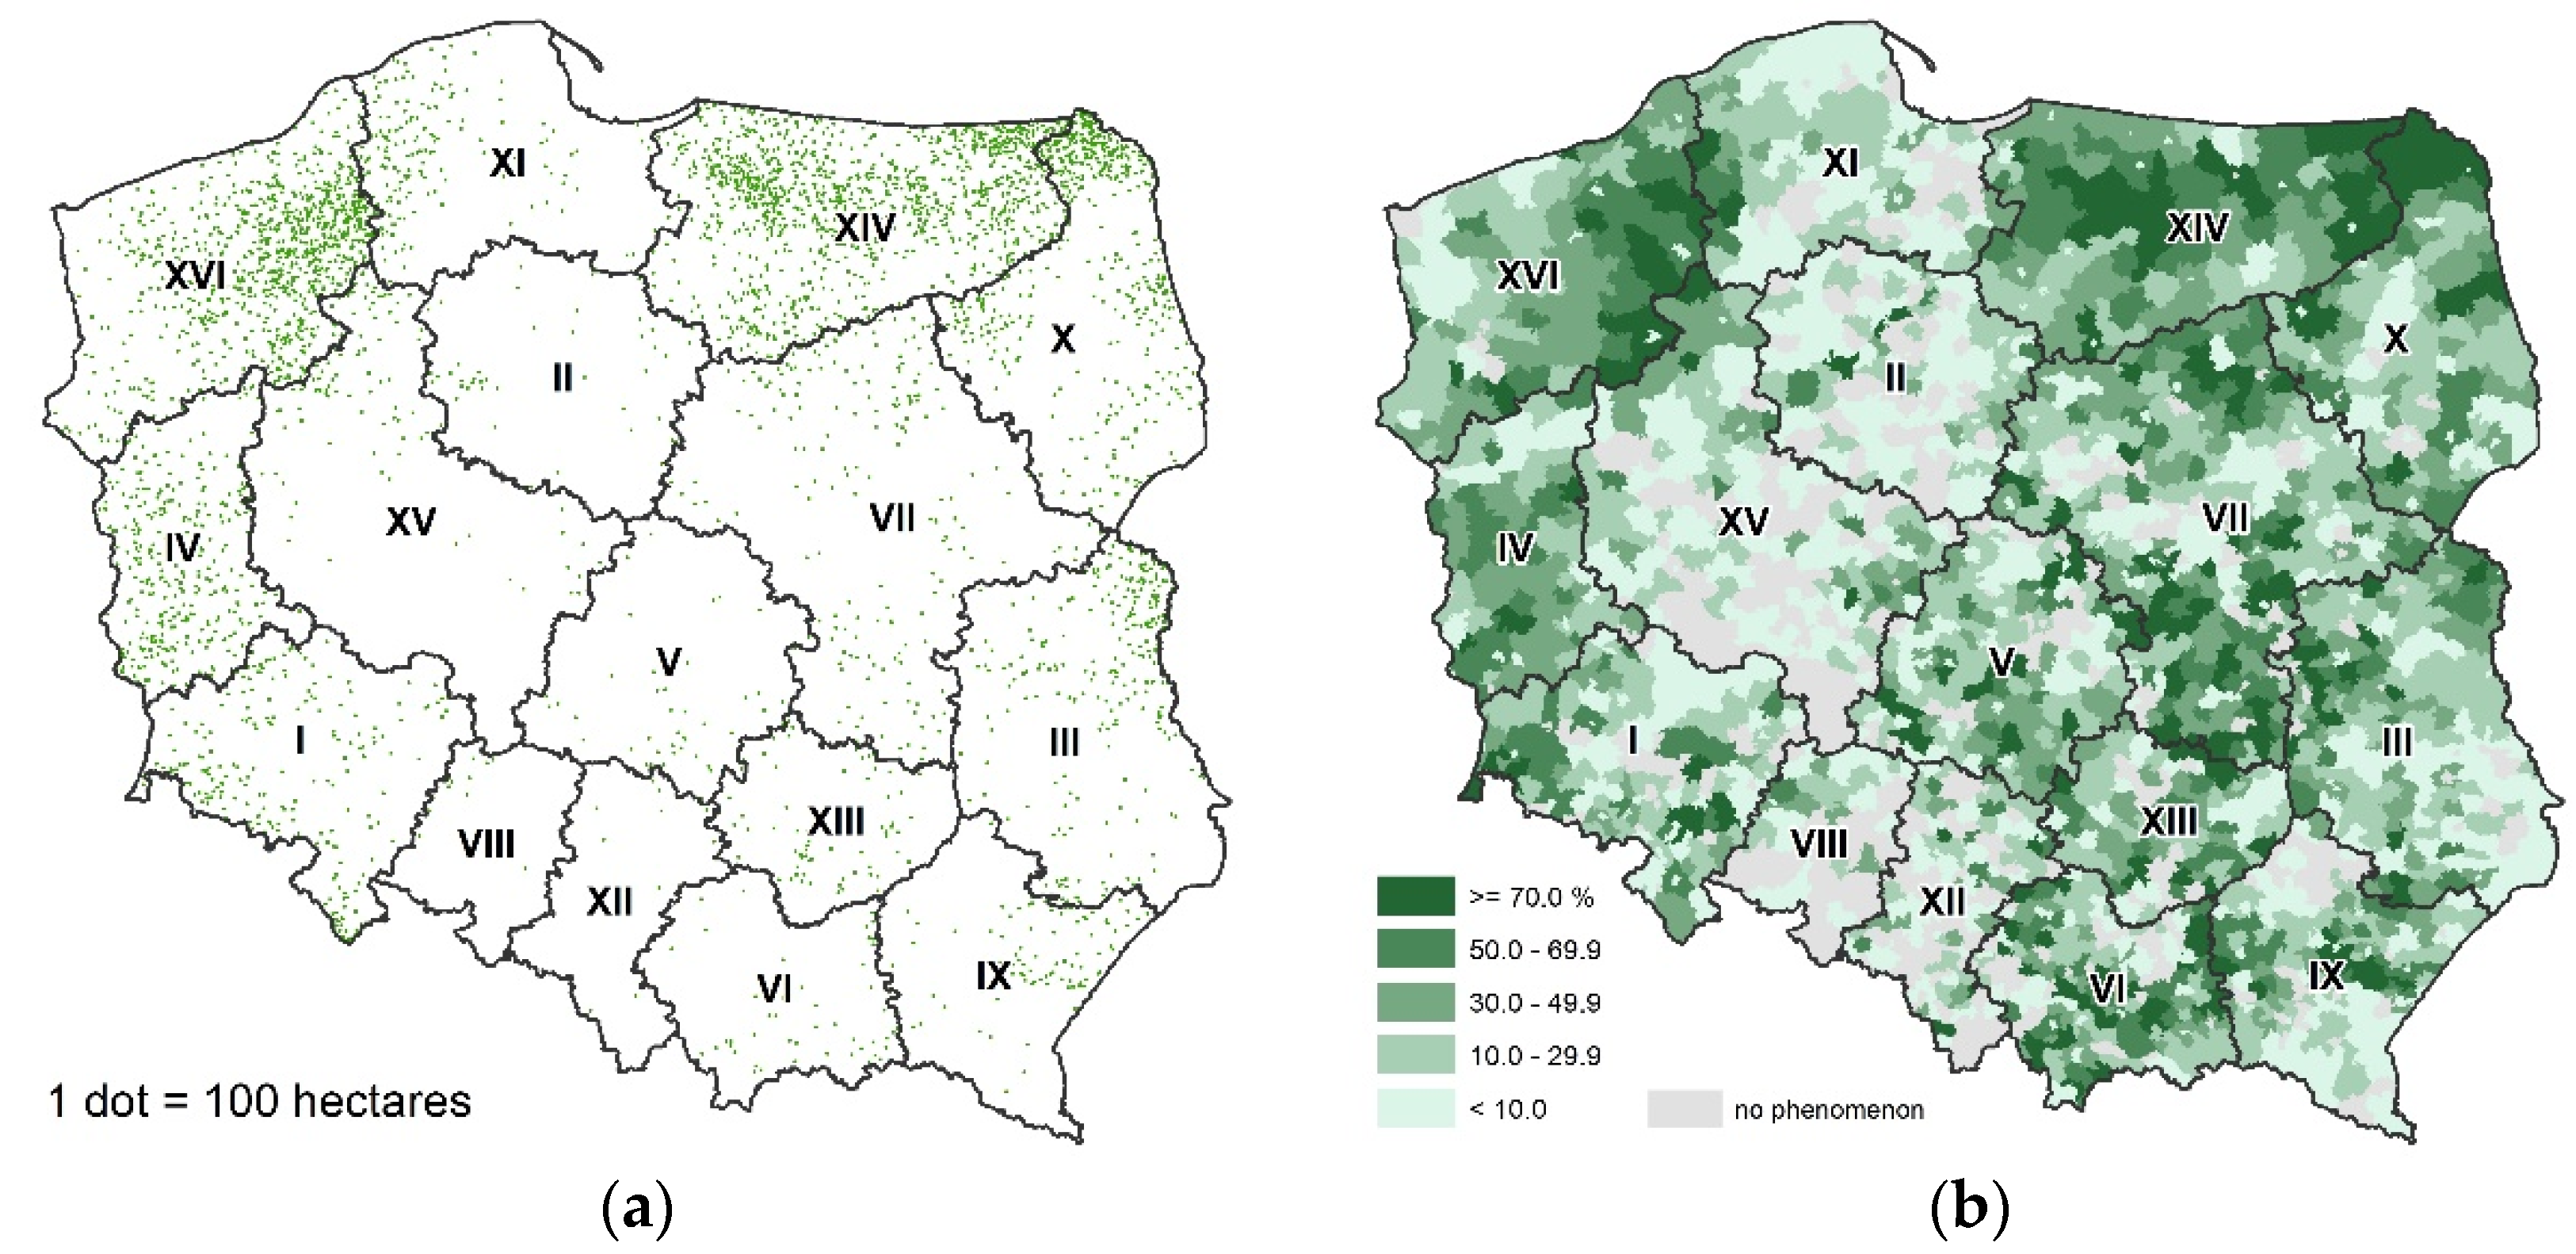
3.2. Farmlands Subsidised for Implementing the Pro-Environmental Obligations of RDP 2014-20

Analysis of the ARMA data showed that, on average, 1.2849 million hectares per year were covered by green activities (AECM and OF—total) (see Table 2; Figure 2a). Land covered by pro-environmental support amounted to 9.2% of the total area of agricultural holdings, which is low compared to the leading EU countries in this respect (e.g., in Germany, the area subsidised by the agri-environmental programme is nearly 5.3 million ha, i.e., around one quarter of total UAA [37]).
This percentage, which indicates the territorial significance of green activities in agriculture, is highly spatially diversified. At the regional level, it ranges from 2.3% in Łódź Province to over 20.0% in Lubusz (24.6%), Warmia-Masuria (21.2%) and West Pomerania (23.8%; see Table 2).
According to communities, the variation in the percentages of land covered by pro-environmental support ranges from less than 3% in 886 units (including by the least, at less than 0.1% in 22 communities) to over 15.0% in 439 communities and over 35% in 150 communities (see Figure 2b).
The spatial distribution of the analysed farmlands was evaluated as correlating poorly with environmental conditions (r = 0.165). A significant difference in the proportion of land receiving support from pro-environmental measures was also confirmed to exist between communities with unfavourable (↓ 5.7%) and favourable (↑ 13.0%) environmental conditions. There was a much stronger relationship between land covered by pro-environmental support (in table: subsidised land as % of farms and agricultural determinants (a synthetic indicator derived from diagnostic attributes: average farm area; farms run by farmers with higher education, as % of total; land productivity)) (r = 0.397). This indicates that the nature of the farm itself (acreage, productivity) and the education of its manager play a significant role in the use of environmentally friendly farming methods.

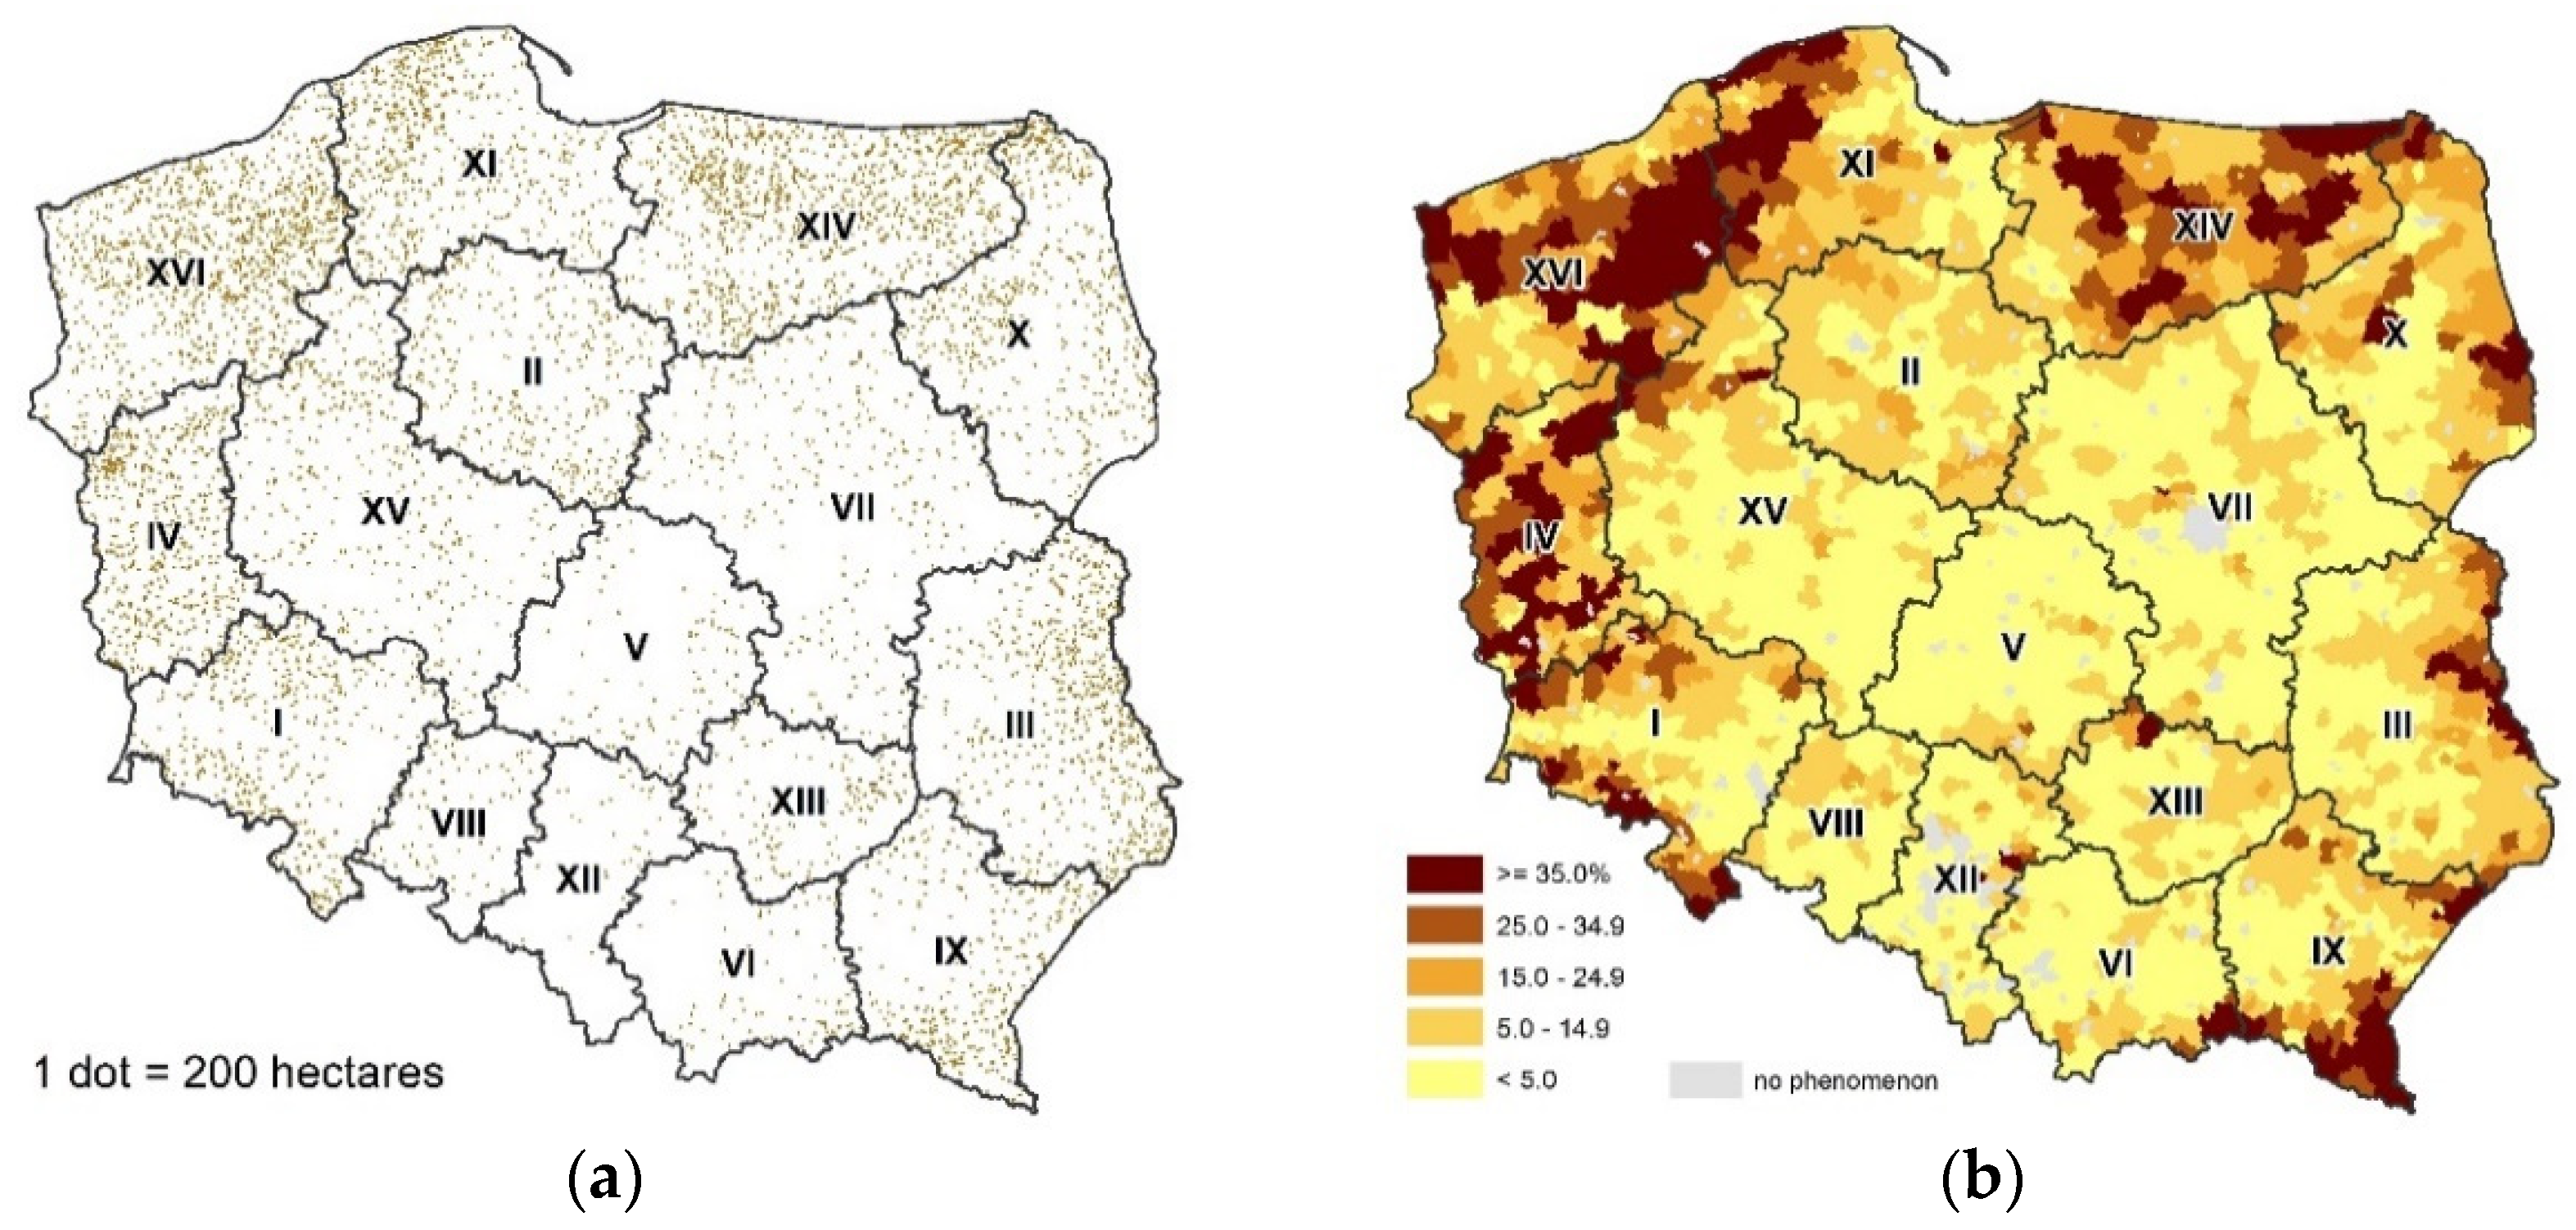
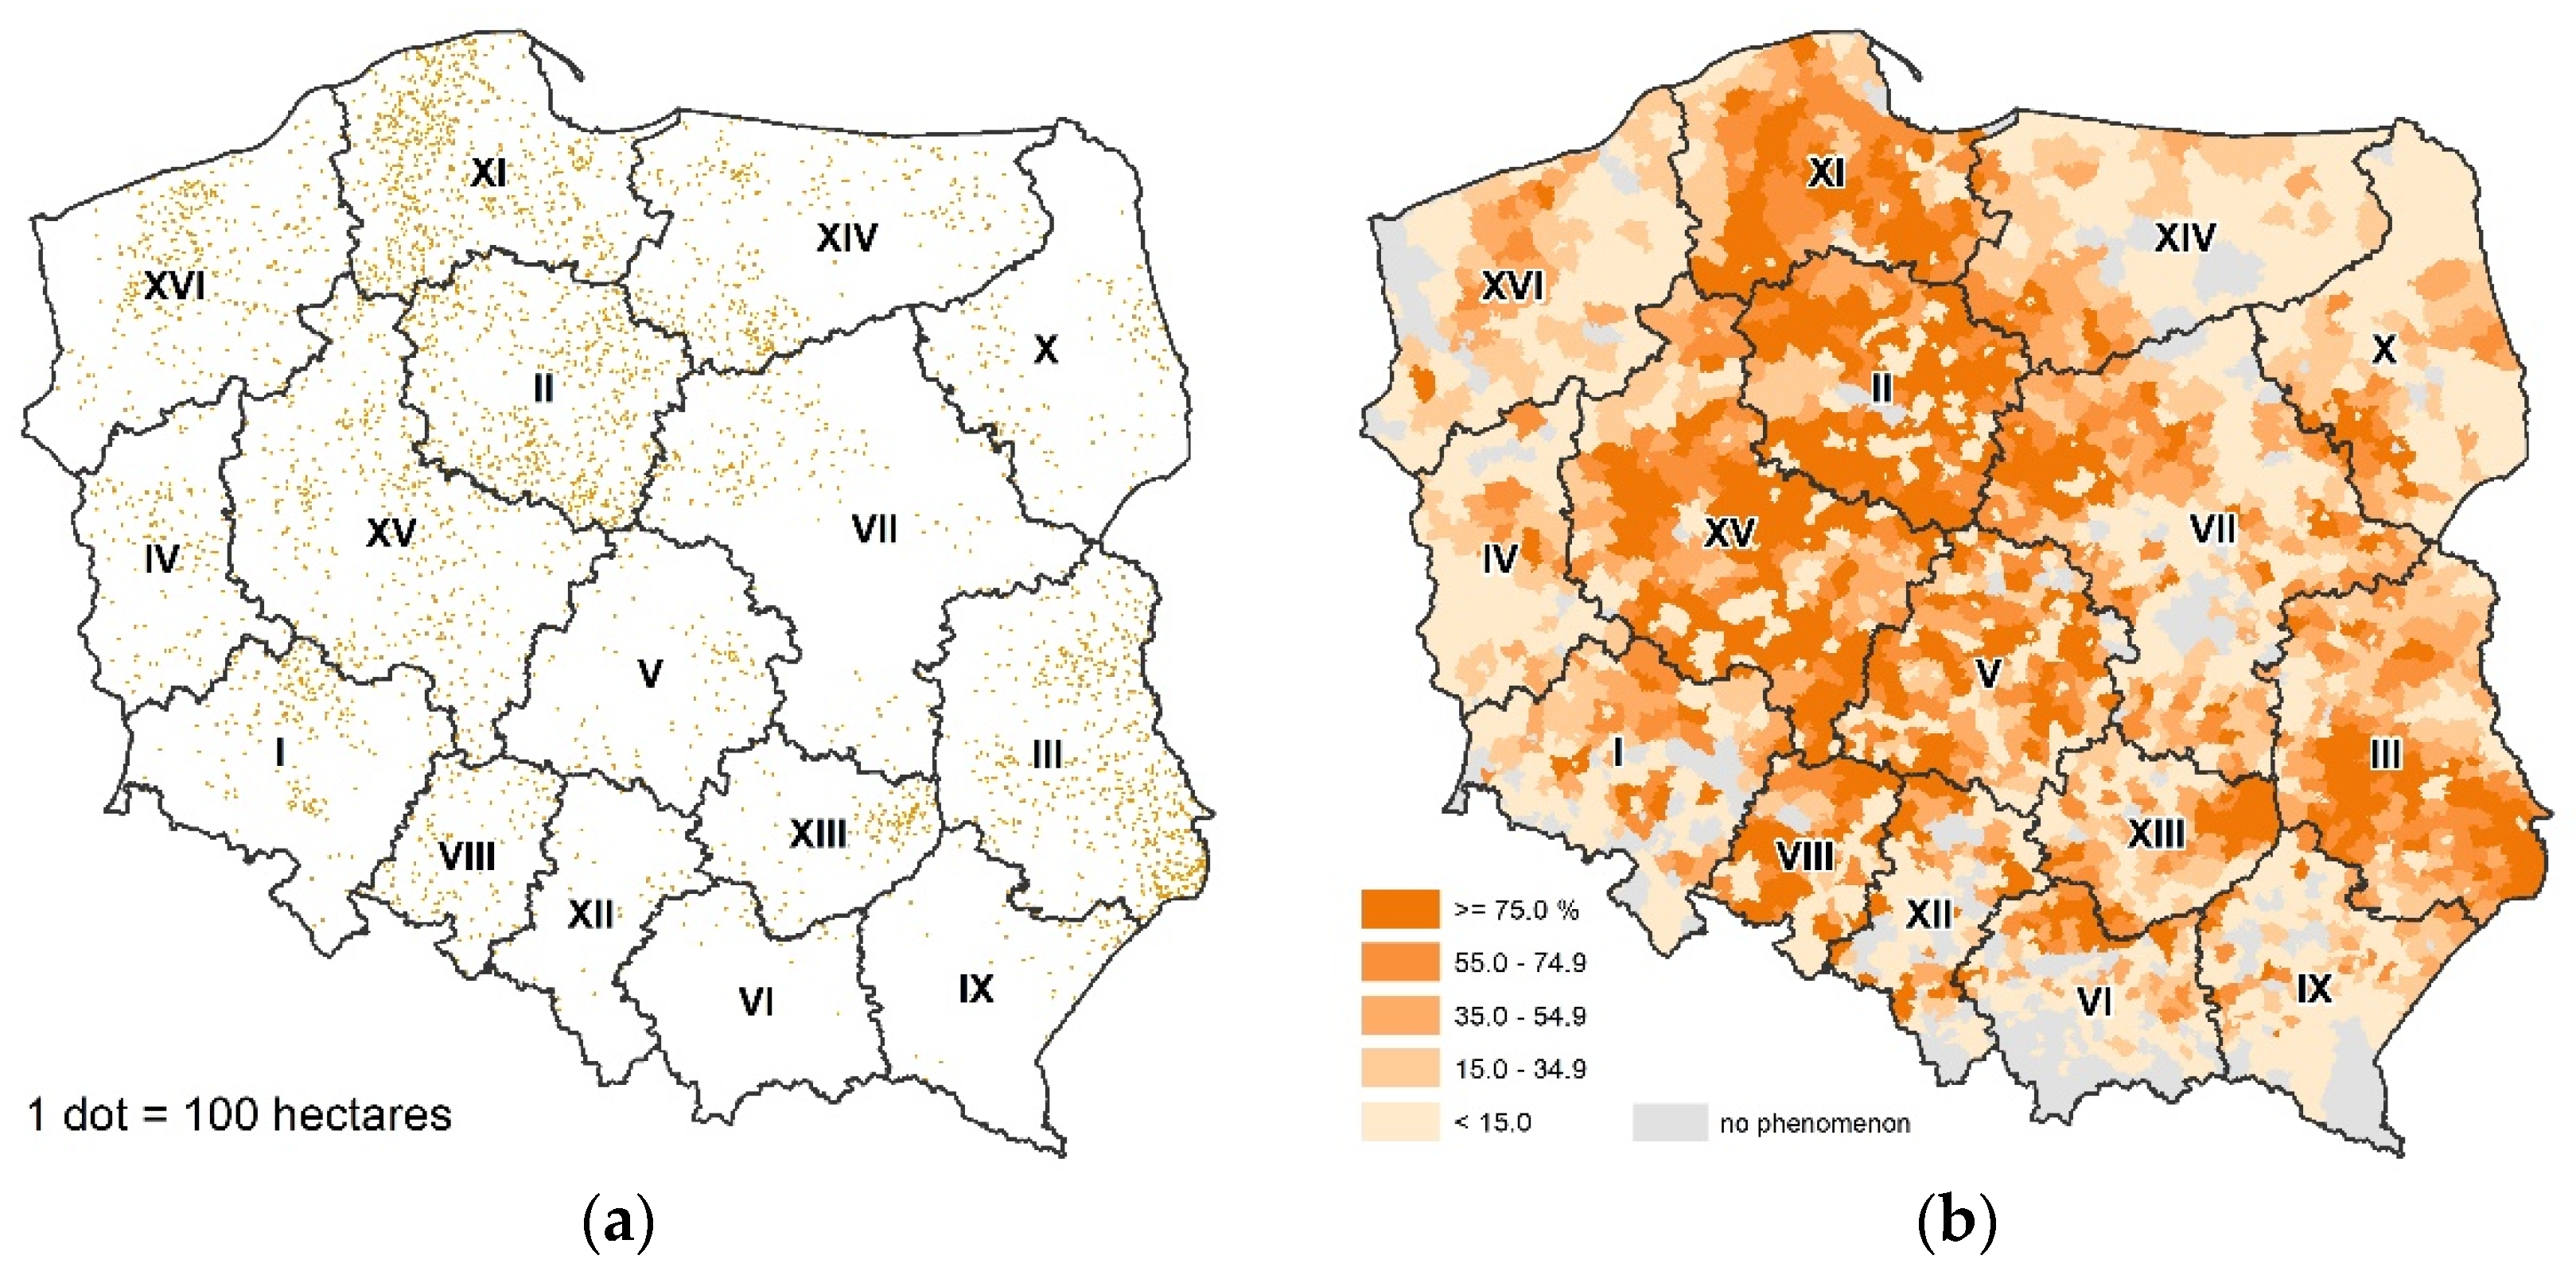
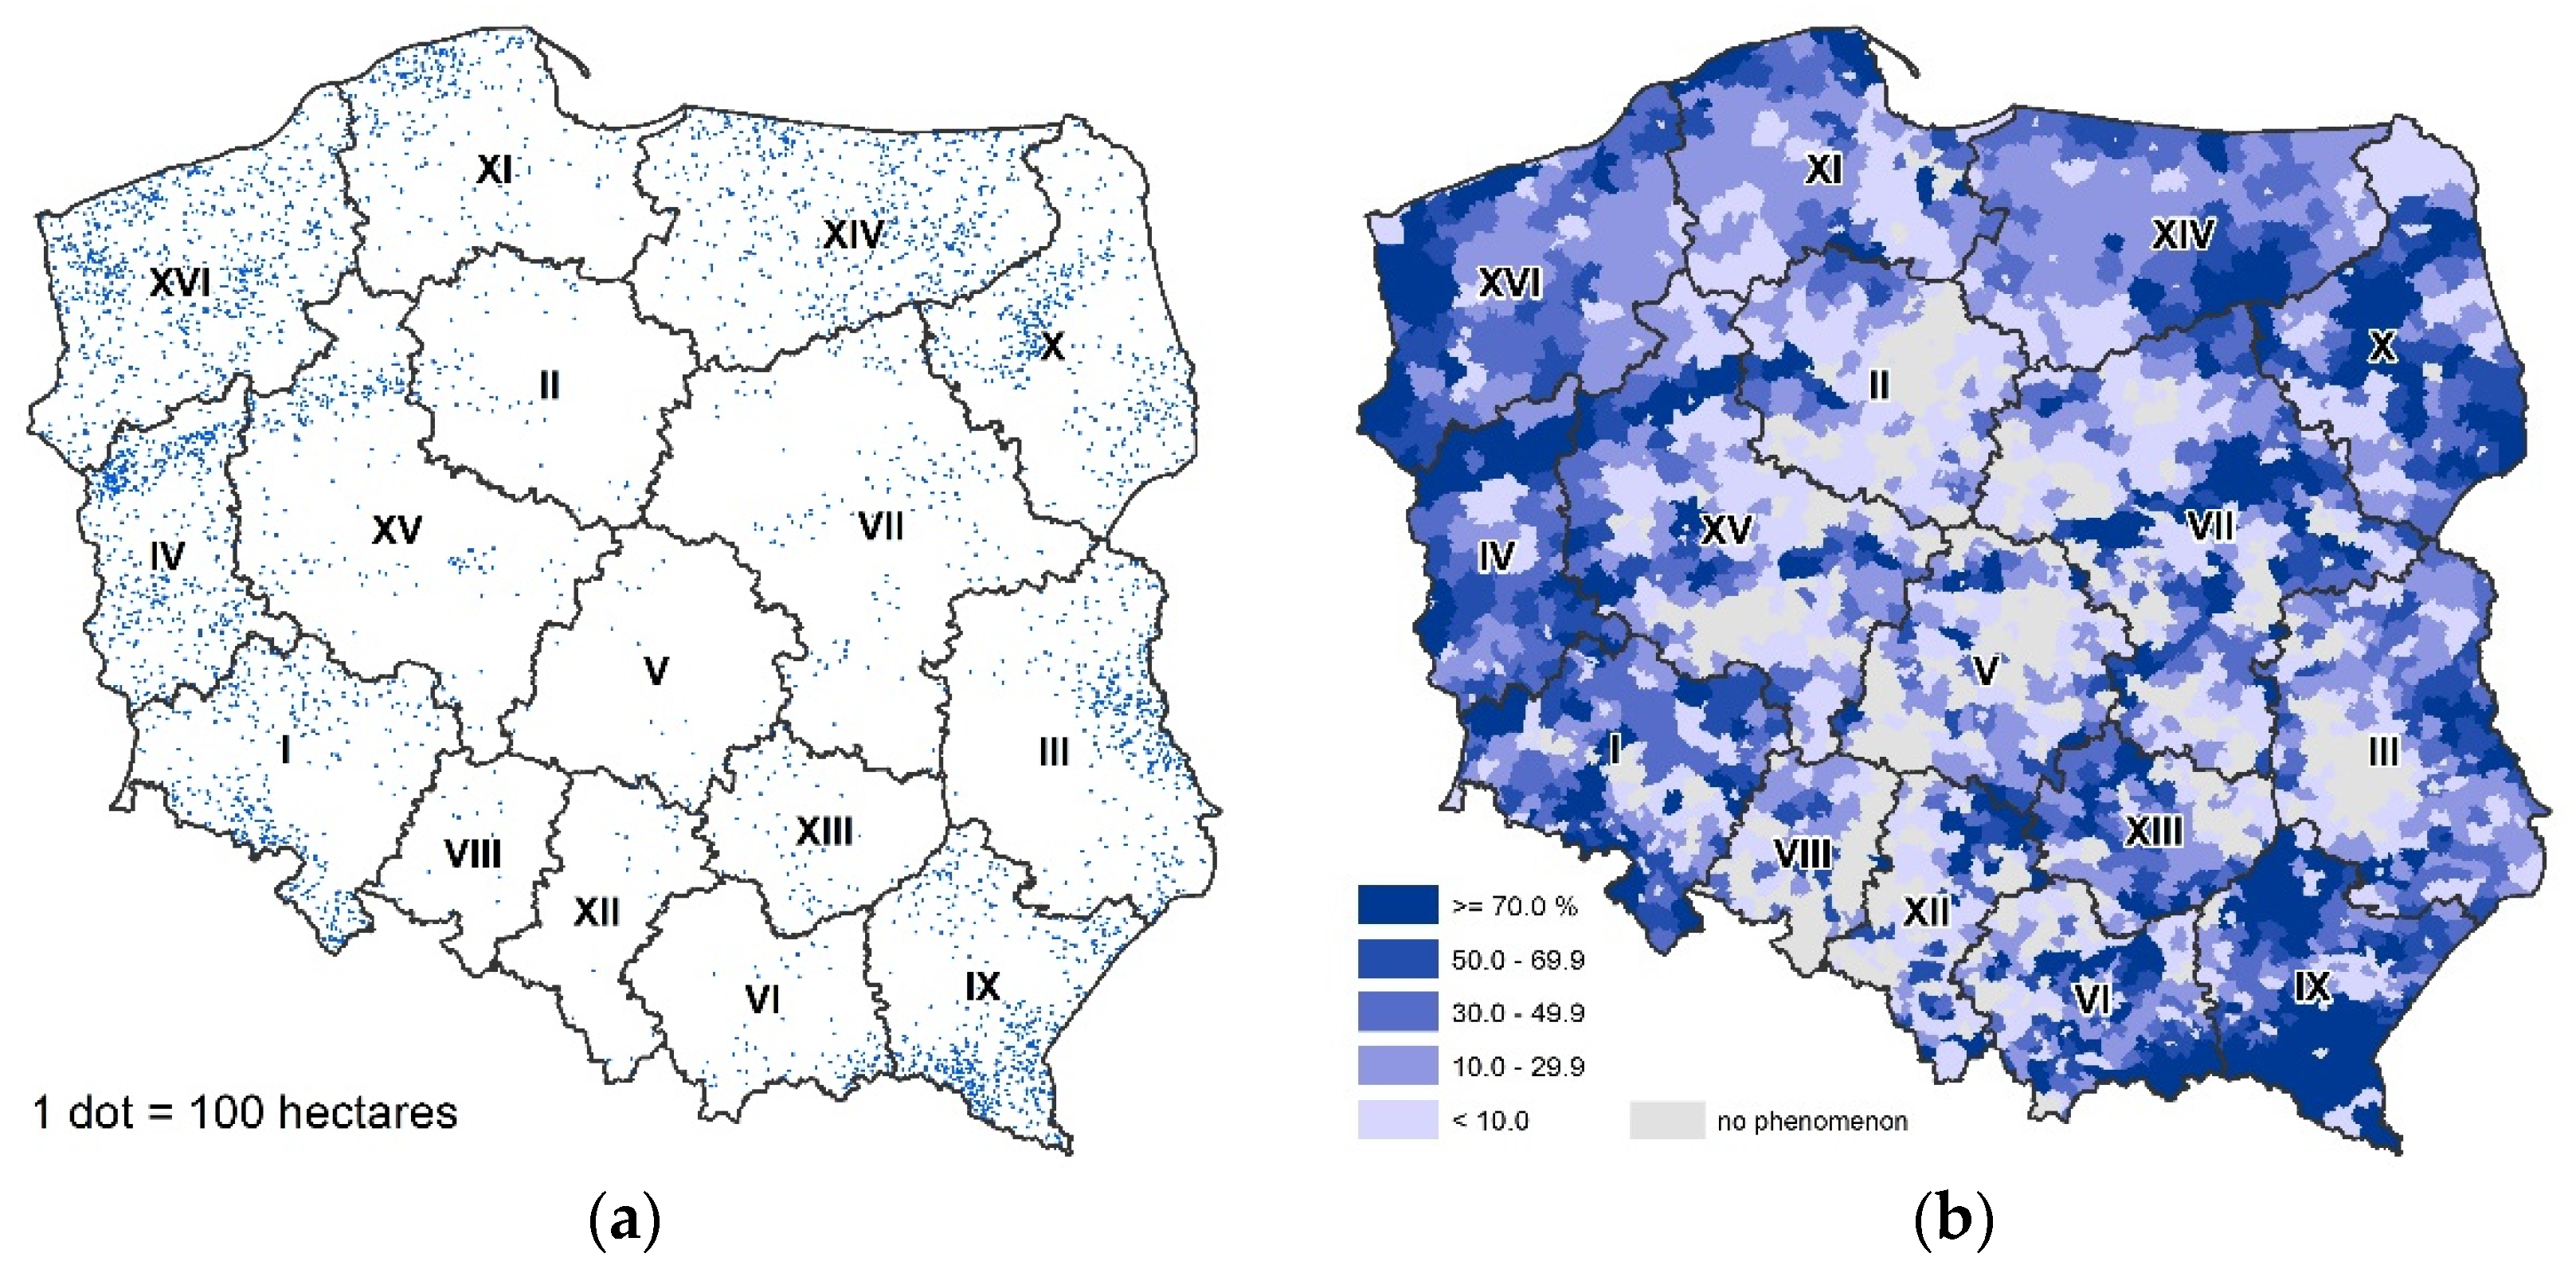
3.3. Breakdown of Farmland by Type of Pro-Environmental RDP Payments

The analysis also addresses the problem of the spatial differentiation of the selected types of payments. In accordance with the adopted methodology, the analysis included the average annual area for the period 2015-19, which results from agri-environmental payments being made as five-year commitments. The subsidised land was shown to be highly spatially differentiated, which we will discuss for each subsidy type separately.
In the case of organic farming, payments relate to two main forms (payments during conversion and post-conversion), under which different rates have been distinguished, as well as a number of subsidy types (agricultural, vegetable, herb, orchard, berry, fodder and permanent pasture; see Appendix A). In total, the above payments coveredc.420,400 ha (of which 77.3% relates to post-conversion payments), which was strongly differentiated regionally, fromc.1500 ha in Opole Province toc.112,300 ha in Warmia-Masuria. At the commune level, the largest area of organic farming subsidies, exceeding 5000 ha, was recorded in two communities in West Pomerania (BiałyBór and Szczecinek—eachc.5800 ha)—and in the commune of Gołdap in Warmia-Masuria Province (c.6800 ha; see Figure 3a).
Subsidies for organic farming account for 32.7% of the total land area of farms receiving pro-environmental support from RDP 2014–20. The analogous percentage at the province level ranges from less than 10.0% in Kuyavia-Pomerania and Opole to 55.0% in Warmia-Masuria (see Table 2). It is also heavily spatially differentiated at the commune level (see Figure 3b). A significant group of communities (483 communities) distinguished by the dominance (over 50%) of organic farming in the total area covered by pro-environmental RDP payments is worthy of attention. There were also 26 communities where pro-environmental payments included only subsidies for organic farming (100%).
Considering the disproportionate share of land subsidised for organic farming in light of the division of communities by environmental determinants (↓ 24.0%, ↑ 36.8%) and agricultural characteristics (↓ 23.0%, ↑ 35.5%), we find that the spatial distribution of such areas depends slightly more on agricultural characteristics (r = 0.346) than on environmental conditions (r = 0.299; see Table 2).
Looking at the analysed pro-environmental payments, the “environmental agriculture” category was also distinguished, with four agri-environmental and climate action packages supporting environmental protection and biodiversity in agriculture, i.e.,
-
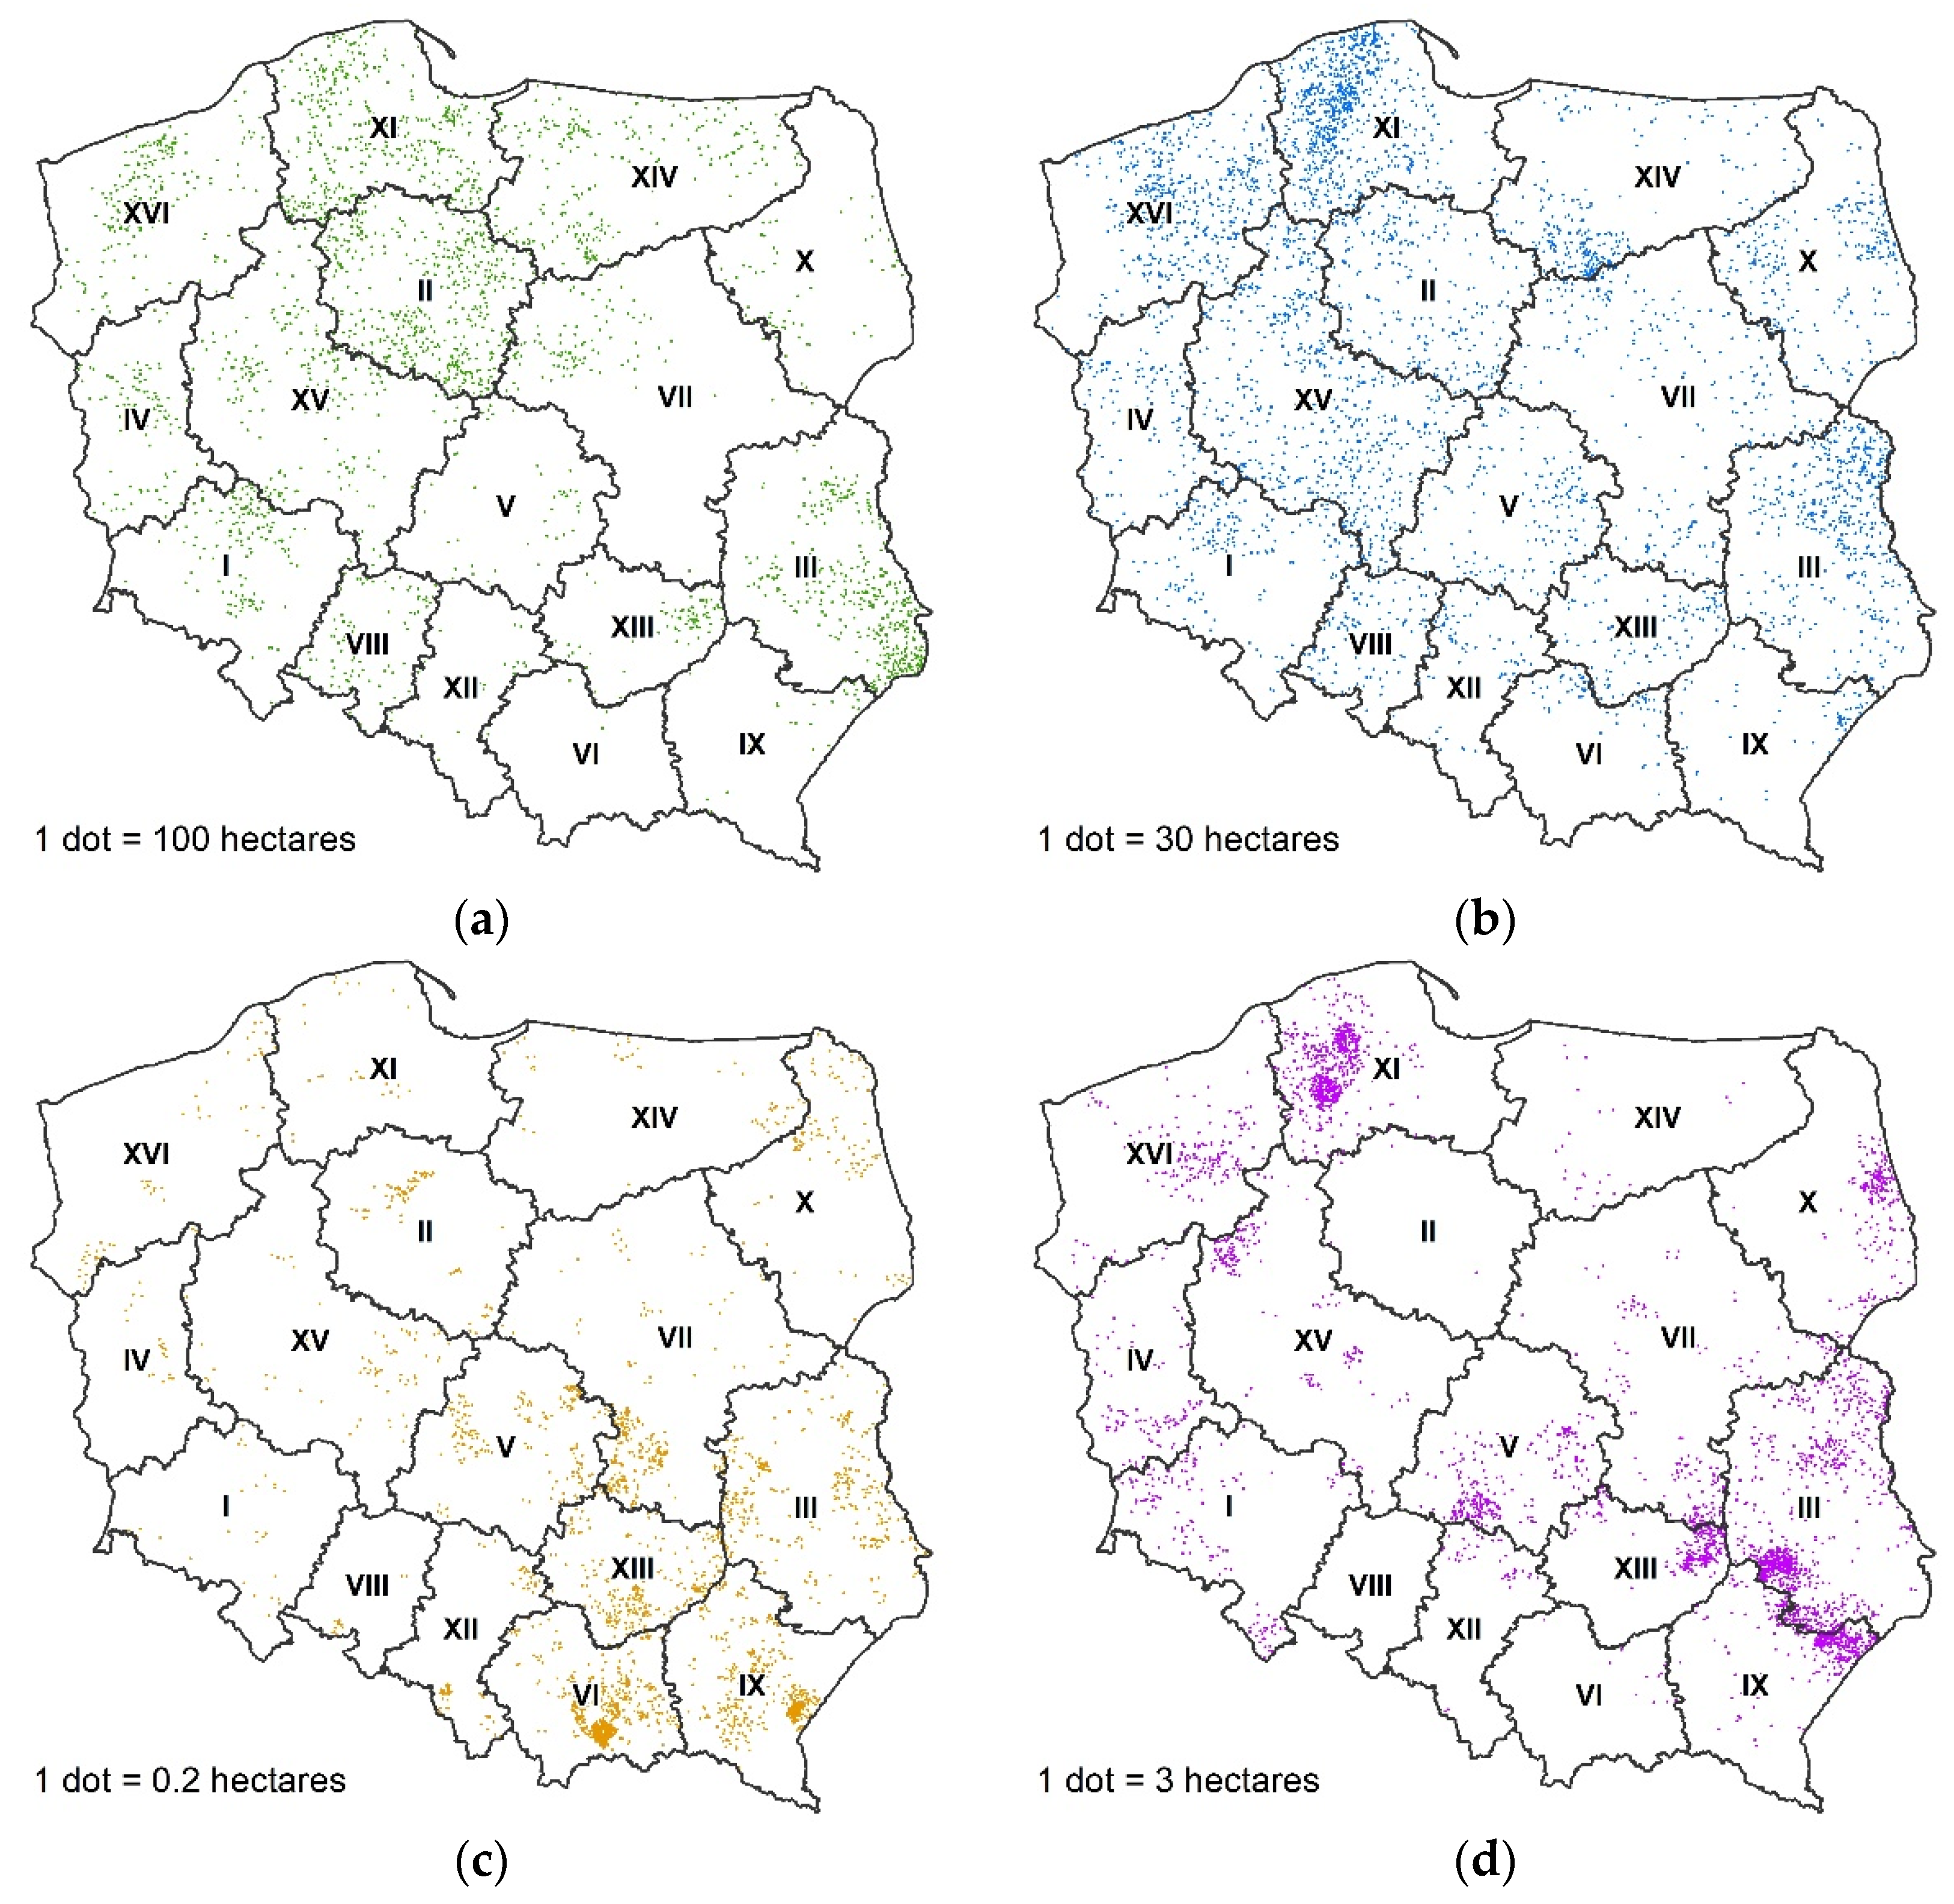
sustainable agriculture: total in Polandc.268,100 ha (fromc.800 ha in Lesser Poland up toc.47,400 ha in Kuyavia-Pomerania) (see Figure 4a);
-
protection of soils and waters: totalc.129,000 ha (from 2100–2200 ha in the provinces of Lesser Poland, Subcarpathia and Silesia up toc.22,200 ha in Pomerania) (see Figure 4b);
-
preservation of traditional tree orchards: 565 ha in total (from 3 ha in Opole Province to 134 ha in Lesser Poland) (see Figure 4c);
-
preservation of endangered plant genetic resources in agriculture: a total of c.11,000 ha (from zero in Opole Province toc.2800 ha in Lublin Province) (see Figure 4d).
Total payments under the category of “environmental agriculture” related to c.408,600 ha—from c.3200 ha in Lesser Poland up to c.65,400 ha in Pomerania (by commune, 3000–3400 ha in Czarna Dąbrówka in Pomerania, Dołhobyczów in Lublin Province and Kozłów in Warmia-Masuria; see Table 3, Figure 5a). In the total area covered by pro-environmental payments, these represent 31.8%. This percentage is heavily spatially and regionally differentiated (Table 3) and at the commune level (Figure 5b).
The assessment of this spatial distribution showed significant differences between the identified groups of determinants—environmental (↓ 49.7%, ↑ 23.4%) and agricultural (↓ 42.4%, ↑ 28.8%). However, these relationships were not confirmed by analysis of the correlation coefficients (Table 2).
The research also distinguished the category of “habitat farming”, in whichthe second largest determinant of pro-environmental subsidies (after the farmer’s environmental awareness) is the presence of valuable natural habitats within the boundaries of the farm. This targeted analysis covered two AECM 2014-20 packages, i.e.,
-
valuable bird habitats and endangered bird species in Natura 2000 areas: total ofc.258,700 ha (fromc.600 ha in Silesia Province andc.900 ha in Opole Province toc.52,400 ha in Western Pomerania);
-
valuable habitats outside Natura 2000 areas: total ofc.197,200 ha (fromc.1500 in Opole Province toc.34,100 ha in Warmia-Masuria).
Support for habitat farming covered a total of 455,900 ha. This area is highly regionally diversified—from c.2300 ha in Opole Province to c.76,400 ha in West Pomerania Province. In the system of communities, the largest areas were recorded as c.5000 ha in Komańcza (Subcarpathia), c.5300 ha in Słońsk (Lubusz Province) and c.5700 ha in Trzcianne(Podlasie Province) (see Figure 6a).
The CAP funds allocated to the support of farms with valuable natural habitats constitute, on average, 35.5% of the total pro-environmental payments in Poland. At the regional level, this ranges from 11.7% in Kuyavia-Pomerania to over 50% in Lubusz and Subcarpathia (see Table 2). It is highly spatially diverse at the commune level, as seen in the significant differences in the number of communities in which habitat payments dominate (representing over 70% of payments) between the provinces of Kuyavia-Pomerania (6 communities), Łódź (8), Opole (2) and Lower Silesia (44), Lesser Poland (38), Masovia (51) and Subcarpathia (70; see Figure 6b).
One very important observation is that the determinants correlated negatively with environmental conditions (r = −0.319), which include, inter alia, the share of protected areas. The dependence was not confirmed by analysis according to groups of determinants (↑, ↓), because, in this case, the difference between thegroups of below-average and above-average communitieswas over 13% (Table 2).

3.4. Typology of Pro-Environmental Forms of CAP Support

The above-described types of support for green agriculture, with its three directions (organic—O, environmental—E, habitat—H), were subjected to structural analysis using the D’Hondt method. They were shown to form highly diverse breakdowns within the structure of examined communities, including as many as 28 combinations of characteristics or types of support. These characteristics and support types were highly differentiated in the numbers of communities that they related to—from 1.4% of all examined communities (33 communities—No. 22; Table 3) for O1 E1 H4 (very low level of support for organic and environmental farming, and a significant share of support for habitat farming) to 20.7% (472 communities—No. 9) for E6 (dominant share of support for environmental farming; Table 3).
In order to generalise these spatial structures showing the pro-environmental support for agriculture using the criterion of the dominant number of quotients, four main types of support were defined: organic farming (O), environmental agriculture (E), habitat farming (H) and equal share of directions (ES). Within these, seven subtypes were distinguished, splitting each type into two, i.e., a very high share or total dominance (5 or 6 quotients) and a very low, low, significant or high share (1, 2, 3 or 4 quotients) (Table 3).
Assuming types as the basic division in the spatial analysis, the average relation for Poland is O2 E2 H2 (equal and very low share of land covered by organic, environmental and habitat farming subsidies). At the regional level, the same type characterises MasoviaProvince. Analysis by type showed the remaining provinces to be differentiated in terms of the leading direction of support, i.e.,
-
organic farming—three provinces: Podlasie, Warmia-Masuria and West Pomerania (type E2—all with three quotients);
-
environmental agriculture—eight provinces: two of type R1 (Kuyavia-Pomerania—six R quotients, Opole—five R quotients) and six of type R2 (three R quotients for Lublin, Łódź, Silesia, Holy Cross and Greater Poland; and four R quotients for Pomerania);
-
habitat farming—four provinces: one of type S1 (Subcarpathia—five quotients) and three of type S2 (Lower Silesia, Lubusz, Lesser Poland—three quotients; see Table 3).
The regional variability of the distinguished types is confirmed by their spatial differentiation by commune, including in a type’s share in the total number of examined communities within a province, i.e.,
-
organic type (O): national average 21.3%, including the highest number in the provinces of Lesser Poland—33.3%, Podlasie—37.3% and, above all, in Warmia-Masuria—53.3%;
-
environmental type (E): national average 41.5%, including the most in the provinces of Kuyavia-Pomerania—83.2%, Lublin—52.2%, Łódź—62.2%, Opole—81.6%, Pomerania—63.9% and Greater Poland—72.4%;
-
habitat type (H): national average 27.7%, including the largest number in the provinces of Lower Silesia—45.6%, Lubusz—48.7%, Podlasie—37.3% and, above all, Subcarpathia—60.1%;
-
equal share (ES): national average 8.8%, including the highest number in the provinces of Lubusz—17.9% and Warmia-Masuria—15.2% (see Figure 7).
The distinguished structural types were also analysed in terms of the adopted determinants. It has been shown that the national average—the RU type (O2 E2 H2)—characterises a group of communities with above-average (↑) agricultural determinants, while those that were below average (↓) were type R2. On the other hand, for environmental determinants, those communities with less favourable conditions were, on average, type R2, whereas above-average (↑) communities were found to be type S2 (see Table 2).
In general, the analysis showed a very strong spatial differentiation in the analysed green activities. This indicates that there are factors guiding farm owners in deciding whether to participate in CAP-financed environmental programmes. It has been shown that a combination of environmental awareness and the need to implement good practices that consider environmental wellbeing is insufficient. This therefore indicates the need for further research on the rationality and effectiveness of the implemented actions, both by us and by other researchers in the field. This is particularly important because this issue is very closely related to the new set of political initiatives being implemented across the EU, i.e., the EGD. An appropriate level of financial support and the reallocation of funds under pro-environmental measures can significantly support the achievement of EGD goals (e.g., increased biodiversity, healthy food, sustainable agriculture, climate neutrality).

4. Discussion

The low correlation (or lack thereof) between the directions of the analysed CAP payments and the natural characteristics adopted (as a determinant) indicates that the environmental factor has a low impact for a major criterion in decisions to develop green directions for agriculture. It is more common that the decisive factors in such matters are de facto situational factors related to access to and potential to use EU funds. In making decisions, farmers are mainly guided by the economic (income) criterion. There is thus a noticeable deficit in the criteria taken into account when territorially targeting these funds (i.e., ecology, environmental care, rational management, development of sustainable agriculture), which weakens the rationality of their spending [38]. Reversed correlation patterns are no exception and are also observed in other countries, such as Germany [39]. This may be due to both purely economic reasoning (lower income effects) and psychological factors related to differences in attitudes between farmers, including attitudes that limit their available choices of how to manage their farms [40,41,42].
The results indicate the spatial dualism of pro-environmental RPD support. Subsidies to develop sustainable agriculture and protect soils and waters (the environmental farming type) were particularly important in a cohesive belt of communities (in the provinces of Opole, Greater Poland, Kuyavia-Pomerania, Pomerania, Łódź and Masovia). These are areas where highly developed, intensive and often specialised agriculture predominates [43]. The share of subsidised land in these provinces is decidedly below the national average, and this—in combination with the specific nature of the measures taken (which are less demanding than organic and habitat farming)—confirm the research conclusion of Barreiro-Hurlé et al. [44] that a high agricultural income discourages farmers from participating in the AECMs. However, it should be noted that there are also opposite findings in the literature. According to studies carried out on the example of Belgian farmers, the larger the farm, the more the AECM; the less land, the more the AECM [45].In the other areas, support is more diverse, as confirmed by the more random scattering of types, while these areas also feature smaller territorial clusters of communities focused on developing ecological and habitat farming. The breakdown of agriculture in these areas is diverse [42]. There are both large farms based on former state farms (Northern and Western Poland) and small, less economically effective family farms on lower-quality land [46].
The analysis results confirm the conclusions of studies conducted by, among others, Bàrberi et al. [47] that there is a tendency towards spatial segregation between highly specialised, productive areas and areas with small-scale, low-input farming. In terms of the intensity of agricultural production, pro-environmental forms of support were found to have a low share in regions of intensive production (in Poland, see the provinces of Greater Poland, Kuyavia-Pomerania, Opole), which is consistent with the results of research by Frueh-Mueller et al. [48]. At the same time, they converge with results for other countries (incl. Germany, France, Spain, Hungary [26]).
Generally, it should be noted that, in the whole EU, the rank of pro-ecologically oriented activities is gradually increasing, which is derived from a change in priorities and the successive strengthening of this direction of development [49]. As a result, the allocation of public funds to the development of organic farming in the EU countries has gradually been increasing over the last three decades and becoming more available [50].Despite the change in the direction of the agricultural policy strengthening environmentally friendly forms of production, there is still a large gap between funds aimed at conventional agriculture and expenditure on agri-environmental measures (the funds accounted for around 7%, i.e., nearly EUR 20 billion, of total EU funding for the CAP 2014-20; European Commission, 2013). Even in the countries with the highest input rates for organic farming in the EU (Germany), this represents only a small part of the total expenditure on agricultural policy [50,51].In order to effectively manage and influence the rationality of spending funds from AECM and OFS activities, in line with the objectives of EU environmental policy, the funds should include a regional component—as is the case in Germany, where each state has specific autonomy in creating a development policy taking into account the existing conditions [52]. Regarding geographically targeted measures, it should be remembered that CAP funds can have a positive effect and prevent the abandonment of agricultural land in these areas, especially for seminatural habitats with low agricultural productivity [53] and negative habitats where intensive practices are more profitable, e.g., higher animal densities are limited [54].
In this respect, high hopes are attached to the new EU policy known as the European Green Deal (EGD), which aims to boost the role of environmental activities. The policy significantly enhances the role and prominence of organic farming. The key objective is to increase the output and consumption of organic products, inter alia, by having 25 percent of farmland used for organic farming by 2030 and substantially expanding organic aquaculture. Based on the findings of the study, it is assumed that work on the preparation of action plans dedicated to organic production should take into account the disparities between regions in terms of their natural potential for the development of modern, effective organic farming. Properly addressed support will enable the ambitious goals set by the European Commission and the assumptions resulting from the EGD to be achieved.
The obtained results and their high degree of spatial differentiation indicate the need for further research on farmlands covered by pro-environmental CAP subsidies. The EU’s Farm to Fork Strategy and the Biodiversity Strategy set ambitious goals for the agricultural sector in order to ensure that it is prepared to adapt to the objectives of the European Green Deal. Pro-ecological forms of agricultural support (AECM, OF and others) will be a key element in the transition to a more sustainable food system and in better protecting biodiversity. With the use of appropriate policies and the right legal framework, the European Commission is tasked with supporting pro-ecological forms of farming in achieving the goals designated in the EGD. The future perspective of the CAP, which will include eco-programmes supporting the development of pro-ecological forms of agriculture, will help in the implementation of this task. Such studies, especially those using the proposed three-way division of forms of support, are of great descriptive (scientific) and applied value. This is indicated by, for example, the spatial distributions of pro-environmental activities in relation to the environmental conditions and agricultural characteristics. Areas predisposed to the greening of agriculture were shown to exist, however, with small areas covered by pro-environmental RDP subsidies. These areas should be treated as a reservoir for the future development of pro-environmental management in agriculture. The developed synthetic approach to pro-environmental CAP support combines information that is traditionally illustrated by a range of individual indicators. The advantage of this in terms of the applicability of results is its legibility and ease of interpretation (names clearly indicating the nature of the division), made possible by the use of the D’Hondt method.

5. Conclusions

The breakdown and variety of pro-environmental forms of support in RDP 2014-20 is very diverse, as seen in the number of identified structural types. The range of instruments supporting and promoting green forms of agricultural land use is thus relatively wide. The analysis showed that, from a structural point of view, the implementation of pro-environmental measures is highly comprehensive, accurately reflecting real-world needs, and should be assessed positively, because the range of available support must meet the various needs of agriculture that result from the diversity of both environmental conditions and farm characteristics (e.g., farm size). One problematic issue diagnosed during the study is the quantitative aspect, especially the low, currently unsatisfactory share of agricultural land receiving subsidies from the measures in question. Their share in Poland averaged 9.2% of agricultural land, while the share of lands subsidised by organic farming programmes (with the most demanding qualification requirements) was only 3%. This percentage, compared to the EGD’s postulated 25% of organic farming in the EU’s total agricultural area, clearly indicates a major problem and challenge for Polish agriculture on its road towards sustainable development. Poland currently stands towards the back of the pack in terms of the share of land devoted to the organic farming of crops (with only Romania, Bulgaria and Ireland in worse positions) [55]. These relations indicate insufficient efforts by the institutions responsible for implementing EU funds in Poland.
To achieve the EGD objectives, it will be necessary to intensify activities to promote pro-environmental activities co-financed by the CAP. The authors recommend that this task should first focus on increasing the area of farmland subsidised by pro-environmental CAP support, taking into account the three subsidy types for the three specific types of agriculture:
-
ecological: the need to intensify activities aimed at growing this land category due to current trends in the development of farms being promoted by, among others, the EGD;
-
environmental: the need to more heavily promote pro-environmental practices in agriculture, especially in environmentally valuable areas covered by various forms of protection (including legal protection);
-
habitat: the need to regulate the status of farms that have valuable natural habitats of key importance in terms of protecting nature and biodiversity and that are not used for producing food using natural substances and processes (the main characteristic of organic farming).
Moreover, it is recommended to introduce changes to more rationally manage and target pro-environmental payments from AECM and OF activities, which would ultimately strengthen the synergistic effects resulting from the positive impact that non-conventional agriculture has on the preservation of natural ecosystems and biodiversity. The current state of affairs is reducing the effectiveness of support, which is not in line with CAP objectives. The changes should be based on, inter alia, a spatial criterion, i.e., one that takes into account the natural specificity of individual regions. Presently, synergistic effects are significantly limited and it is necessary to consider at least partially reorienting fund allocations in a more territorial direction. The training of farmers in environmentally friendly farming methods is also necessary.

Author Contributions

Conceptualization, R.R. and Ł.W.; methodology, R.R. and Ł.W.; formal analysis, R.R., Ł.W. and M.B.; investigation, R.R., Ł.W. and M.B.; resources, R.R., Ł.W. and M.B.; data curation, R.R. and Ł.W.; writing—original draft preparation, R.R., Ł.W. and M.B.; writing—review and editing, R.R., Ł.W. and M.B.; visualization, R.R., Ł.W. and M.B.; supervision, R.R.; project administration, R.R. All authors have read and agreed to the published version of the manuscript.

Funding

This research received no external funding.

Institutional Review Board Statement

Not applicable.

Informed Consent Statement

Not applicable.

Data Availability Statement

Not applicable.

Conflicts of Interest

The authors declare no conflict of interest.

Appendix A

Table A1. Pro-environmental agricultural payments: forms of support and areas covered by subsidies.
Packages/VariantsRDP Green Measures in Agriculture: TotalThousand ha%
1284.9100.0
Agri-environmental–climate measure (AECM)864.567.3
ISustainable agriculture268.120.9
IIProtection of soils and waters129.010.0
II.1Catch crops128.910.0
II.2Protective strips on slopes steeper than 20%0.00.0
IIIPreserving orchards of traditional fruit tree varieties0.60.0
IVValuable bird habitats and endangered bird species in Natura 2000 areas258.720.1
IV.1Variable-humidity tall meadows5.30.4
IV.2Alluvial Cnidiondubii meadows and salt meadows4.10.3
IV.3Grasslands 4.70.4
IV.4Semi-natural humid meadows33.02.6
IV.5Semi-natural Arrhenatherion meadows69.05.4
IV.6Bogs6.70.5
IV.6.1Peatlands—mandatory requirements0.80.1
IV.6.2Peatlands—mandatory and supplementary requirements 5.90.5
IV.7Extensive land use in special bird protection areas (SPAs)27.02.1
IV.8Protection of breeding habitats of black-tailed godwit, common snipe, redshank or lapwing83.86.5
IV.9Protection of breeding habitats of aquatic warbler8.10.6
IV.10Protection of breeding habitats of great snipe or common curlew12.51.0
IV.11Protection of breeding habitats of corncrake4.50.4
VValuable habitats outside Natura 2000 areas197.215.4
V.1Variable-humidity tall meadows6.00.5
V.2Alluvial Cnidiondubii meadows1.00.1
V.3Grasslands 8.50.7
V.4Semi-natural humid meadows72.25.6
V.5Semi-natural Arrhenatherion meadows106.48.3
V.6Bogs3.10.2
V.6.1.Peatlands—mandatory requirements 0.40.0
V.6.2.Peatlands—mandatory and supplementary requirements 2.70.2
VIPreservation of endangered plant genetic resources in agriculture11.00.9
VI.1Preservation of endangered plant genetic resources in agriculture—crop farming9.40.7
VI.2Preservation of endangered plant genetic resources in agriculture—seed material or seed production1.60.1
VIIOrganic farming (OF)420.432.7
VII.1Payments during conversion period95.27.4
VII.1.1Crops during conversion period49.53.9
VII.1.2Vegetable crops during conversion period6.50.5
VII.1.3Herbaceous crops during conversion period7.00.5
VII.1.4Fruit crops during conversion period5.80.5
VII.1.4.1Basic fruit crops during conversion period2.10.2
VII.1.4.2Berry crops during conversion period2.50.2
VII.1.4.3Extensive fruit crops during conversion period1.10.1
VII.1.5Fodder crops during conversion period18.21.4
VII.1.6Permanent pasture during conversion period8.30.6
VII.2Post-conversion payments325.125.3
VII.2.1Post-conversion crops151.911.8
VII.2.2Post-conversion vegetable crops17.11.3
VII.2.3Post-conversion herb crops16.41.3
VII.2.4Post-conversion fruit crops0.00.0
VII.1.4.1Post-conversion basic fruit crops2.50.2
VII.1.4.2Berry crops during conversion period9.90.8
VII.1.4.3Post-conversion extensive fruit crops3.10.2
VII.1.5Post-conversion fodder crops89.47.0
VII.1.6Post-conversion permanent pasture34.92.7
Source: own study based on data from ARMA and LDB.

References

  1. Bateman, I.J.; Balmford, B. Public funding for public goods: A post-Brexitperspective on principles for agricultural policy. Land Use Policy 2018, 79, 293–300. [Google Scholar] [CrossRef]
  2. Treasury, H.M. The Green Book: Central Government Guidance on Appraisal and Evaluation. London, UK. 2018. Available online: https://assets.publishing.service.gov.uk/government/uploads/system/uploads/attachment_data/file/685903/The_Green_Book.pdf (accessed on 20 September 2021).
  3. Ecorys. Mapping and Analysis of the Implementation of the CAP. 2017. Available online: https://op.europa.eu/pl/publication-detail/-/publication/65c49958-e138-11e6-ad7c-01aa75ed71a1 (accessed on 22 August 2021).
  4. Wiśniewski, Ł.; Rudnicki, R.; Chodkowska-Miszczuk, J. What non-natural factors are behind the underuse of EU CAP funds in areas with valuable habitats? Land Use Policy 2021, 108, 105574. [Google Scholar] [CrossRef]
  5. Marsden, T.; Sonnino, R. Rural development and the regionalstate: Denyingmultifunctionalagriculture in the UK. J. RuralStud. 2008, 24, 422–431. [Google Scholar] [CrossRef]
  6. Hanley, N.; Banerjee, S.; Lennox, G.D.; Armsworth, P.R. How shouldweincentivizeprivatelandowners to ‘produce’ morebiodiversity? Oxf. Rev. Econ. Policy 2012, 28, 93–113. [Google Scholar] [CrossRef]
  7. Home, R.; Balmer, O.; Jahrl, I.; Stolze, M.; Pfiffner, L. Motivations for implementation of ecologicalcompensationareas on Swiss lowlandfarms. J. Rural Stud. 2014, 34, 26–36. [Google Scholar] [CrossRef]
  8. Kleijn, D.; Sutherland, W.J. How effectiveareEuropeanagri-environment schemes in conserving and promotingbiodiversity? J. Appl. Ecol. 2003, 40, 947–969. [Google Scholar] [CrossRef]
  9. Pe’er, G.; Zinngrebe, Y.; Moreira, F.; Sirami, C.; Schindler, S.; Müller, R.; Hansjürgens, B. A greenerpath for the EU common agricultural policy. Science 2019, 365, 449–451. [Google Scholar] [CrossRef]
  10. European Commission. Communication from the Commission to the European Parliament, the European Council, the Council, the European Economic and Social Committee and the Committee of the Regions, The European Green Deal, COM (2019) 640 Final; European Commission: Brussels, Belgium, 2019. [Google Scholar]
  11. Jaeger, C.; Mielke, J.; Schütze, F.; Teitge, J.; Wolf, S. The European Green Deal—More Than Climate Neutrality. Intereconomics 2021, 56, 99–107. [Google Scholar] [CrossRef]
  12. European Commission. Communication from the Commission to the European Parliament, the Council, the European Economic and Social Committee and the Committee of the Regions. Sustainable Europe Investment Plan. European Green Deal Investment Plan, COM(2020) 21 Final; European Commission: Brussels, Belgium, 2020. [Google Scholar]
  13. European Commission. Communication from the Commission to the European Parliament, the Council, the European Economic and Social Committee and the Committee of the Regions. A Farm to Fork Strategy for a Fair, Healthy and Environmentally-Friendly Food System, COM(2020) 381 Final; European Commission: Brussels, Belgium, 2020. [Google Scholar]
  14. Arabska, E. From Farm to Fork: Human Health and Well-Being through Sustainable Agri-Food Systems. J. Life Econ. 2021, 8, 11–27. [Google Scholar] [CrossRef]
  15. Schebesta, H.; Candel, J.J.L. Game-changing potential of the EU’s Farm to Fork Strategy. Nat. Food 2020, 1, 586–588. [Google Scholar] [CrossRef]
  16. Swinnen, J. The Political Economy of Agricultural and Food Policies; Palgrave Macmillan US: New York, NY, USA, 2018; p. 254. [Google Scholar]
  17. Swinnen, J.; Vandevelde, S. The Political Economy of Food Security and Sustainability. Encycl. Food Secur. Sustain. 2019, 1, 9–16. [Google Scholar] [CrossRef]
  18. Rudnicki, R. The Spatial Structure of Polish Agriculture Conditioned by Common Agricultural Policy Instruments; Wydawnictwo Naukowe Uniwersytetu Mikołaja Kopernika: Toruń, Poland, 2016; p. 208. [Google Scholar]
  19. Pe’er, G.; Bonn, A.; Bruelheide, H.; Dieker, P.; Eisenhauer, N.; Feindt, P.H.; Hagedorn, G.; Hansjürgens, B.; Herzon, I.; Lomba, A.; et al. Action needed for the EU Common Agricultural Policy to address sustainability challenges. PeopleNat. 2020, 2, 305–316. [Google Scholar] [CrossRef]
  20. Matin, S.; Sullivan, C.A.; ÓhUallacháin, D.; Meredith, D.; Moran, J.; Finn, J.A.; Green, S. Predicted distribution of High Nature Value farmland in the Republic of Ireland. J. Maps 2016, 12, 373–376. [Google Scholar] [CrossRef]
  21. Rozporządzenie Ministra Rolnictwa iRozwoju Wsi z Dnia 18 Marca 2015 r. w Sprawie Szczegółowych Warunków I Trybu Przyznawania Pomocy Finansowej w Ramach Działania “Działanie rolno-środowiskowo-klimatyczne” Objętego Programem Rozwoju Obszarów Wiejskich na Lata 2014–2020: Regulation of the Minister of Agriculture and Rural Development of 18 March 2015 on the Detailed Conditions and Procedure for Granting Financial aid under the Action "Agri-Environment-Climate" under the Rural Development Program for 2014–2020, 24 Marca 2015 r. Poz. 415; Ministerstwo Rolnictwa I Rozwoju Wsi: Warszawa, Polska, 2015. Available online: http://isap.sejm.gov.pl/isap.nsf/download.xsp/WDU20150000415/O/D20150415.pdf (accessed on 22 August 2021). (In Polish)
  22. Rozporządzenie Ministra Rolnictwa I Rozwoju Wsi z Dnia 27 Lutego 2019 r. Zmieniające Rozporządzenie w Sprawie Szczegółowych Warunków I Trybu Pzyznawania Pomocy Finansowej w Ramach Działania "Rolnictwo Ekologiczne" Objętego Programem Rozwoju Obszarów Wiejskich na Lata 2014–2020: Ordinance of the Minister of Agriculture and Rural Development of February 27, 2019 Amending the Ordinance on Detailed Conditions and Procedure for Granting Financial Aid under the Measure "Organic Farming" Covered by the Rural Development Program for 2014–2020; Ministerstwo Rolnictwa I Rozwoju Wsi: Warszawa, Polska, 2015. Available online: http://isap.sejm.gov.pl/isap.nsf/download.xsp/WDU20190000451/O/D20190451.pdf (accessed on 22 August 2021). (In Polish)
  23. Adamowicz, M. Bioeconomy-concept, application and perspectives. Probl. Agric. Econ. 2017, 1, 29–49. [Google Scholar] [CrossRef]
  24. Jezierska-Thöle, A.; Biczkowski, M. Financial Funds from European Union funds as a chance for the development of the sector of organicfarms in Poland. Assoc. Agric. Agribus. Econ. 2017, 19, 95–101. [Google Scholar] [CrossRef]
  25. Galler, C.; von Haaren, C.; Albert, C. Optimizing environmentalmeasures for landscapemultifunctionality: Effectiveness, efficiency and recommendations for agri-environmentalprograms. J. Environ.Manag. 2015, 151, 243–257. [Google Scholar] [CrossRef]
  26. Farmer, M.; Cooper, T.; Swales, V.; Silcock, P. Funding for Farmland Biodiversity in the EU: Gaining Evidence for the EU Budget Review: A Report for the RSPB. 2008. Available online: https://ieep.eu/archive_uploads/628/IEEP_2008_Funding_for_Farmland_Biodiversity_in_the_EU_Final.pdf (accessed on 22 August 2021).
  27. Racine, J.B.; Reymond, H. Quantitative Analysis in Geography; PWN: Warsaw, Poland, 1977; p. 255. (In Polish) [Google Scholar]
  28. Czyż, T. Metoda wskaźnikowa w geografi ispołeczno-ekonomicznej: Method indicator in social and economic geography. Rozw. Reg. iPolityka Reg. 2016, 34, 9–19. (In Polish) [Google Scholar]
  29. D’Hondta, W. Système Pratique Et Raisonné De Représentation Proportionnelle; Librairie, C. Muquardt: Bruksela, Belgium, 1882; Available online: https://www.e-rara.ch/bau_1/doi/10.3931/e-rara-39876 (accessed on 29 August 2021). (In French)
  30. Rudnicki, R.; Dubownik, A.; Biczkowski, M. Diversification of sources of income in agricultural holdings in the context of multi-functional development of rural areas in Poland. Belgeo 2016, 4. Available online: https://journals.openedition.org/belgeo/19722?lang=de#quotation (accessed on 30 May 2021). [CrossRef] [Green Version]
  31. Bakos, K.L.; Dobos, A.; Nagy, J. Mapping agricultural performance and environmental parameters aimed at generic regional studies. Acta Agrar. Debr. 2012, 49, 29–34. [Google Scholar] [CrossRef]
  32. Medzihorsky, J. Rethinking the D’Hondt method. Polit. Res. Exch. 2019, 1, 1–15. [Google Scholar] [CrossRef] [Green Version]
  33. Wysocki, F. Metody Taksonomiczne w Rozpoznawaniu Typów Ekonomicznych Rolnictwa I Obszarów Wiejskich: Taxonomic Methods in Identifying Economic Types of Agriculture and Rural Areas; Wydawnictwo Uniwersytetu Przyrodniczego: Poznań, Poland, 2010; p. 399. (In Polish) [Google Scholar]
  34. Falkowski, J.; Kostrowicki, J. Geografia Rolnictwa Świata; PWN: Warsaw, Poland, 2001; p. 515. (In Polish) [Google Scholar]
  35. Rudnicki, R.; Jezierska-Thöle, A.; Wiśniewski, Ł.; Jorg, J.; Kozłowski, L. Former political borders and their impact on the evolution of the present-day spatial structure of agriculture in Poland. Stud. Agric. Econ. 2018, 120, 8–16. [Google Scholar] [CrossRef]
  36. Bański, J.; Mazur, M. (Eds.) Atlas Rolnictwa Polski: Atlas of Polish agriculture; IGiPZ PAN: Warsaw, Poland, 2010; Available online: https://www.igipz.pan.pl/atlas-rolnictwa-polski-zgwirl.html (accessed on 29 August 2021). (In Polish)
  37. Grajewski, R.; Schmidt, T.G. Agrarumweltmaßnahmen in Deutschland: Förderung in den Ländlichen EntwicklungsprogrammenimJahr 2013; Thünen Working Paper 44; Johann Heinrich von Thünen-Institut: Braunschweig, Germany, 2013. (In German) [Google Scholar]
  38. Wiśniewski, Ł.; Biczkowski, M.; Rudnicki, R. Natural potential versus rationality of allocation of Common Agriculture Policy funds dedicated for supporting organic farming development—Assessment of spatial suitability: The case of Poland. Ecol. Indic. 2021, 130, 108039. [Google Scholar] [CrossRef]
  39. Früh-Müller, A.; Bach, M.; Breuer, L.; Hotes, S.; Koellner, T.; Krippes, C.; Wolters, V. The use of agri-environmental measures to address environmental pressures in Germany: Spatial mismatches and options for improvement. Land Use Policy 2019, 84, 347–362. [Google Scholar] [CrossRef]
  40. Schmit, C.; Rounsevell, M.D.A. Are agricultural land use patterns influenced by farmer imitation? Agric. Ecosyst. Environ. 2006, 115, 113–127. [Google Scholar] [CrossRef]
  41. Brady, M.; Kellermann, K.; Sahrbacher, C.; Jelinek, L. Impacts of Decoupled Agricultural Support on Farm Structure, Biodiversity and Landscape Mosaic: Some EUResults. J. Agric. Econ. 2009, 60, 563–585. [Google Scholar] [CrossRef]
  42. Hartig, F.; Drechsler, M. Stay by thy neighbor? Social organization determines the efficiency of biodiversity markets with spatial incentives. Ecol. Complex 2010, 7, 91–99. [Google Scholar] [CrossRef] [Green Version]
  43. Wiśniewski, Ł.; Perdał, R.; Rudnicki, R. Proposed method for delimiting spatial structure on the example of agriculture types in Poland. Bull.Geogr. Socio-Econ. Ser. 2020, 49, 7–18. [Google Scholar] [CrossRef]
  44. Barreiro-Hurlé, J.; Espinosa-Goded, M.; Dupraz, P. Does intensity of change matter? Factors affecting adoption of agri-environmental schemes in Spain. J. Environ. Plan. Manag. 2010, 53, 891–905. [Google Scholar] [CrossRef]
  45. Vanslembrouck, I.; Van Huylenbroeck, G.; Verbeke, W. Determinants of the Willingness of Belgian Farmers to Participate in Agri-environmental Measures. J. Agric. Econ. 2002, 53, 489–511. [Google Scholar] [CrossRef]
  46. Hynes, S.; Garvey, E. Modelling Farmers’ Participation in an Agri-environmental Scheme using Panel Data: An Application to the Rural Environment Protection Scheme in Ireland. J. Agric. Econ. 2009, 60, 546–562. [Google Scholar] [CrossRef]
  47. Bàrberi, P.; Burgio, G.; Dinelli, G.; Moonen, A.C.; Otto, S.; Vazzana, C.; Zanin, G. Functional biodiversity in the agricultural landscape: Relationships between weedsandarthropodfauna. Weed Res. 2010, 50, 388–401. [Google Scholar] [CrossRef]
  48. Früh-Müller, A.; Krippes, C.; Hotes, S.; Breuer, L.; Koellner, T.; Wolters, V. Spatial correlation of agri-environmental measures with high levels of ecosystem services. Ecol. Indic. 2018, 84, 364–370. [Google Scholar] [CrossRef]
  49. Jezierska-Thöle, A.; Rudnicki, R.; Wiśniewski, Ł.; Gwiaździńska-Goraj, M.; Biczkowski, M. The Agri-Environment-Climate Measure as an Element of the Bioeconomy in Poland—A Spatial Study. Agriculture 2021, 11, 110. [Google Scholar] [CrossRef]
  50. Feindt, P.; Proestou, M.; Daedlow, K. Resilience and policy design in the emerging bioeconomy—The RPD framework and the changing role of energy crop systems in Germany. J. Environ. Policy Plan. 2020, 22, 636–652. [Google Scholar] [CrossRef]
  51. Kirschke, D.; Hager, A.; Jechlitschka, K.; Wegener, S. Distortions in a multi-level co-financing system: The case of the agri-environmental programme of Saxony-Anhalt. German J. Agric. Econ. 2007, 56, 297–304. [Google Scholar]
  52. Uthes, S.; Matzdorf, B. Studies on agri-environmental measures: A survey of the literature. Environ. Manag. 2013, 51, 251–266. [Google Scholar] [CrossRef]
  53. Dupraz, P.; Rainelli, P. Institutional approachestosustain rural landscapesin France. In Sustaining Agriculture and the Rural Environment; Governance, Policy and Multifunctionality; Brouwer, F., Ed.; Edward Elgar Publishing: Northampton, UK, 2004; pp. 162–182. Available online: https://www.e-elgar.com/shop/gbp/sustaining-agriculture-and-the-rural-environment-9781843762560.html (accessed on 14 October 2021).
  54. Desjeux, Y.; Dupraz, P.; Latruffe, L.; Maigne, E.; Cahuzac, E. Evaluating the impact of rural development measures on farm labouruse: A spatial approach. In Proceedings of the 2014 European Association of Agricultural Economists, Ljubljana, Slovenia, 26–29 August 2014; p. 11. [Google Scholar]
  55. European Commission. Organic Farming in the EU; European Commission: Brussels, Belgium, 2021; Available online: https://ec.europa.eu/info/sites/default/files/food-farming-fisheries/farming/documents/factsheet-eu-organic-action-plan_en.pdf (accessed on 9 October 2021).
Figure 1. Environmental (a) and agricultural (b) determinants of green development of Polish agriculture. Voivodships are marked with digits: I—Lower Silesia, II—Kuyavia-Pomerania, III—Lublin, IV—Lubusz, V—Łódź, VI—Lesser Poland, VII—Masovia, VIII—Opole, IX—Subcarpathia, X—Podlasie, XI—Pomerania, XII—Silesia, XIII—Holy Cross, XIV—Warmia-Masuria, XV—Greater Poland, XVI—West Pomerania. Source: own elaboration.
Land 10 01092 g001
Figure 2. Area of land covered by pro-environmental RDP support (a), and its share in total UAA of farms (b).Source: own elaboration.
Land 10 01092 g002
Figure 3. Area of land subsidised for organic farming in ha (a), and its share in total area of land covered by pro-environmental RDP support (b). Source: own elaboration.
Land 10 01092 g003
Figure 4. Land subsidised to support environmental agriculture, in ha (a)—sustainable agriculture, (b)—protection of soils and waters, (c)—preservation of orchards with traditional varieties of fruit trees, (d)—preservation of endangered plant genetic resources in agriculture).Source: own elaboration.
Land 10 01092 g004
Figure 5. Area of land subsidised with support for environmental agriculture (a), and its share in the total area covered by pro-environmental RDP support (b). Source: own elaboration.
Land 10 01092 g005
Figure 6. Area of land subsidised with support for habitat farming, in ha (a), and its share in the total area covered by pro-environmental RDP support (b). Source: own elaboration.
Land 10 01092 g006
Figure 7. Structural types of farmland covered by pro-environmental CAP measures. Source: own elaboration.
Land 10 01092 g007
Table 1. Selected determinants of green development of Polish agriculture.
No.Spatial UnitEnvironmental ConditionsAgricultural Conditions
Diagnostic AttributesSynthetic Index Diagnostic ATTRIBUTESSynthetic Index
Less Favoured Areas (LFA), as % of Total AreaProtected Areas, as % of Total AreaSoils of Lowest Soil Quality Classes (V, VI), as % of UAAAverage Farm AreaFarms Run by Farmers with Higher Education, as % of Total Land Productivity (Global Agricultural Production per 1 ha of UAA—A Destimulant)
National total54.732.632.40.0010.810.35.60.00
1Lower Silesia33.018.620.0−0.4616.511.94.50.36
2Kuyavia-Pomerania39.032.420.8−0.2716.99.76.80.03
3Lublin38.822.722.4−0.358.011.45.30.01
4Lubusz93.938.441.20.4721.112.04.20.53
5Łódź57.919.546.70.078.19.56.8−0.24
6Lesser Poland36.653.030.40.054.38.25.1−0.28
7Masovia65.429.744.40.209.210.56.5−0.12
8Opole15.127.621.1−0.4918.99.25.80.16
9Subcarpathia40.344.928.5−0.034.89.63.8−0.06
10Podlasie91.631.641.10.3812.911.95.30.18
11Pomerania55.532.930.3−0.0219.411.24.80.38
12Silesia30.622.042.0−0.167.910.45.7−0.09
13Holy Cross40.065.038.40.306.010.15.4−0.14
14Warmia-Masuria76.546.722.40.1822.813.54.30.65
15Greater Poland53.531.637.40.0514.79.07.9−0.16
16West Pomerania69.921.825.6−0.0930.715.64.21.01
Source: own study based on data from LDB and IUNiG.
Table 2. Forms of green support for agriculture in Poland: level, structure and determinants.
No.Spatial UnitSubsidised LandIncluding Structure
by Support Type
Organic Farming—OEnvironmental Farming—EHabitat Farming—HSequence
ha (Thousands) *as % of Farms%Quotient%Quotient%QuotientTypeSubtype
National total1284.99.232.7231.8235.52ESES
of which, by province
1Lower Silesia80.99.627.2225.2147.63HH.2
2Kuyavia-Pomerania69.06.78.1080.3611.70EE.1
3Lublin120.98.922.3146.7331.02EE.2
4Lubusz100.224.633.1214.7152.23HH.2
5Łódź21.12.328.6254.5317.01EE.2
6Lesser Poland19.94.135.0215.9149.13HH.2
7Masovia58.23.335.2233.4231.42ESES
8Opole17.23.49.0077.6513.51EE.1
9Subcarpathia64.712.015.3110.3074.45HH.1
10Podlasie104.110.246.7313.9139.42EO.2
11Pomerania111.115.416.2158.8425.01EE.2
12Silesia10.53.216.9146.0337.22EE.2
13Holy Cross26.15.328.4246.1325.51EE.2
14Warmia-Masuria204.321.255.0316.4128.62EO.2
15Greater Poland76.64.514.7154.8330.52EE.2
16West Pomerania200.023.844.1317.7138.22EO.2
of which, assumed determinants
environmental410.55.724.0149.7326.32EE.2
874.413.036.8223.4139.83HH.2
correl. coeff.x0.1650.299x0.122x−0.319xxx
agricultural285.44.623.0142.4334.62EE.2
999.512.835.5228.8235.72ESES
correl. coeff.x0.3970.346x0.057x−0.173xxx
* groups of communities: ↓—below national average (unfavourable), ↑—above national average (favourable). Source: own study based on data from ARMA and LDB.
Table 3. Pro-environmental forms of CAP support: distribution of subsidised land by support type (100% = 2282 communities).
TypeSubtype No.Number of
Communities
%Delimitation of Structures of
Pro-Environmental CAP Support *
Organic—OEnvironmental—EHabitat—H
Organic farming—O
(486 communities)
O.111175.1600
2622.7510
3733.2501
O.24542.4420
5371.6411
6672.9402
7341.5312
8421.8321
Environmental
agriculture—E
(946 communities)
E.1947220.7060
10924.0051
111315.7150
E.212612.7042
13361.6141
14783.4240
15391.7132
16371.6231
Habitat farming—H
(631 communities)
H.11726011.4006
181014.4105
19572.5015
H.220351.5024
21743.2204
22331.4114
23341.5123
24371.6213
Equal share of directions—ES
(219 communities)
25421.8033
26622.7330
27813.5303
28341.5222
* Number of quotients (see Section 2). Source: own study based on data from ARMA and LDB.
Publisher’s Note: MDPI stays neutral with regard to jurisdictional claims in published maps and institutional affiliations.

