
Diversity Is Not Everything


1
D.A. Scott, Ronin Institute, 127 Haddon Pl., Montclair, NJ 07043, USA
2
Department of Ecology and Evolutionary Biology, University of Kansas, Lawrence, KS 66045, USA
3
School of Environment and Natural Resources, College of Food, Agricultural and Environmental Sciences, The Ohio State University, Columbus, OH 43210, USA
4
Restoration Ecologist, Granville, OH 43023, USA
*
Author to whom correspondence should be addressed.
Land 2021, 10(10), 1091; https://doi.org/10.3390/land10101091
Submission received: 31 August 2021
/
Revised: 5 October 2021
/
Accepted: 10 October 2021
/
Published: 15 October 2021
(This article belongs to the Special Issue Grassland Restoration)
Abstract
:Since the passage of legislation in 1977, Appalachian mineland reclamation is typically completed using non-native C3 grasses and forbs. Alternatively, reclamation with native prairie (C4) grasses and forbs offers a more ecologically friendly alternative that can contribute to native plant conservation and potentially improve soil properties more quickly than shallower rooted C3 cool-season grasses. We assessed the establishment of native prairie after reclamation, evaluating three treatments for six years after planting—traditional cool season planting, native prairie planted at light density, and native prairie planted at heavy density. All treatments reached the objectives of reclamation—percentage of ground covered by vegetation—within 2 years after planting. All treatments at all sites, except for one site by treatment combination near a forest, showed an increase in plant species richness and Shannon–Wiener diversity in the first four years of reclamation, a peak around 5 years, and subsequent decrease. Little difference in plant richness and Shannon–Wiener diversity among treatments was observed. However, the two native seed mixes quickly diverged from the traditional mix in terms of community structure and diverged further over time, with both native treatments heading towards a more desirable native prairie grassland state, while the traditional mix remained dominated by non-native cool season grasses. The native treatments also exhibited greater increase in microbial biomass and fungi:bacteria ratio over time compared to the traditional mix. Soil organic carbon increased over time regardless of seed mix treatment. Exchangeable base cations and phosphorus generally decreased over time, as expected, regardless of seed mix treatment, likely due to uptake from established plants. Native grassland species were able to establish despite inclusion of some traditional species in the native mix. Native plant establishment likely resulted in benefits including pollinator resources, bird and wildlife habitat, and increased soil health, and we recommend that native prairie mixes be used directly in reclamation moving forward, as they are able to meet reclamation goals while establishing a successful native prairie plant community.
1. Introduction
The Appalachian Mountain region of the United States of America (USA) has been greatly impacted by surface black coal mining [1,2]—10,000 km2 have been surface mined since 1977 [3]. Surface mining involves removal of vegetation, soil, and subsoil layers, and disrupts ecosystem function at all levels. Since the passage of the Surface Mining Control and Reclamation Act of 1977, reclamation typically involves recontouring and some soil replacement, but most of the essential soil properties are lost in the process. During mining soils and fracture overburden are removed, piled, and afterwards re-applied to the surface, often purposefully compacted to prevent soil erosion [4,5]. This storage, handling, and compaction can result in high bulk density [5], loss of soil carbon [6], microbial communities [7,8], nutrients [9,10], reduced infiltration rates [11], and changes in other properties of soil necessary for healthy plant growth. Rock spoils within the soil can affect pH—some mine soils have been found with pH as low as 3.0, which typically prevents vegetation growth [5]. Soil compaction and other reclamation methods aimed at ensuring clean water and reducing erosion are required by the Surface Mining Control and Reclamation Act, but make restoring forests on reclaimed mine lands difficult [12,13,14,15]. In this situation, creating a novel ecosystem with some ecological function different from the historical state is appropriate (i.e., reclamation) [16].
Grassland reclamation is a reasonable choice for former mine lands as conversion to grassland can provide ecological and economic benefits such as quick growing ground cover, stable grassland habitat for declining species of grassland birds [17], and useful grazing or haying fields [3]. Since 1977, most reclaimed minelands in the United States have been planted as cool-season grasslands, primarily with non-native species— one survey found more than 50% of reclaimed areas occupied predominantly by exotic invasive plants, and only 2 of 25 areas to have forest-like vegetation [18]. Temporal dynamics of grassland reclamation on former minelands are not well known. Minelands are thought to remain in arrested succession for decades or more [19], but aggressive invasive shrubs such as Elaegnus umbellata may encroach and turn areas into near monoculture shrublands [20].
Temporal dynamics of prairie grassland restoration from agriculture have been described in more detail and might provide some expectation of responses of former mineland to grassland restoration. With prairie restoration, soil organic C generally increases linearly for the first several decades [21,22,23,24,25], but on longer timescales organic C approaches an equilibrium [22,26]. The fungi:bacteria ratio generally increases with restoration age, because of an increase in arbuscular mycorrhizal fungi FAME biomarkers [27,28]. Plant diversity often begins to decrease a few years after restoration due to increased dominance of the most dominant grasses [29,30,31,32,33]. The decrease in plant diversity has been attributed to soil drivers [34] including fertilization legacy [35,36] and shifts in soil structure and soil microbial communities [37]. It remains unclear if similar temporal dynamics will be observed in mineland reclamation.
Since 1977, mineland revegetation in the USA typically begins with seeding non-native cool-season grassland species. One alternative to planting cool-season grasslands on reclaimed mine land is using native warm-season prairie species, which can provide ecosystem services and contribute to native plant conservation. Prairie species have been successfully used in mine reclamation since the early 1920s in the area known as the prairie peninsula (western Iowa through Indiana). In the Appalachian region, where prairie fragments may have existed but were few and far between, prairie species were not considered for post-reclamation use until recently. One reclaimed mine site known as The Wilds planted nearly 700 acres of prairie to replace cool season grasses between 2001–2016 [8]. These prairie restorations were successful in establishing a native plant community and showed some signs of improving soil carbon and other soil properties [8]. As prairies established on agricultural lands have been shown to decrease nutrients and increase organic matter and soil microbial biomass [38,39], there is the potential for prairies on reclaimed mineland to perform similarly. However, there is still a need to better understand how successful native prairie establishment can be on reclaimed minelands.
While reclamation requirements focus on addressing acid mine drainage and establishing at least 90% ground coverage by vegetation; successful reclamation could incorporate native plant coverage; assessment of soil properties; and ecosystem services such as pollinator, grassland bird, or other wildlife habitat. For these parameters, planting with native species could drastically improve chances of success. Therefore, comparisons of planting with non-native species and a mix incorporating natives could help advance mineland reclamation. Seed mixes containing mostly native species have been shown to promote some desirable ecosystem properties (e.g., increases in native cover) in mine reclamation in eastern Ohio, USA two years after establishment [7]. Seed mix effects over time, however, have not been evaluated. To assess temporal interactions with seed mix effects, three independently reclaimed mines were evaluated for several community and ecosystem properties over six years (2015–2020). We hypothesized that (1) plant diversity metrics, arbuscular mycorrhizal fungi biomass, and fungi:bacteria ratio, as well as soil β-glucosidase enzyme activities, would be higher in native seed treatments compared to traditional seed mixes; (2) these responses would increase with time since reclamation; (3) plant communities would differ between seed treatments and years; and (4) soil organic matter would be higher and base cations would be lower after longer establishment of grasslands (six growing seasons) compared to less established (two growing seasons).
2. Methods
2.1. Site Descriptions and Study Design
Three sites were chosen (Figure 1), all of which were former mine land sites located in southern and eastern Ohio, and previously identified by Swab et al. [7]. Middleton Run is located in Jackson County. Joyce Hill is located in Tuscarawas County. Rose Valley is located in Belmont County. Location and soil texture (hydrometer method; arithmetic means per site and treatment) are described in Table 1. These sites were reclaimed by the Ohio Division of Mineral Resource Management within the Ohio Department of Natural Resources. Soils at all sites were classified as human-altered and human-transported (HAHT) soils. This soil class is proposed for the US Soil Taxonomy [40], including soils with a history of being removed before coal extraction, stored in piles during mining, and moved back after mining. The World Reference Base for Soil Resources (WRB) classifies HAHT soils as Technosols [41]. These highly disturbed soils were altered and restored during reclamation, where mixing of soil and soil compaction occurred intentionally. The soil type at Joyce Hill is a Westmoreland silt loam; its parent material is a fine-loamy residuum weathered from siltstone. The Middleton Run soil type is Bethesda channery silt loam, developed from coal extraction mine spoil derived from sandstone and shale. The soil type at Rose Valley is a Morristown channery silt loam; its parent material is coal-extraction mine spoil derived from limestone, sandstone, and shale.
Reclamation of sites and planting occurred in between December 2014 and July 2015. Each site was planted primarily with the traditional mix used for Ohio Department of Natural Resources (ODNR) reclamation, consisting of 6 non-native species (Lotus corniculatus, Lolium perenne, Dactylis glomerata, Phleum pretense, Trifolium pretense, and Lolium multiflorum) seeded at 56.04 kg ha−1. At each site, two 0.4 ha plots were planted with a native seed mix (including the first three species from the traditional mix, plus Panicum virginatum, Sorgaphstrum nutans, Chaemechrista fasciculate, Coreopsis tinctoria, Rudbeckia triloba, Helanthus maximillani, and Asclepias syriaca), one at 16.81 kg ha−1 (Native Light) and one at 33.63 kg ha−1 (Native Heavy). Seed mixes and methodologies used for mine reclamation are more fully described in Swab et al. [7]. The species composition from the first growing season at Rose Valley was excluded from analysis as it was established later in the growing season than other sites.
Placement of native seeding treatments of 0.4 ha were haphazardly assigned within each site (the rest of each site was planted with the traditional mix); site was treated as a block. A block was treated as a main effect in analyses where the response variable was sampled in three or fewer sampling years. For response variables with more than three years of sampling, sites were treated as separate experiments to focus on temporal dynamics.
2.2. Vegetation
Vegetation sampling was conducted each year in early August from 2015–2020. Three 40-m fixed transects were established within each treatment at each site, for a total of 9 transects per site. Each transect was sampled every 5 m with a 1 m2 quadrat frame (9 frames per transect, 27 frames per treatment, 81 frames per site) utilizing a modified Daubenmire method [42]. Percent cover of each species was visually estimated within each sampling frame. These data were used to calculate diversity metrics (Shannon–Wiener index and species richness). These data were also used to create multivariate ordinations of site species composition. Seed treatments (traditional seed mix at 56.04 kg/ha, native-heavy seed mix at 33.63 kg/ha, and native-light seed mix at 16.81 kg/ha) and year were evaluated for their effect on several diversity and ecosystem parameters. Each site was analyzed separately. Each quadrat was considered spatially independent.
2.3. Soil
Soil sampling (three samples per treatment; 9 samples per each site) was conducted at the center of each transect in August annually from 2016–2020. At each collection point, 10 soil cores were collected in 0–15 cm depth. After sampling, each set of cores was mixed, bagged, and stored in a cooler and transported to the laboratory. Within a week after sampling, soils were passed through a 2-mm sieve, homogenized, and kept at −20 °C until ester-linked fatty acid methyl ester (FAME) was analyzed and at 4 °C until enzyme activities were analyzed. Soil samples for soil chemistry were air-dried at room temperature for three days and subsequently stored at 4 °C. Ester-linked fatty acid methyl esters (FAME) were analyzed in 2016, 2018, and 2019, and used as microbial biomarkers and for microbial biomass estimation. Analyses of FAME biomarkers were conducted according to the methods of Schutter and Dick [43] with an internal standard to allow calculation of total FAME concentration [44]. Detection and quantification of biomarkers was performed with a Hewlett-Packard 6890 N gas chromatograph equipped with a HP Ultra 2 capillary column and a flame ionization detector. Gram positive bacteria FAME biomarkers used were a15:0, i15:0, i16:0, a17:0, and i17:0. Gram negative biomarkers used were 16:1ω7c, 18:1ω7c, 17:0cyc, and 19:0cyc [45]. Saprophytic fungi biomarkers used were 18:2ω6,9c and 18:1ω9c [46]. Arbuscular mycorrhizal fungi were indicated by the FAME biomarker 16:1ω5c [47]. Analyses of β-glucosidase (EC 3.2.1.21 β-d-glucoside glucohydrolase) activity (GLU) were performed in 2016, 2018, and 2019, as described by Eivaza and Tabatabai [48] except toluene was not used due to the short incubation time. Briefly, for each sample, two 1 g- samples were weighed each in two Erlenmeyer flasks and incubated in buffered substrate solution at 37 °C. Substrate solution was prepared using ρ-nitrophenyl-β-D-glucoside (Sigma N7006), respectively. A third assay with substrate-free buffer was incubated for each sample and served as a control. To each assay, 0.5 M CaCl2 and 0.1 M C4H11NO3 (tris(hydroxymethyl)aminomethane) pH 12 were added after incubation, suspensions were filtered, and absorbance of the ρ-nitrophenol (PNP) product was measured at 415 nm and calibrated against a PNP standard. GLU activities are expressed as μmol PNP g−1 h−1.
Several soil chemical responses were measured in the fall of 2016 and 2020. Soil organic matter was measured by loss-on-ignition (data 2016: 360 °C for 2 h, data 2020: Midwest labs: 375 °C for 2 h). Soil pH was measured using a benchtop pH meter in a 1:1 soil to deionized water suspension. Phosphorus was measured in 2016 using a Mehlich-3 extraction and quantified by inductively coupled plasma spectroscopy. Potassium, magnesium, and calcium were measured with Mehlich-3 extraction [49]. Soil samples taken in 2020 were processed by Midwest Laboratories. Phosphorus was measured in 2020 using a Bray-1 extraction and quantified by inductively coupled plasma spectroscopy. Potassium, magnesium, and calcium were measured with ammonium acetate extraction [50]. Soil phosphorus, potassium, magnesium, and calcium values from 2020 were converted to Mehlich-3 before comparison using the relationships described in Culman et al. [51]. Cation exchange capacity was also quantified.
2.4. Statistics
All statistics were performed in R [52] with α = 0.05. All sites were analyzed in separate statistical models. Plant diversity metric responses (Shannon–Wiener index and species richness) to growing season were modeled using restricted maximum likelihood generalized additive models with the mgcv package [53,54]. All plant diversity models had a growing season by seed treatment thin plate smooth, a plot random effect smooth to account for repeated measures, a transect random effect smooth to further control for spatial variation, and a growing season by transect thin plate smooth penalized on the squared first derivative to allow shape of response to growing season to vary among transects [55]. All smooths used the maximum number of basis dimensions, but k-index was still lower than 1. This suggests that there might be fine scale temporal variation that we were unable to detect. To ensure that models were not overfitted, 10-fold cross validation was performed with the gamclass package [56]. In all cases, mean squared error of data and validation data were similar (less than 0.02 difference for Shannon–Wiener index models and less than 0.7 for species richness models). To detect if species dominance is negatively associated with diversity, Pearson correlations of cover of the most dominant plant with diversity metrics using a less than 0 alternative were performed after visually confirming normality with quantile–quantile plots.
Differences in multivariate plant community composition in response to the interaction of growing season and seed treatment were tested with analysis of similarity (ANOSIM) using Bray–Curtis dissimilarities with 1000 permutations. Multivariate plant community responses were visualized using metric dimensional scaling (MDS; also known as principal coordinate analysis (PCoA)) with Bray–Curtis dissimilarities. Standard error ellipses from the weighted average MDS scores were presented. All multivariate analyses were conducted with the vegan package [57].
Soil univariate responses (PLFA biomarkers, soil chemical properties) to seed mix treatment, year, and their interaction were analyzed with the nlme package [58]. Repeated measures were accounted for by including an autoregressive order 1 autocorrelation structure in the gls function. Significance of predictor terms in univariate autoregressive models were assessed using marginal p values. Estimated marginal means (also known as least-squares means) were determined using the emmeans package [59] with degrees of freedom based on gls model error. All base cation concentration estimated marginal means and standard errors were back transformed from a natural log scale. Šidák-adjusted comparisons among estimated marginal means of site and year or seed mix treatment within a site were performed with the emmeans package.
To compare all variables, sums of percent cover were calculated for each plant species at each transect for year 2020. The 2020 vegetation data, 2020 soil chemical data, 2019 GLU data, and 2019 FAME data were combined into a single data frame. A correlogram of all variables was created. Then, a metric dimensional scaling ordination of the FAME biomarkers with environmental vectors (soil chemistry, GLU, and plant diversity metrics) was also created.
3. Results
3.1. Vegetation
The Shannon–Wiener diversity index at Joyce Hill had a unimodal curve over time with a peak around five growing seasons for both native light and native heavy seed mixes, according to generalized additive models (Figure 2). The traditional seed mix at Joyce Hill, however, displayed a bimodal pattern in diversity over time with a peak between 2 and 3 years and a larger magnitude peak at 5 years (Figure 2). The Shannon–Wiener diversity index at Middleton Run also showed a minimum value around three growing seasons and a maximum value around five growing seasons in the native heavy and native light treatments (Figure 2). However, the traditional seed mix at Middleton Run showed no change in diversity over time. All seed treatments at Rose Valley peaked around five growing seasons (Figure 2). Diversity began to decrease after five growing seasons for all treatments at Joyce Hill and the native seed treatments at the other sites. Plant species richness generally followed the same pattern as the Shannon–Wiener index with two exceptions, Joyce Hill traditional treatment and Rose Valley native light treatment (Figure 3). Rose Valley traditional Shannon–Wiener values remained largely unchanged over growing seasons, while richness increased. Rose Valley native light had Shannon–Wiener values increase over the first 5 years before decreasing, while richness remained largely unchanged over growing seasons. These differences in trends suggest that plant evenness is largely driving diversity trends at Joyce Hill in the traditional treatment and at Rose Valley in the native light treatment. All sites displayed a negative association of dominant plant cover and plant Shannon–Wiener diversity index (Joyce Hill: Dactylis glomerata, correlation = −0.14, p < 0.001 (134 total species observed); Middleton Run: Panicum virgatum, correlation = −0.16, p < 0.001 (157 total species observed); Rose Valley: Dactylis glomerata, correlation = −0.29, p < 0.001 (187 total species observed)). Similar negative associations of dominant cover and plant species richness were observed for Joyce Hill (correlation = −0.23, p < 0.001) and Rose Valley (correlation = −0.28, p < 0.001), but there was no significant richness association at Middleton Run (correlation = −0.01, p = 0.382).
At all sites, the interaction of growing season and seed treatment influenced plant species composition (Figure 4). At Joyce Hill, all seed treatments had similar composition for the first two growing seasons, then the traditional seed treatment diverged from the two native seed treatments (Figure 4A). At Middleton Run and Rose Valley, all seed treatments had similar composition in the first growing season, then the traditional seed treatment diverged from the two native seed treatments (Figure 4B,C).
3.2. Soil
Total microbial biomass at Joyce Hill responded to sampling year (F2,18 = 12.69, p < 0.001), with higher biomass in 2019 (Figure 5A, Table S1). At Middleton Run, total biomass responded to seed treatment (F2,17 = 4.47, p = 0.028), with higher biomass in the native heavy seed treatment (Figure 5B, Table S1). At Rose Valley, total biomass responded to both year (F2,18 = 5.57, p = 0.013) and seed treatments (F2,18 = 5.85, p = 0.013; Figure 5C, Table S1). Native heavy seed treatment had higher total microbial biomass than other seed treatments, and biomass was higher in 2019 than previous years.
At Joyce Hill, arbuscular mycorrhizal fungal biomass responded to an interaction of year and seed treatment (F4,18 = 9.80, p < 0.001; Figure 5D, Table S1), with biomass in the native light seed treatment increasing from 2016 to 2019, with no change in native heavy or traditional treatments. At Middleton Run, arbuscular mycorrhizal fungal biomass responded to both year (F2,17 = 6.85, p = 0.007) and seed treatment (F2,17 = 4.20, p = 0.033; Figure 5E, Table S1). Biomass increased with age in all treatments and was higher in both native seed mixes than in the traditional treatment, and biomass increased from 2016 to 2019. At Rose Valley, arbuscular mycorrhizal fungal biomass responded to an interaction of year and seed treatment (F2,18 = 3.94, p = 0.018; Figure 5F, Table S1). All seed treatments increased from 2016 to 2019, with both native seed treatments higher in arbuscular mycorrhizal fungal biomass than traditional in 2019. The fungal to bacterial (F:B) ratio responded to an interaction between year and seed treatment at Joyce Hill (F4,18 = 8.14, p < 0.001) and Rose Valley (F4,18 = 5.29, p = 0.005), where there was no change in the F:B ratio in traditional seed treatments, but both native seed treatments increased from 2016 to 2019 (Table S1). At Middleton Run, there was no effect of year or seed treatment on the F:B ratio (Table S1).
Soil organic matter responded to a site by year interaction (F2, 36 = 3.82, p = 0.031), where there were higher organic matter concentrations in 2020 than 2016 at all sites (Table 2). Soil pH responded to a site by year interaction (F2, 36 = 13.82, p < 0.001), where pH was distinct among sites and similar between years at Joyce Hill. At Middleton Run, higher pH values were measured in 2016 than 2020. At Rose Valley, pH values were higher in 2020 than 2016 (Table 3). Soil pH also responded to a site by treatment interaction (F4, 36 = 13.82, p < 0.001), where traditional and native heavy seed treatments had higher pH than native light at Joyce Hill, traditional had a higher pH than native light seed treatment with native heavy not statistically different from other treatments at Middleton Run, and similar pH values among seed treatments at Rose Valley (Table 3). Cation exchange capacity responded to a seed treatment by site interaction (F4, 36 = 3.92, p = 0.001), where CEC was similar among seed treatments at Joyce Hill and Rose Valley, but native light had the highest CEC followed by native heavy followed by traditional at Middleton Run (Table 4).
Soil β-glucosidase (GLU) activities were lowest in 2016, at the beginning of the experiment, and were highest in 2019 (last year GLU was sampled) at all three sites (A–C in Figure 6). An increase in GLU activities was seen in native prairies and in traditional cool season grasslands, with 2019 data showing 2–3.5 higher beta-glucosidase activities when compared to activities measured in 2016 (F2, 54 = 34.76, p < 0.001). Sites also differed in GLU activities (F2, 54 = 5.08, p = 0.010). Soil organic matter and GLU were not strongly correlated (Pearson correlation = 0.02; Figure 7).
Two of three base cations and phosphorus (P (F2, 36 = 3.91, p = 0.029), Mg (F2,36 = 4.66, p = 0.016), and Ca ([F2, 36 = 13.82, p < 0.001)) responded to a site by year interaction where concentrations generally decreased from growing season two (2016) to growing season six (2020), but some sites had similar values between years (Tables S2–S4). Phosphorus also varied by a site by seed treatment interaction (F4, 36 = 3.45, p = 0.017), where phosphorus concentrations were similar among treatments at Joyce Hill and Rose Valley. Phosphorus concentration was higher at Middleton Run compared to other sites, with higher concentration in the traditional treatment compared to native light, and native heavy was not statistically different from other treatments (Table S2). Potassium concentration varied only by site (F2, 36 = 13.16, p < 0.001), where Joyce Hill (2.39 ± 0.17 ppm) had lower concentrations than Middleton Run (3.53 ± 0.17 ppm) and Rose Valley (3.56 ± 0.16 ppm). Magnesium concentration was also influenced by a site by seed treatment interaction (F4,36 = 6.11, p < 0.001), where concentrations were similar among seed treatments at Joyce Hill, but varied in contrasting ways at the other sites. At Middleton Run, traditional seed treatment had a higher magnesium concentration than native light with native heavy not being statistically different than other treatments (Table S3). At Rose Valley, native light had higher magnesium concentrations than traditional treatment with native heavy not statistically different than other treatments (native light = 483 ± 34.4 ppm, native heavy = 442 ± 31.4 ppm, and traditional = 537 ± 38.2 ppm). Calcium also varied by a site by seed treatment interaction (F4, 36 = 2.84, p = 0.038), where native light had lower calcium concentrations compared to all other seed treatments at Joyce Hill, but similar concentrations were observed among treatments at Middleton Run and Rose Valley (Table S4).
4. Discussion
Overall, results show that planting native prairie species to revegetate reclaimed mineland in Appalachian Ohio can reach beyond reclamation goals. Achievements include full ground cover within 2 years after planting (minimum requirement of reclamation), and substantial native plant cover within 6 years after planting (not required in reclamation). Impacts on soil are less certain. Many soil properties improved with time since reclamation regardless of treatment. Native mixes may improve soil health more quickly than traditional mixes, but further monitoring is needed due to slower responses of soil compared to vegetation.
4.1. Vegetation Change over Time
Proportions of plant species abundance changed significantly with time. Species (Coreopsis tinctoria, Lolium multiflorum) previously reported as flourishing in the first year or two [7] have disappeared or greatly reduced in abundance from the plant communities by year 6. Non-native grasses drastically decreased in abundance in native treatments by year 4–5, with only Lotus corniculatus maintaining significant coverage, and the sum of all volunteer species reaching coverage percentages above any individual planted species—so volunteer species were a significant portion of the community by year 4–5, though which species established varied by site. Despite the individual variance, overall results indicated planting native prairie plants directly after reclamation in Appalachian Ohio was successful in establishing a permanent native plant community likely to maintain itself longer than the 6 documented years.
Vegetation diversity followed expected development at nearly all sites and treatments, increasing species richness and diversity for 3–4 years until reaching a peak around year 5, and declining afterwards. Areas planted with native mixes quickly diverged in community composition from those with traditional mixes, with traditional mixes remaining dominated by non-native cool season grasses while native treatments became dominated by native prairie species. Despite containing some of the same non-native species in the mix, the native treatments were successful in establishing a different (and more desirable for native plant conservation) prairie plant community. Decreasing plant diversity after a few seasons of restoration in grass-dominated ecosystems has been observed many times in North America [29,30,31,32,33]. This is typically due to increases in dominance of a dominant grass and has also been attributed to changes in soil structure and microbial composition [37]. Our results are consistent with these previous findings, as negative correlations of Shannon–Wiener diversity and cover of the most dominant grass were significant for all sites. Continued monitoring is required to see if this decreasing diversity trend continues. Managing the sites with disturbances such as mowing, burning [60,61,62], or grazing [63], which was not performed on these sites, may help mitigate declines in plant diversity by reducing the dominance of the prairie grasses which is typically observed with time. In the Rose Valley traditional plots only, diversity continued to increase with time, which may be due to an influx of some forest species in the later years. It is possible that this site is beginning to succeed into a forest. This possible successional trajectory would be considered a desirable outcome for many. In the native treatments, dominance of warm-season grasses may inhibit transition into forest. However, the appearance of some forest-adapted species does not ensure their long-term survival, in many reclaimed mine sites, forest species establish but never make it beyond seedling stage due to the overall poor soil conditions and grass competition—to combat this, the Forestry Reclamation Approach has been developed, which includes ground decompaction and using less competitive ground covers before tree planting on reclaimed grasslands [64].
Management of reclamations as a novel ecosystem, with a focus on ecosystem functions [65] is an option for managing former minelands which can increase ecosystem services. For instance, restoring to grasslands is an alternative to restoring to forests historically native to eastern Ohio, and might be preferred if conditions have been altered substantially and the area is not able to support reforestation. As an example of the value of these grasslands, reclaimed mineland grasslands stuck in arrested succession have been shown to be stable and important habitat for declining grassland birds [17]. Regardless of the choice to manage as a novel ecosystem or a successional forest, we recommend managing mine reclamation sites for native plant diversity where possible, as this ecosystem property is easier to monitor than many others and is often correlated with multiple ecosystem functions (i.e., multifunctionality) [66], including biomass production and nutrient utilization. However, a lack of difference in plant diversity does not mean that restorations were unsuccessful [8]. Typical grassland management techniques could improve diversity. As discussed above, burning, mowing, and grazing are common management techniques for prairies that can be performed at different frequencies depending on management goals. In addition, thinning of dominant plant species (e.g., clipping or targeted herbicide) [67] or starting with low seeding densities of dominant grasses [68] could increase plant diversity; however, these options need further study. Even with grass dominance, the use of native grassland species over traditional non-native seed mixes provides benefits to restoration, such as pollinator relations [69], bird and wildlife habitat [70], and contributions to the conservation of native species. They additionally provide increased recovery of ecosystem services such as soil health, including carbon sequestration [71] and decreased nitrous oxide emissions [72].
4.2. Soil Microbiology and Chemistry Changes over Time
Time since restoration and seed mix treatment significantly influenced microbial biomass for the majority of sites, with FAME microbial biomass increasing with time and with native seed mix treatments, particularly with the native heavy seed mix. In two out of three sites, total microbial biomass was higher in the native heavy seed treatment than native light or traditional seed mixes, but there is no consistent explanation as to why, given that, aboveground, there were not consistent differences found in vegetation between the light and heavy treatments. In Middleton Run, there is higher warm season grass dominance in the native heavy sites, but not Rose Valley, so this phenomenon is unexplained and may be more due to individual soil variance than other factors.
Total, fungal, AMF, and Gram-positive bacteria biomass, and the fungi:bacteria (F:B) ratio at most sites increased with time (Table S1). This is consistent with several restoration studies that show recovery of microbial communities with recovery of perennial plant communities [26,27,28]. There were also interactions between growing season and seed mix treatment, with F:B ratio and biomass of actinomycetes, arbuscular mycorrhizal fungi, and total bacterial biomass in native and traditional mixes increasing with time for all treatments, but increasing more in the native mixes than in the traditional mix. After five years, soil microbial biomarkers were beginning to separate by treatment (especially greater fungal abundance in native treatments), particularly at Rose Valley. However, microbial communities recover on longer time scales than aboveground communities, so composition of microbial communities between treatments may continue to diverge. Observed patterns in microbial biomass and composition (specifically increasing F:B ratio with time) indicate that traditional mixes can partially restore microbial biomass and some ecosystem services, but native seed mixes provide greater overall benefit.
Many soil properties recover on decadal time scales [26,27,28,39,73,74], so differences seen on this relatively short time scale can increase with time. As relatively short time scales (less than a decade) were monitored, soil enzyme activities were also measured. Soil enzyme activities hold potential as early and sensitive indicators of soil ecological stress or successful soil restoration [75,76,77,78]. Bandick and Dick showed soil β-glucosidase (GLU) activities as positive indicators for conservation agricultural management strategies; cover cropping and organic amendments to soils resulted in increased GLU activities. GLU, a carbon-degrading (particularly cellulose) exoenzyme, is regarded as one of the most sensitive assays for detecting cultivation intensity [79]. GLU activity is mainly affected by soil condition and not as much by seasonal effects or fluctuations of the soil microbial population, which makes it a good bio-indicator. In our study beta-glucosidase activities increased over time, probably due to increased production of GLU by microorganisms and stabilization of the enzyme in the soil matrix, as well as GLU activity being positively stimulated by an increase in soil organic carbon.
Increases in soil organic matter and CEC over time were similar to a mine reclamation chronosequence in West Virginia, USA [80]. This study found that soil organic carbon increased by 1.6X from a two-year-old site to a five-year-old site. Cation exchange capacity increased by 2.7X in these same sites [80]. Soil organic matter storage is an ecosystem function of interest in degraded ecosystems due to the potential to mitigate carbon dioxide emissions [81]. However, typical organic matter measurement techniques in mine reclamation can be misleading, as results also reflect inorganic carbon, fossilized organic carbon, and other products of coal [5]. As such, soil organic matter values should not be directly compared among sites that might have different sizes of C pools related to coal. These soil organic matter values can be compared among years and treatments within a site if coal products are homogenous. Overall, our study showed that soil OM is increasing over time in all treatments and coincides with shifts in the soil microbial community, but not GLU enzyme activities, possibly due to high C:N ratio [82]. Base cations generally decreased over time, as expected, and likely due to uptake by established plants, but did not change as dramatically as soil organic matter.
5. Conclusions
When comparing a native prairie mix with a traditional non-native cool season mix in mineland reclamation in southeast Ohio over a 6-year time period, the native mix was successful in establishing a higher cover of native plants and establishing a mostly native plant community likely to remain stable and self-sustaining. Differences in plant species composition were initially apparent between the two native treatments as compared with the traditional treatment and diverged farther with time. While the native seed mix treatment contained more native species, diversity metrics were similar among treatments. Overall percent cover of vegetation was similar between all treatments—an important metric for determining reclamation success and an indicator that the native treatments were similarly successful as the traditional treatment.
Soil properties often take longer to recover than aboveground communities, but soil chemistry improved over time, regardless of treatment. However, total microbial and arbuscular mycorrhizal fungal biomass increased more in both the light and heavy native seed mixes. Overall, the native prairie seeding directly in reclamation, though it developed a novel ecosystem in a previously forested area, was successful in establishing a native plant community, improving soil properties, and otherwise offering ecosystem services. It is our recommendation that native prairie seed mixes be used rather than non-native cool season grasses, unless cool season grasses are preferred for grazing, haying, or another use. We have developed a recommended native seed mix (Table S5), which improves upon native mix used here. This mix includes a wider variety of bloom colors, shapes, and seasonality, to better support pollinator communities and provide more plant diversity throughout the growing season.
Supplementary Materials
The following are available online at https://www.mdpi.com/article/10.3390/land10101091/s1, Table S1: Abundance of soil PLFA biomarkers by site with growing season and seed mix treatment interactions. Growing seasons followed by the same upper-case letter are not significantly different at p < 0.05. Pairs of values of the seed mix treatment within a site followed by the same lower-case letter are not significantly different at p < 0.05, Table S2: Phosphorus concentrations (ppm) by site and growing season interaction and by site and seed mix treatment interaction. Values are estimated marginal means with one standard error in parentheses. Šidák-adjusted comparisons were made among estimated marginal means. Growing seasons followed by the same upper-case letter are not significantly different at p < 0.05. Pairs of values of the seed mix treatment within a site followed by the same lower-case letter are not significantly different at p < 0.05, Table S3: Magnesium concentrations (ppm) by site and growing season interaction and by site and seed mix treatment interaction. Values are estimated marginal means with one standard error in parentheses. Šidák-adjusted comparisons were made among estimated marginal means. Growing seasons followed by the same upper-case letter are not significantly different at p < 0.05. Pairs of values of the seed mix treatment within a site followed by the same lower-case letter are not significantly different at p < 0.05, Table S4: Calcium concentrations (ppm) by site and growing season interaction and by site and seed mix treatment interaction. Values are estimated marginal means with one standard error in parentheses. Šidák-adjusted comparisons were made among estimated marginal means. Growing seasons followed by the same upper-case letter are not significantly different at p < 0.05. Pairs of values of the seed mix treatment within a site followed by the same lower-case letter are not significantly different at p < 0.05, Table S5: Suggested high diversity native mix for reclaimed land. This mix is designed to support local pollinators or other wildlife with a diverse flowering population (including varied colors and flower shapes) blooming through most of the growing season, with a comparable cost as traditional seeding. Costs are based on prices from Ernst Seed Company, Meadville, PA, USA.
Author Contributions
D.A.S. contributed to manuscript writing, data analysis, and revisions. K.D.E. contributed to data analysis and revisions. N.L. and R.D. contributed to soil analyses and revisions. R.M.S. contributed to writing, editing, and field sampling. All authors have read and agreed to the published version of the manuscript.
Funding
Funding for this work was provided by the Ohio Department of Natural Resources.
Institutional Review Board Statement
Not applicable.
Informed Consent Statement
Not applicable.
Data Availability Statement
The data presented in this study are openly available from ResearchGate at https://www.researchgate.net/publication/355189618_Natives_in_Reclamation_Data (accessed on 9 October 2021). (DOI: 10.13140/RG.2.2.33596.97923/1).
Acknowledgments
We would like to acknowledge Alexys Nolan, Patrick Boleman, Rachel Glover, and Zachary Dienes and numerous Wilds apprentices for their field work assistance. Additionally, we would like to acknowledge the following ODNR site managers for their assistance with site knowledge and access: Chad Kinney, Kaabe Shaw, Kevin Brachtner, Michael Gosnell, Jeff Calhoun, and Ben McCament. We would also like to acknowledge Hsiaochi Chang at The Ohio State University, School of Environment and Natural Resources, Soil Microbial Ecology Laboratory for running soil microbial analyses. We would also like to acknowledge Steve Culman and his lab at The Ohio State University School of Environment and Natural Resources in Wooster, OH for conducting soil nutrient content and organic matter analyses in 2016. Finally, we acknowledge Mike DeGreef for his assistance in formatting references. We would also like to acknowledge MAD Scientist Associates, especially Jenna Odegard, for assistance with fieldwork in 2020.
Conflicts of Interest
The authors have no conflicts of interest to report.
References
- Skousen, J.; Gorman, J.; Pena-Yewtukhiw, E.; King, J.; Stewart, J.; Emerson, P.; DeLong, C. Hardwood Tree Survival in Heavy Ground Cover on Reclaimed Land in West Virginia: Mowing and Ripping Effects. J. Environ. Qual. 2009, 38, 1400–1409. [Google Scholar] [CrossRef] [Green Version]
- Burger, J.A. Sustainable Mined Land Reclamation in the Eastern U.S. Coalfields: A Case for an Ecosystem Reclamation Approach. JASMR 2011, 15, 113–141. [Google Scholar] [CrossRef]
- Skousen, J.; Zipper, C.E. Coal Mining and Reclamation in Appalachia. In Appalachia’s Coal-Mined Landscapes; Zipper, C.E., Skousen, J., Eds.; Springer International Publishing: Cham, Switzerland, 2021; pp. 55–83. [Google Scholar]
- Angel, H.Z.; Stoval, J.P.; Williams, H.M.; Farrish, K.W.; Oswald, B.P.; Young, J.L. Surface and Subsurface Tillage Effects on Mine Soil Properties and Vegetative Response. Soil Sci. Soc. Am. J. 2018, 82, 475–482. [Google Scholar] [CrossRef] [Green Version]
- Skousen, J.; Daniels, W.L.; Zipper, C.E. Soils on Appalachian Coal-Mined Lands. In Appalachia’s Coal-Mined Landscapes; Zipper, C.E., Skousen, J., Eds.; Springer International Publishing: Cham, Switzerland, 2021; pp. 85–109. [Google Scholar]
- Shrestha, R.K.; Lal, R. Changes in Physical and Chemical Properties of Soil after Surface Mining and Reclamation. Geoderma 2011, 161, 168–176. [Google Scholar] [CrossRef]
- Swab, R.M.; Lorenz, N.; Byrd, S.; Dick, R. Native Vegetation in Reclamation: Improving Habitat and Ecosystem Function through Using Prairie Species in Mine Land Reclamation. Ecol. Eng. 2017, 108, 525–536. [Google Scholar] [CrossRef]
- Swab, R.M.; Lorenz, N.; Lee, N.R.; Culman, S.W.; Dick, R.P. From the Ground Up: Prairies on Reclaimed Mine Land—Impacts on Soil and Vegetation. Land 2020, 9, 455. [Google Scholar] [CrossRef]
- Howard, J.L.; Amos, D.F.; Daniels, W.L. Phosphorus and Potassium Relationships in Southwestern Virginia Coal-Mine Spoils. J. Environ. Qual. 1988, 17, 695–700. [Google Scholar] [CrossRef]
- Li, R.S.; Daniels, W.L. Nitrogen Accumulation and Form over Time in Young Mine Soils. J. Environ. Qual. 1994, 23, 166–172. [Google Scholar] [CrossRef]
- Nippgen, F.; Ross, M.R.V.; Bernhardt, E.S.; McGlynn, B.L. Creating a More Perennial Problem? Mountaintop Removal Coal Mining Enhances and Sustains Saline Baseflows of Appalachian Watersheds. Environ. Sci. Technol. 2017, 51, 8324–8334. [Google Scholar] [CrossRef]
- Lindsay, R.E.; Nawrot, J.R. Evaluation of Natural Revegetation of Problem Spoilbanks; Southern Illinois University: Carbondale, IL, USA, 1981. [Google Scholar]
- Corbett, E.A.; Anderson, R.C.; Rodgers, C.S. Prairie Revegetation of a Strip Mine in Illinois: Fifteen Years after Establishment. Restor Ecol. 1996, 4, 346–354. [Google Scholar] [CrossRef]
- Zipper, C.E.; Burger, J.A.; Skousen, J.G.; Angel, P.N.; Barton, C.D.; Davis, V.; Franklin, J.A. Restoring Forests and Associated Ecosystem Services on Appalachian Coal Surface Mines. Environ. Manag. 2011, 47, 751–765. [Google Scholar] [CrossRef]
- Wilson-Kokes, L.; DeLong, C.; Thomas, C.; Emerson, P.; O’Dell, K.; Skousen, J. Hardwood Tree Growth on Amended Mine Soils in West Virginia. J. Environ. Qual. 2013, 42, 1363–1371. [Google Scholar] [CrossRef]
- Lima, A.T.; Mitchell, K.; O’Connell, D.W.; Verhoeven, J.; Van Cappellen, P. The Legacy of Surface Mining: Remediation, Restoration, Reclamation and Rehabilitation. Environ. Sci. Policy 2016, 66, 227–233. [Google Scholar] [CrossRef]
- Ingold, D.J. Use of a Reclaimed Stripmine by Grassland Nesting Birds in East-Central Ohio. Ohio J. Sci. 2002, 102, 56–62. [Google Scholar]
- Zipper, C.E.; Burger, J.A.; McGrath, J.M.; Rodrigue, J.A.; Holtzman, G.I. Forest Restoration Potentials of Coal-Mined Lands in the Eastern United States. J. Environ. Qual. 2011, 40, 1567–1577. [Google Scholar] [CrossRef]
- Cavender, N.; Byrd, S.; Bechtoldt, C.L.; Bauman, J.M. Vegetation Communities of a Coal Reclamation Site in Southeastern Ohio. Northeast. Nat. 2014, 21, 31–46. [Google Scholar] [CrossRef]
- Wood, P.B.; Williams, J.M. Terrestrial Salamander Abundance on Reclaimed Mountaintop Removal Mines: Salamanders on Surface Mines. Wildl. Soc. Bull. 2013, 37, 815–823. [Google Scholar] [CrossRef]
- Baer, S.G.; Kitchen, D.J.; Blair, J.M.; Rice, C.W. Changes in Ecosystem Structure and Function along a Chronosequence of Restored Grasslands. Ecol. Appl. 2002, 12, 1688–1701. [Google Scholar] [CrossRef]
- Baer, S.G.; Meyer, C.K.; Bach, E.M.; Klopf, R.P.; Six, J. Contrasting Ecosystem Recovery on Two Soil Textures: Implications for Carbon Mitigation and Grassland Conservation. Ecosphere 2010, 1, 1–22. [Google Scholar] [CrossRef]
- Baer, S.G.; Heneghan, L.; Eviner, V.T. Applying Soil Ecological Knowledge to Restore Ecosystem Services. In Soil Ecology and Ecosystem Services; Wall, D.H., Bardgett, R.D., Behan-Pelletier, V., Herrick, J.E., Jones, H., Ritz, K., Six, J., Strong, D.R., van der Putten, W.H., Eds.; Oxford University Press: Oxford, UK, 2012; pp. 377–393. [Google Scholar]
- McLauchlan, K.K.; Hobbie, S.E.; Post, W.M. Conversion from Agriculture to Grassland Builds Soil Organic Matter on Decadal Timescales. Ecol. Appl. 2006, 16, 143–153. [Google Scholar] [CrossRef] [Green Version]
- Hurisso, T.T.; Norton, J.B.; Norton, U. Soil Profile Carbon and Nitrogen in Prairie, Perennial Grass–Legume Mixture and Wheat-Fallow Production in the Central High Plains, USA. Agric. Ecosyst. Environ. 2013, 181, 179–187. [Google Scholar] [CrossRef]
- Baer, S.G.; Bach, E.M.; Meyer, C.K.; Du Preez, C.C.; Six, J. Belowground Ecosystem Recovery During Grassland Restoration: South African Highveld Compared to US Tallgrass Prairie. Ecosystems 2015, 18, 390–403. [Google Scholar] [CrossRef]
- Bach, E.M.; Baer, S.G.; Meyer, C.K.; Six, J. Soil Texture Affects Soil Microbial and Structural Recovery during Grassland Restoration. Soil Biol. Biochem. 2010, 42, 2182–2191. [Google Scholar] [CrossRef]
- Scott, D.A.; Baer, S.G.; Blair, J.M. Recovery and Relative Influence of Root, Microbial, and Structural Properties of Soil on Physically Sequestered Carbon Stocks in Restored Grassland. Soil Sci. Soc. Am. J. 2017, 81, 50–60. [Google Scholar] [CrossRef]
- Sluis, W.J. Patterns of Species Richness and Composition in Re-Created Grassland. Restor. Ecol. 2002, 10, 677–684. [Google Scholar] [CrossRef]
- Camill, P.; McKone, M.J.; Sturges, S.T.; Severud, W.J.; Ellis, E.; Limmer, J.; Martin, C.B.; Navratil, R.T.; Purdie, A.J.; Sandel, B.S.; et al. Community- and Ecosystem-Level Changes in a Species-Rich Tallgrass Prairie Restoration. Ecol. Appl. 2004, 14, 1680–1694. [Google Scholar] [CrossRef]
- Myers, J.A.; Harms, K.E. Seed Arrival and Ecological Filters Interact to Assemble High-Diversity Plant Communities. Ecology 2011, 92, 676–686. [Google Scholar] [CrossRef] [PubMed]
- Hansen, M.J.; Gibson, D.J. Use of Multiple Criteria in an Ecological Assessment of a Prairie Restoration Chronosequence. Appl. Veg. Sci. 2014, 17, 63–73. [Google Scholar] [CrossRef]
- Baer, S.G.; Blair, J.M.; Collins, S.L. Environmental Heterogeneity Has a Weak Effect on Diversity during Community Assembly in Tallgrass Prairie. Ecol. Monogr. 2016, 86, 94–106. [Google Scholar] [CrossRef] [Green Version]
- Grman, E.; Zirbel, C.R.; Bauer, J.T.; Groves, A.M.; Bassett, T.; Brudvig, L.A. Super-abundant C 4 Grasses Are a Mixed Blessing in Restored Prairies. Restor. Ecol. 2021, 29. [Google Scholar] [CrossRef]
- Baer, S.G.; Blair, J.M.; Collins, S.L.; Knapp, A.K. Plant Community Responses to Resource Availability and Heterogeneity during Restoration. Oecologia 2004, 139, 617–629. [Google Scholar] [CrossRef] [PubMed]
- Faber, S.; Markham, J. Biotic and Abiotic Effects of Remnant and Restoration Soils on the Performance of Tallgrass Prairie Species. Ecol. Rest. 2012, 30, 106–115. [Google Scholar] [CrossRef]
- Scott, D.A.; Baer, S.G. Degraded Soil Increases the Performance of a Dominant Grass, Andropogon Gerardii (Big Bluestem). Plant Ecol. 2018, 219, 901–911. [Google Scholar] [CrossRef]
- Allison, V.J.; Miller, R.M.; Jastrow, J.D.; Matamala, R.; Zak, D.R. Changes in Soil Microbial Community Structure in a Tallgrass Prairie Chronosequence. Soil Sci. Soc. Am. J. 2005, 69, 1412–1421. [Google Scholar] [CrossRef] [Green Version]
- Matamala, R.; Jastrow, J.D.; Miller, R.M.; Garten, C.T. Temporal changes in C and N stocks of restored prairie: Implications for C sequestration strategies. Ecol. Appl. 2008, 18, 1470–1488. [Google Scholar] [CrossRef]
- Galbraith, J.; Shaw, R.K. Human-Altered and Human-Transported Soils. In Soil Science Division Staff. Soil Survey Manual; Ditzler, C., Scheffe, K., Monger, H.C., Eds.; USDA Handbook 18; Government Printing Office: Washington, DC, USA, 2017. [Google Scholar]
- Rossiter, D.G. Classification of Urban and Industrial Soils in the World Reference Base for Soil Resources. J. Soils Sediments 2007, 7, 96–100. [Google Scholar] [CrossRef]
- Daubenmire, R. A Canopy-Coverage Method of Vegetational Analysis. Northwest Sci. 1959, 33, 43–64. [Google Scholar]
- Schutter, M.E.; Dick, R.P. Comparison of Fatty Acid Methyl Ester (FAME) Methods for Characterizing Microbial Communities. Soil Sci. Soc. Am. J. 2000, 64, 1659–1668. [Google Scholar] [CrossRef]
- Zelles, L. Fatty acid patterns of microbial phospholipids and lipopolysaccharides. In Methods of Soil Biology; Schinner, F., Ed.; Springer: Berlin, Germany, 1996; pp. 80–92. [Google Scholar]
- Zelles, L. Fatty Acid Patterns of Phospholipids and Lipopolysaccharides in the Characterisation of Microbial Communities in Soil: A Review. Biol. Fertil. Soils 1999, 29, 111–129. [Google Scholar] [CrossRef]
- Kaur, A.; Chaudhary, A.; Kaur, A.; Choudhary, R.; Kaushik, R. Phospholipid Fatty Acid—A Bioindicator of Environment Monitoring and Assessment in Soil Ecosystem. Curr. Sci. 2005, 89, 1103–1112. [Google Scholar]
- Olsson, P.A.; Bååth, E.; Jakobsen, I.; Söderström, B. The Use of Phospholipid and Neutral Lipid Fatty Acids to Estimate Biomass of Arbuscular Mycorrhizal Fungi in Soil. Mycol. Res. 1995, 99, 623–629. [Google Scholar] [CrossRef]
- Eivazi, F.; Tabatabai, M.A. Glucosidases and Galactosidases in Soils. Soil Biol. Biochem. 1988, 20, 601–606. [Google Scholar] [CrossRef]
- Mehlich, A. Mehlich 3 Soil Test Extractant: A Modification of Mehlich 2 Extractant. Commun. Soil Sci. Plant Anal. 1984, 15, 1409–1416. [Google Scholar] [CrossRef]
- Lorenz, N.; Gardener, B.B.M.; Lee, N.R.; Ramsier, C.; Dick, R.P. Soil Enzyme Activities Associated with Differential Outcomes of Contrasting Approaches to Soil Fertility Management in Corn and Soybean Fields. Appl. Ecol. Environ. Sci. 2020, 8, 517–525. [Google Scholar] [CrossRef]
- Culman, S.W.; Mann, M.; Sharma, S.; Saeed, M.T.; Fulford, A.M.; Lindsey, L.E.; Brooker, A.; Dayton, E.; Warden, R.; Joern, B. Calibration of Mehlich-3 with Bray P1 and Ammonium Acetate in the Tri-State Region of Ohio, Indiana and Michigan. Commun. Soil Sci. Plant Anal. 2020, 51, 86–97. [Google Scholar] [CrossRef]
- R Core Team. R: A Language and Environment for Statistical Computing; R Foundation for Statistical Computing: Vienna, Austria, 2019; Available online: https://www.R-project.org/ (accessed on 9 October 2021).
- Wood, S.N. Thin Plate Regression Splines. J. R. Stat. Soc. Ser. B (Stat. Methodol.) 2003, 65, 95–114. [Google Scholar] [CrossRef]
- Wood, S.N. Fast Stable Restricted Maximum Likelihood and Marginal Likelihood Estimation of Semiparametric Generalized Linear Models: Estimation of Semiparametric Generalized Linear Models. J. R. Stat. Soc. Ser. B (Stat. Methodol.) 2011, 73, 3–36. [Google Scholar] [CrossRef] [Green Version]
- Pedersen, E.J.; Miller, D.L.; Simpson, G.L.; Ross, N. Hierarchical Generalized Additive Models in Ecology: An Introduction with mgcv. PeerJ 2019, 7, e6876. [Google Scholar] [CrossRef] [Green Version]
- Maindonald, J. Gamclass: Functions and Data for a Course on Modern Regression and Classification. R Package Version 0.62.3. 2020. Available online: https://CRAN.R-project.org/package=gamclass (accessed on 12 August 2020).
- Oksanen, J.; Blanchet, F.G.; Friendly, M.; Kindt, R.; Legendre, P.; McGlinn, D.; Minchin, P.R.; O’Hara, R.B.; Simpson, G.L.; Solymos, P.; et al. Vegan: Community Ecology Package. Ordination Methods, Diversity Analysis and Other Functions for Community and Vegetation Ecologists; The Comprehensive R Archive Network: Berkeley, CA, USA, 2016. [Google Scholar]
- Pinheiro, J.; Bates, D.; DebRoy, S.; Sarkar, D. R Core Team nlme: Linear and Nonlinear Mixed Effects Models. R Package Version 3.1-147. 2020. Available online: https://CRAN.R-project.org/package=nlme/ (accessed on 12 August 2020).
- Lenth, R. Emmeans: Estimated Marginal Means, Aka Least-Squares Means. 2020. Available online: https://CRAN.R-project.org/package=emmeans (accessed on 12 August 2020).
- Van Dyke, F.; Van Kley, S.E.; Page, C.E.; Van Beek, J.G. Restoration Efforts for Plant and Bird Communities in Tallgrass Prairies Using Prescribed Burning and Mowing. Restor. Ecol. 2004, 12, 575–585. [Google Scholar] [CrossRef]
- Rooney, T.P.; Leach, M.K. Replacing Hay-Mowing with Prescribed Fire Restores Species Diversity and Conservation Value in a Tallgrass Prairie Sampled Thrice: A 59-Year Study. Am. Midl. Nat. 2010, 164, 311–321. [Google Scholar] [CrossRef]
- Weir, J.R.; Scasta, J.D. Vegetation Responses to Season of Fire in Tallgrass Prairie: A 13-Year Case Study. Fire Ecol. 2017, 13, 137–142. [Google Scholar] [CrossRef]
- Howe, H.F. Dominance, Diversity and Grazing in Tallgrass Restoration: Ecology Has Much to Contribute to Debates over the Role of Grazing in Restoration—and Much to Learn from the Results of Experiments in Restorative Grazing. Ecol. Restor. N. Am. 1999, 17, 59–66. [Google Scholar] [CrossRef]
- Burger, J.; Graves, D.; Angel, P.; Davis, V.; Zipper, C. The Forestry Reclamation Approach. In The Forestry Reclamation Approach: Guide to Successful Reforestation of Mined Lands; Adams, M.B., Ed.; U.S. Department of Agriculture, Forest Service, Northern Research Station, FOREST SERVICE: Newtown Square, PA, USA, 2017; pp. 21–28. [Google Scholar]
- Hobbs, R.J.; Higgs, E.; Hall, C.M. Novel Ecosystems: Intervening in the New Ecological World Order; John Wiley & Sons: Hoboken, NJ, USA, 2013; ISBN 9781118354209. [Google Scholar]
- Cardinale, B.J.; Duffy, J.E.; Gonzalez, A.; Hooper, D.U.; Perrings, C.; Venail, P.; Narwani, A.; Mace, G.M.; Tilman, D.; Wardle, D.A.; et al. Biodiversity Loss and Its Impact on Humanity. Nature 2012, 486, 59–67. [Google Scholar] [CrossRef] [PubMed]
- McCain, K.N.S.; Baer, S.G.; Blair, J.M.; Wilson, G.W.T. Dominant Grasses Suppress Local Diversity in Restored Tallgrass Prairie. Restor. Ecol. 2010, 18, 40–49. [Google Scholar] [CrossRef]
- Dickson, T.L.; Busby, W.H. Forb Species Establishment Increases with Decreased Grass Seeding Density and with Increased Forb Seeding Density in a Northeast Kansas, USA, Experimental Prairie Restoration. Restor. Ecol. 2009, 17, 597–605. [Google Scholar] [CrossRef]
- Sexton, A.N.; Emery, S.M. Grassland Restorations Improve Pollinator Communities: A Meta-Analysis. J. Insect Conserv. 2020, 24, 719–726. [Google Scholar] [CrossRef]
- Kennedy, P.L.; DeBano, S.J.; Bartuszevige, A.M.; Lueders, A.S. Effects of Native and Non-Native Grassland Plant Communities on Breeding Passerine Birds: Implications for Restoration of Northwest Bunchgrass Prairie. Restor. Ecol. 2009, 17, 515–525. [Google Scholar] [CrossRef]
- Yang, Y.; Tilman, D.; Furey, G.; Lehman, C. Soil Carbon Sequestration Accelerated by Restoration of Grassland Biodiversity. Nat. Commun. 2019, 10, 718. [Google Scholar] [CrossRef] [Green Version]
- Scott, D.A.; Rosenzweig, S.T.; Baer, S.G.; Blair, J.M. Changes in Potential Nitrous Oxide Efflux during Grassland Restoration. J. Environ. Qual. 2019, 48, 1913–1917. [Google Scholar] [CrossRef]
- Jastrow, J.D. Soil Aggregate Formation and the Accrual of Particulate and Mineral-Associated Organic Matter. Soil Biol. Biochem. 1996, 28, 665–676. [Google Scholar] [CrossRef]
- Scott, D.A.; Bach, E.M.; Du Preez, C.C.; Six, J.; Baer, S.G. Mechanisms Influencing Physically Sequestered Soil Carbon in Temperate Restored Grasslands in South Africa and North America. Biogeochemistry 2021, 156, 131–143. [Google Scholar] [CrossRef]
- Bandick, A.K.; Dick, R.P. Field Management Effects on Soil Enzyme Activities. Soil Biol. Biochem. 1999, 31, 1471–1479. [Google Scholar] [CrossRef]
- Ndiaye, E.L.; Sandeno, J.M.; McGrath, D.; Dick, R.P. Integrative Biological Indicators for Detecting Change in Soil Quality. Am. J. Altern. Agric. 2000, 15, 26–36. [Google Scholar] [CrossRef]
- Hinojosa, M.B.; Carreira, J.A.; García-Ruíz, R.; Dick, R.P. Soil Moisture Pre-Treatment Effects on Enzyme Activities as Indicators of Heavy Metal-Contaminated and Reclaimed Soils. Soil Biol. Biochem. 2004, 36, 1559–1568. [Google Scholar] [CrossRef]
- Acosta-Martínez, V.; Pérez-Guzmán, L.; Johnson, J.M.F. Simultaneous Determination of β-Glucosidase, β-Glucosaminidase, Acid Phosphomonoesterase, and Arylsulfatase Activities in a Soil Sample for a Biogeochemical Cycling Index. Appl. Soil Ecol. 2019, 142, 72–80. [Google Scholar] [CrossRef]
- Mganga, K.Z.; Musimba, N.K.R.; Nyariki, D.M.; Nyangito, M.M.; Mwang’ombe, A.W. The Choice of Grass Species to Combat Desertification in Semi-Arid Kenyan Rangelands Is Greatly Influenced by Their Forage Value for Livestock. Grass Forage Sci. 2015, 70, 161–167. [Google Scholar] [CrossRef]
- Chaudhuri, S.; McDonald, L.M.; Skousen, J.; Pena-Yewtukhiw, E.M. Soil Organic Carbon Molecular Properties: Effects of Time Since Reclamation in a Minesoil Chronosequence. Land Degrad. Develop. 2015, 26, 237–248. [Google Scholar] [CrossRef]
- Conant, R.T.; Paustian, K.; Elliott, E.T. Grassland Management and Conversion into Grassland: Effects on Soil Carbon. Ecol. Appl. 2001, 11, 343–355. [Google Scholar] [CrossRef]
- de Almeida, R.F.; Naves, E.R.; da Mota, R.P. Soil Quality: Enzymatic Activity of Soil β-Glucosidase. Glob. J. Agric. Res. Rev. 2015, 3, 146–150. [Google Scholar]
Figure 1.
Map of site locations.
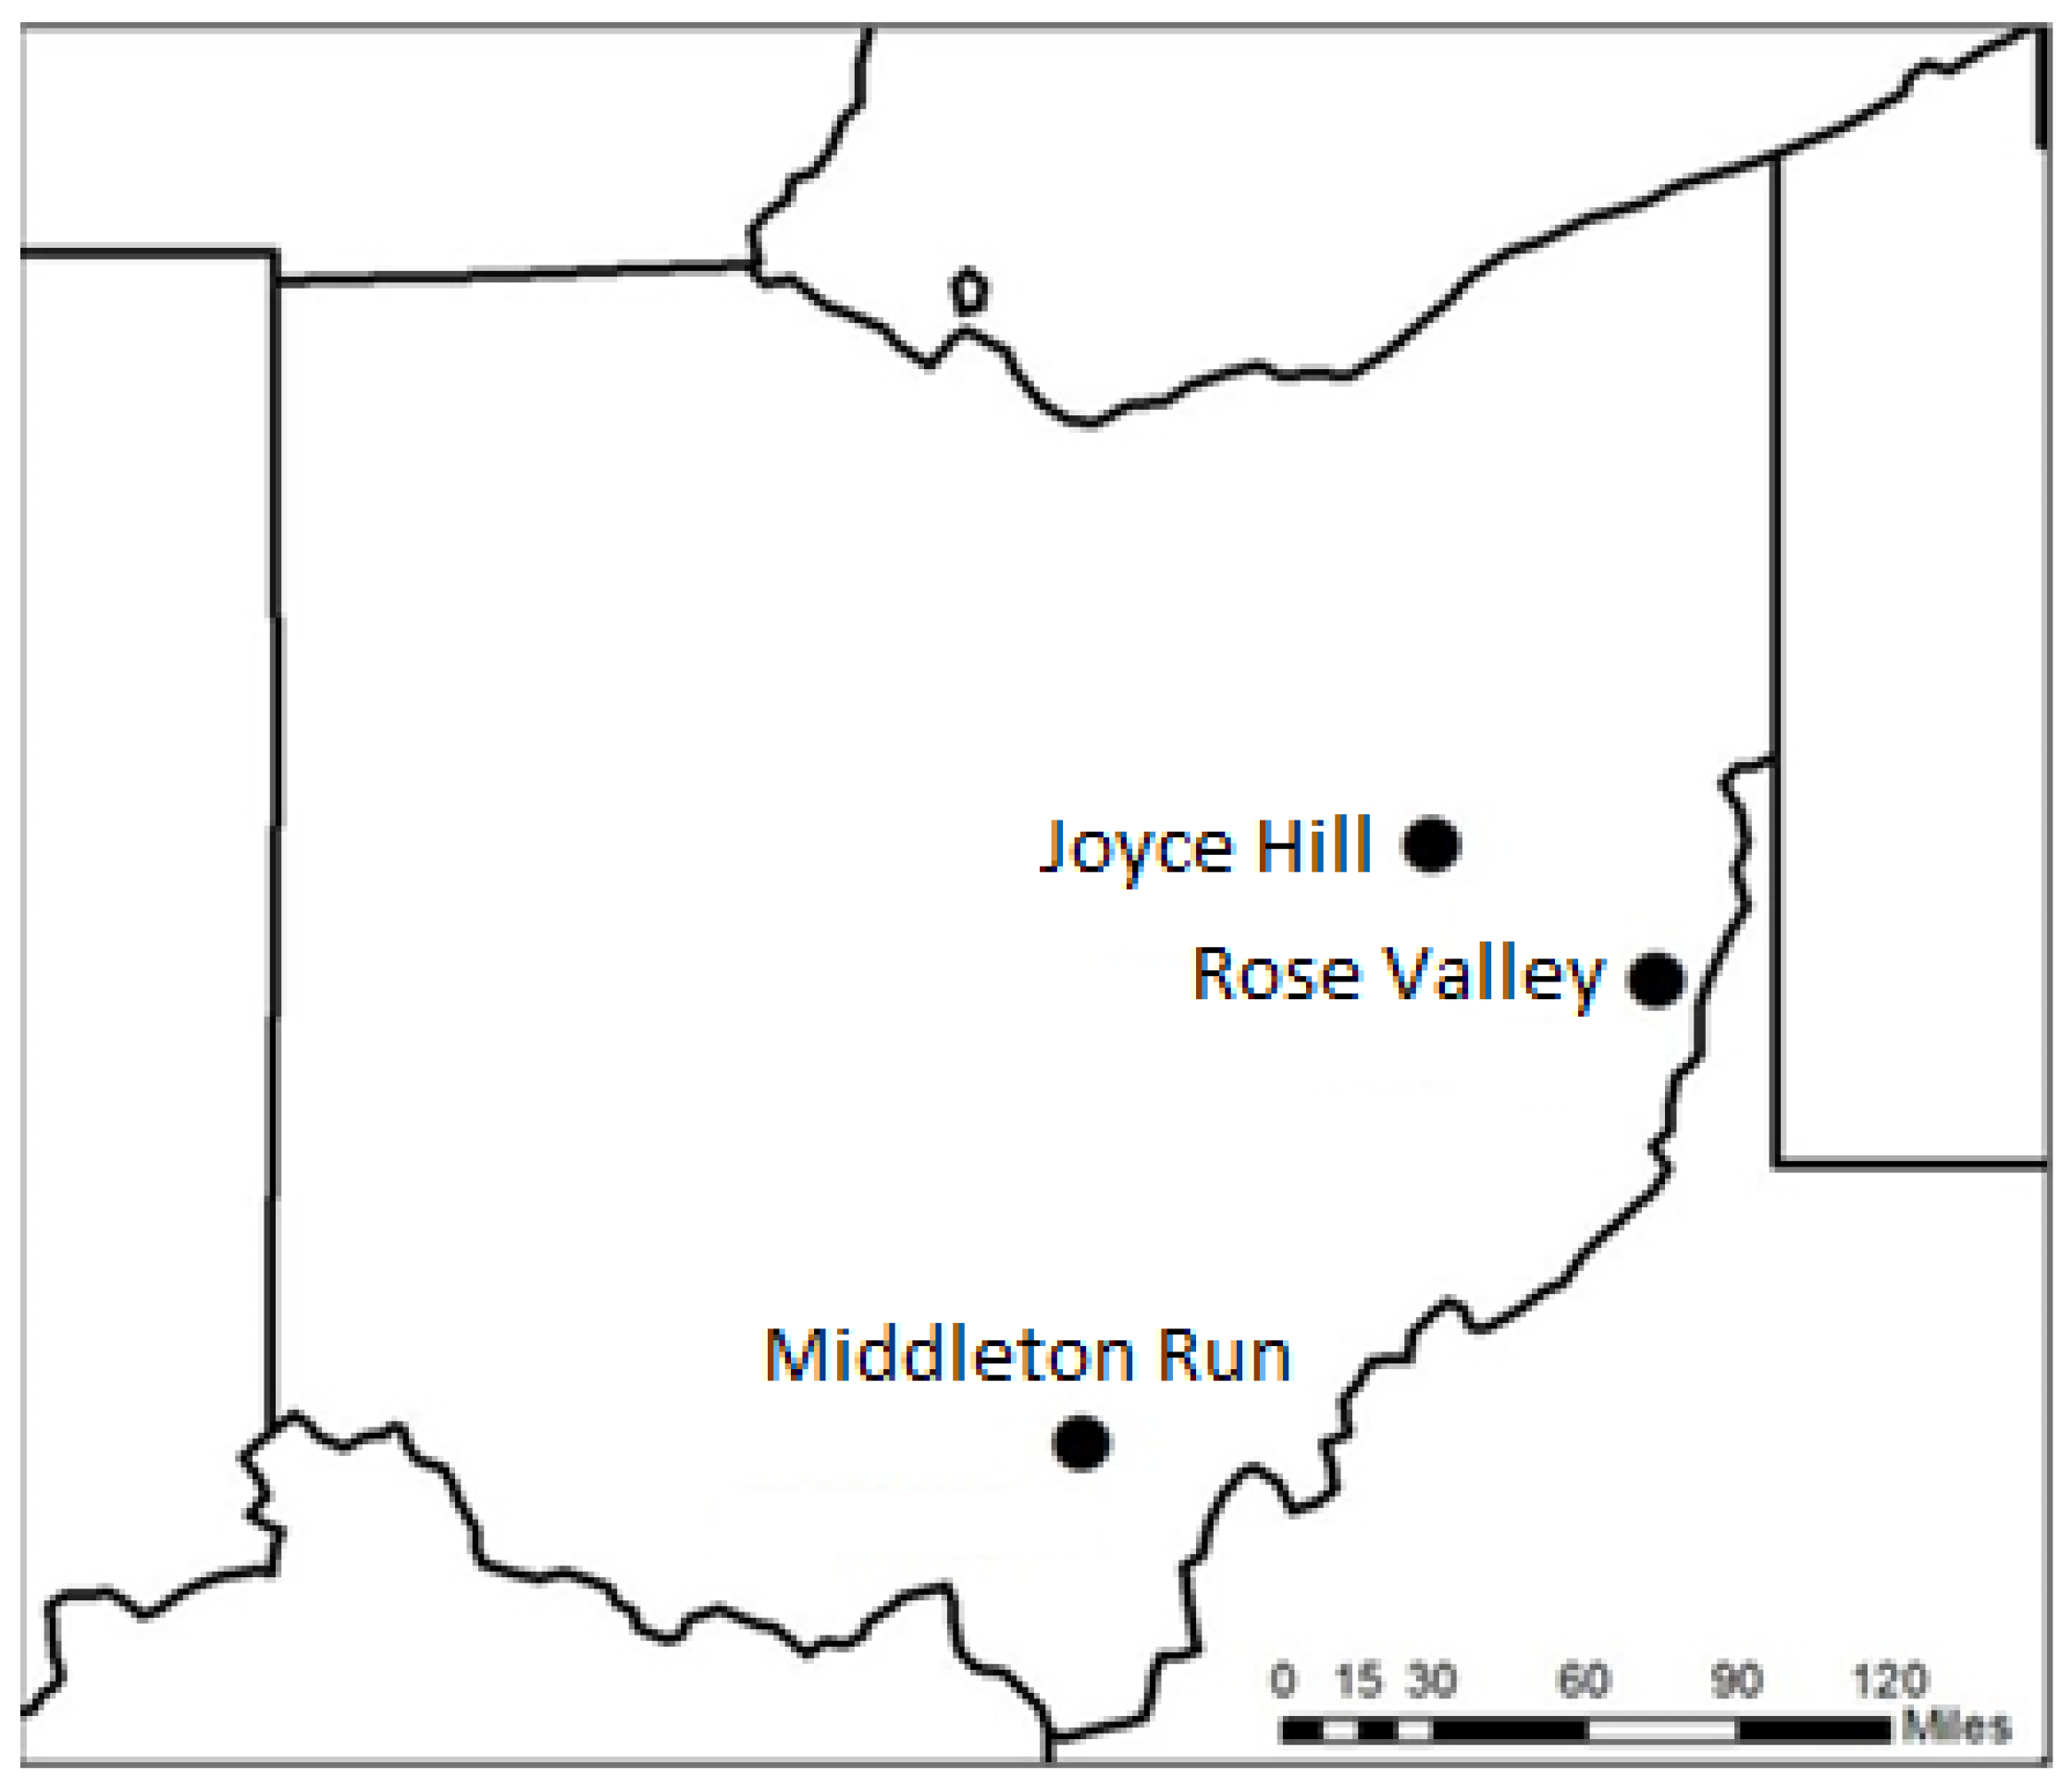
Figure 2.
Shannon–Wiener diversity index over growing seasons for three seed mix treatments. Plot based on results from a term of a generalized additive model. Dotted lines represent two standard errors. Treatments within a single site are displayed within a single row. Adjusted R2 values for seed treatment by growing season smooths are displayed in the first panel of each row.

Figure 3.
Species richness over growing seasons for three seed mix treatments. Plot based on results from a term of a generalized additive model. Dotted lines represent two standard errors. Treatments within a single site are displayed within a single row. Adjusted R2 values for seed treatment by growing season smooths are displayed in the first panel of each row.
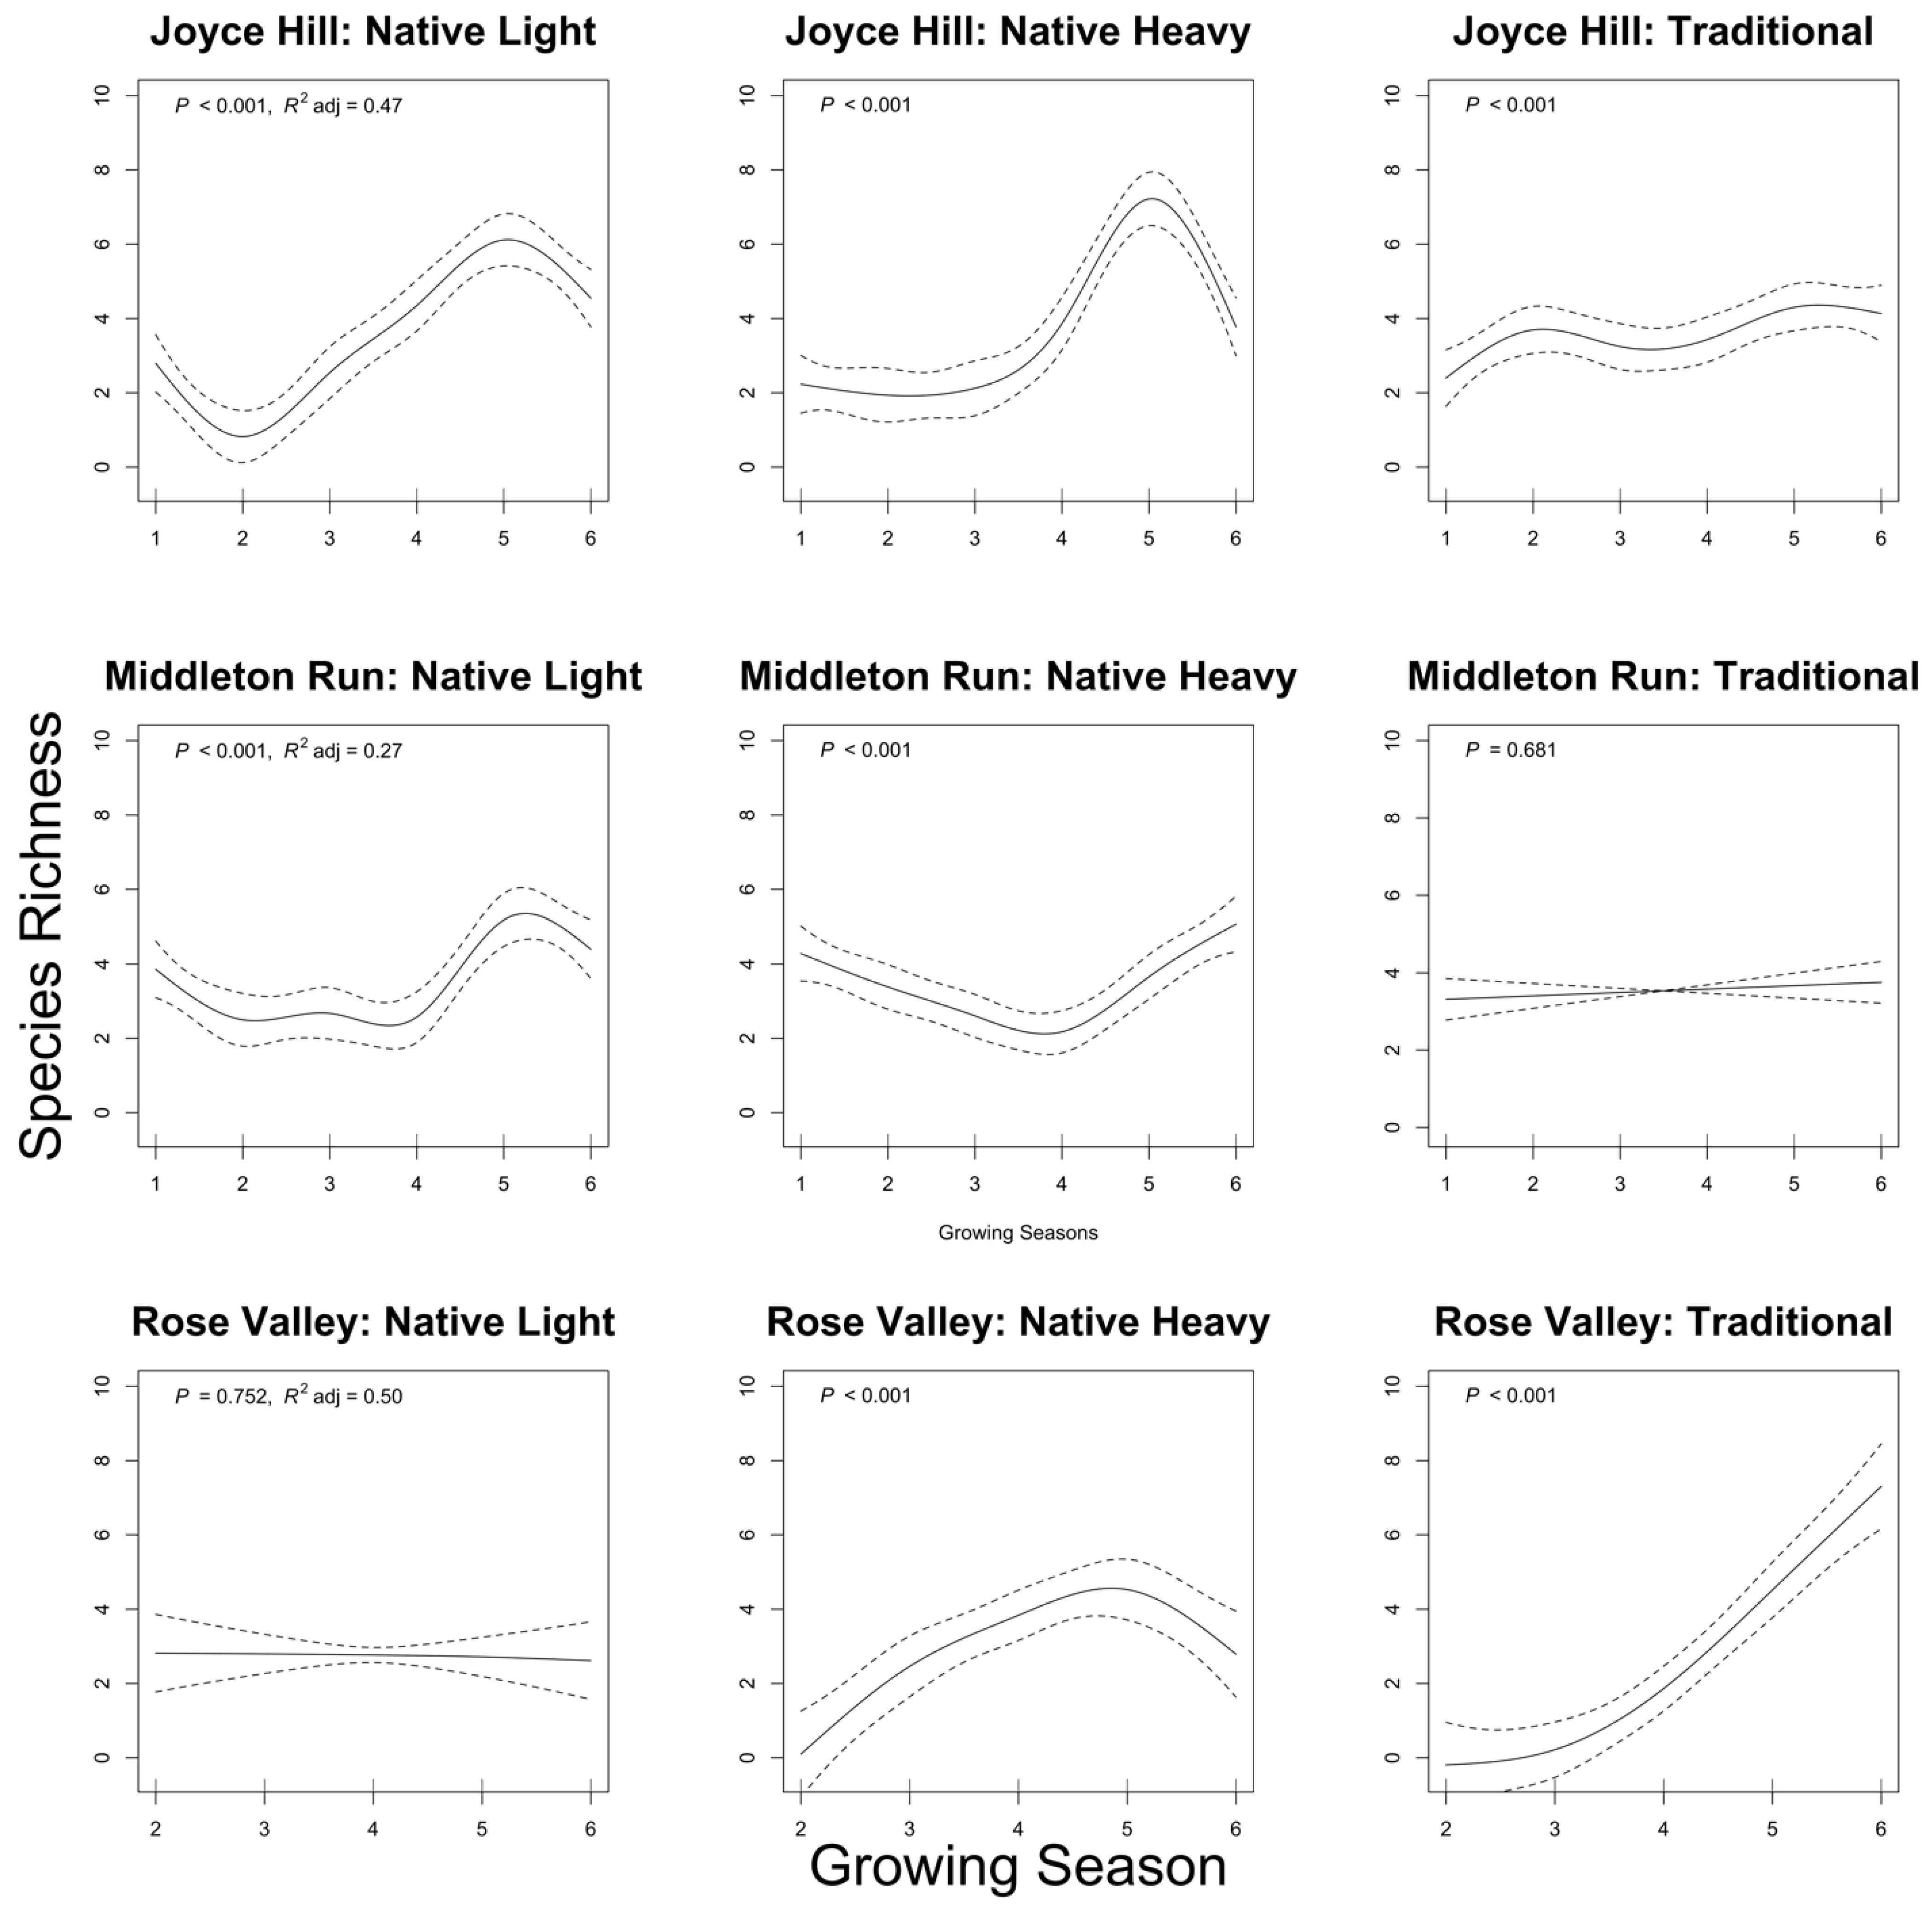
Figure 4.
Standard error ellipses from weighted average of metric dimensional scaling (MDS; also known as principal coordinates analysis [PCoA]) scores of seed treatment by growing season groups at each site, (A) Joyce Hill, (B) Middleton Run, (C) Rose Valley. Arrows represent movement in ordination space of seed treatments from growing season to growing season.
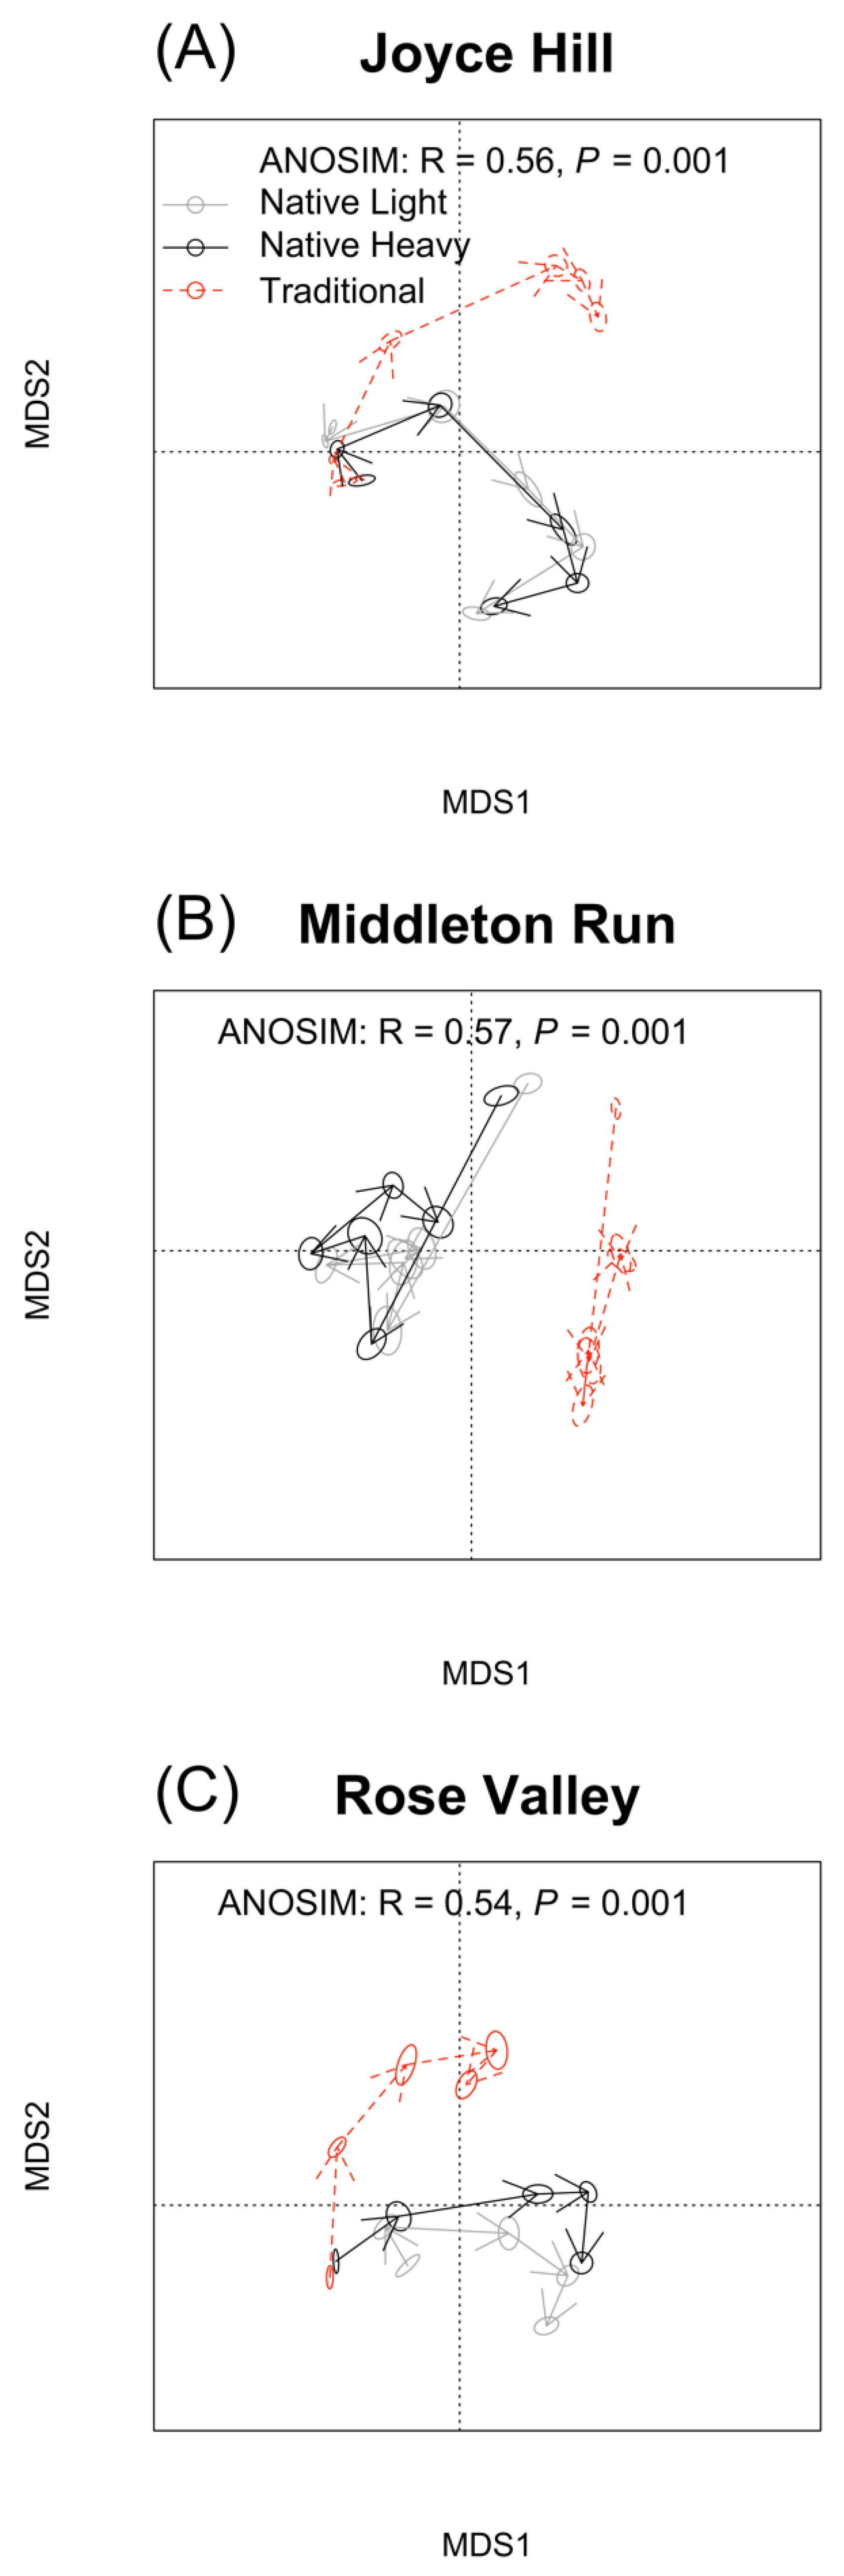
Figure 5.
Total phospholipid fatty acid methyl-ester (FAME) content (nmol g−1; A–C) and arbuscular mycorrhizal fungi content (nmol g−1; D–F) at Joyce Hill, Middleton Run, and Rose Valley. Values are estimated marginal means with one standard error. Seed mix treatments with the same capital letter or growing seasons with the same lower-case letter are not significantly different. Arbuscular mycorrhizal fungi responded to an interaction between growing season and seed mix treatment at Joyce Hill (D) and Rose Valley (F).

Figure 6.
Beta-Glucosidase activities at Middleton Run, Joyce Hill, and Rose Valley.
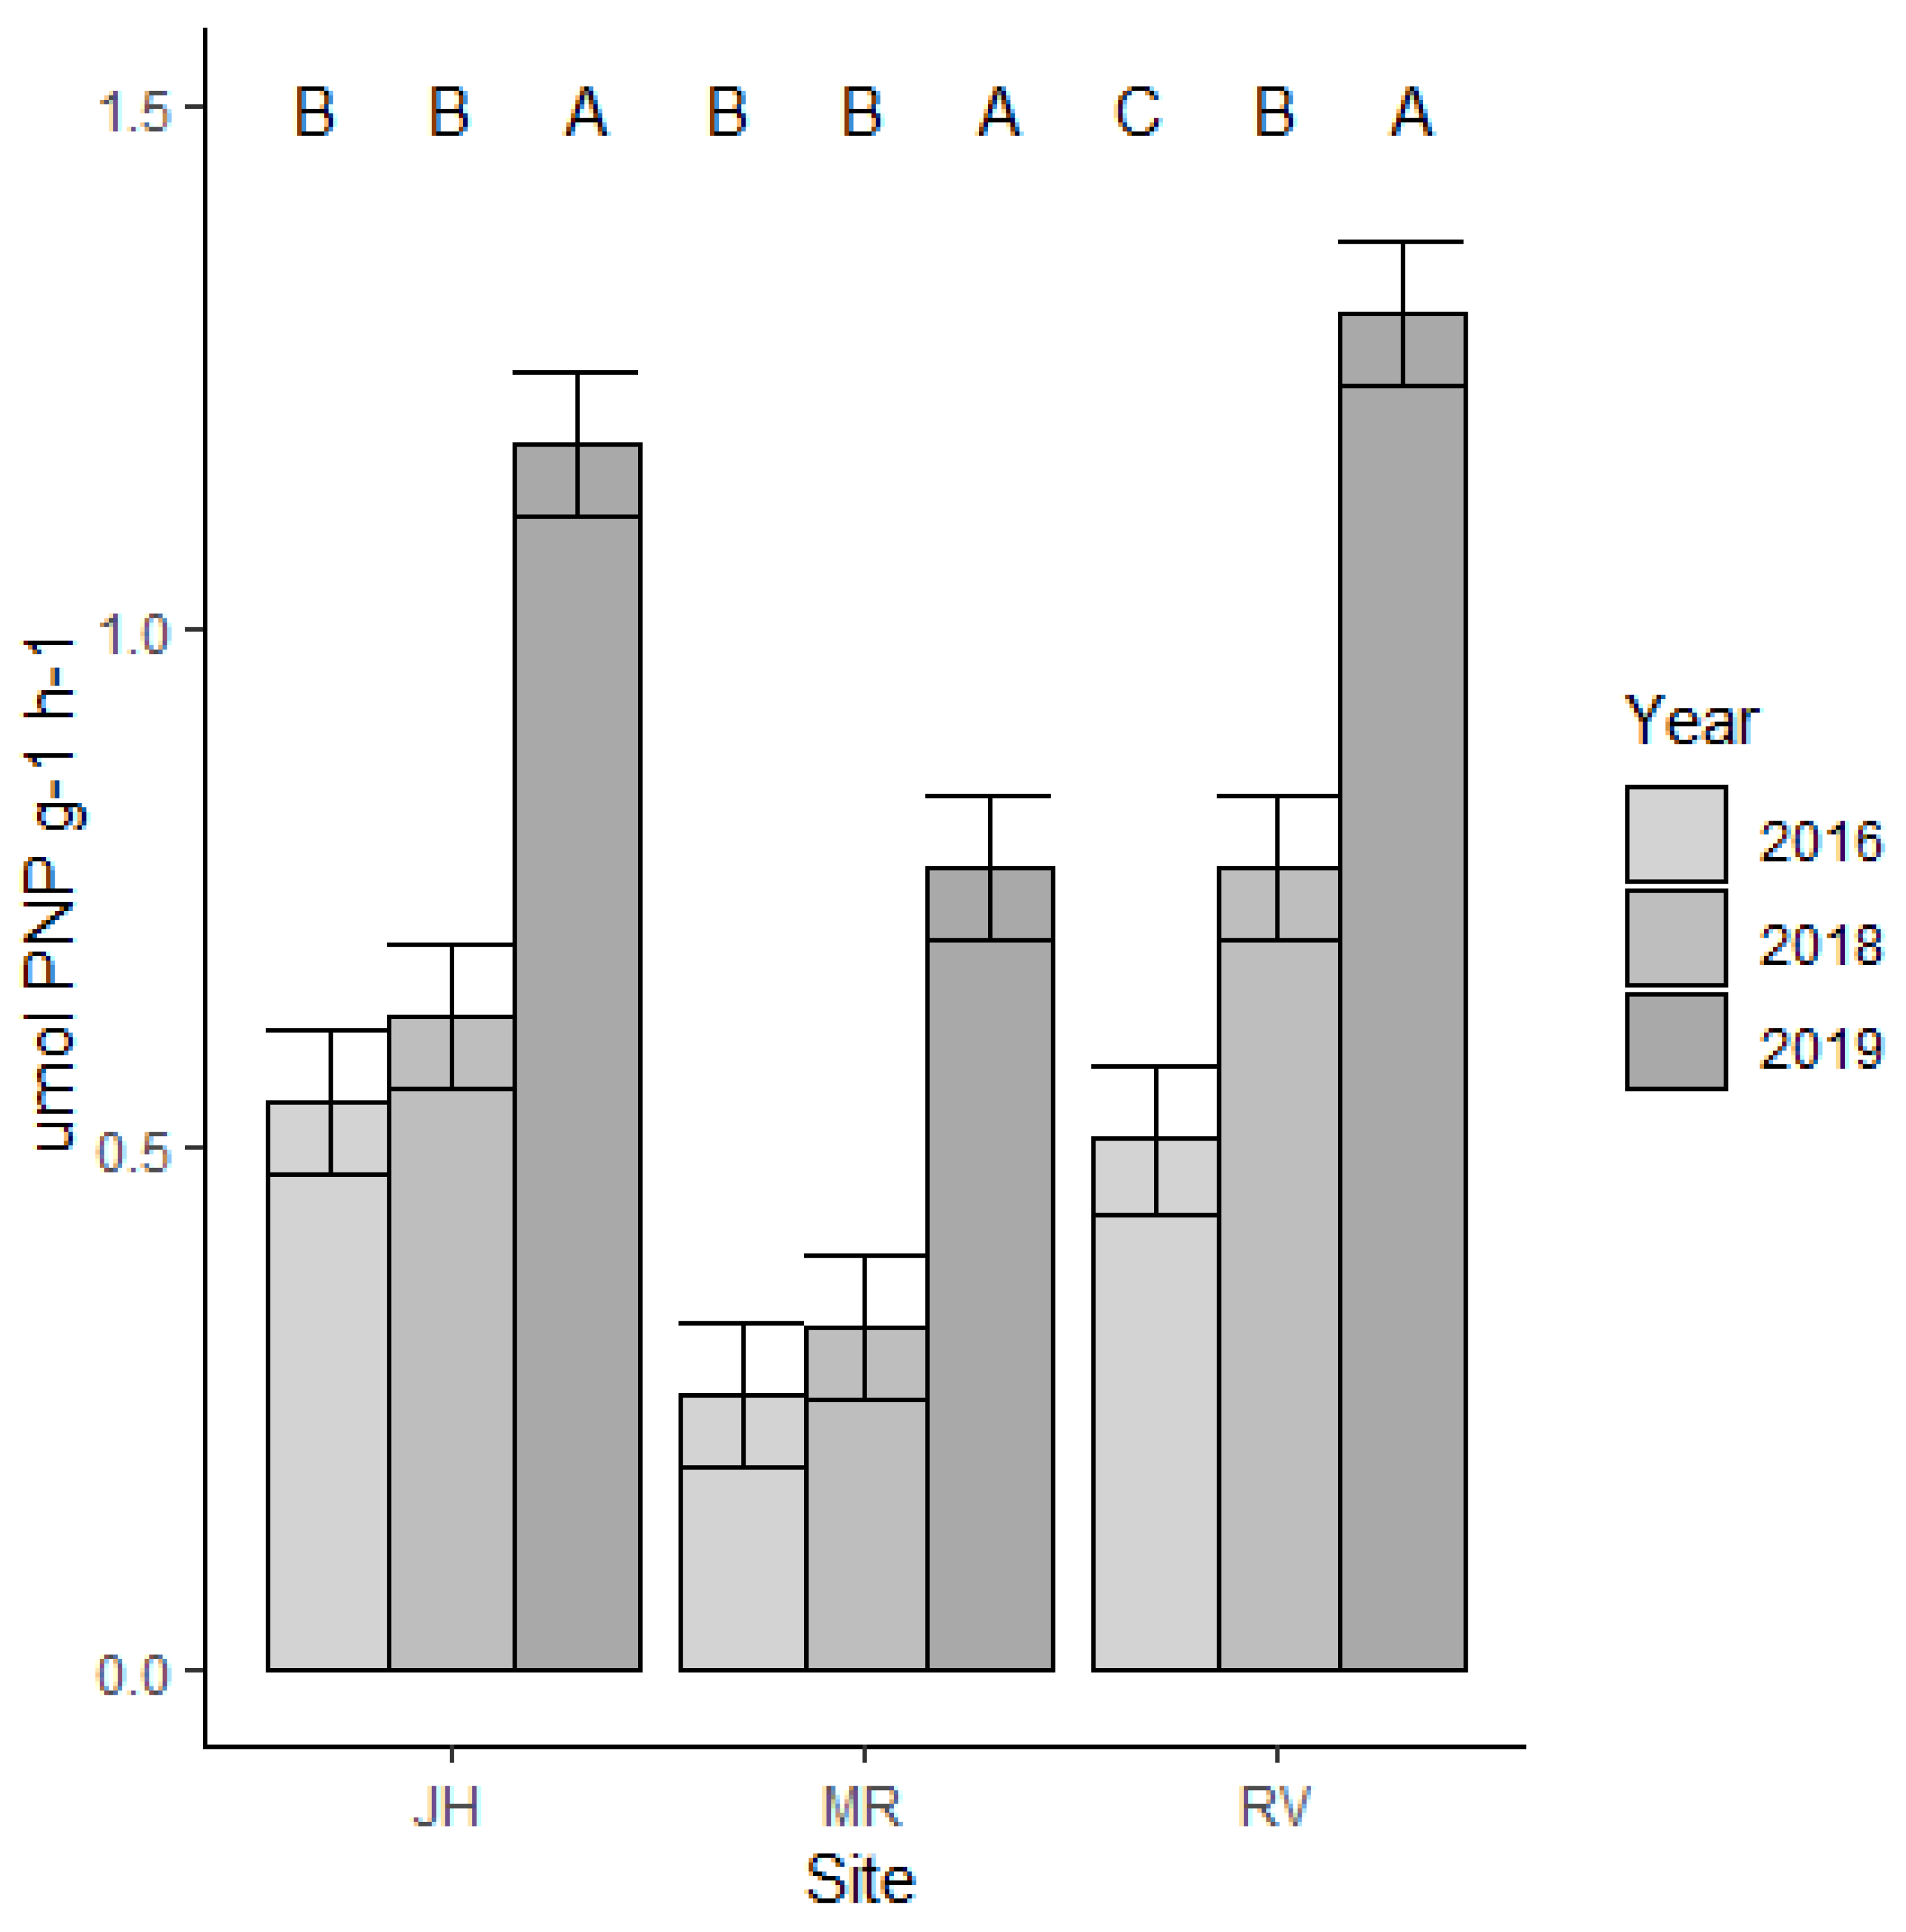
Figure 7.
Pearson correlation matrix of plant diversity metrics (collected 2020), soil chemistry (collected 2020), beta-glucosidase enzyme activity (collected 2019), and FAME microbial biomarkers (collected 2019). Abbreviations: H = plant Shannon–Wiener diversity index, S = plant species richness, J = plant species evenness, GLU = beta-glucosidase enzyme activity, pH = 1:1 soil pH, P = soil phosphorus concentration, K = soil potassium concentration, Mg = soil magnesium concentration, Ca = soil calcium concentration, and CEC = soil cation exchange capacity.


Table 1.
Site location, treatments, and soil texture, 0–15 cm.
| Site | Treatment | Sand (%) | Silt (%) | Clay (%) |
|---|---|---|---|---|
| Joyce Hill 40.442189, −81.500585 | Heavy | 25 | 42 | 33 |
| Light | 21 | 46 | 33 | |
| Traditional | 24 | 44 | 32 | |
| Middleton Run 39.083297, −82.496459 | Heavy | 26 | 32 | 42 |
| Light | 21 | 35 | 44 | |
| Traditional | 47 | 21 | 32 | |
| Rose Valley 40.138537, −80.860425 | Heavy | 25 | 26 | 49 |
| Light | 21 | 27 | 53 | |
| Traditional | 21 | 26 | 53 |
Table 2.
Soil organic matter (OM) by site and growing season (GS). Values are estimated marginal means with one standard error in parentheses. Šidák-adjusted comparisons were made among estimated marginal means. Growing seasons followed by the same upper-case letter are not significantly different at p < 0.05. Pairs of values of the seed mix treatment within a site followed by the same lower-case letter are not significantly different at p < 0.05.
| Site/Growing season | OM GS2 (2016) | OM GS6 (2020) |
|---|---|---|
| (%) | (%) | |
| Joyce Hill B | 1.64 (0.24) b | 3.13 (0.24) a |
| Middleton Run A | 2.06 (0.24) b | 5.01 (0.24) a |
| Rose Valley A | 2.48 (0.24) b | 4.63 (0.24) a |
Table 3.
Soil pH values by site and growing season (GS) interaction and by site and seed mix treatment interaction. Values are estimated marginal means with one standard error in parentheses. Šidák-adjusted comparisons were made among estimated marginal means. Growing seasons followed by the same upper-case letter are not significantly different at p < 0.05. Pairs of values of the seed mix treatment within a site followed by the same lower-case letter are not significantly different at p < 0.05.
| Site/Growing Season or Seed Mix | GS2 (2016) | GS 6 (2020) | Native Light | Native Heavy | Traditional |
|---|---|---|---|---|---|
| Joyce Hill B | 6.73 (0.09) A | 6.79 (0.09) A | 5.75 (0.11) b | 7.13 (0.11) a | 7.40 (0.11) a |
| Middleton Run C | 5.81 (0.09) A | 4.71 (0.09) B | 4.97 (0.11) b | 5.27 (0.11) ab | 5.55 (0.11) a |
| Rose Valley A | 7.49 (0.09) A | 7.91 (0.09) B | 7.73 (0.12) a | 7.68 (0.12) a | 7.68 (0.12) a |
Table 4.
Cation exchange capacity (CEC; cmolc kg−1) by site and seed mix treatment. Values are estimated marginal means with one standard error in parentheses. Šidák-adjusted comparisons were made among estimated marginal means. Growing seasons followed by the same upper-case letter are not significantly different at p < 0.05. Pairs of values of the seed mix treatment within a site followed by the same lower-case letter are not significantly different at p < 0.05.
| Site/Seed Mix | Native Light | Native Heavy | Traditional |
|---|---|---|---|
| Joyce Hill B | 12.37 (0.67) a | 11.98 (0.67) a | 12.28 (0.67) a |
| Middleton Run B | 16.93 (0.67) a | 12.33 (0.67) b | 9.73 (0.67) c |
| Rose Valley A | 19.97 (0.65) a | 20.40 (0.65) a | 20.90 (0.65) a |
Publisher’s Note: MDPI stays neutral with regard to jurisdictional claims in published maps and institutional affiliations. |
© 2021 by the authors. Licensee MDPI, Basel, Switzerland. This article is an open access article distributed under the terms and conditions of the Creative Commons Attribution (CC BY) license (https://creativecommons.org/licenses/by/4.0/).
Share and Cite
MDPI and ACS Style
Scott, D.A.; Eckhoff, K.D.; Lorenz, N.; Dick, R.; Swab, R.M. Diversity Is Not Everything. Land 2021, 10, 1091. https://doi.org/10.3390/land10101091
AMA Style
Scott DA, Eckhoff KD, Lorenz N, Dick R, Swab RM. Diversity Is Not Everything. Land. 2021; 10(10):1091. https://doi.org/10.3390/land10101091
Chicago/Turabian StyleScott, Drew A., Kathryn D. Eckhoff, Nicola Lorenz, Richard Dick, and Rebecca M. Swab. 2021. "Diversity Is Not Everything" Land 10, no. 10: 1091. https://doi.org/10.3390/land10101091
Note that from the first issue of 2016, this journal uses article numbers instead of page numbers. See further details here.