
Farmland Changes and Their Ecological Impact in the Huangshui River Basin


1
Key Laboratory of Land Surface Pattern and Simulation, Institute of Geographic Sciences and Natural Resources Research, CAS, Beijing 100101, China
2
University of Chinese Academy of Sciences, Beijing 100049, China
*
Author to whom correspondence should be addressed.
Land 2021, 10(10), 1082; https://doi.org/10.3390/land10101082
Submission received: 14 September 2021
/
Revised: 10 October 2021
/
Accepted: 12 October 2021
/
Published: 14 October 2021
Abstract
:The Huangshui River Basin (HRB) is the main grain production and key implementation region of the “Grain for Green Program” (GGP) of Qinghai Province, and has experienced a quick urbanization during the last 20 years. Therefore, identifying the farmland change and its ecological effects is significant for farmland and ecological protection in the HRB. To this end, this study analyzed the farmland change between 2000 and 2018, based on 1 m spatial resolution farmland data visually interpreted from Google Earth high-resolution images, and then estimated its ecological impact based on the Normalized Difference Vegetation Index (NDVI) data of MODIS, using an ecological impact index of farmland change. The study found that: (1) The farmland area in the HRB decreased from 320.15 k ha in 2000 to 245.01 k ha in 2018, reduced by 23.47% or 1.48% per year, as mainly caused by ecological restoration and built-up land occupation; (2) from 2000 to 2018, the natural environment showed a greening trend in the HRB, with the mean NDVI increasing by 0.74% per year; (3) the farmland changes had a positive ecological effect, contributing 6.67% to the regional increase in the NDVI, but had a negative impact on grain production; (4) it is suggested to strengthen farmland protection by strictly controlling the urban land occupation and over-conversion of farmland in the HRB.
1. Introduction
Farmland is a significant support for ensuring regional food security and maintaining regional economic and social stability [1,2,3,4]. The Huangshui River Basin (HRB) is the dominant area of population, economy, and agricultural production in Qinghai Province [5,6]. The area of the basin only accounts for 1.9% of the total area of Qinghai Province, while it covers nearly 42% of the farmland and 49% of the population, and produces nearly 60% of the GDP. More than half of the land area (762 k ha) in the HRB was reported to be suffering from soil erosion due to sloping land reclamation and vegetation destruction [7]. Therefore, as a key area of ecological restoration in Qinghai Province, the HRB has implemented the “Grain for Green Program” (GGP) since 2000 [8,9]. Meanwhile, the regional economy, population, and urbanization have experienced a rapid growth, stimulating an increase in the non-agricultural construction occupation of farmland [10,11]. To this end, identifying the farmland changes and their ecological impact is conducive to understanding the status of regional farmland safety and ecological health.
At present, research on farmland changes mainly focuses on rapid economic development and major grain production areas [12,13,14,15,16,17,18,19], mostly based on statistical data and land use remote sensing data products, and very few studies have been conducted for the HRB region. The resolution of existing land use data products is low, ranging from 10 m to 8 km [20]. Among them, the 30 m land use data compiled using Landsat images, as released by the Resource and Environmental Science and Data Center of the Chinese Academy of Sciences [21], are the highest resolution long-term series data product available for the HRB. However, by high-resolution image interpretation and field verification, we found that the dataset involved large deviations and uncertainties. The main reason is that the HRB is located in the transition zone between the Tibetan Plateau and the Loess Plateau, where the landscape is fragmented, and thus the farmland cannot be accurately extracted from Landsat images. During the past three decades, China has finished three nationwide detailed land use surveys at the county level, but the spatial data have not been released to the public. Therefore, we obtained 1 m spatial resolution farmland data of the HRB in 2000 and 2018 by visual interpretation based on Google Earth high-resolution images. On this basis, this study first analyzed the farmland changes between 2000 to 2018 and its spatial variation in the HRB using geostatistical methods, then quantified its ecological impact by comparing the NDVI changes in the growing season during the study period, based on the 250 m resolution MODIS data, before finally discussing the implications and suggestions for farmland protection.
2. Materials and Methods
2.1. The Study Area
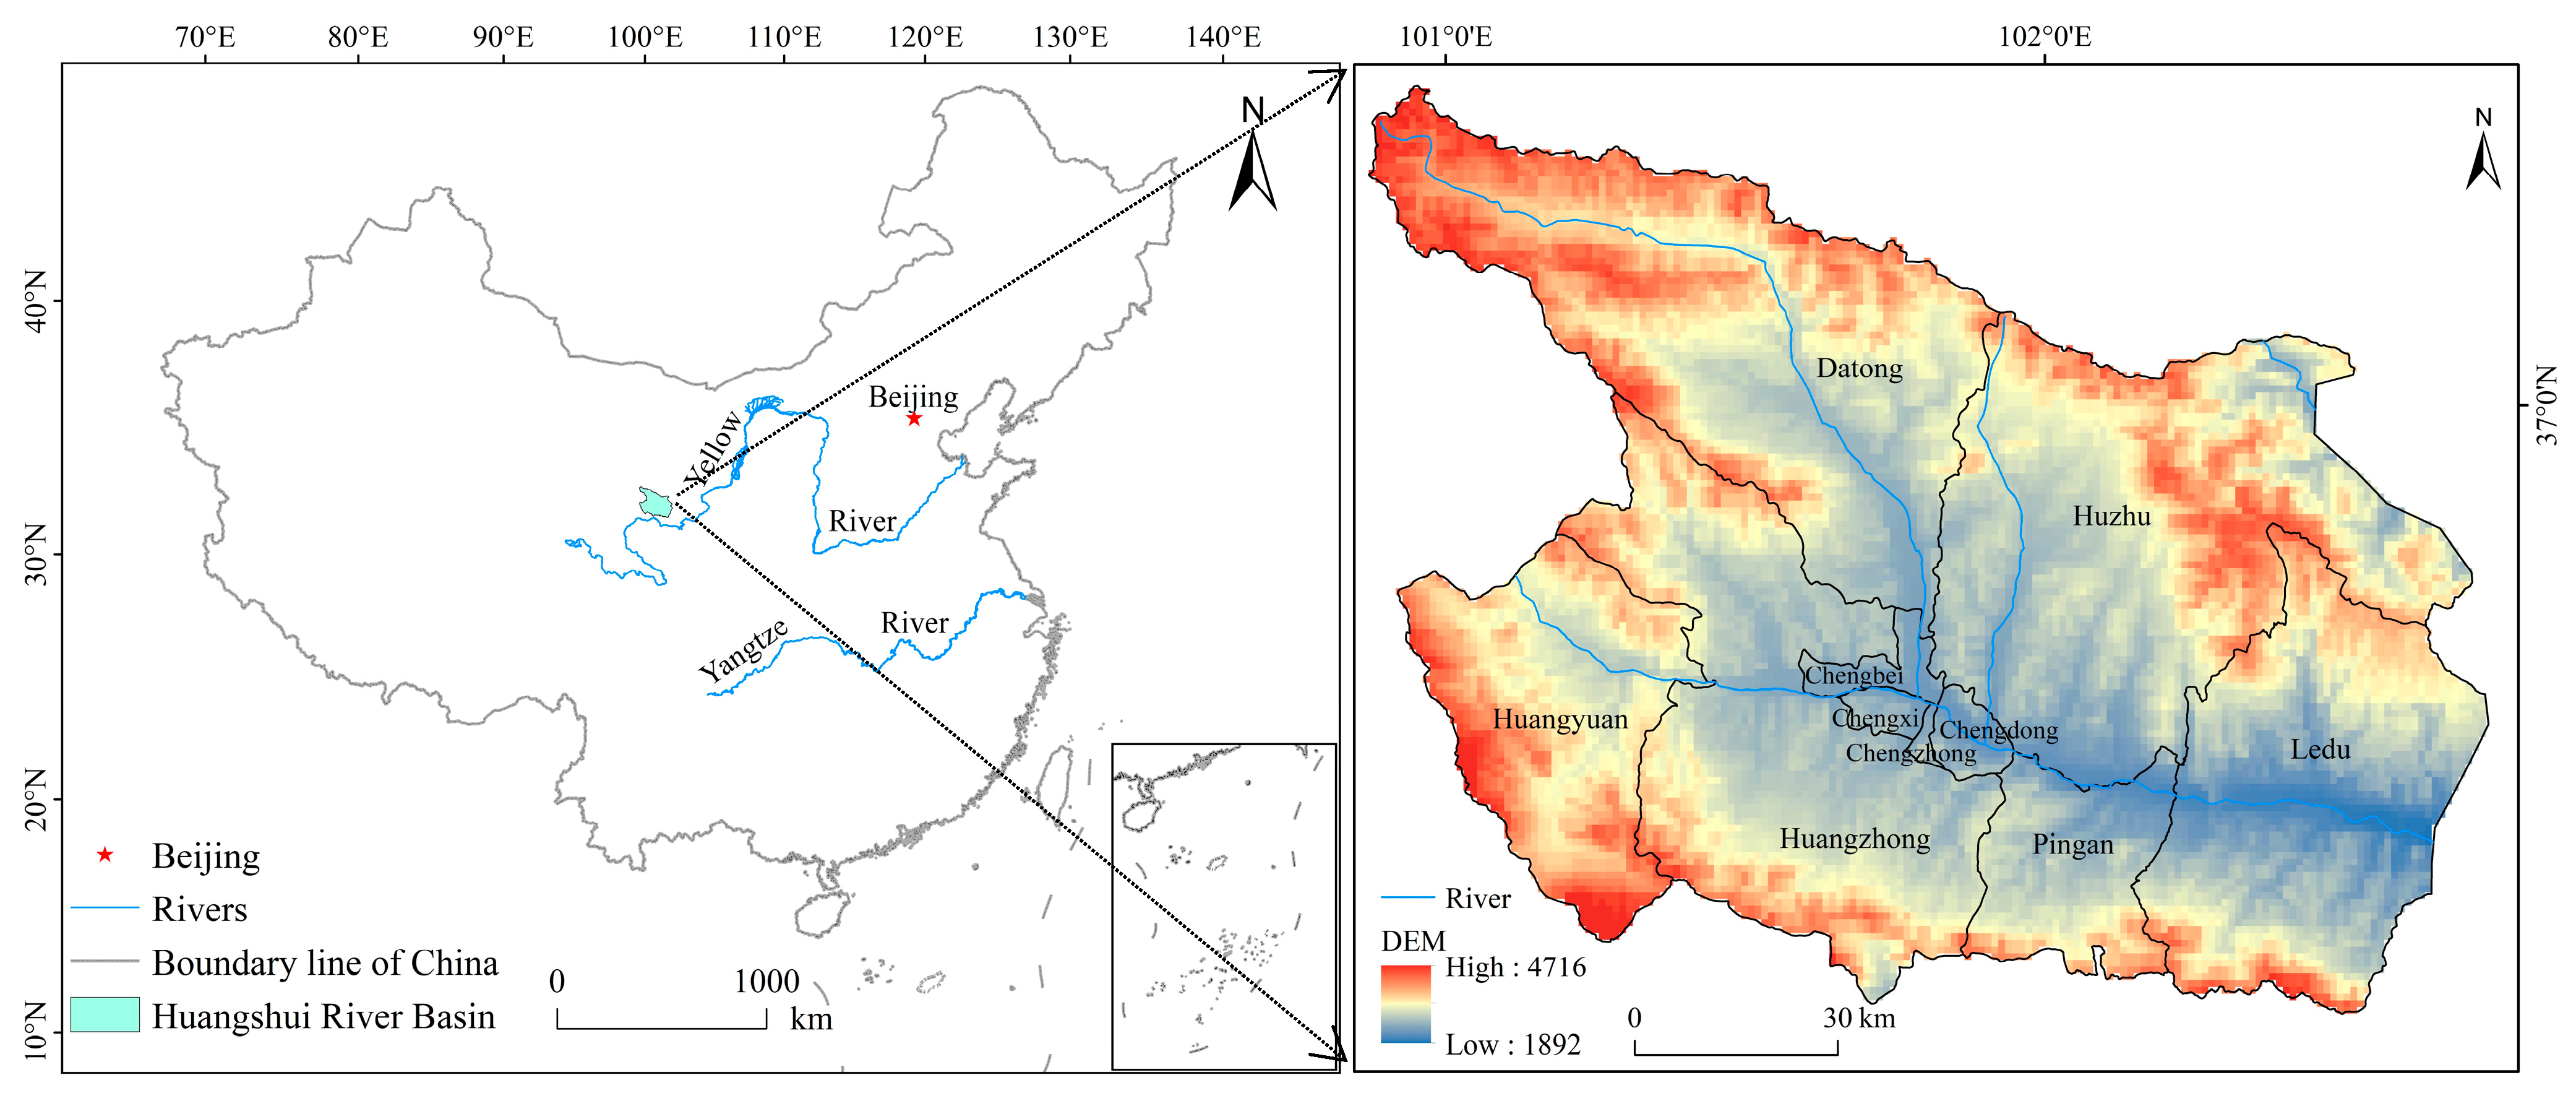
The Huangshui River is the largest first-level tributary of the upper reaches of the Yellow River. The study area (36°20′–37°47′ N, 100°86′–102°70′ E) is located in the upper-middle reaches of the Huangshui River and in the intersection zone of the northwestern Tibetan Plateau and western Loess Plateau [22,23], covering 10 counties under the two prefecture-level cities of Xining and Haidong, and has an area of 13,750 km2. The terrain is lower in the southeast, higher in the northwest, with an elevation between 2200 and 3000 m a.s.l. (Figure 1). The regional climate is monsoonal and semi-arid, showing obvious seasonal variations and high plateau characteristics [24]. The solar radiation is high, with an annual average sunshine duration of 2480–2920 h and a radiation intensity of 6135–6783 MJ/m2. Due to its high elevation, the air temperature is relatively low, with an annual average between 0.6 and 7.9 °C. The annual mean precipitation is 300–500 mm, mostly distributed in the rainy season from June to September [25,26,27]. The farmland area and grain output in the HRB in 2018 accounts for 43.93% of the total farmland area and 47.25% of the total grain output of Qinghai Province, respectively.
2.2. Data Sources
The data used in this study include: (1) A vector map of the HRB, extracted from the China administrative map of counties; (2) high-resolution (0.51–1.02 m) satellite images, derived from the Google Earth database; (3) daily meteorological data of 14 stations in and around the HRB from 2000 to 2018, obtained from the Resources and Environmental Science and Data Center of the Chinese Academy of Sciences (http://www.resdc.cn/ (accessed on 14 September 2021)); (4) NDVI data with a spatial resolution of 250 m and a temporal resolution of 16 days for the period from 2000 to 2018, extracted from the MODIS MOD13Q1 products (https://lpdaac.usgs.gov (accessed on 14 September 2021)) provided by the United State Geological survey, USGS; (5) county-level socioeconomic statistical data for 2000 to 2018, collected from the Yearbooks of Qinghai Province, the County Yearbook of China, and the Statistical Bulletin of National Economic and Social Development at County Level.
2.3. Research Method
2.3.1. Data Acquisition and Analysis of Farmland Changes
The farmland in the HRB in 2000 and 2018 were delineated by visual interpretation based on Google Earth high-resolution satellite images. Figure 2 presents the interpretation results of some example farmland parcels, showing that the farmland was clearly identified. Based on available image data, 89.79% of the farmland area in 2018 was interpreted from the images of July 2018 to December 2018, and 10.21% from the images of May 2010 to December 2016. In 2000, 74.81% of the farmland area was interpreted from the images of January 2000 to December 2000, and the remaining 25.19% was obtained from the images of January 2001 to December 2005. In addition, in order to identify the causes of farmland changes, farmland conversions were interpreted based on the satellite images from January 2018 to December 2018.
The interpreted data were saved as kml files, and then imported to ArcGIS 10.6 to calculate the farmland area in the HRB in 2000 and 2018. By overlaying the two farmland maps with ArcGIS, the farmland changes between 2000 and 2018 was obtained. Furthermore, we applied the compound interest formula in economics [28] to calculate the annual farmland change rate during 2000 to 2018, as below:
where is the annual farmland change rate during 2000 to 2018; and are the farmland areas in 2000 and 2018, respectively; and is the total years of the study period.
2.3.2. Calculation of the NDVI Change Rate
The NDVI change rate was used to evaluate the change in ecological status during 2000 to 2018. First, we calculated the mean NDVI value in the growing season for each pixel after preprocessing of the 250 m MODIS MOD13Q1 products by resampling, projection transformation, and vector clipping. The growing period was set from May to September for the HRB, which matched the significant vegetation growing period [29]. Second, the Sen+Mann-Kendall trend analysis method [30,31] was used to calculate the annual change rate of the mean NDVI for each pixel during 2000 to 2018. The calculation formulae are as follows:
where and are the mean values of the NDVI for each pixel in the -th and -th years, ; is the sign function; is the years of the study period; β is the change rate of the NDVI per year, where indicates that the NDVI is on the rise and on decline; and represents the significance level of the NDVI change.
2.3.3. Ecological Impact of Farmland Changes
In this study, we proposed an index to estimate the ecological impact of farmland changes, named the ecological impact index, based on the amplitude of NDVI change. This index is defined as the contribution of NDVI change induced by farmland changes to the regional mean NDVI change in the HRB. Farmland conversion in the HRB includes three types: (1) Ecological restoration (ER), i.e., the farmland was converted to forestland or grassland; (2) built-up land occupation (BO), i.e., the farmland was converted to built-up land; and (3) new farmland reclamation (FR), i.e., newly reclaimed farmland during the study period. For each 250 m × 250 m grid, we calculated the area proportion for each type of farmland conversion by converting the visually interpreted vector farmland data to 1 m × 1 m raster data using the aggregate tool of ArcGIS 10.6.
For ER, the contribution to the regional NDVI change was estimated with Equation (7):
where is the contribution percentage of ER to the regional mean NDVI change; is the mean NDVI change rate of the grids with farmland fully converted to forestland or grassland; is the mean change rate of the NDVI for the whole HRB; and are the total areas of ER and HRB, respectively; is the mean change rate of the NDVI for mature forests, roughly representing the influence of climate changes during 2000 to 2018. The value was assumed to equal to the mean NDVI change rate of 20 randomly selected mature forestland plots far away from urban areas that have not been disturbed by human activities. The gap between and was considered the contribution rate of ER.
For FR, a similar equation, Equation (8), was used to estimate the contribution, in which the contribution rate equals the difference between and ; is the mean change rate of the NDVI of the newly reclaimed farmland grids; is the mean change rate of the grids with farmland not changed, i.e., the NDVI change induced by improved field management during the study period; is the total contribution percentage of FR to the regional NDVI change; and is the total area of FR.
For BO, the contribution percentage to the regional mean NDVI change () was estimated with Equation (9):
where is the mean change rate of the NDVI of the grids with farmland fully occupied by non-agricultural construction and is the total area of BO.
The total contribution percentage of farmland changes to the regional mean NDVI change in the HRB () is the summation of that induced by the three farmland change types, as shown in Equation (10):
3. Results
3.1. Farmland Changes and Their Spatial Variation
The total farmland area in the HRB was 320.15 k ha in 2000 and 245.01 k ha in 2018, significantly reduced by 75.14 k ha or 23.47% between 2000 and 2018, averaging –1.48% per year. In the 10 counties, the farmland areas all showed a significant reduction from 2000 to 2018 (Table 1). Particularly in the counties surrounding the urban area of Xining, the farmland reduction was more significant; for example, the annual change rate in Chengxi and Chengbei was –10.01% and –5.07%, respectively, and in Chengdong, Ledu, and Chengzhong, it was between –3.05 and –3.97%. In the remaining five suburb counties, the farmland area decreased by 0.52%–1.51% per year.
From 2000 to 2018, 70.40% of the total farmland in 2000 was not changed, and 94.77 k ha (29.60%) was converted to forestland/grassland or built-up land. In addition, 19.62 k ha was newly reclaimed from grassland, which was largely distributed in rural areas far away from the urban area (Figure 3). Of the converted/reduced farmland, 75.09% (77.12 k ha) was converted to forestland/grassland, as promoted by the ecological restoration program, and 24.91% (23.61 k ha) was occupied by built-up land (Figure 4). For different counties, the reduced farmland in Chengbei, Chengdong, Chengxi, and Chengzhong was mainly occupied by built-up land, accounting for 77.46%, 87.55%, 71.95%, and 85.24% of the total reduced farmland in each district, respectively, while the reduced farmland in Datong, Huzhu, Huangyuan, Huangzhong, Ledu, and Pingan was mainly (more than 70%) occupied by ecologically restored forestland or grassland.
3.2. Impact of Farmland Changes on the Regional NDVI Value
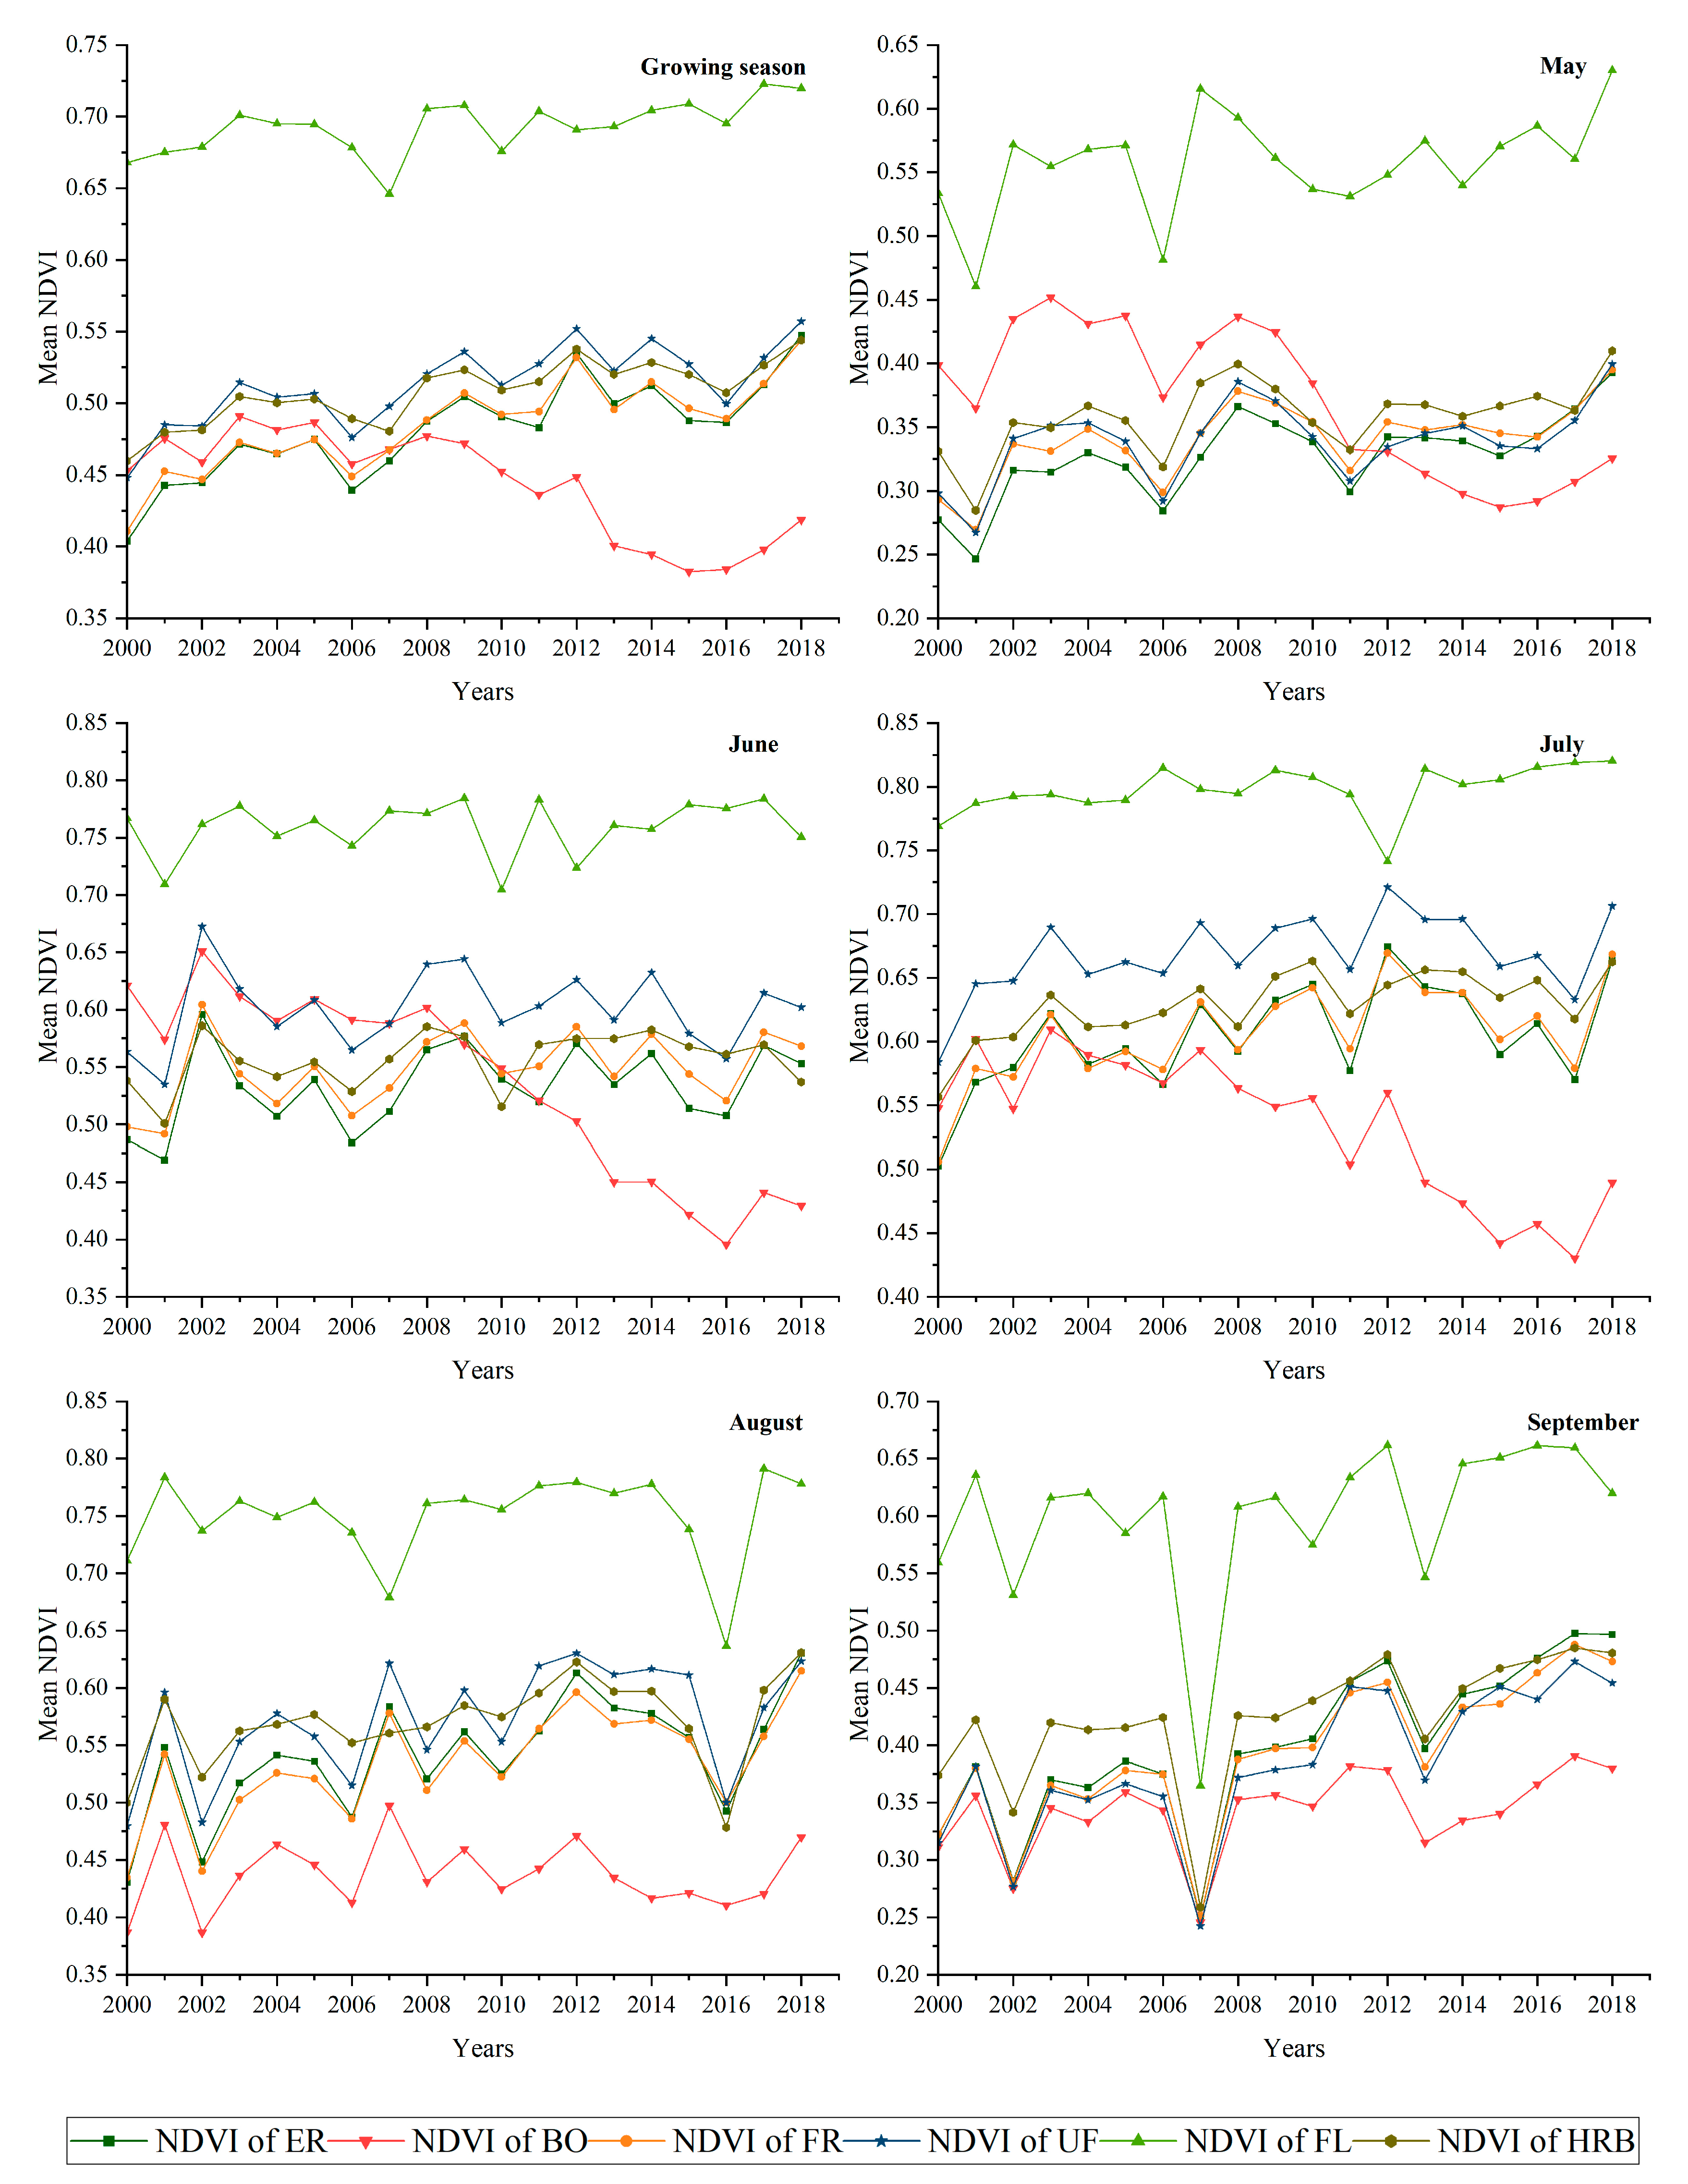
During 2000 to 2018, the annual and monthly NDVI in the growing season varied greatly over the years (Figure 5). The statistical analysis results (Table 2) indicate that the areas where the farmland was fully converted to built-up land (BO) and to forest/grassland (ER), and the newly reclaimed area (FR) displayed a much higher annual variation rate in the NDVI, for instance, the relative variation of the annual NDVI was 18.02%, 14.55%, and 13.40%, respectively; in contrast, it was only 3.90% for the sample forestland area (FL). For the unchanged farmland, the relative variation rate was 10.14%, close to the average of HRB. This implies that the annual fluctuation of the NDVI was more affected by human disturbance, particularly the farmland conversions, than the variation of climate factors. The monthly NDVI values showed a similar variation characteristic, but the variation range was much lower in July and August than May and September, because rainfall in the first two months was much higher and stable than the latter two months.
Figure 5 shows that the NDVI generally experienced an increasing trend except for BO area during 2000 to 2018. The trend analysis results revealed that the regional mean NDVI in the growing season increased, on average, by 0.74% per year in the HRB, indicating that the ecological condition improved significantly. For the areas where farmland changes occurred between 2000 and 2018, the NDVI changes showed much different rates (Figure 6). For ER areas, the NDVI change rate increased apparently with the increasing proportion of farmland conversion (Figure 6a) and reached 1.57% per year when the farmland was fully converted, 4.36 and 2.12 times the increase rate of the sample forestland plots and the whole HRB, respectively, indicating that the ecological restoration had a significant positive effect on the greenness. For BO areas, the NDVI significantly decreased, and the downward amplitude increased with the increasing proportion of the farmland occupation (Figure 6b), reaching −2.56% per year when the farmland was fully occupied. For FR areas, the NDVI showed a significant increasing trend (Figure 6c), increasing by 2.01%, on average, per year in the pixels in which the original grassland was fully reclaimed to farmland. This increase could be mainly attributed to the regular field management that promoted the vegetation growth, and thus increased the greenness. The NDVI in pixels where no farmland changes occurred also showed an increasing trend, mainly due to the improved field management, but the change rate decreased with the proportion of unchanged farmland increasing (Figure 6d). A previous study indicated that after conversion of farmland to forestland/grassland, the agricultural input increased on the unchanged farmland, and thus improved the crop growth status and grain yield [32]. The statistical data also showed that the mean grain yield in the HRB increased from 2.51 to 4.17 t/ha, i.e., increased by 66.29% from 2000 to 2018.
In total, the farmland changes from 2000 to 2018 contributed 6.67% to the increase in the regional NDVI in the HRB (Figure 7). In particular, the ecological restoration promoted by the GGP contributed 8.46%, while the built-up land occupation reduced the regional NDVI increase by 5.94%. The new farmland reclamation had a positive contribution, contributing 2.37% to the regional NDVI increase.
4. Discussion
4.1. Farmland Area Changes and Causes
Our interpreted farmland area in the HRB was 320.15 k ha in 2000, much higher than 262.99 k ha, as extracted from the 30 m resolution land use map released by the Resource and Environmental Science and Data Center of the Chinese Academy of Sciences (https://www.resdc.cn/ (accessed on 14 September 2021)); meanwhile, it was 245.01 k ha in 2018, lower than 258.41 k ha of the 30 m land use data. These deviations could be attributed to the influence of landscape. The landscape in the HRB is very fragmented, and thus the 30 m-resolution Landsat images could be too coarse to accurately identify small farmland parcels. Based on the officially published county-level data, as obtained from the National Third Detailed Land Use Survey, the farmland area in the HRB was 248.88 k ha in 2018, very close to our interpreted data.
The implementation of the GGP and the expansion of non-agricultural construction land were the main causes for the farmland changes in the HRB, consistent with previous studies in the eastern agricultural region of Qinghai Province [33]. Based on the literature data [34], only during 2011 to 2016, Qinghai Province invested 1.51 billion CNY for ecological building, converting 740.30 k ha of farmland into forestland and afforesting 193.30 k ha of wasteland. In the HRB, we found that 71.12 k ha of farmland was converted to forestland and grassland from 2000 to 2018, accounting for 75% of the total reduced farmland area, indicating the main role of ecological restoration in farmland reduction. The non-agricultural land expansion caused 25% of the total farmland loss in the HRB. This expansion was mainly caused by increased industry and urban land demand, as stimulated by the rapid economic development [16,18,35]. From 2000 to 2018, the GDP increased by 145.13 billion CNY, and local fiscal expenditure and total fixed asset investment increased by 47.37 and 91.98 times in the HRB, respectively. Meanwhile, the urbanization rate increased significantly from 34.18% in 2000 to 53.21% in 2018. These inevitably stimulated the expansion of built-up land areas, and thus caused the occupation of farmland, particularly in areas surrounding cities. This is the reason why more than 70% of the farmland loss in the suburb districts of Chengbei, Chengdong, Chengxi, and Chengzhong was attributed to urban land encroachment. In addition, during the past 20 years, rural disposable income per capita in the HRB was greatly increased by 7.87 times, and thus raised the land requirement for housing. Furthermore, the total population in the HRB increased from 252,0177 in 2000 to 289,0930 in 2018, and the proportion of urban/rural population increased/decreased from 34.18%/65.82% to 53.21%/46.79%, respectively (Figure 8). These could also be important factors driving the increase in land demand for housing and public infrastructure construction.
4.2. Causes of Greening Trend and Contribution of Farmland Changes
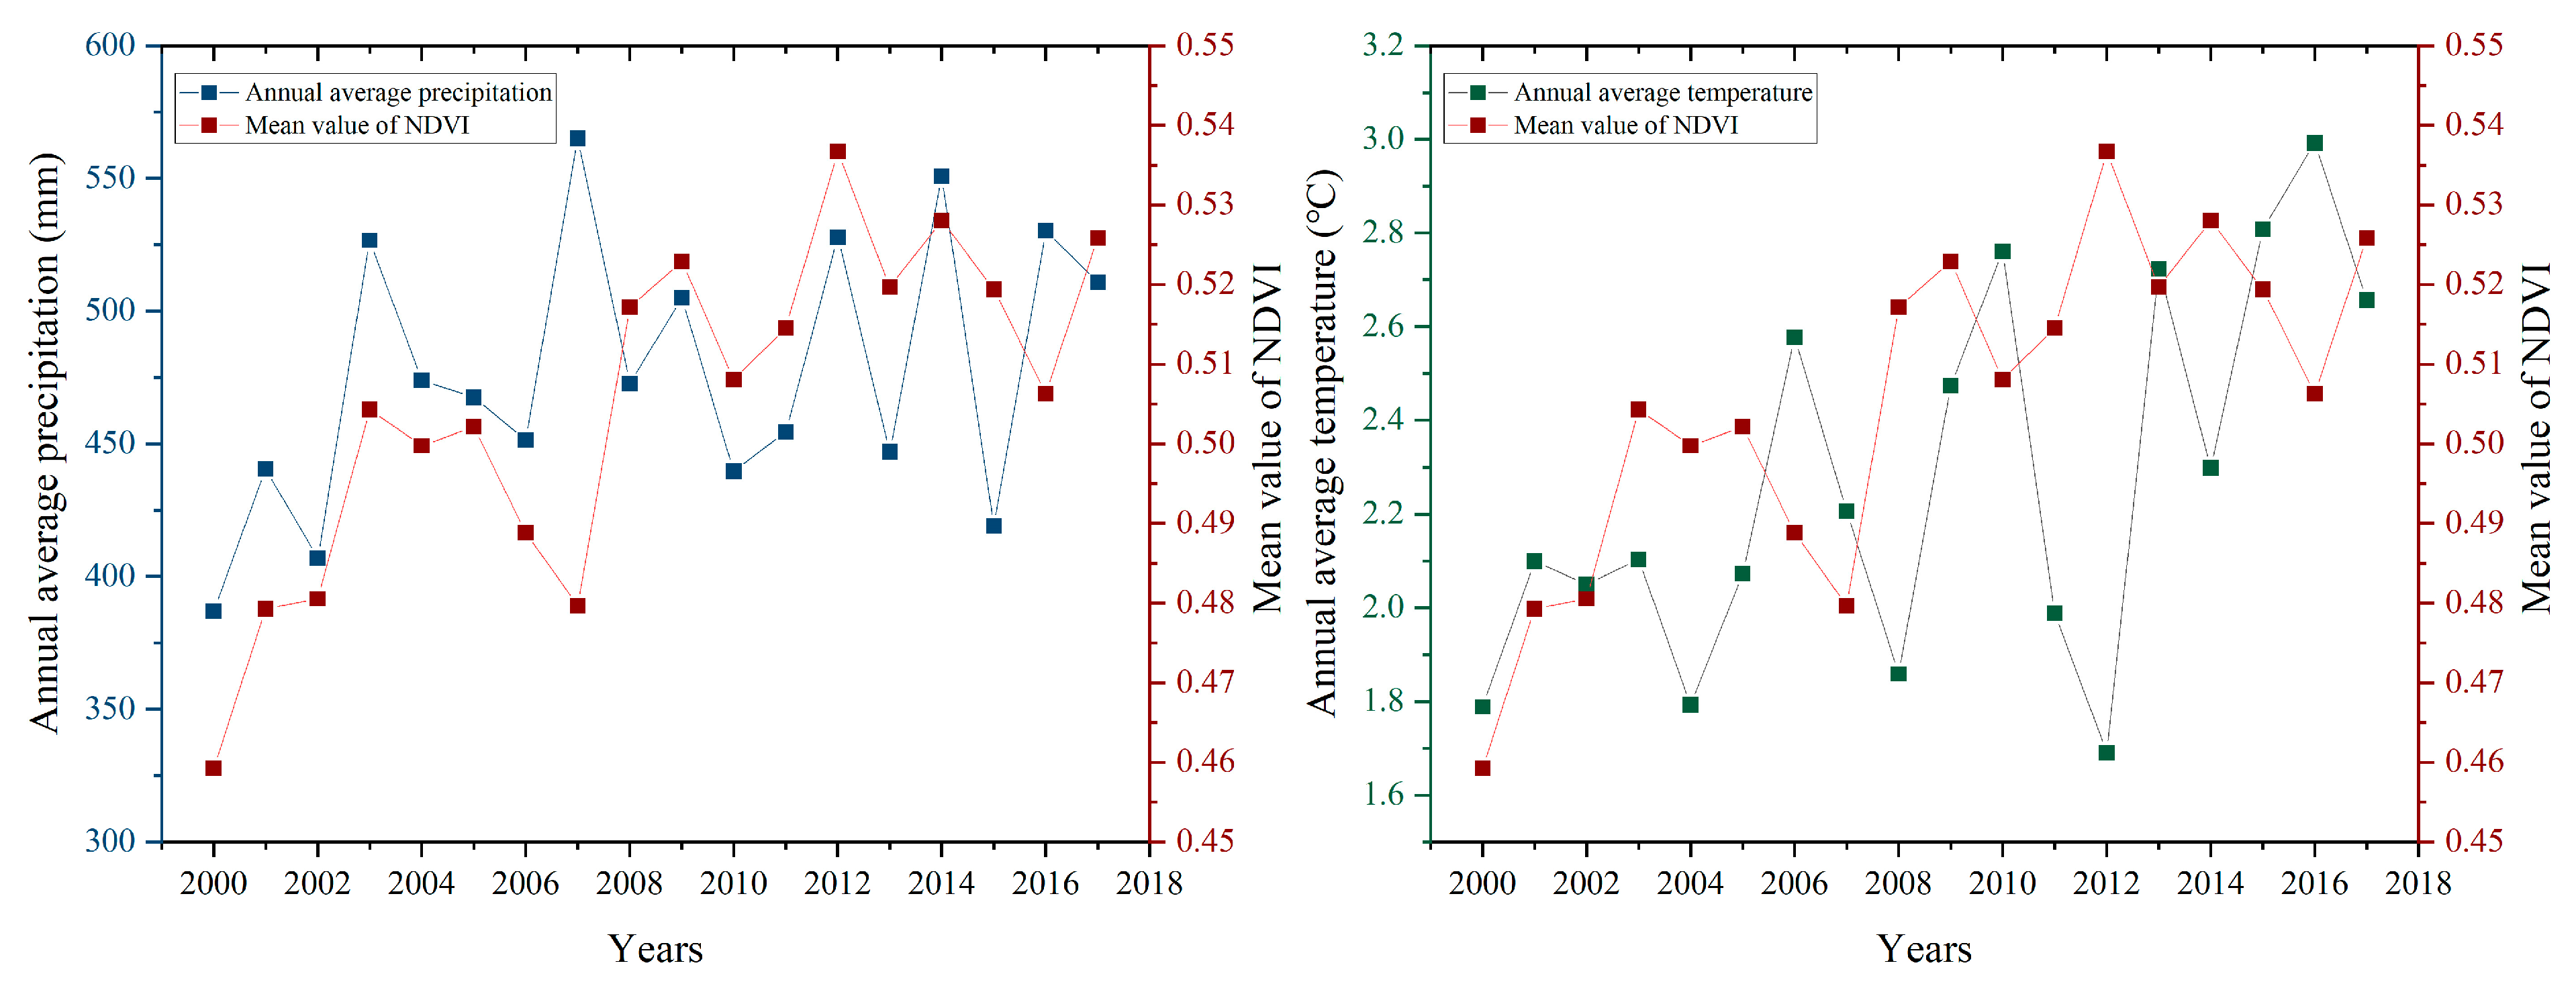
From 2000 to 2018, the NDVI in the HRB showed an obvious increasing trend. However, the farmland changes contributed only 6.67% of the regional mean increase in the NDVI in the HRB, implying that the greening trend should mainly be caused by other factors. One factor could be climate change. We analyzed the trend of the annual average precipitation and air temperature during 2000 to 2018, finding that precipitation increased by 38.50 mm and temperature increased by 0.47 ℃ per decade, based on the data at 14 meteorological stations in and around the HRB. The trends and annual variations of temperature and precipitation were generally in accordance with that of the NDVI (Figure 9), implying that climate change has had a significant influence on the change of the NDVI. Increased rainfall mitigated the water limitation in this semi-arid region, and thus improved the vegetation growth [36]. As the temperature is relatively low in the HRB, a rising temperature can extend the growing season of vegetation, and can increase the release of nutrient elements by accelerating the decomposition of soil organic matter [37]. The NDVI of the sample forestland plots showed an apparent increase (0.36% per year), which evidenced this positive effect of climate change. Another factor is improved land management, which caused the mean NDVI of unchanged farmland in the HRB to significantly increase by 0.78% per year. In addition, other factors not analyzed in this study, such as grassland protection by restricting or banning animal grazing, and afforestation of wasteland could also provide important contributions to the greening.
It should be noted that the ecological impact of farmland changes was only represented by their effect on the NDVI in this study, and other effects such as on soil and water conservation, runoff, primary productivity, and soil properties were not analyzed. In addition, the estimation was based on farmland data in two years, and not considering the dynamic process of farmland changes during 2000 to 2018 could involve some uncertainties, as farmland conversion occurred through the whole period. In general, this study proposed a simple approach to evaluating the ecological impact of farmland changes, and found that the farmland changes in the HRB had a positive effect on the natural environment.
4.3. Implications for Farmland Protection
In China, farmland protection has always been set as the top priority by the Chinese government, because of its huge population of 1.40 billion and limited farmland resources. During 2000 to 2018, the total grain production in China maintained a growth trend, increased from 462.18 to 657.89 million t, and some studies also provided a rather optimistic prediction that the current grain production can still meet the grain demand in 2030 [38,39]. However, considering quick farmland loss during recent decades due to urban sprawl and very limited lands suitable for expanding the farmland area, more strict protection of the current farmland is still very necessary. To this end, the Chinese government has implemented several policy measures to strictly control the farmland occupation of non-agricultural construction, and to regulate the farmland protection and ecological restoration [40,41].
As the key area of agricultural production in Qinghai Province, the significant farmland loss in the HRB from 2000 to 2018 inevitably affected the grain production. According to county-level statistical data, the total grain production in the HRB increased by 10.63% from 430,122 to 475,856 t from 2000 to 2018, significantly lower than the 66.26% increase in mean grain yield, which was promoted by the improvement of agricultural mechanization and modernization [42] and the increase in fiscal support for agriculture [43]. This large gap could mainly be caused by the reduction in farmland area, reflecting that the impact of farmland loss was significant on the grain production in the HRB. This implies that to stabilize the grain production, farmland protection should be strengthened, in addition to improving land productivity. To this end, appropriate policy measures should be adopted to control the urban land sprawl to reduce farmland occupation, and to regulate the scale/scope of ecological conversion of farmlands. In general, ecological conversion should be strictly limited to slope farmlands, and conversion of good-quality or base farmlands to forestland or grassland should be prohibited. Learning from the experiences of farmland protection in developed countries such as the United States [44], Germany [45], and Japan [46], farmland use and protection should be strictly followed based on legally authorized land use planning. Considering that local governments are facing the dual tasks of regional economic growth and farmland protection, it is necessary to formulate a scientific performance evaluation index system as a basis for incentivizing farmland protection, and to promote innovations in the land acquisition system for reducing the over-occupation of farmland.
5. Conclusions
From 2000 to 2018, the farmland area in the HRB significantly decreased by 23.47% (75.14 k ha), reducing by an average of 1.48% per year. A total of 94.77 k ha farmland in 2000 was lost, of which 75% was converted to forestland or grassland, and 25% was occupied by built-up land. In addition, 19.62 k ha was newly reclaimed for crop cultivation. The farmland changes showed a positive effect on the natural environment, but the contribution was rather limited, contributing only 6.67% to the regional increase in the NDVI in the HRB. The massive farmland reduction had a negative impact on grain production in the HRB; therefore, more efforts are needed to strengthen farmland protection.
Author Contributions
C.L. promoted and conceptualized the research and revised the manuscript; H.W. conducted the data acquisition and processing and wrote the draft manuscript; Y.L. participated in the NDVI data processing. All authors have read and agreed to the published version of the manuscript.
Funding
This research was funded by the Strategic Priority Research Program of Chinese Academy of Sciences, grant no. XDA20040301.
Data Availability Statement
Data available on request from the authors.
Acknowledgments
We are grateful to the editors and two anonymous reviewers for their constructive comments and suggestions.
Conflicts of Interest
The authors declare no conflict of interest.
References
- Ge, D.Z.; Long, H.L.; Zhang, Y.N.; Ma, L.; Li, T.T. Farmland transition and its influences on grain production in China. Land Use Policy 2018, 70, 94–105. [Google Scholar] [CrossRef]
- Wu, Y.Z.; Shan, L.P.; Guo, Z.; Peng, Y. Cultivated land protection policies in China facing 2030: Dynamic balance system versus basic farmland zoning. Habitat Int. 2017, 69, 126–138. [Google Scholar] [CrossRef]
- Cheng, L.; Jiang, P.H.; Chen, W.; Li, M.C.; Wang, L.Y.; Gong, Y.; Pian, Y.Z.; Xia, N.; Duan, Y.W.; Huang, Q.H. Farmland protection policies and rapid urbanization in China: A case study for Changzhou City. Land Use Policy 2015, 48, 552–566. [Google Scholar]
- Zhang, C.; Wang, X.; Liu, J.Y. Changes in quantity, quality, and pattern of farmland in a rapidly developing region of China: A case study of Ningbo region. Landsc. Ecol. Eng. 2019, 15, 323–336. [Google Scholar] [CrossRef]
- Fei, D.Q.; Cheng, Q.; Mao, X.F.; Liu, F.G.; Zhou, Q. Land use zoning using a coupled gridding-self-organizing feature maps method: A case study in China. J. Clean. Prod. 2017, 161, 1162–1170. [Google Scholar] [CrossRef]
- Dong, B.Q.; Qin, T.L.; Wang, Y.; Zhao, Y.; Liu, S.S.; Feng, J.M.; Li, C.H.; Zhang, X. Spatiotemporal variation of nitrogen and phosphorus and its main influencing factors in Huangshui River Basin. Environ. Monit. Assess. 2021, 193, 292. [Google Scholar] [CrossRef]
- Zhao, C.C.; Dong, X.; Xin, W.R.; Wang, S.; Yang, Q.M. Effect on soil and water conservation from different models of conversion of farmland to forest in Huangshui River at Qinghai. J. Soil Water Conserv. 2009, 23, 26–29. (In Chinese) [Google Scholar]
- Zhao, C.C.; Wang, S.; Sun, G.X.; Yang, Q.M.; Yang, N.G.; Zhang, W.J.; Deng, X. Study on soil erosive ness in the area of returning farmland to forest in Huangshui River Watershed of Qinghai Province. For. Resour. Manag. 2010, 2, 73–77. (In Chinese) [Google Scholar]
- Feng, J.M.; Dong, B.Q.; Qin, T.L.; Liu, S.S.; Zhang, J.W.; Gong, X.F. Temporal and spatial variation characteristics of NDVI and its relationship with environmental factors in Huangshui River Basin from 2000 to 2018. Pol. J. Environ. Stud. 2021, 30, 3043–3063. [Google Scholar] [CrossRef]
- Qiao, B.H.; Qu, Y.B.; Ye, X. A research on space-time evolution of cultivated land pressure: Taking Hehuang valley in Qinghai Province as an example. Rev. Econ. Manag. 2015, 31, 155–160. (In Chinese) [Google Scholar]
- Cheng, Q.; Cai, Y.L.; Liu, F.G.; Zhou, Q.; Zhang, H.F. Farmers’ perception to farmland conversion: A questionnaire survey in Xining City, Qinghai Province, China. Chin. Geogr. Sci. 2013, 23, 634–646. [Google Scholar] [CrossRef] [Green Version]
- Yu, M.; Yang, Y.J.; Chen, F.; Zhu, F.W.; Qu, J.F.; Zhang, S.L. Response of agricultural multifunctionality to farmland loss under rapidly urbanizing processes in Yangtze River Delta, China. Sci. Total Environ. 2019, 666, 1–11. [Google Scholar] [CrossRef]
- Wei, Z.H.; Gu, X.H.; Sun, Q.; Hu, X.Q.; Gao, Y.B. Analysis of the spatial and temporal pattern of changes in abandoned farmland based on long time series of remote sensing data. Remote Sens. 2021, 13, 2549. [Google Scholar] [CrossRef]
- Wang, M.; Xu, Q.C.; Fan, Z.N.; Sun, X.F. The imprint of built-up land expansion on cropland distribution and productivity in Shandong Province. Land 2021, 10, 639. [Google Scholar] [CrossRef]
- Gong, Y.L.; Li, J.T.; Li, Y.X. Spatiotemporal characteristics and driving mechanisms of arable land in the Beijing-Tianjin-Hebei region during 1990–2015. Socio-Econ. Plan. Sci. 2019, 70, 100720. [Google Scholar] [CrossRef]
- Yu, D.; Hu, S.G.; Tong, L.Y.; Xia, C. Spatiotemporal dynamics of cultivated land and its influences on grain production potential in Hunan Province, China. Land 2020, 9, 510. [Google Scholar] [CrossRef]
- Song, W.; Pijanowski, B.C.; Tayyebi, A. Urban expansion and its consumption of high-quality farmland in Beijing, China. Ecol. Indic. 2015, 54, 60–70. [Google Scholar] [CrossRef]
- Chao, Z.H.; Zhang, P.D.; Wang, X.F. Impacts of urbanization on the net primary productivity and cultivated land change in Shandong Province, China. J. Indian Soc. Remote Sens. 2018, 46, 809–819. [Google Scholar] [CrossRef]
- Xu, S. Temporal and spatial characteristics of the change of cultivated land resources in the black soil region of Heilongjiang Province (China). Sustainability 2019, 11, 38. [Google Scholar] [CrossRef] [Green Version]
- Cao, X.; Chen, X.H.; Zhang, W.W.; Liao, A.P.; Chen, L.J.; Chen, Z.G.; Chen, J. Global cultivated land mapping at 30 m spatial resolution. Sci. China Earth Sci. 2016, 59, 2275–2284. [Google Scholar] [CrossRef]
- Liu, J.Y.; Kuang, W.H.; Zhang, Z.X.; Xu, X.L.; Qin, Y.W.; Ning, J.; Zhou, W.C.; Zhang, S.W.; Li, R.D.; Yan, C.Z.; et al. Spatiotemporal characteristics, patterns and causes of land use changes in China since the late 1980s. J. Geogr. Sci. 2014, 24, 195–210. [Google Scholar] [CrossRef]
- Liu, F.; Qin, T.L.; Yan, D.H.; Wang, Y.; Dong, B.Q.; Wang, J.W.; Nie, H.J.; He, S.; Liu, S.S. Classification of instream ecological water demand and crucial values in a semi-arid river basin. Sci. Total Environ. 2020, 712, 136409. [Google Scholar] [CrossRef] [PubMed]
- Bi, W.X.; Wang, K.; Weng, B.S.; Yan, D.H.; Liu, S.Y. Does the returning farmland to forest program improve the ecosystem stability of rhizosphere in winter in alpine regions? Appl. Soil Ecol. 2021, 165, 104011. [Google Scholar] [CrossRef]
- Zhou, B.; Wang, H.W.; Zhang, Q.Q. Assessment of the evolution of groundwater chemistry and its controlling factors in the Huangshui River Basin of northwestern China, using hydrochemistry and multivariate statistical techniques. Int. J. Environ. Res. Public Health 2021, 18, 7551. [Google Scholar] [CrossRef] [PubMed]
- Bai, X.X.; Yan, C.Z. Effects of eco-environment construction projects on soil and water loss in Huangshui river basin. Bullet Soil Water Conserv. 2013, 33, 217–218. [Google Scholar]
- Zhang, C.G.; Shen, Y.J.; Liu, F.G.; Meng, L. Changes in reference evapotranspiration over an agricultural region in the Qinghai-Tibetan plateau, China. Theor. Appl. Climatol. 2016, 123, 107–115. [Google Scholar] [CrossRef]
- Yu, H.; Du, R.X.; Tao, H.P.; Liu, B.T.; Kong, B. Quantitative analysis of Huangshui River Basin landscape over last twenty years using RS and GIS. Int. Conf. Sustain. Dev. 2017, 94, 232–236. [Google Scholar]
- Sydsaeter, K.; Hammond, P.; Strom, A. Essential Mathematics for Economic Analysis; FT Prentice Hall: Hoboken, NJ, USA, 2008. [Google Scholar]
- Zhao, J.Y.; Peng, J.H. Spatiotemporal variation of the vegetation coverage in Qinghai Plateau based on MODIS NDVI data. J. Arid Land Resour. Environ. 2016, 30, 67–73. (In Chinese) [Google Scholar]
- Liu, S.L.; Li, W.P.; Qiao, W.; Hu, Y.B.; Wang, Z.K. Effect of natural conditions and mining activities on vegetation variations in arid and semiarid mining regions. Ecol. Indic. 2019, 103, 331–345. [Google Scholar] [CrossRef]
- Sun, B.; Li, Z.Y.; Gao, W.T.; Zhang, Y.Y.; Gao, Z.H.; Song, Z.L.; Qin, P.Y.; Tian, X. Identification and assessment of the factors driving vegetation degradation/regeneration in drylands using synthetic high spatiotemporal remote sensing Data-A case study in Zhenglanqi, Inner Mongolia, China. Ecol. Indic. 2019, 107, 105614. [Google Scholar] [CrossRef]
- Feng, Z.M.; Zhang, P.T.; Song, Y. Food security: The impact of land conversion from farmland to forest or grassland on grain production in Northwest China. J. Nat. Resour. 2002, 17, 299–306. (In Chinses) [Google Scholar]
- Zeng, Y.N.; Jin, W.P.; Wang, H.M.; Tan, L.X. Analysis and evaluation of cultivated land decrease in eastern part of Qinghai Plateau. Trans. Chin. Soc. Agric. Eng. 2013, 29, 214–222. (In Chinese) [Google Scholar]
- Guo, Y.C.; Li, H.R. Analysis on the present situation and benefit of returning cultivated farmland to forest in Qinghai Province. Mod. Agric. Sci. Technol. 2018, 19, 209–210. (In Chinese) [Google Scholar]
- Zhou, Y.; Li, X.H.; Liu, Y.S. Land use change and driving factors in rural China during the period 1995–2015. Land Use Policy 2020, 99, 105048. [Google Scholar] [CrossRef]
- Jin, K.; Wang, F.; Han, J.Q.; Shi, S.Y.; Yu, W.B. Contribution of climatic change and human activities to vegetation NDVI change over China during 1982-2015. Acta Geogr. Sin. 2020, 75, 961–974. (In Chinses) [Google Scholar]
- Pang, G.J.; Wang, X.J.; Yang, M.X. Using the NDVI to identify variations in, and responses of, vegetation to climate change on the Tibetan Plateau from 1982 to 2012. Quat. Int. 2016, 444, 87–96. [Google Scholar] [CrossRef]
- Cheng, S.K.; Xu, Z.R.; Xie, G.D.; Zhen, L.; Wang, L.E.; Guo, J.H.; Hou, P.; He, Z.H. The history of China’s food security in the past hundred years. J. Agric. 2018, 8, 186–192. (In Chinese) [Google Scholar]
- Liu, L.T.; Liu, X.J.; Lun, F.; Wu, L.; Lu, C.X.; Guo, J.H.; Qu, T.T.; Liu, G.; Shen, L.; Cheng, S.K. Research on China’s food security under global climate change background. J. Nat. Resour. 2018, 33, 927–939. (In Chinese) [Google Scholar]
- Huang, Z.H.; Du, X.J.; Salvador, C. How does urbanization affect farmland protection? Evidence from China. Resour. Conserv. Recycl. 2019, 145, 139–147. [Google Scholar] [CrossRef] [Green Version]
- Li, M. The effect of land use regulations on farmland protection and non-agricultural land conversions in China. Agric. Resour. Econ. 2019, 63, 643–667. [Google Scholar] [CrossRef] [Green Version]
- Zhang, L.G.; Bao, B.F.; Dong, L. Spatial and temporal pattern evolution of grain yield and spatial heterogeneity of driving factors in Poyang Lake eco economic zone. Econ. Geogr. 2018, 38, 154–161. (In Chinese) [Google Scholar]
- Li, M.W.; Wang, Z.H.; Zhang, G.S. Re-discussion of agricultural policies change on high-quality output effect of grain: Based on Nerlove dynamic analysis model. Agric. Econ. Manag. 2019, 6, 73–84. (In Chinese) [Google Scholar]
- Daniels, T.L. Assessing the performance of farmland preservation in America’s farmland preservation heartland: A policy review. Soc. Nat. Resour. 2020, 33, 758–768. [Google Scholar] [CrossRef]
- Tan, R.; Beckmann, V.; Van, D.B.; Qu, F. Governing farmland conversion: Comparing China with the Netherlands and Germany. Land Use Policy 2009, 26, 961–974. [Google Scholar] [CrossRef]
- Jentzsch, H. Tracing the local origins of farmland policies in Japan-local-nation policy transfer and endogenous institutional change. Soc. Sci. Jpn. J. 2017, 20, 243–260. [Google Scholar] [CrossRef]
Figure 1.
Location and DEM map of the Huangshui River Basin.

Figure 2.
Examples of farmland parcel delineation.
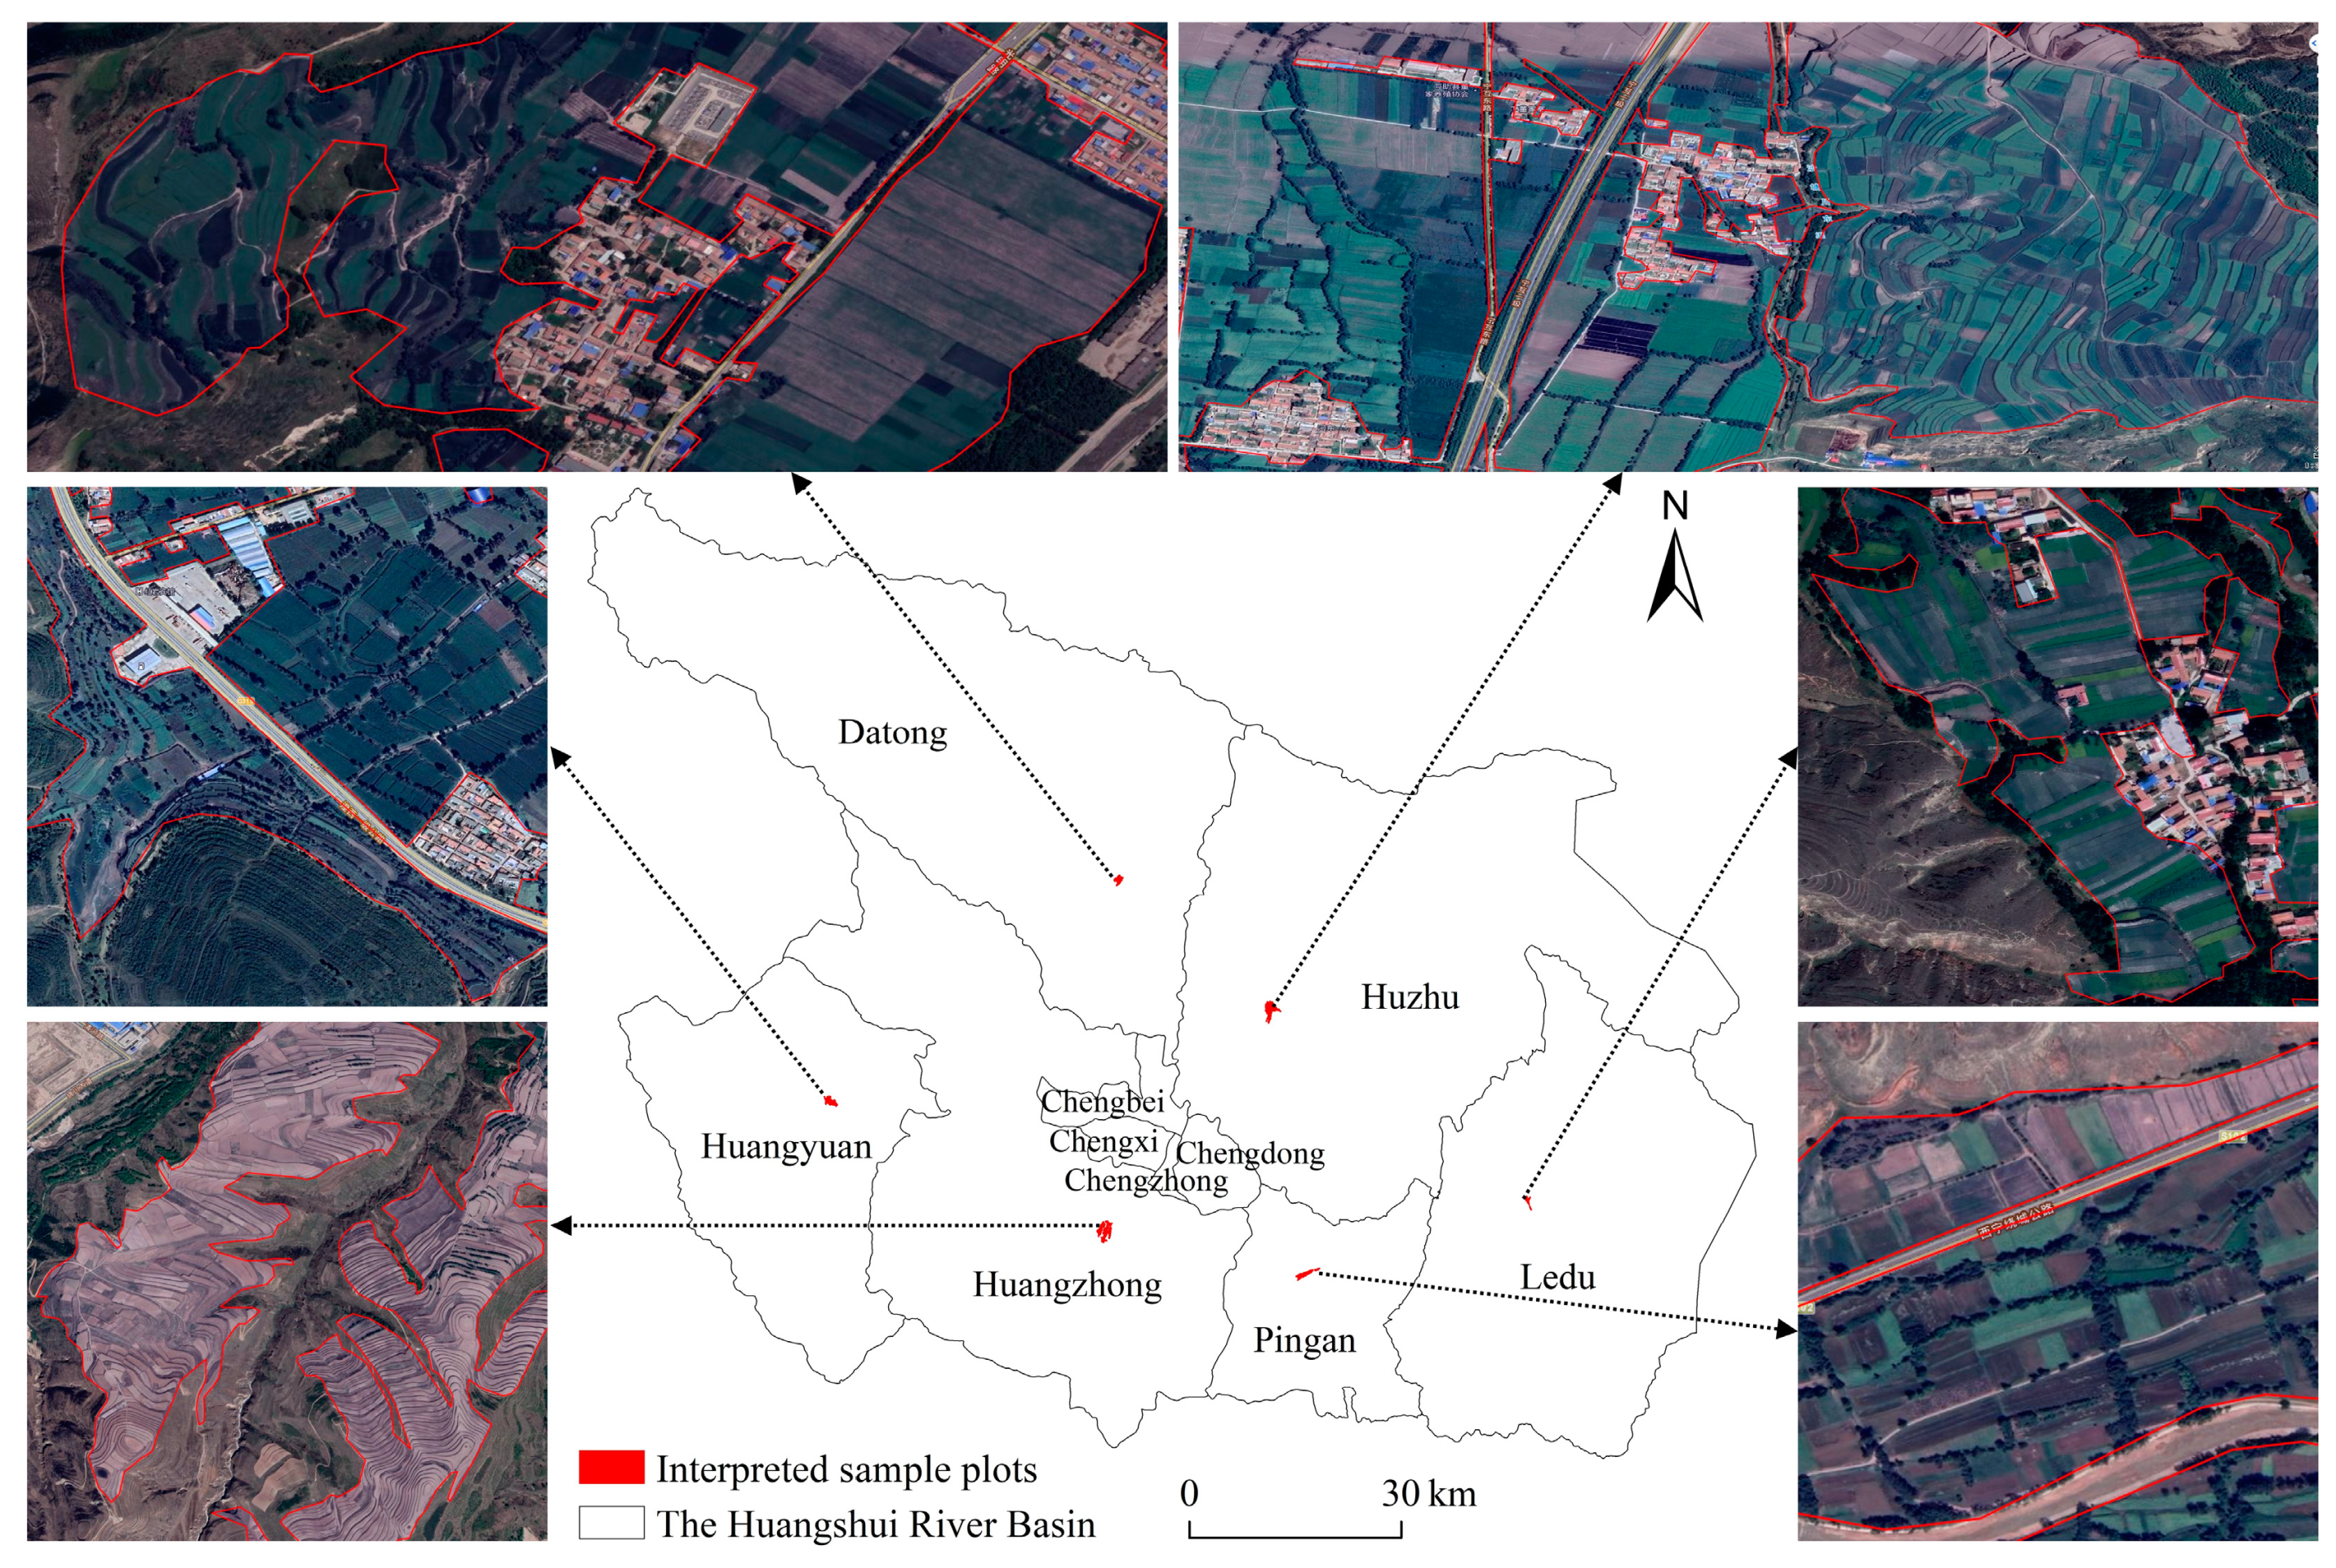
Figure 3.
Farmland changes between 2000 and 2018 in the Huangshui River Basin.
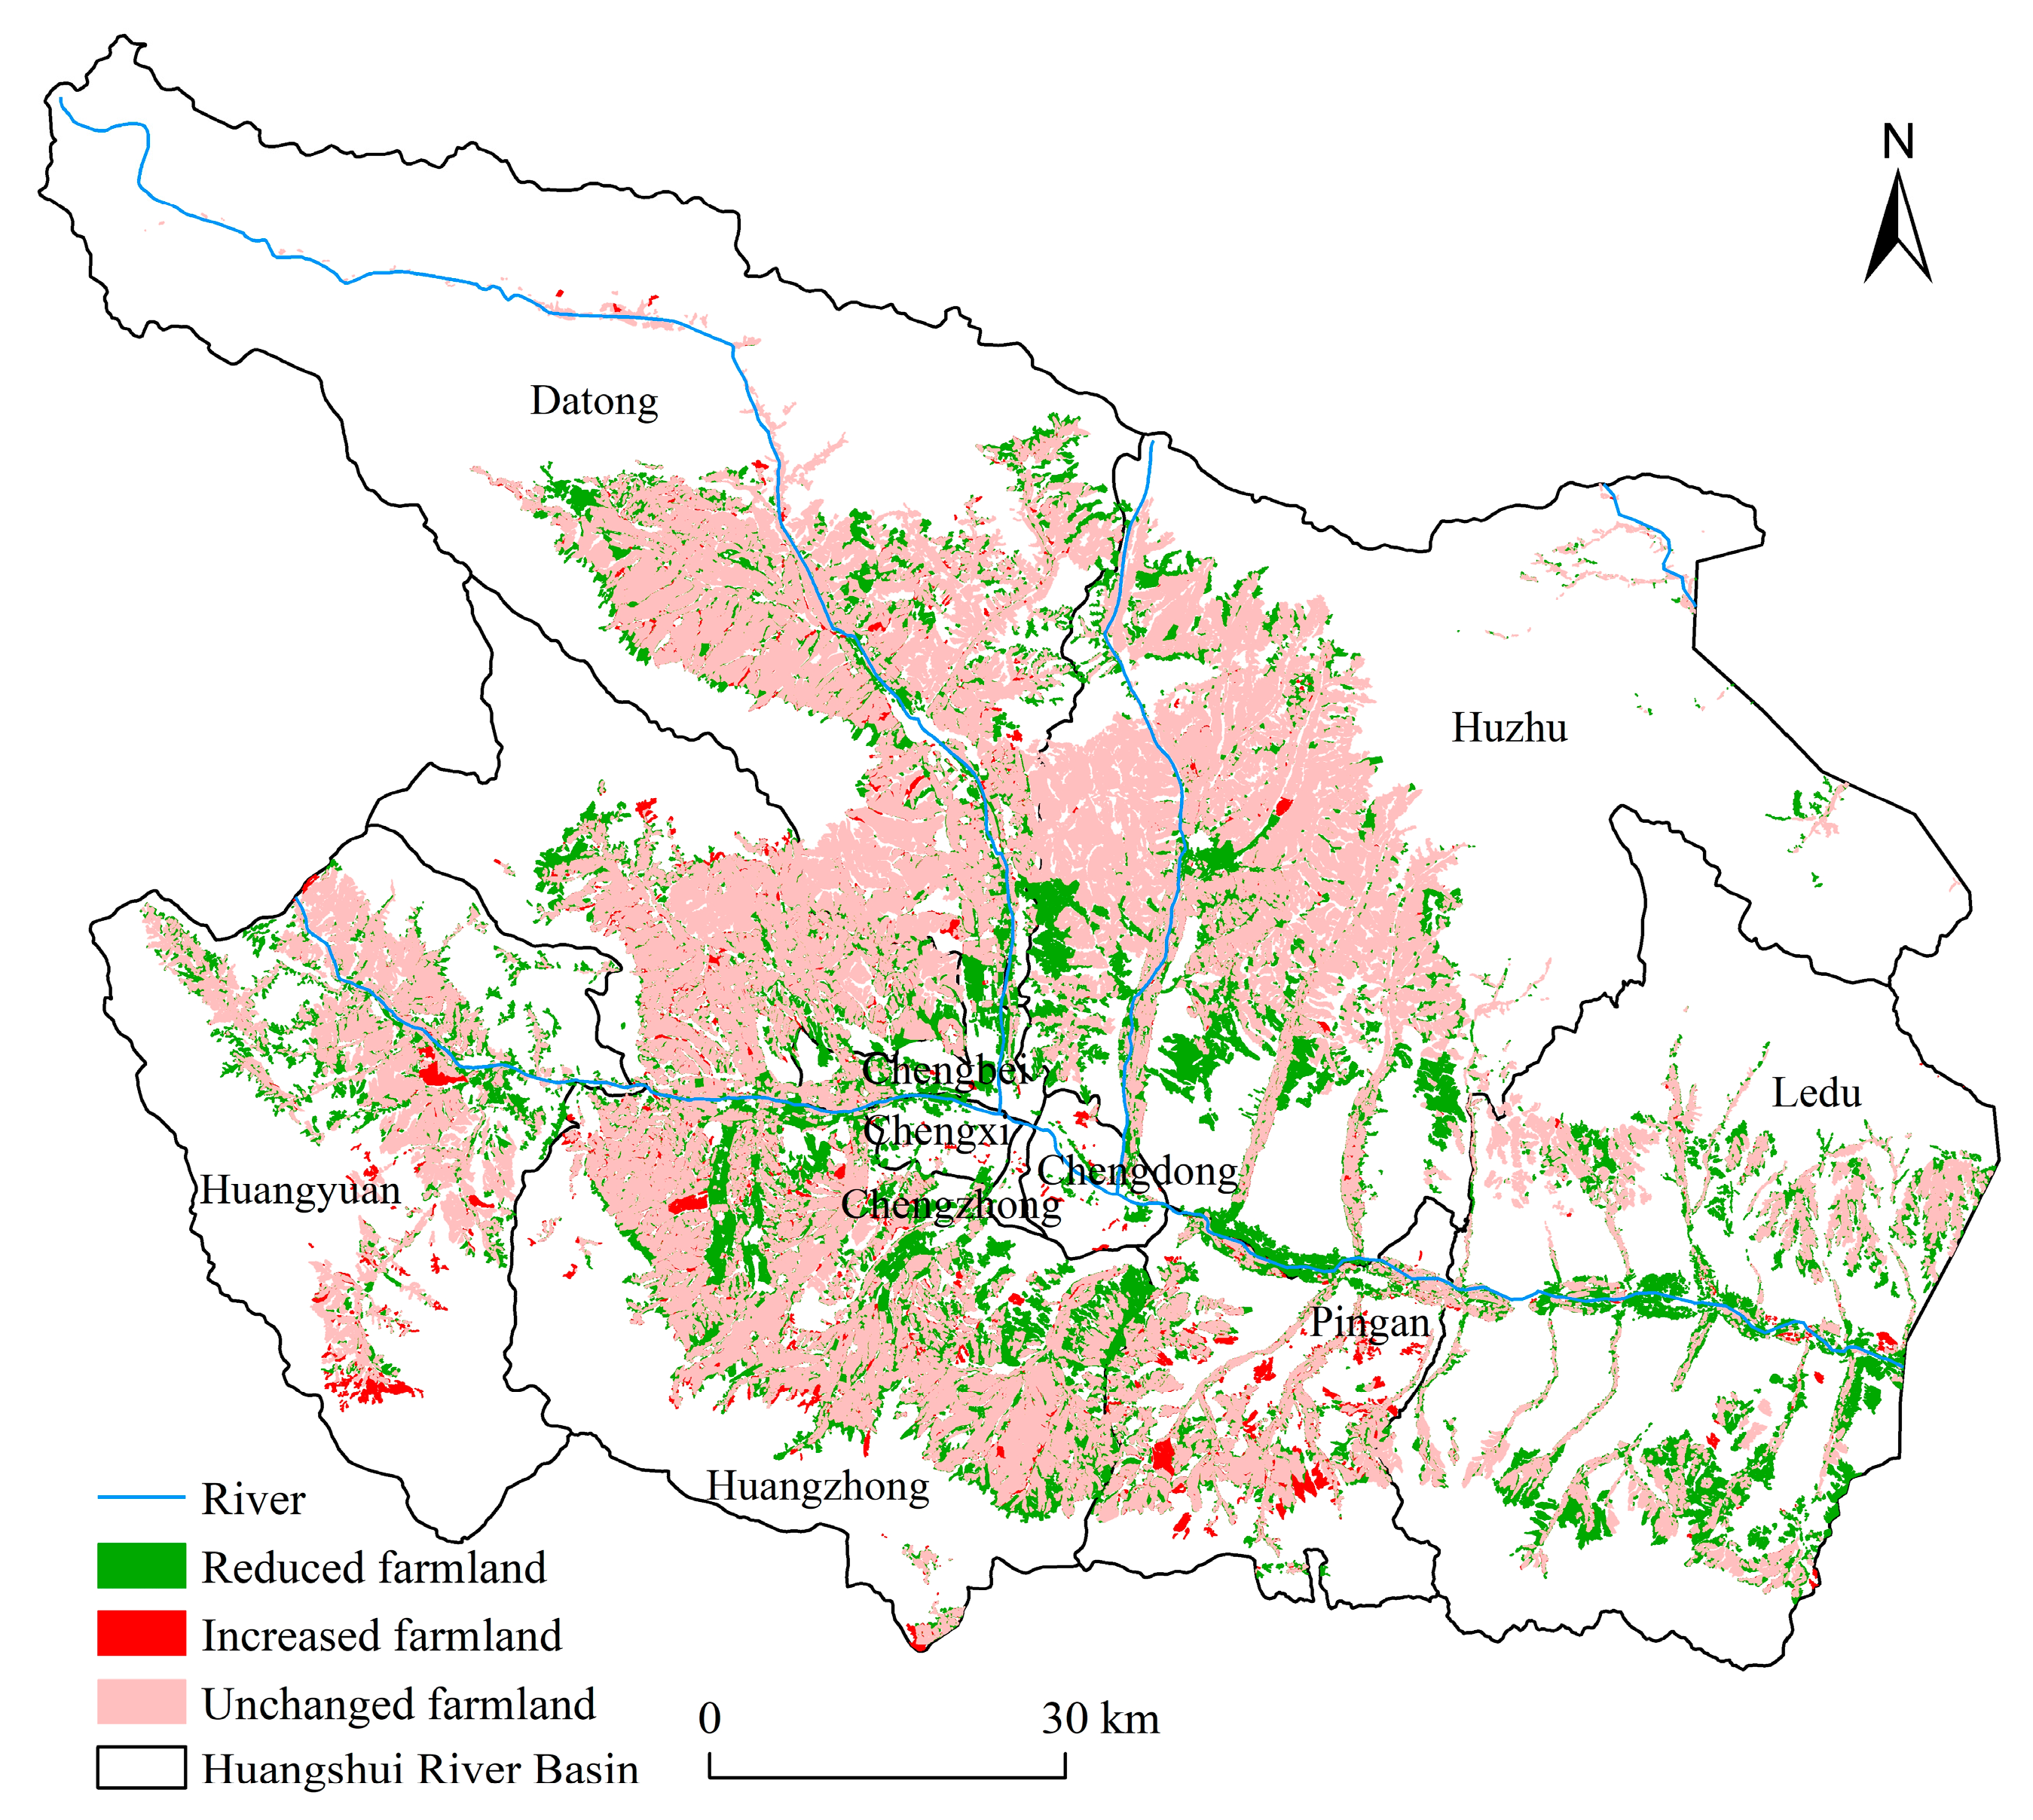
Figure 4.
(a) Spatial distribution of ecological restoration and built-up land occupation between 2000 and 2018 in the Huangshui River Basin. Example of built-up land occupation where the farmland (b1) was converted to built-up land (b2). Example of ecological restoration, where the sloped farmland (c1) was mostly converted to grassland and forestland (c2).
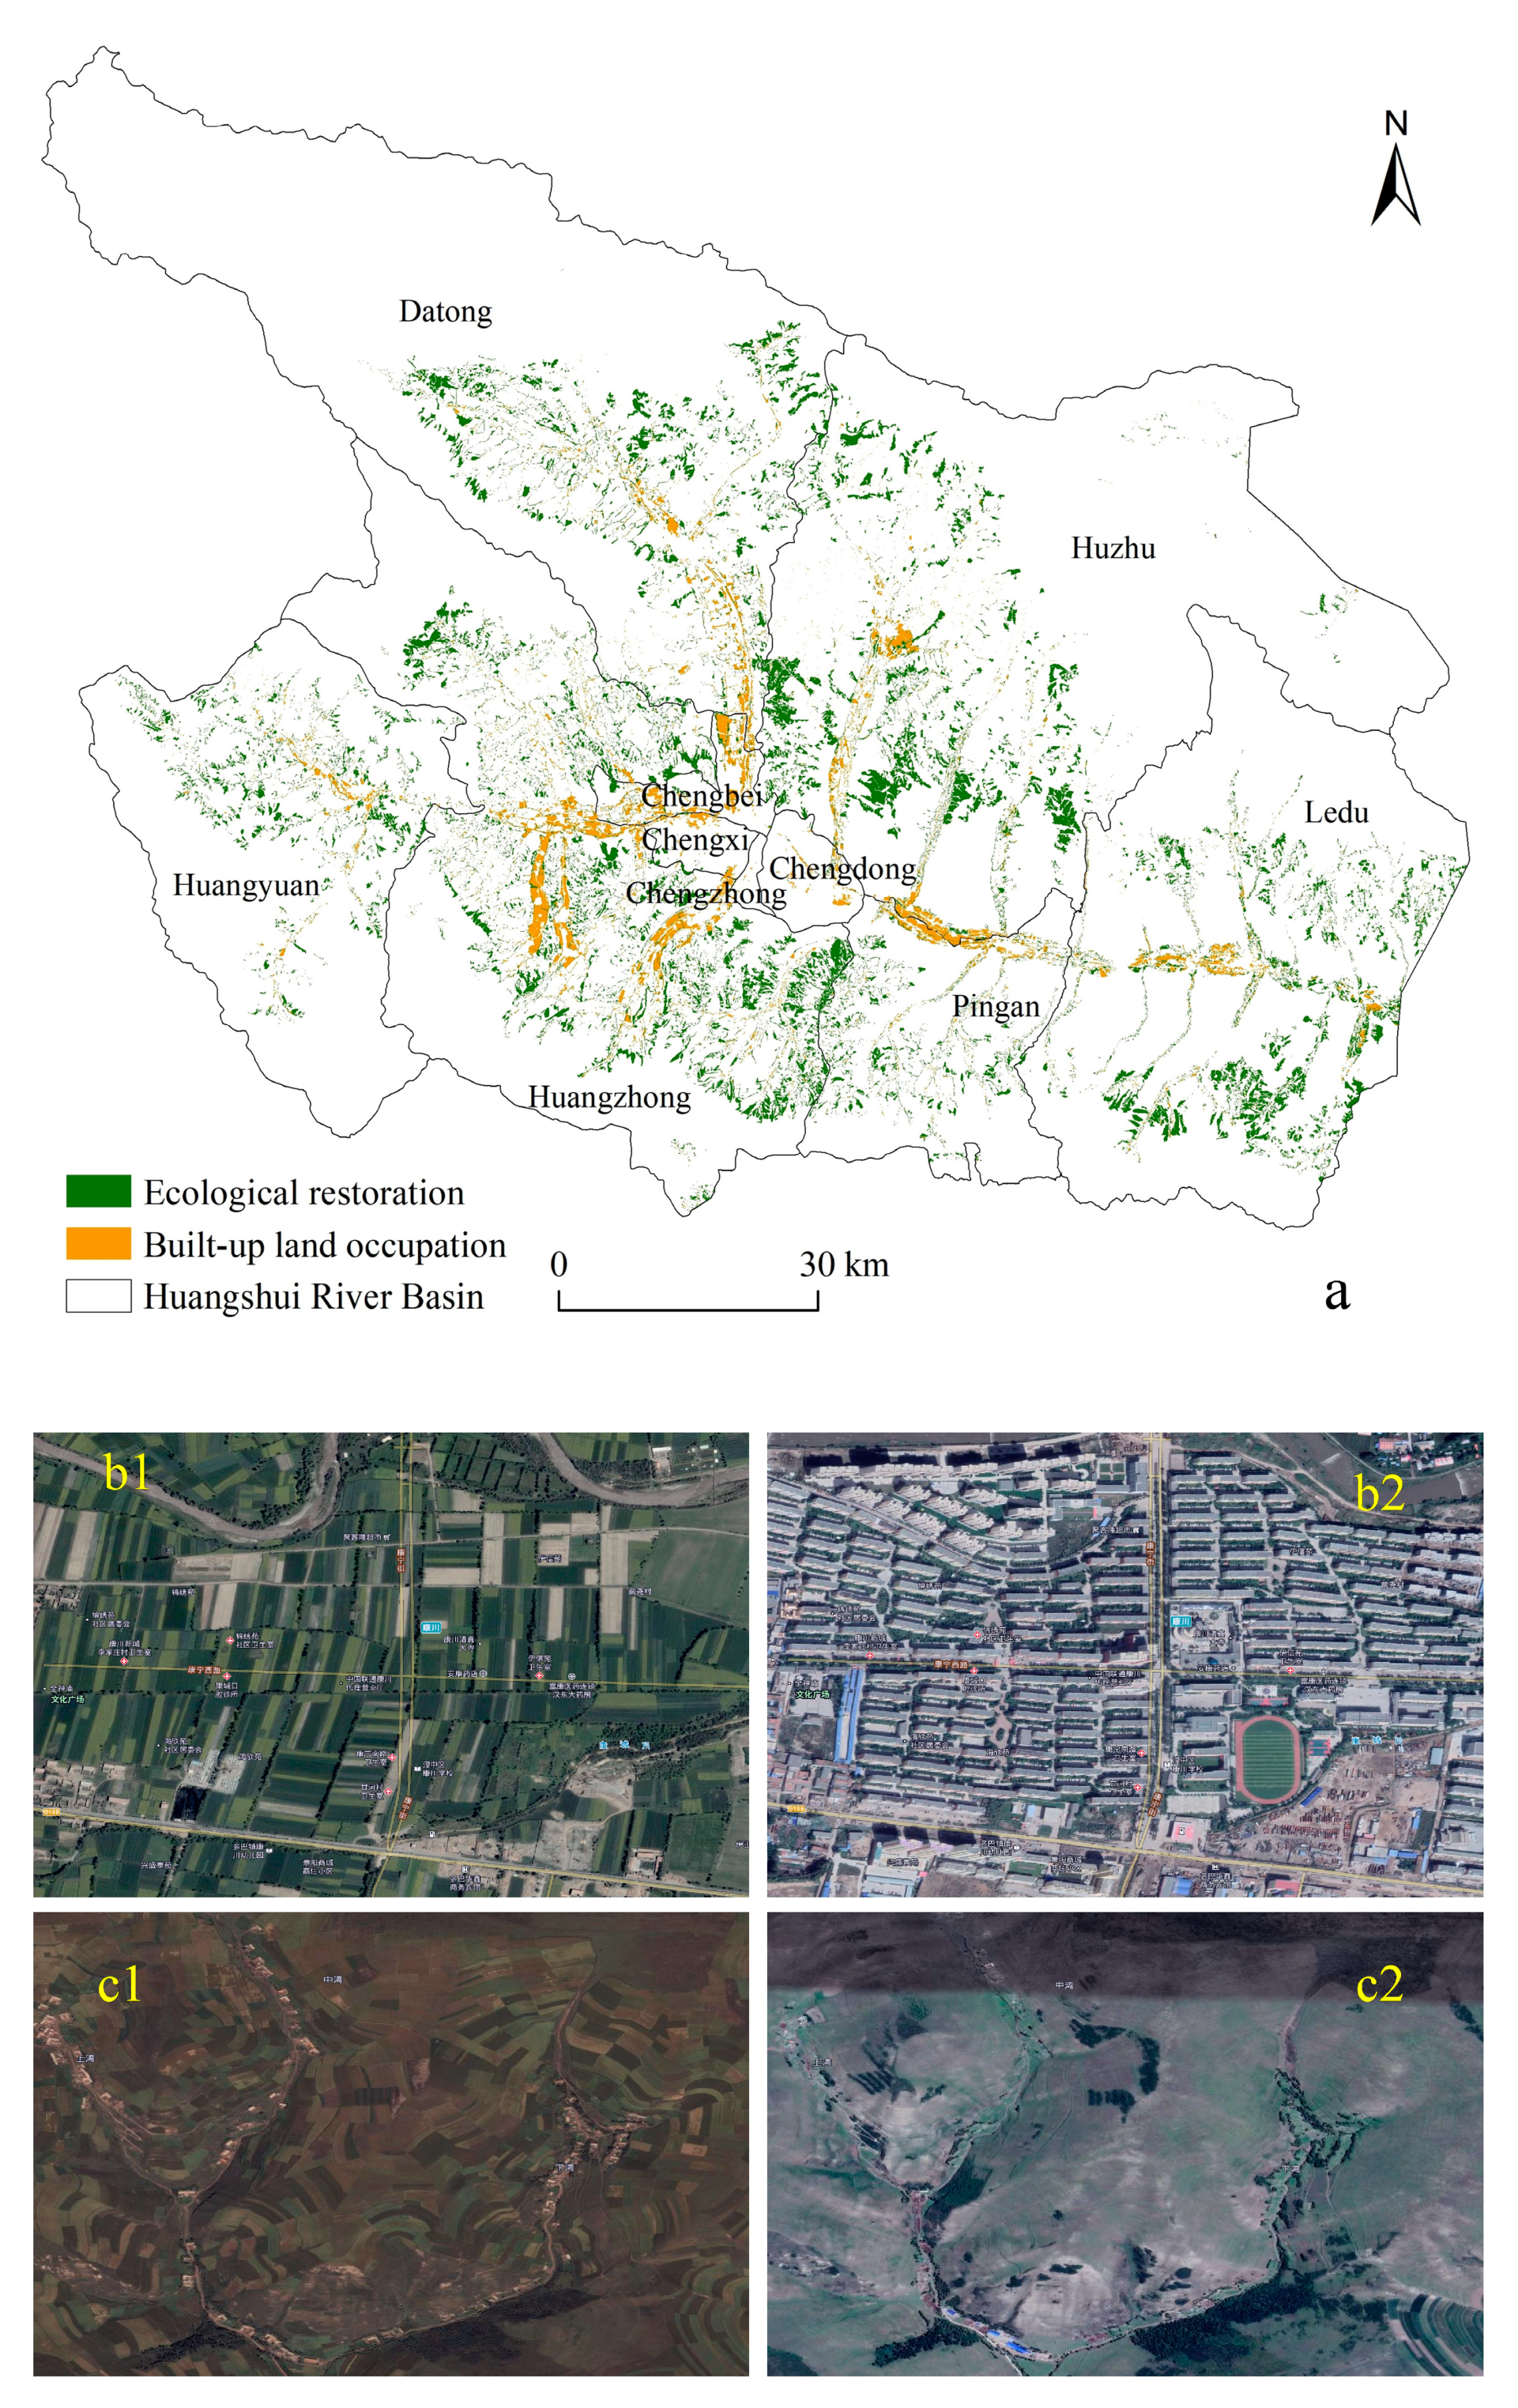
Figure 5.
Annual variation in the annual and monthly mean NDVI of the whole basin (HRB), unchanged farmland area (UF), sample forestland area (FL), areas where the farmland was fully converted to forestland/grassland (ER) and to built-up land (BO), and new farmland reclamation (FR) in the growing season during 2000 to 2018.

Figure 6.
Effects of different farmland changes of ecological restoration (a), built-up land occupation (b), newly reclaimed farmland (c), and unchanged farmland (d) on the annual mean NDVI in the Huangshui River Basin during 2000 to 2018.
Figure 6.
Effects of different farmland changes of ecological restoration (a), built-up land occupation (b), newly reclaimed farmland (c), and unchanged farmland (d) on the annual mean NDVI in the Huangshui River Basin during 2000 to 2018.
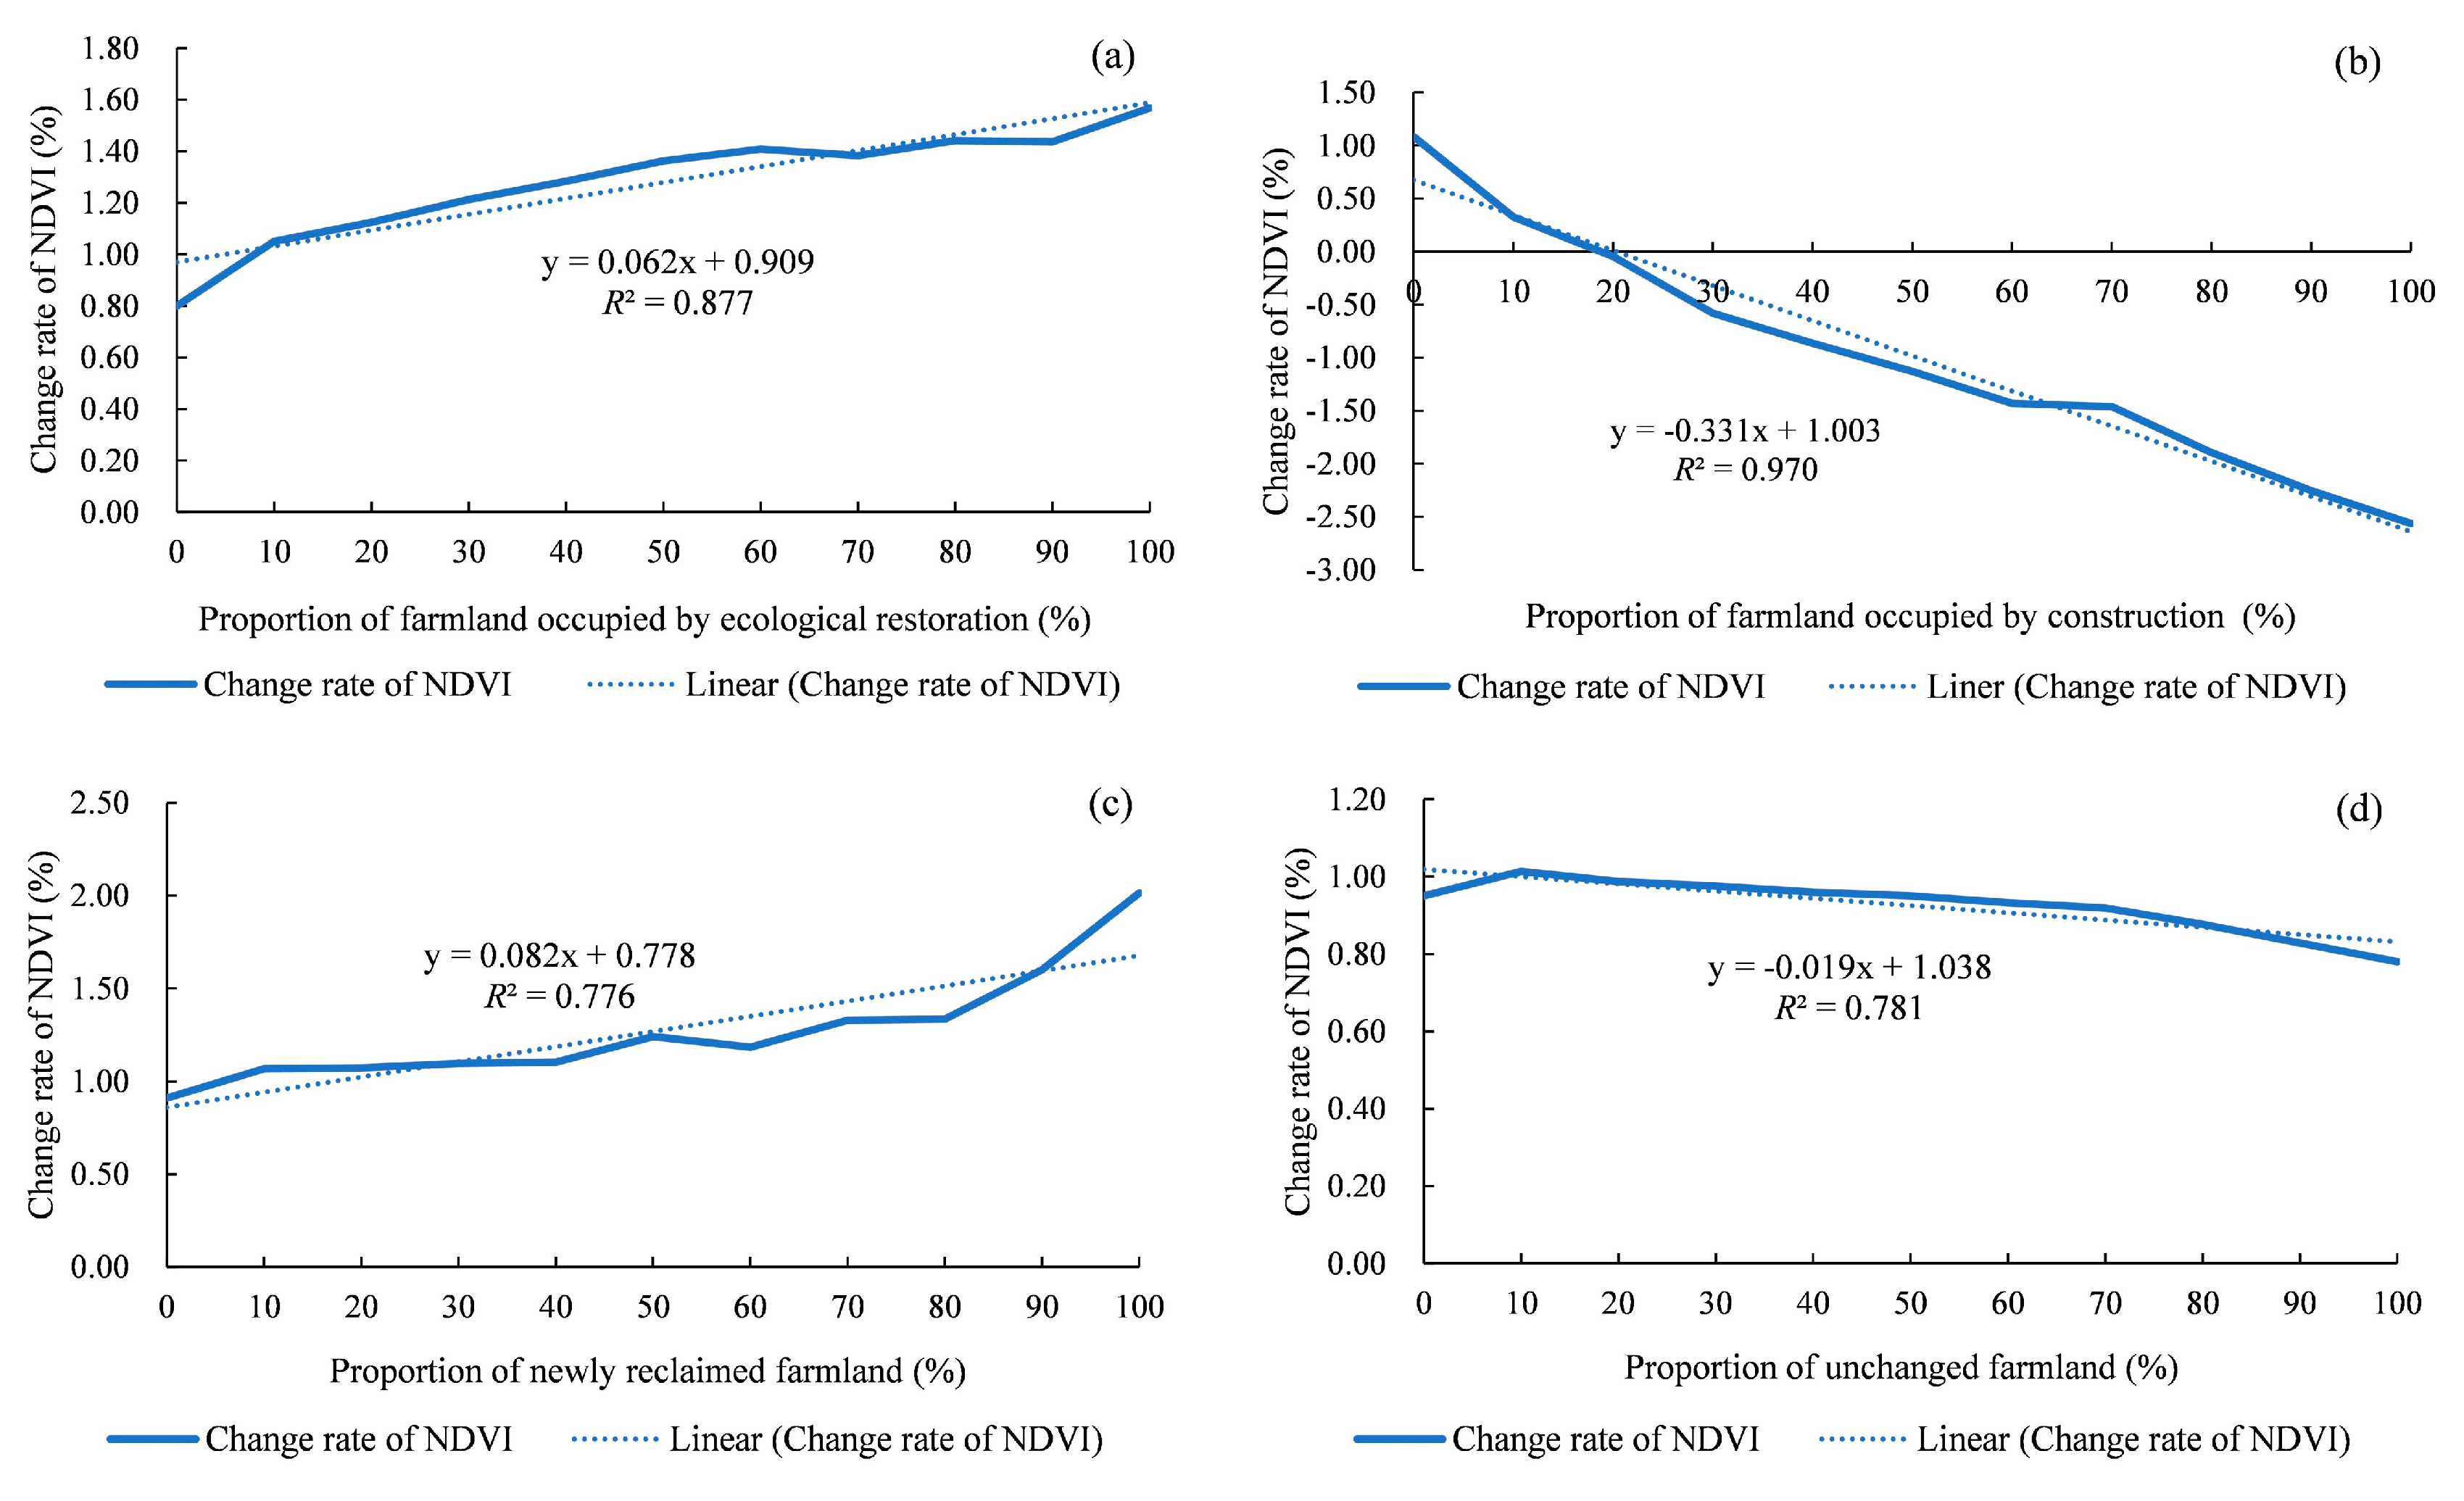
Figure 7.
Contribution of the three farmland conversions to the regional increase in the NDVI in the Huangshui River Basin during 2000 to 2018.
Figure 7.
Contribution of the three farmland conversions to the regional increase in the NDVI in the Huangshui River Basin during 2000 to 2018.
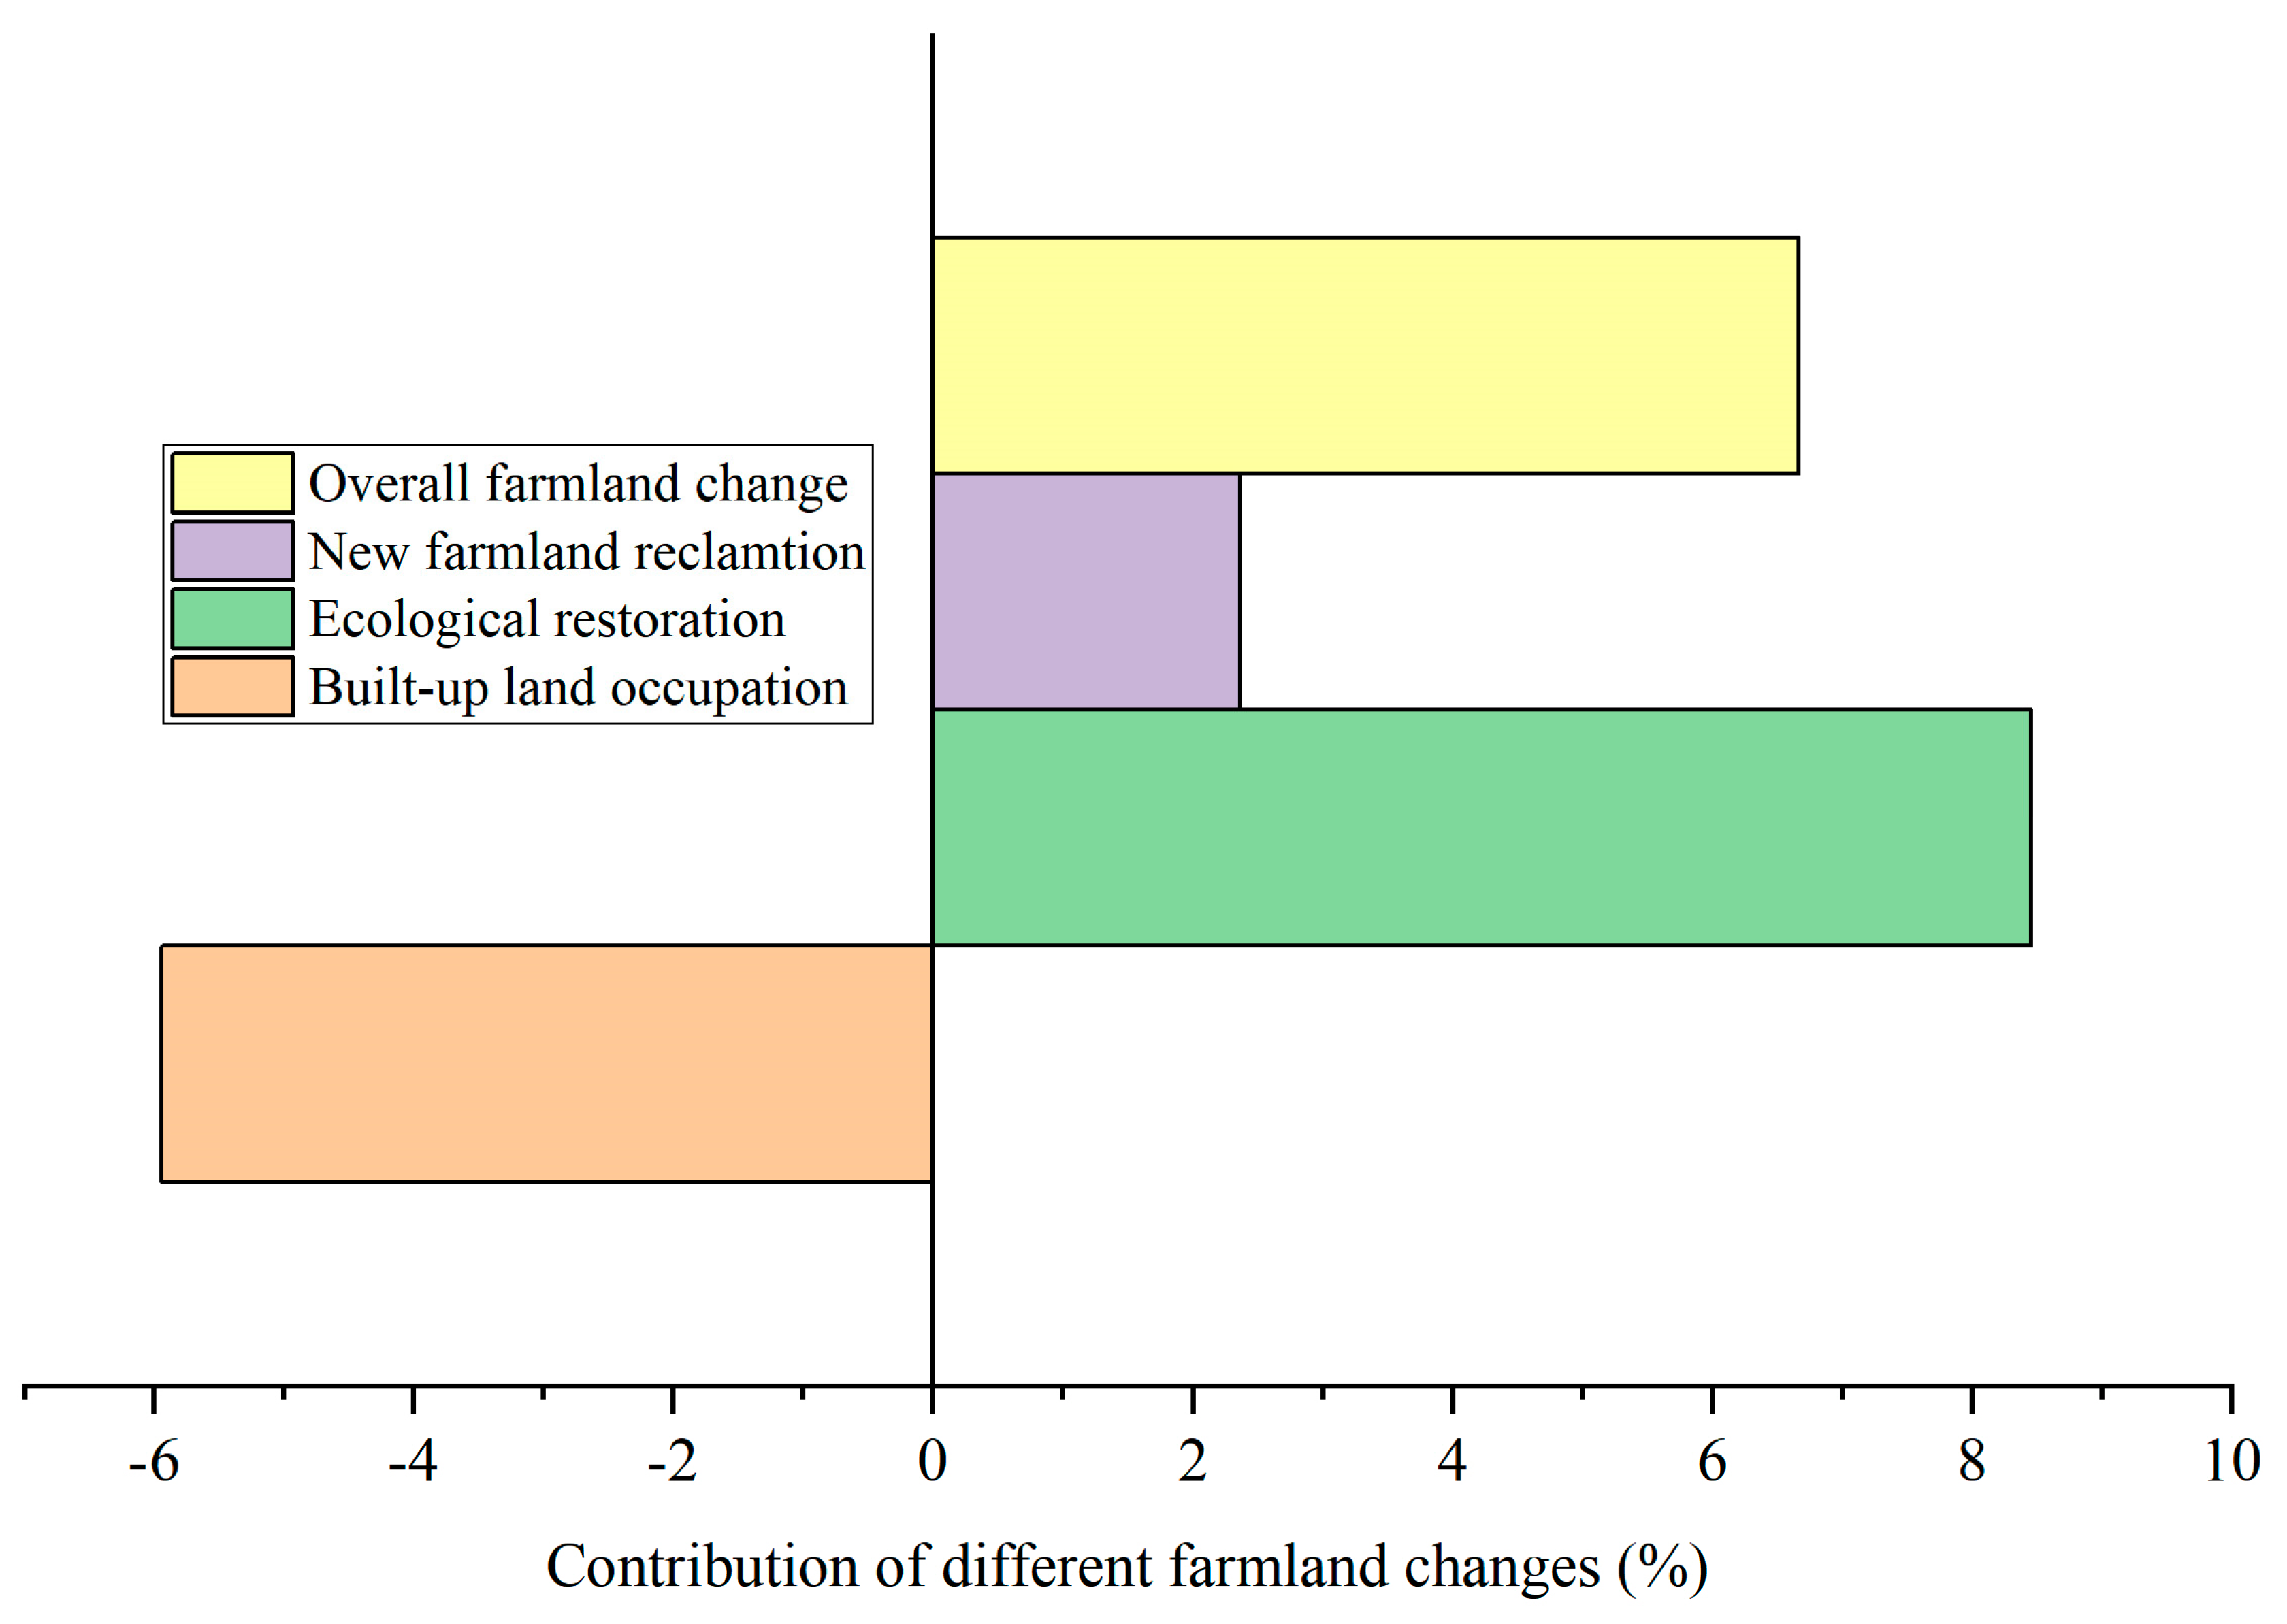
Figure 8.
Changes in total population and proportion of urban/rural population in the Huangshui River Basin during 2000 to 2018.
Figure 8.
Changes in total population and proportion of urban/rural population in the Huangshui River Basin during 2000 to 2018.
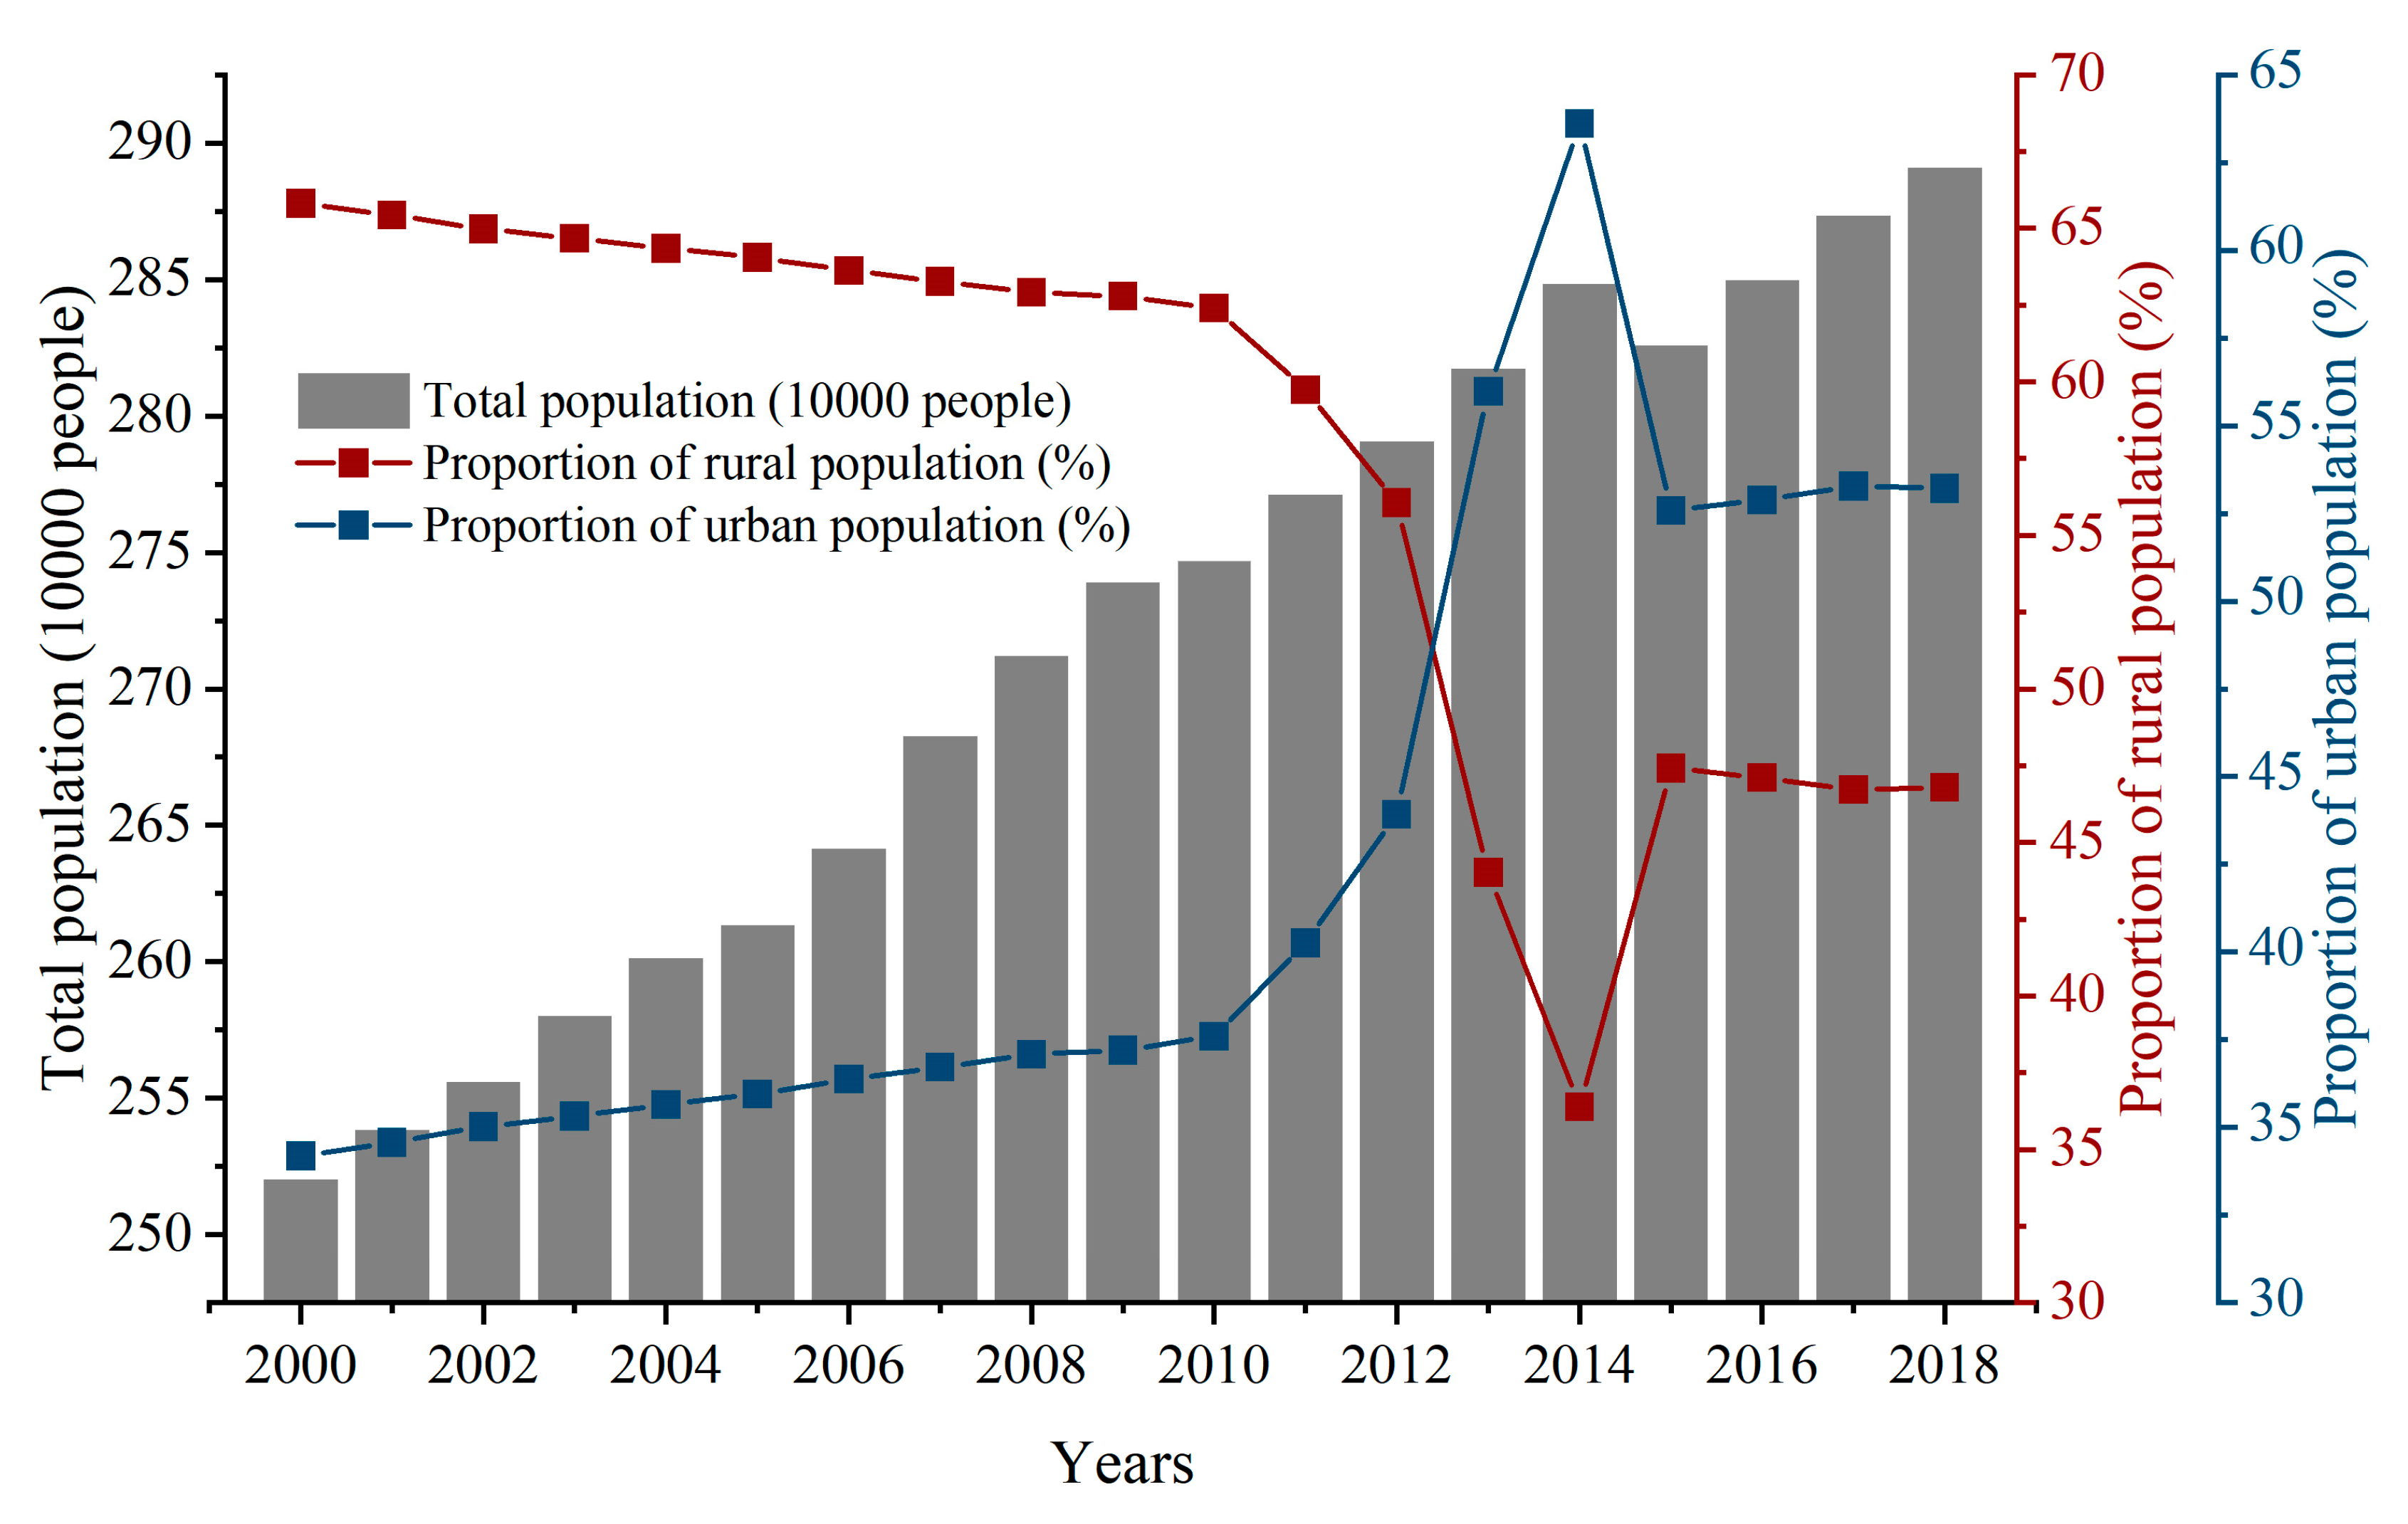
Figure 9.
Annual variations in the NDVI, annual average precipitation, and air temperature in the Huangshui River Basin during 2000 to 2018.
Figure 9.
Annual variations in the NDVI, annual average precipitation, and air temperature in the Huangshui River Basin during 2000 to 2018.

Table 1.
Farmland area in 2000 and 2018 and the changes between 2000 and 2018.
| County | Farmland Area (k ha) | Area Change (%) | Annual Change rate (%) | |
|---|---|---|---|---|
| 2000 | 2018 | |||
| Chengxi | 0.70 | 0.10 | −85.03 | −10.01 |
| Chengbei | 4.19 | 1.64 | −60.82 | −5.07 |
| Chengdong | 0.62 | 0.30 | −51.81 | −3.97 |
| Ledu | 31.67 | 17.23 | −45.59 | −3.32 |
| Chengzhong | 0.04 | 0.03 | −42.78 | −3.05 |
| Huzhu | 80.86 | 61.54 | −23.90 | −1.51 |
| Huangzhong | 90.78 | 69.85 | −23.05 | −1.45 |
| Huangyuan | 27.08 | 22.35 | −17.49 | −1.06 |
| Datong | 68.18 | 57.37 | −15.86 | −0.95 |
| Pingan | 16.04 | 14.61 | −8.91 | −0.52 |
| Total | 320.15 | 245.01 | −23.47 | −1.48 |
Table 2.
Relative variation rate (%) of the annual and monthly mean NDVI in the growing season during 2000 to 2018.
Table 2.
Relative variation rate (%) of the annual and monthly mean NDVI in the growing season during 2000 to 2018.
| Period | HRB | ER | BO | FR | UF | FL |
|---|---|---|---|---|---|---|
| Annual | 8.27 | 14.55 | 18.02 | 13.40 | 10.14 | 3.90 |
| May | 21.45 | 30.89 | 41.08 | 25.22 | 26.55 | 12.57 |
| June | 7.54 | 11.80 | 27.29 | 10.40 | 9.15 | 4.08 |
| July | 6.52 | 11.09 | 19.10 | 10.38 | 6.88 | 2.88 |
| August | 11.38 | 17.01 | 15.56 | 16.29 | 14.69 | 6.67 |
| September | 29.48 | 41.09 | 30.03 | 39.69 | 41.41 | 18.67 |
Publisher’s Note: MDPI stays neutral with regard to jurisdictional claims in published maps and institutional affiliations. |
© 2021 by the authors. Licensee MDPI, Basel, Switzerland. This article is an open access article distributed under the terms and conditions of the Creative Commons Attribution (CC BY) license (https://creativecommons.org/licenses/by/4.0/).
Share and Cite
MDPI and ACS Style
Wei, H.; Lu, C.; Liu, Y. Farmland Changes and Their Ecological Impact in the Huangshui River Basin. Land 2021, 10, 1082. https://doi.org/10.3390/land10101082
AMA Style
Wei H, Lu C, Liu Y. Farmland Changes and Their Ecological Impact in the Huangshui River Basin. Land. 2021; 10(10):1082. https://doi.org/10.3390/land10101082
Chicago/Turabian StyleWei, Hui, Changhe Lu, and Yaqun Liu. 2021. "Farmland Changes and Their Ecological Impact in the Huangshui River Basin" Land 10, no. 10: 1082. https://doi.org/10.3390/land10101082
Note that from the first issue of 2016, this journal uses article numbers instead of page numbers. See further details here.