Article

Conservation Priorities in Terrestrial Protected Areas for Latin America and the Caribbean Based on an Ecoregional Analysis of Woody Vegetation Change, 2001–2010

1
Center for Interdisciplinary Geospatial Analysis, Department of Geography, Environment and Planning, Sonoma State University, Rohnert Park, CA 94928, USA
2
Comité Científico, Revista, Perspectiva Geográfica, Grupo de Investigación Caldas, Programa de Estudios de Posgrado en Geografía, Facultad de Ciencias de la Educación, Escuela de Ciencias Sociales, Universidad Pedagógica y Tecnológica de Colombia, Bogotá 111321, Colombia
3
Fondo Patrimonio Natural para la Biodiversidad y Áreas Protegidas, Bogotá 110221, Colombia
4
Department of Geography, Human-Environment Dynamics Laboratory, University of California, Santa Barbara (UCSB), Santa Barbara, CA 93106, USA
*
Author to whom correspondence should be addressed.
Land 2021, 10(10), 1067; https://doi.org/10.3390/land10101067
Submission received: 29 August 2021 / Revised: 1 October 2021 / Accepted: 2 October 2021 / Published: 10 October 2021
(This article belongs to the Section Landscape Ecology)

Abstract

:
We determined protected area coverage and woody vegetation change in Latin America and the Caribbean at biome and ecoregion scales, for the years 2001 to 2010. For each ecoregion’s terrestrial protected area (TPA) and unprotected area, a linear regression of woody vegetation area against time (10 years) was used to estimate 2001 and 2010 woody vegetation, respectively. We calculated a conversion-to-protection index, termed the Woody Conservation Risk Index, and identified trends in relation to existing conservation priorities. As a whole, the region lost 2.2% of its woody cover. High woody cover loss was observed for the Moist Forests (3.4% decrease) and the Flooded Grasslands/Savannas (11.2% decrease) biomes, while Mediterranean Forests exhibited a 5.8% increase. The Dry Forest Biome, the most threatened biome worldwide, experienced a 2% regional gain, which was surprising as we expected the opposite given a net regional loss for all biomes. Woody cover was more stable in TPAs in comparison to areas with no protection. Deforestation inside and surrounding TPAs remains high in humid ecoregions. High overall ecoregion deforestation, with stable TPAs, characterized some Amazonian ecoregions, the Dry Chaco, and moist forests on the eastern Andean foothills of Ecuador and Peru. Woody regrowth inside and outside of TPAs was observed in the Sonoran-Sinaloan transition subtropical dry forests and the Sierra Madre Occidental pine-oak forests in Mexico.

1. Introduction

Ecoregions represent essential geographic units for conservation planning at continental and global scales [1]. Population pressures and climate change are increasing pressures on global biodiversity priority areas [2] and habitat loss due to land use change is probably the single most important factor threatening biodiversity conservation in terrestrial ecoregions [3,4]. In an analysis of the world’s terrestrial ecoregions at greatest extinction risk, Hoekstra et al. [5] found that habitat conversion exceeded habitat protection by a ratio of 10:1 in more than 140 ecoregions globally. In this paper, we address a slightly higher number of ecoregions for the Latin America and the Caribbean (LAC) region, 148, as will be explained below. Biodiversity hotspots coincide with places where biodiversity is most threatened by habitat destruction due to a combination of high demand for land conversion and insufficient protection [6]. The LAC region contains about half of the world’s remaining tropical forests, but tension between conservation and natural resource extraction is a common denominator across LAC’s forest landscapes [7,8,9,10,11]. LAC’s forests and its associated biodiversity and ecosystem services are in peril due to agriculture, poverty, population, and economic growth, lack of political will, inequality, among other factors [12,13,14]. However, after decades of deforestation and subsequent ecological succession, secondary forests are becoming ubiquitous in the region. These forests can be highly productive and resilient [15]. Many LAC ecoregions have been identified by ecologists as having high conservation priority due to elevated habitat conversion, high biodiversity and endemism, and their importance for the conservation of ecosystem services such as carbon storage [16] and watershed protection [1].
Given limited resources, efficient targeting of ecoregions in conservation strategies may usefully link regional to global, as well as local to national scales of planning vis-à-vis the current and future feasible portfolio of protected areas. Even modest additional funding allocated judiciously can yield high dividends towards enhancing biodiversity conservation as well as ecosystem services. Several authors have shown how reserve planning can limit conversion pressures [17,18]. Some findings strongly suggest the importance of enforcement of park boundaries and community buy-in for achieving conservation outcomes. For example, Bruner et al. [19] assessed the impacts of anthropogenic threat on 93 Terrestrial Protected Areas (TPAs) in 22 tropical countries. They found that the majority of parks successfully arrest land conversion and, to a lesser degree, mitigate logging, hunting, fire, and grazing. The authors conclude that park effectiveness is significantly related to park enforcement, boundary delineation, and compensation to local communities. However, less well understood is how to effectively prioritize targeted regional biome conservation given limitations in resources for park conservation. Therefore, in this paper, we study the role of protected areas in conservation in light of global conservation priorities. This issue has become more relevant in a rapidly globalizing world. Scholars are increasingly researching, for example, how global and regional ecosystem planning can match the spatial extents of the biomes they intend to protect [20,21]. Related to this is the search for a more effective paradigm for categorizing regional biome conservation [22]. Gap analyses have questioned the effectiveness of current protected area coverage globally for maximizing species diversity conservation and have uncovered priority areas for expanding protected areas [23]. Interactions among distant regions are increasingly influential in a rapidly integrated globalizing economy, with potentially large implications for sustainability. Liu and colleagues [24] therefore suggest that a telecoupling framework which takes into account that such interconnection can help enhance systemic and local sustainability with potentially rich implications for policies targeting livelihood and ecological sustainability from regional to global scales. Conservation planning that integrates pattern (compositionalist) and processes (functionalist) approaches may be crucial in improving dual human and ecological sustainability across spatial scales [25]. Reconciling spatial incongruities from regional to global scales serves not only biodiversity conservation but can also potentially help reduce poverty [6] and facilitate the efficient allocation of land towards food production [26] and carbon emission reduction [27].
Trends in land cover change, however, differ dramatically depending on environmental and socioeconomic characteristics, that in turn vary among ecoregions and biomes. For example, in LAC between 2001 and 2010, Aide et al. [28] estimated that, while woody vegetation loss affected 540,000 km2, woody vegetation regrowth occurred in 360,000 km2. The geographic segregation of deforestation and forest regrowth implies that, while some ecoregions are becoming more threatened, others are becoming less so (e.g., [29]). The risk of biodiversity loss will depend as much on these trends as on the level of conversion at one particular time. In addition, TPAs vary significantly in their efficiency to prevent land use change [30]. Therefore, an assessment of ecoregion conservation risk requires an analysis of trends in land-cover change both outside and inside TPAs, with a consistent methodological approach. In this study, we analyze conservation risk at the ecoregion level among biomes of LAC with woody cover. Our study is particularly important to the science and conservation communities since the Neotropics have relatively high species diversity and contain the largest remaining wilderness areas of the world [31]. For consistency in analysis and multi-scale planning, it is important to analyze woody cover trends at ecoregion to biome scales. Furthermore, considering that protected areas cover only a fraction of LAC, it is wise to assess the woody cover dynamics both inside and outside TPAs. Thus, our null hypothesis, Ho, is that woody cover inside and outside TPAs did not change between 2000 and 2010.
The specific objectives of this study are to:
(1)
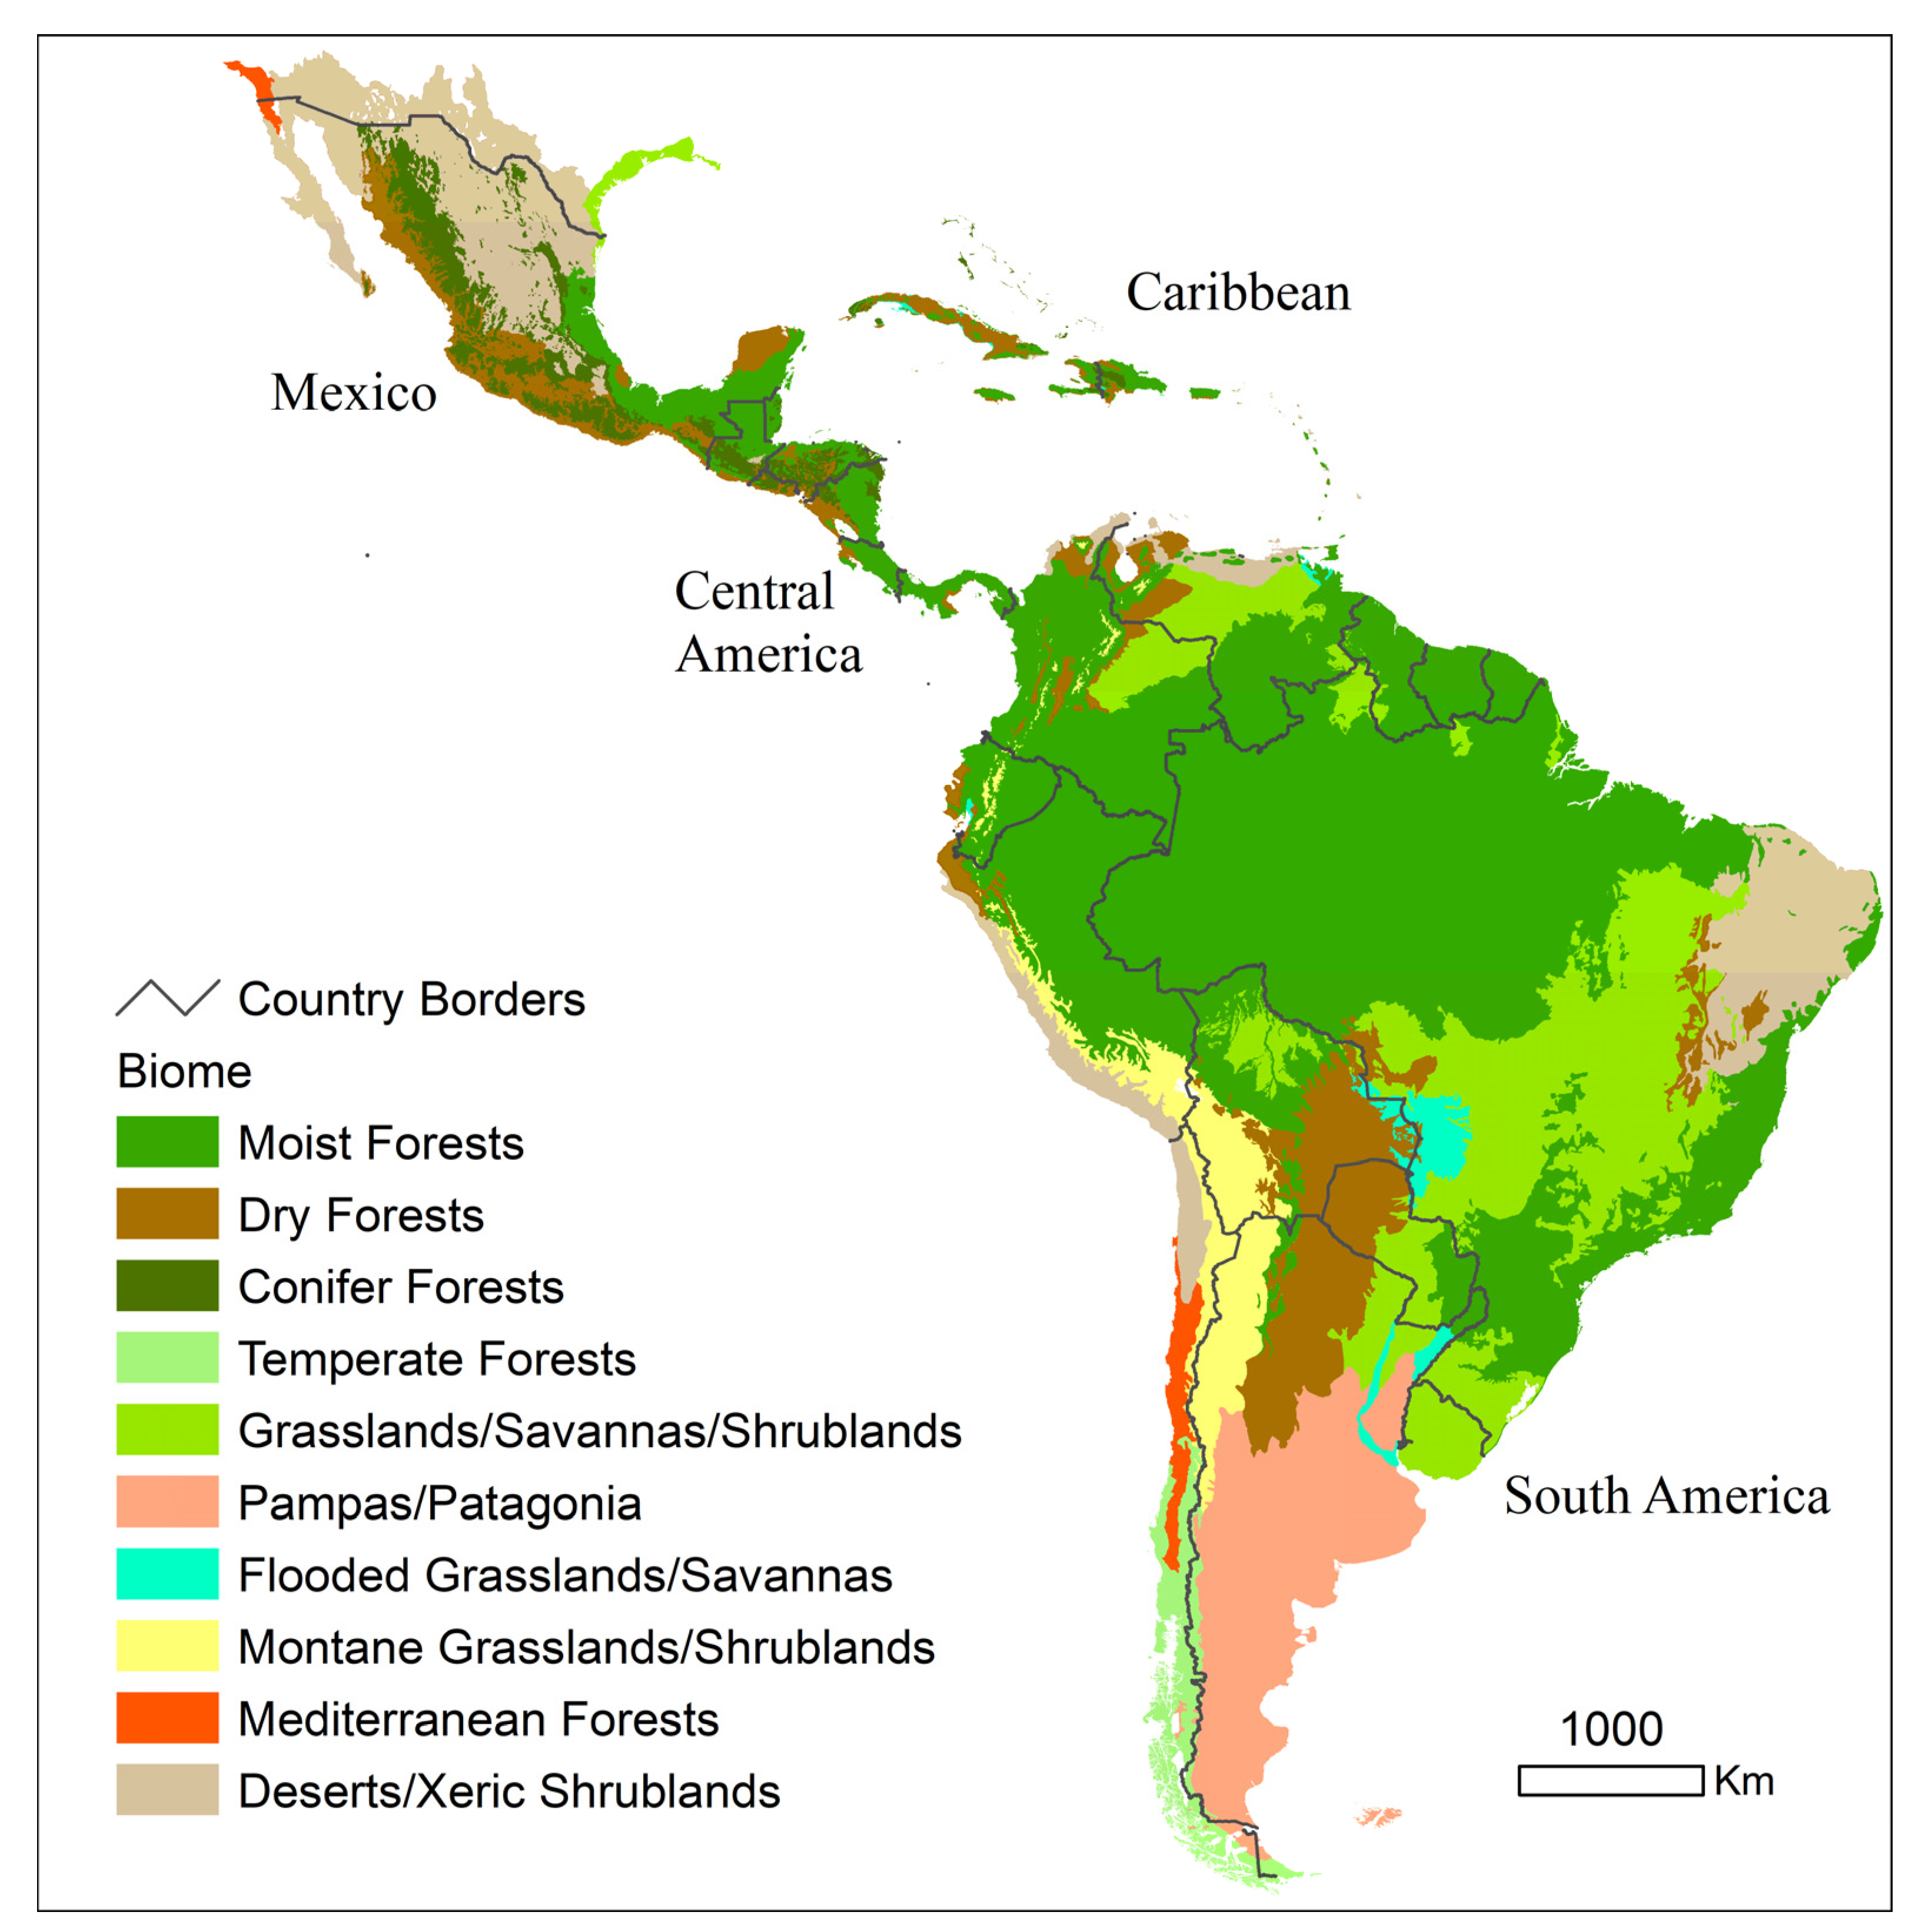
To summarize the coverage of TPAs in LAC at biome and finer-scale ecoregion levels.
(2)
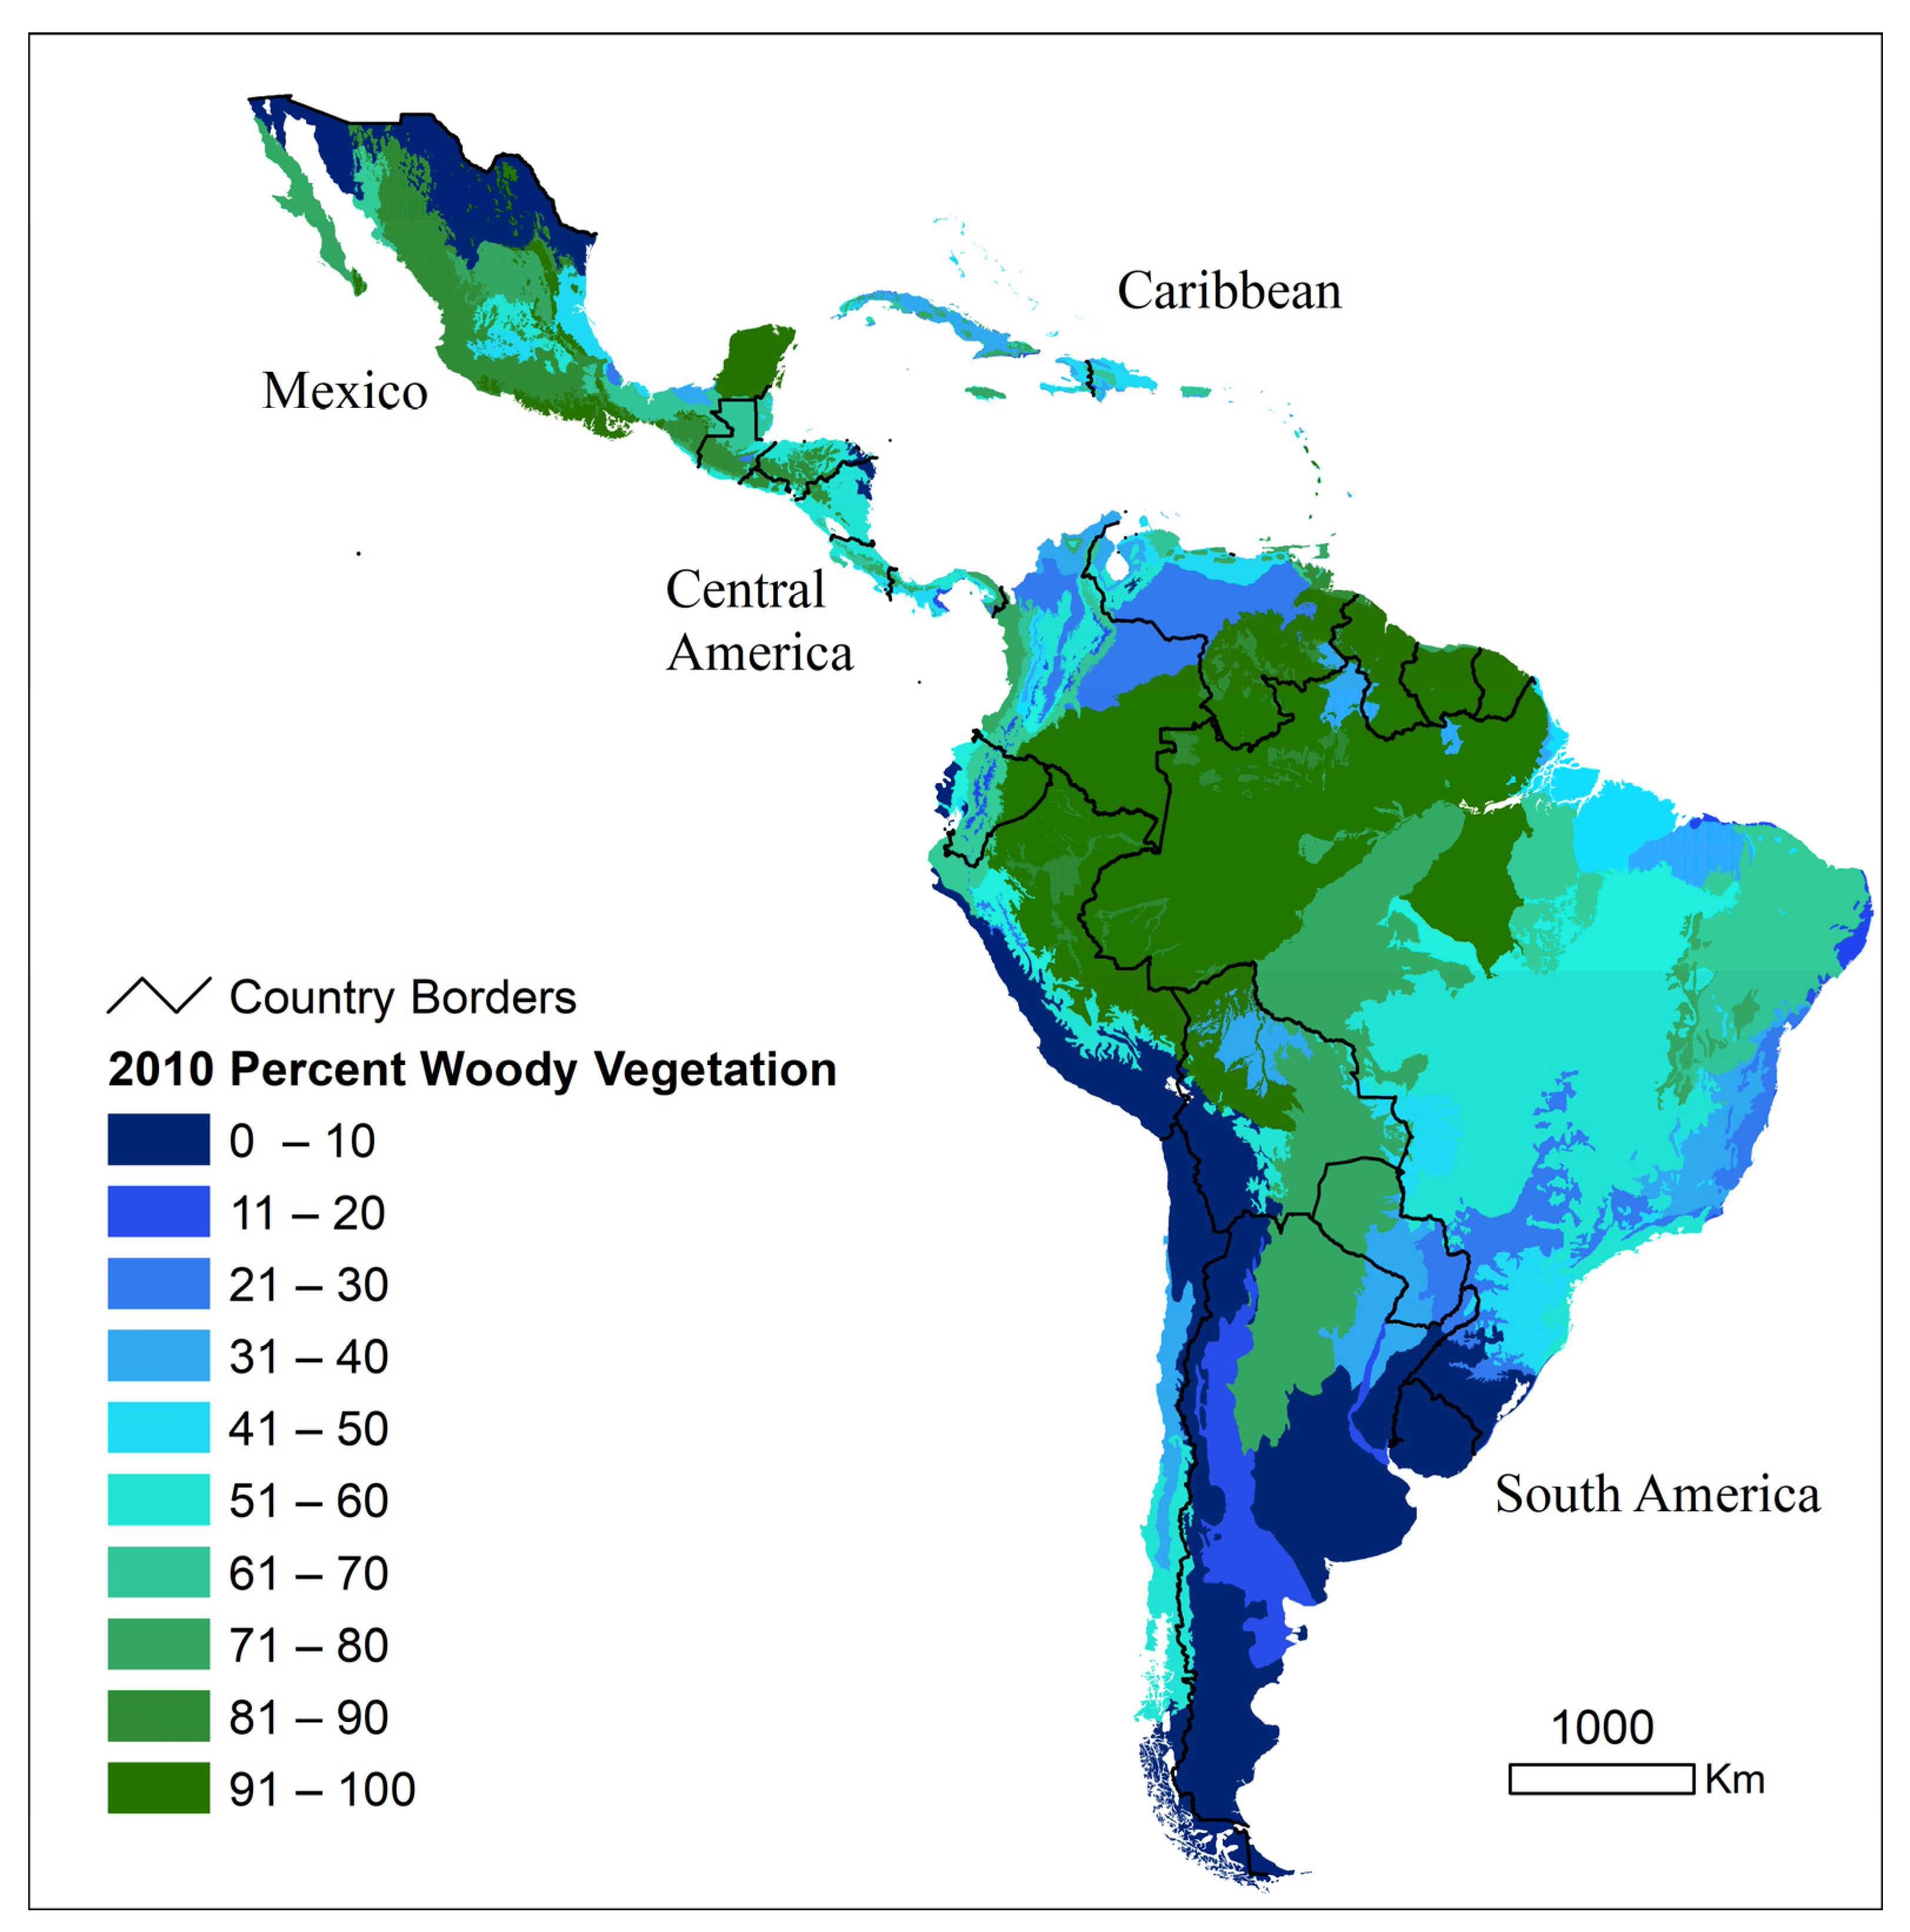
To summarize the 2001 and 2010 extent of woody vegetation in LAC biomes and ecoregions within and outside of TPAs and compare changes of woody vegetation in this period.
(3)
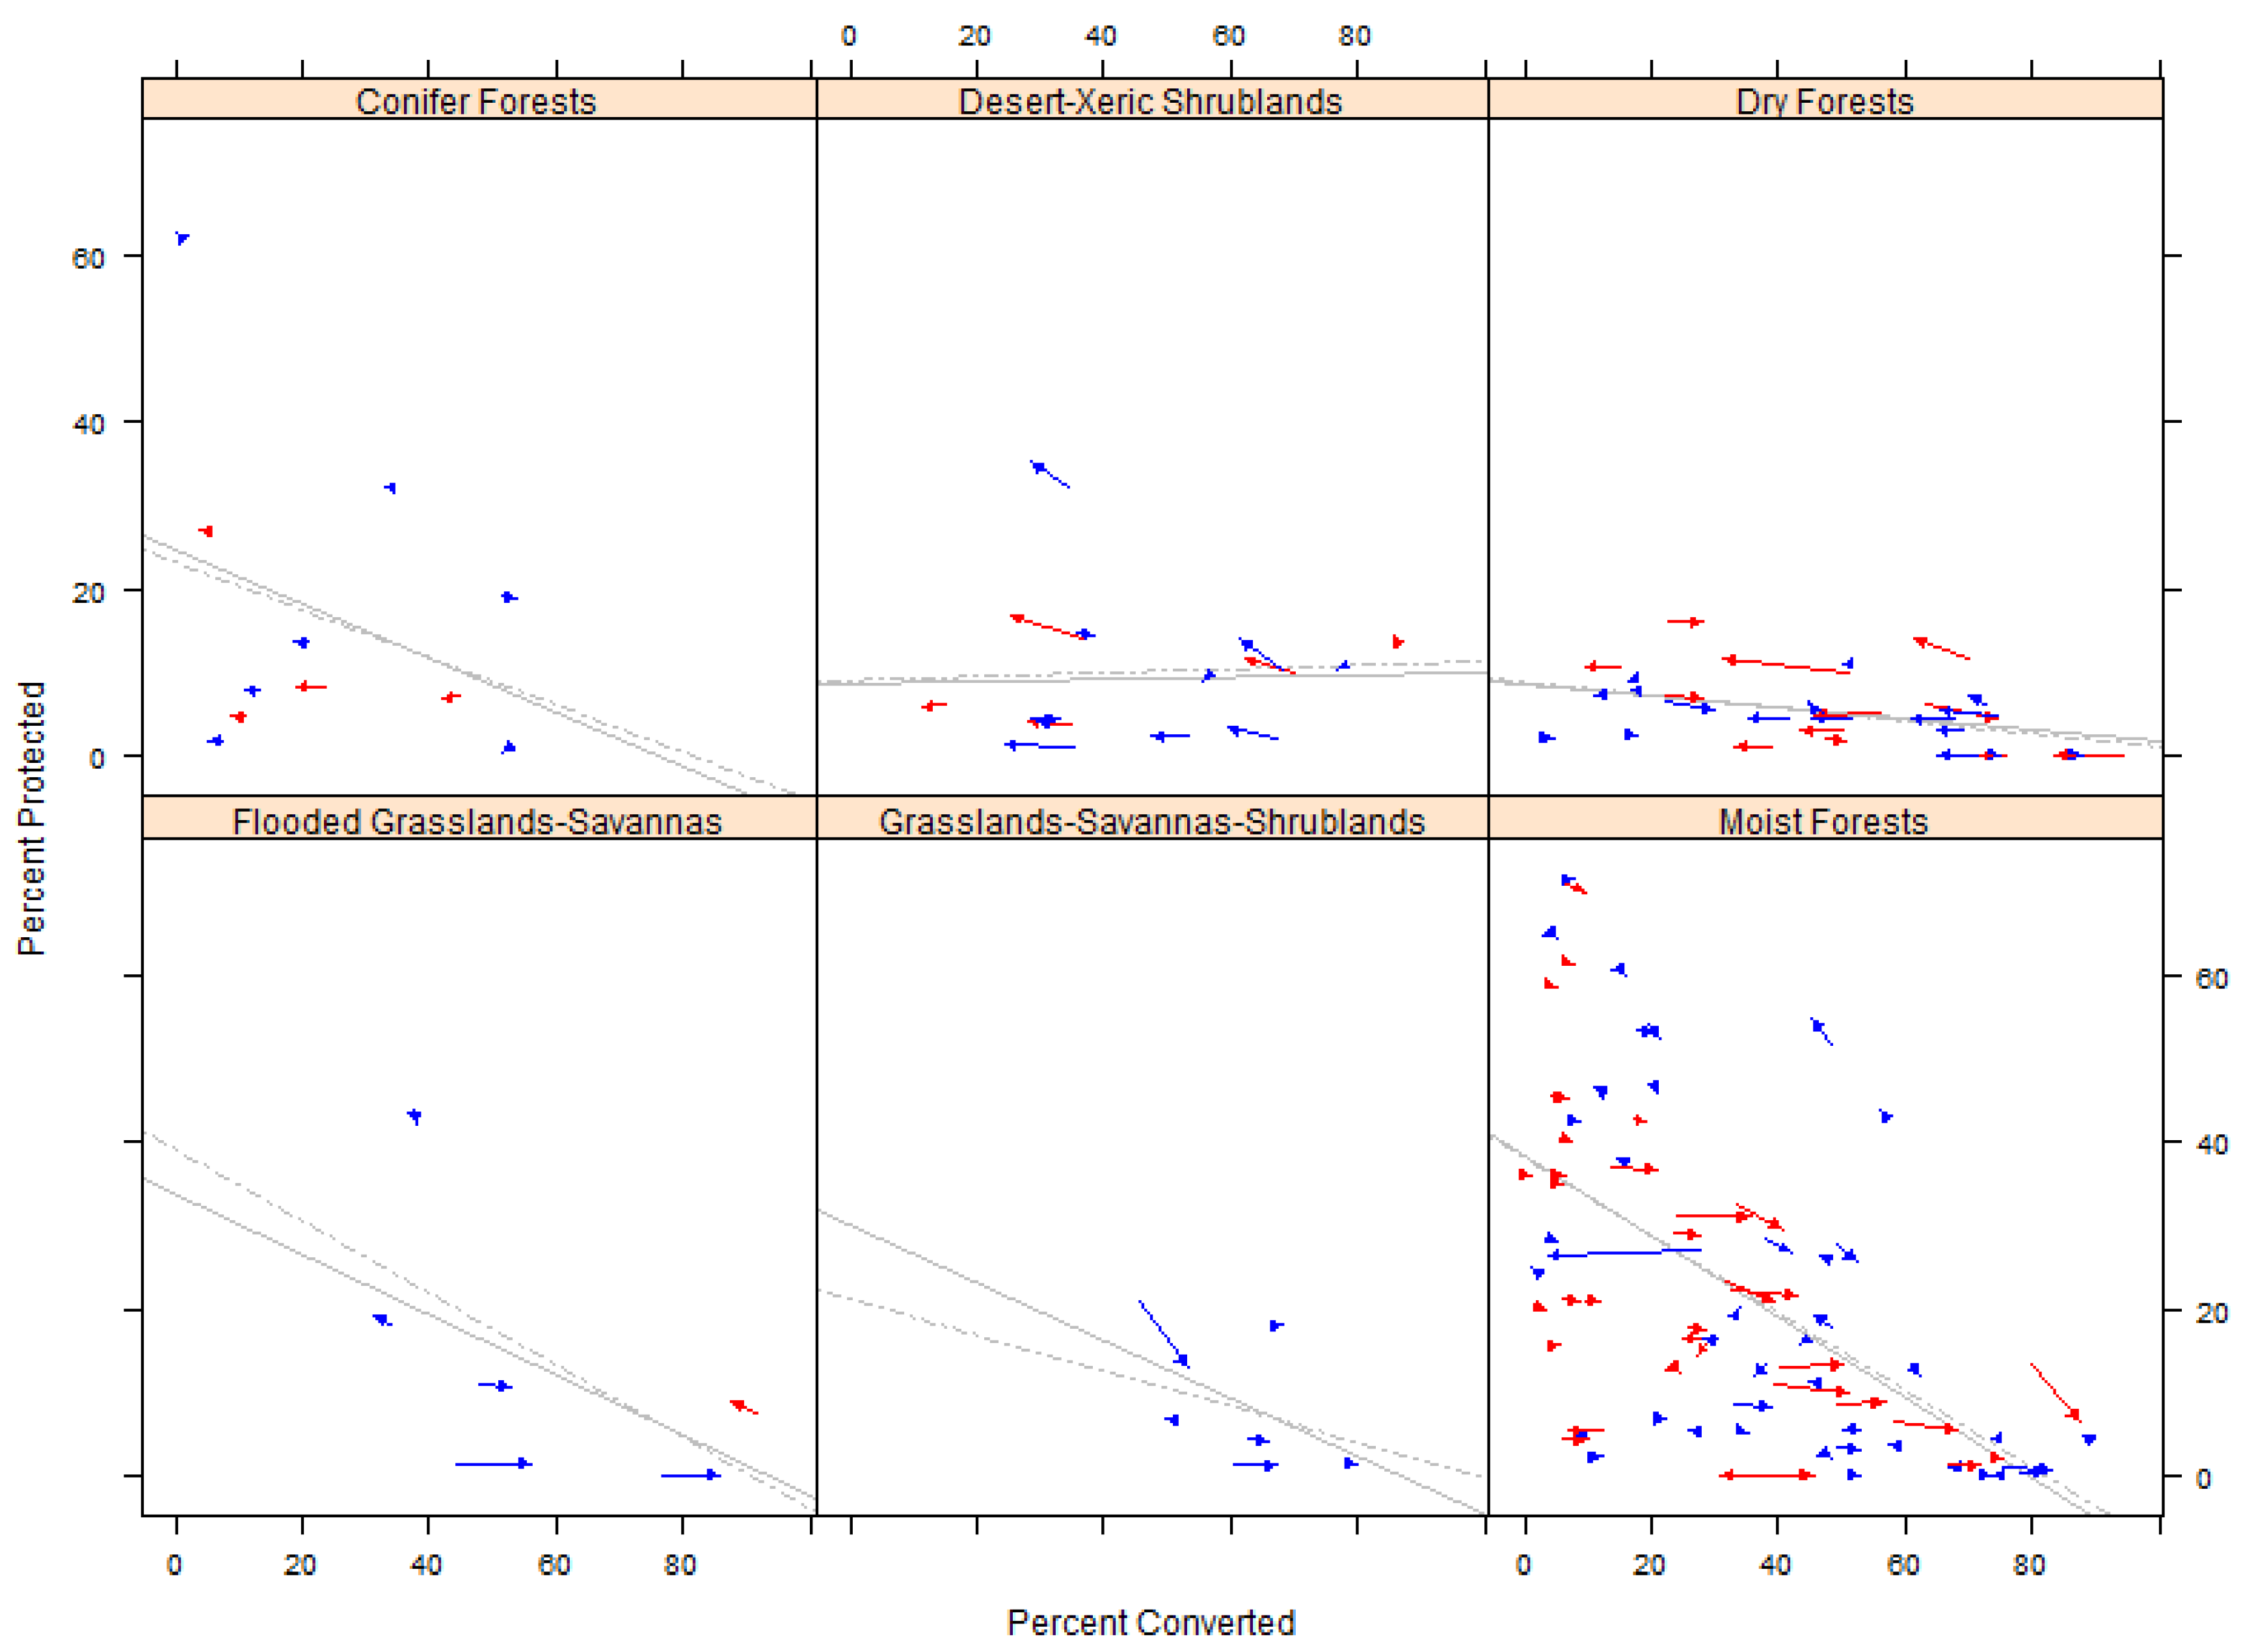
To estimate and analyze the changes in conservation “risk” among ecoregions with woody cover based on rates of woody cover change and TPAs.
(4)
To discuss regional trends in relation to published global conservation priorities.

2. Materials and Methods

2.1. Study Area

Our study area included the Caribbean islands and continental America south of the Rio Grande. This area comprises ten biomes, or areas of similar climate and vegetation (Figure 1; Table 1), excluding the relatively small Mangrove and Temperate Conifer biomes. In turn, LAC biomes can be subdivided into 173 terrestrial ecoregions as defined by the World Wildlife Fund [32] (see Supplemental Figures S1–S4). In other words, ecoregions are defined as relatively large geographic units that encompass a particular assemblage of species, communities, and environmental conditions, with borders that approximate the original extent, prior to the change in land use.

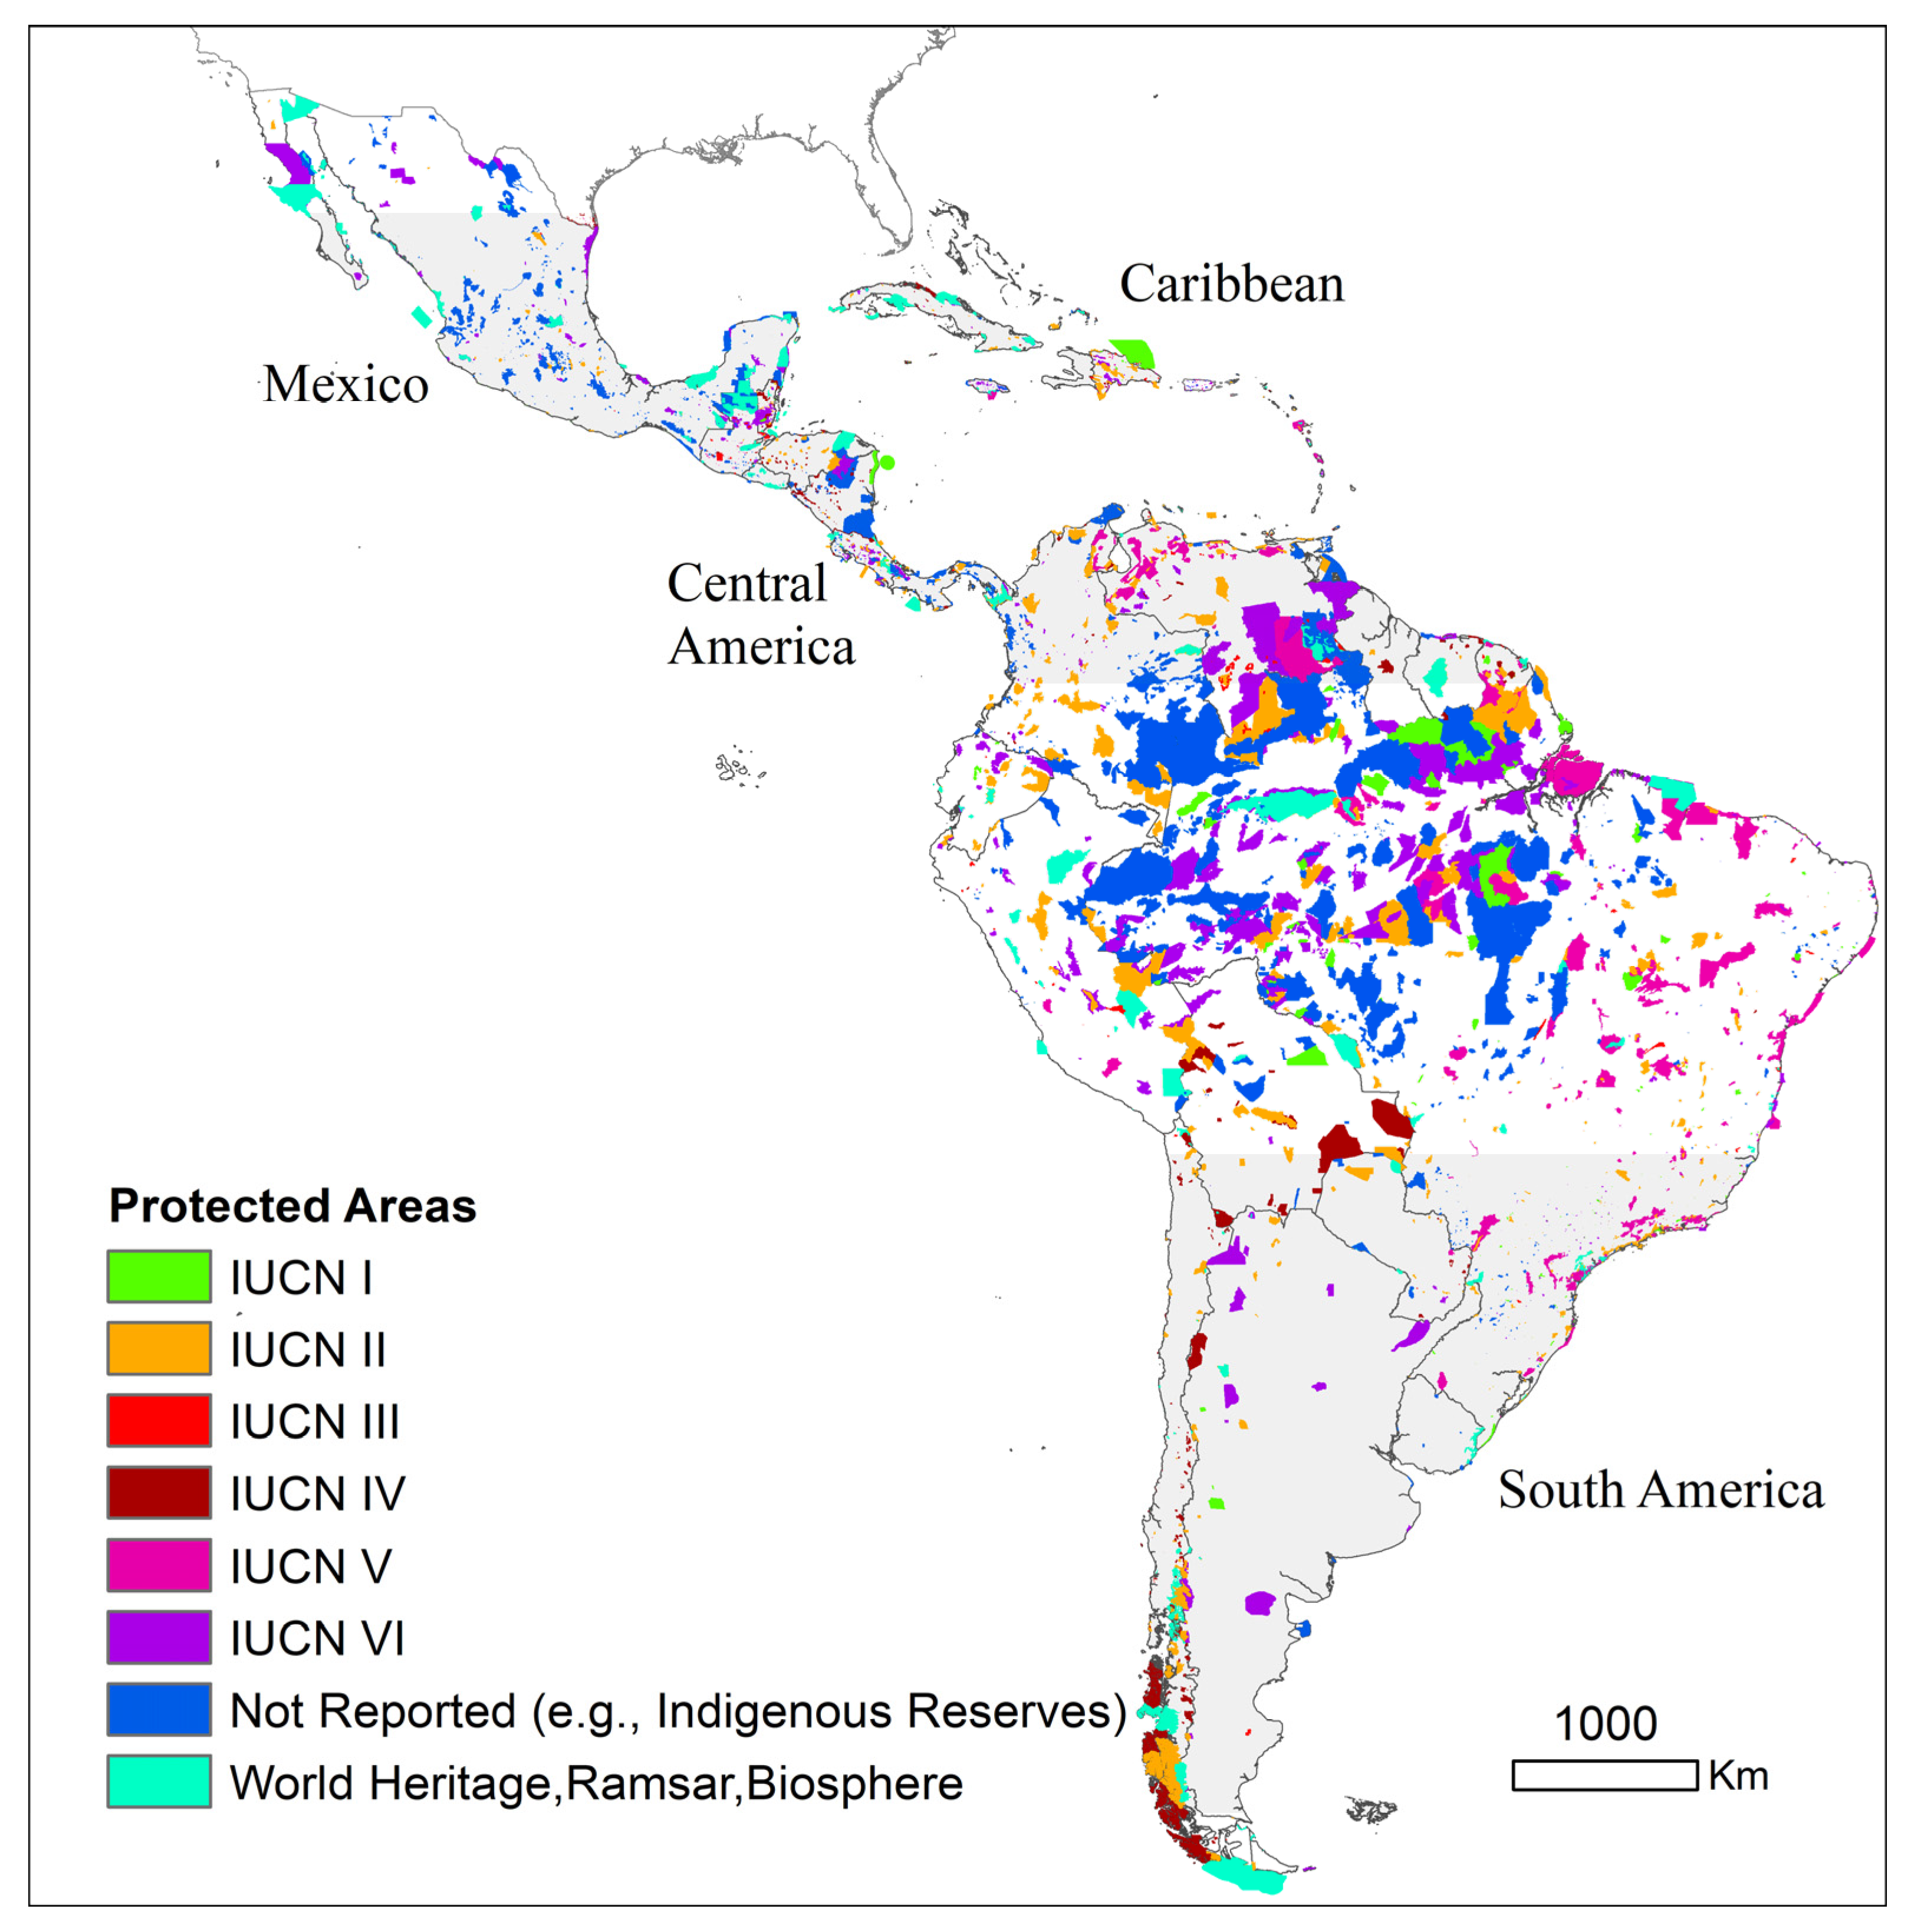
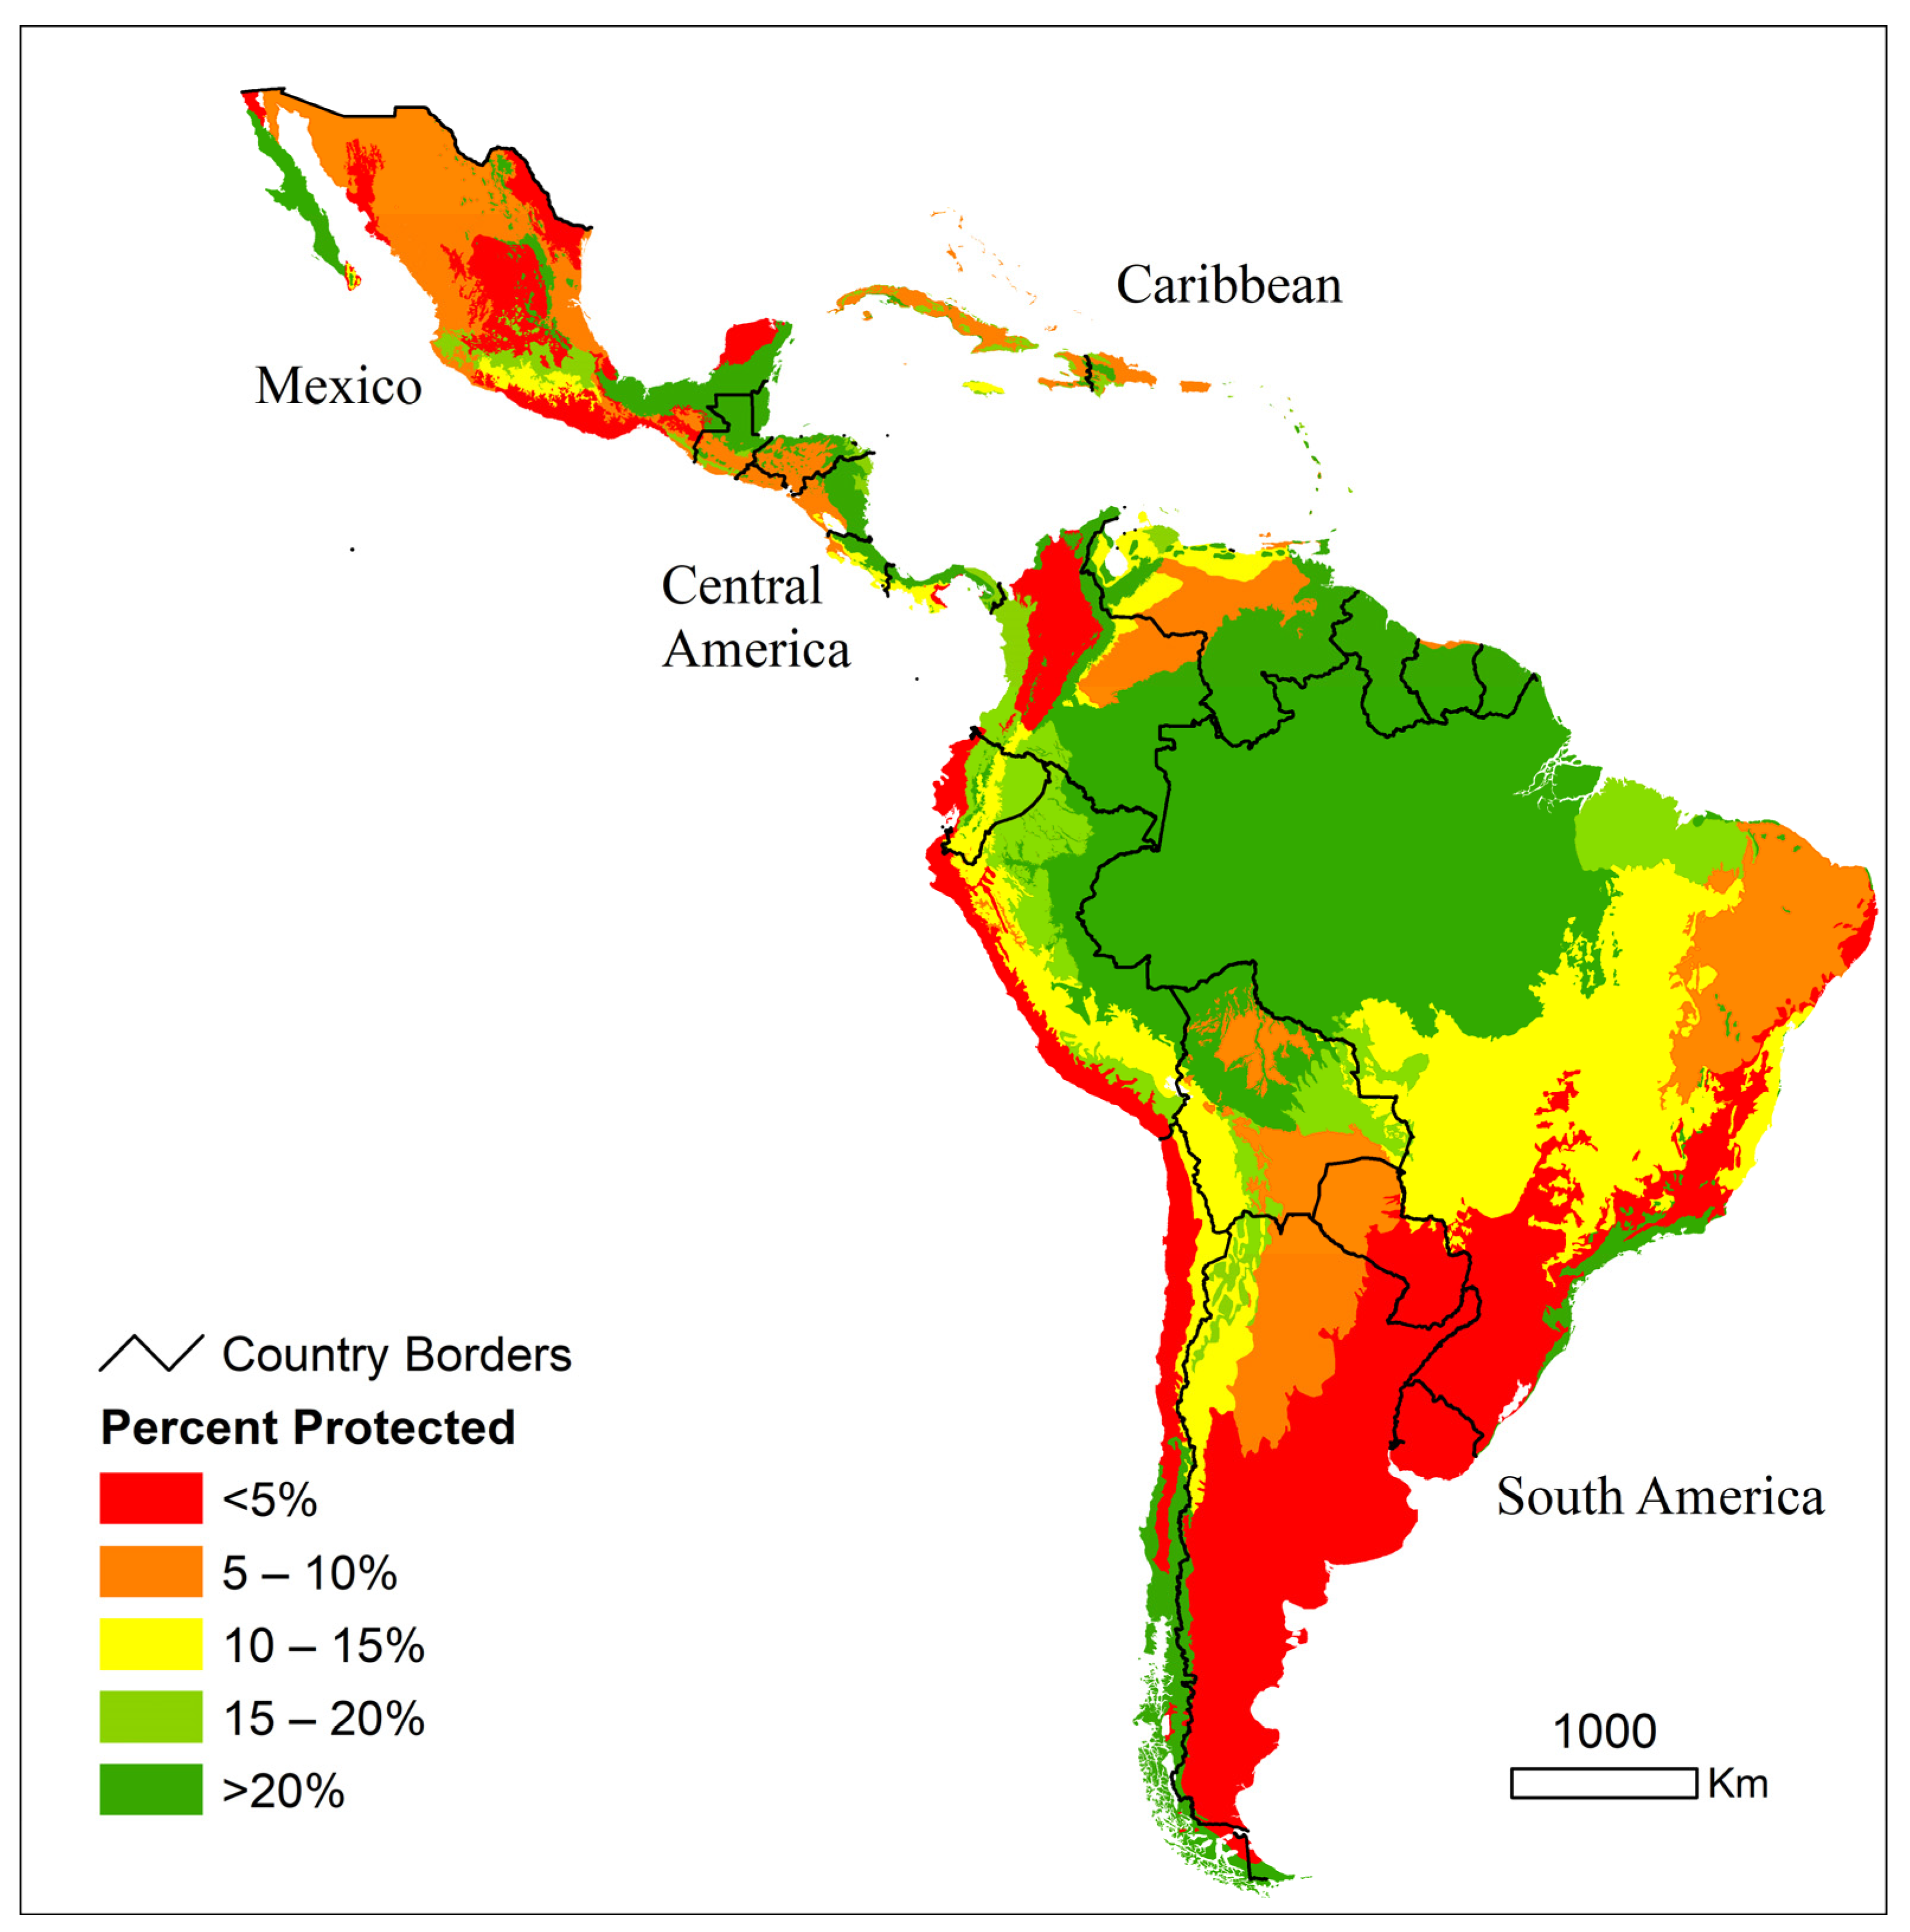
2.2. Terrestrial Protected Areas Analysis

Data on TPAs came from the World Database on the Protected Areas (WDPA) polygon GIS layer (IUCN and UNEP-WCMC, 2012), designated as of September 2012. Although 2021 WDPA data are available, we used this older version to more closely align with the timeframe of our land-cover data (2001–2010). We assume that a substantial change in protected areas has not occurred since 2010. Figure 2 shows the management categories of TPA considered: IUCN I (Ia. strict nature reserve; Ib. wilderness area), IUCN II. (National park); IUCN III. (Natural monument or feature); IUCN IV. (Habitat/species management area); IUCN V. (Protected landscape/seascape); IUCN VI. (Protected area with sustainable use of natural resources), Not IUCN category (e.g., Ramsar wetland of international importance, UNESCO World Heritage Site, UNESCO-MAB Biosphere Reserve), and “unreported” category (e.g., indigenous reserves). Some TPA polygons overlapped in space, for example, a national park inside a larger biosphere reserve. Finally, proposed TPAs were removed from our analysis (Figure 2).
Given findings that an IUCN category does not predict the level of protection from land-cover change or fire [33], as well as lack of complete categorization in WDPA, we opted to treat all TPAs as one category. In that sense, our analyses about the protection level of ecoregions and biomes will be referred to as protected and unprotected areas (inside/outside TPAs). For each biome and ecoregion, we summarized the areas inside and outside protected areas designated as of September 2012.

2.3. Ecoregion-Level Analysis of Woody Vegetation Change within and outside of TPAs

We used annual land-cover maps covering all of LAC that we derived from Moderate Resolution Imaging Spectroradiometer (MODIS; modis.gsfc.nasa.gov) satellite imagery at a 250-m pixel spatial resolution for years 2001 to 2010. A detailed description of map production methods and regional accuracy is found in Clark et al. [35]; however, here we provide a brief description. We produced maps using a tree-based, non-parametric classifier Random Forests, developed by Breiman [36], that we trained and tested with reference samples that were photo-interpreted from Google Earth imagery (https://earth.google.com/web/ (accessed on: 3 October 2021) at a finer spatial resolution. Random Forests is an analytical tool for classification and regression that uses random combinations of both variables and observations to create multiple decision trees.
There were 26 separate map regions defined by biomes [32] with borders modified to align with municipalities. These maps were mosaicked together prior to further analysis. Our land-cover maps had seven classes defined by areas with more than or equal to 80% cover of woody vegetation (trees and shrubs), herbaceous vegetation (pastures and grasslands), agriculture (annual crops), plantations (perennial agriculture), built-up areas (man-made or artificial structures), bare areas (exposed soil, rock), and water (lakes, large rivers). Areas with woody vegetation mixed with bare areas, herbaceous vegetation, or agriculture, all with less than 80% cover, were assigned to a mixed-woody vegetation class. Overall accuracy of these maps was 80.2 ± 8.1% for this eight-class scheme (see [35]). For the purposes of this study, we reclassified the maps prior to analysis by combining woody vegetation and mixed-woody vegetation into a single “woody vegetation” class (i.e., pixels with >20% cover of trees and shrubs) and all other classes into an “other” class. Across the 26 map regions, this binary woody/other map had an average overall accuracy of 90.7% ± 3.8% (minimum = 82.7%, maximum = 98.4%).
We summarized the area of woody vegetation within protected and unprotected areas of each ecoregion for each year from 2001 to 2010. For each ecoregion’s protected or unprotected areas, a linear regression of woody vegetation area (dependent variable) against time (independent variable, 10 years) was conducted, similar to our municipality-scale methods in Clark et al. [35]. If more than 1% of the analytical area had pixels mapped as “No Data” for a given year, then the data for that year were removed from the regression model. Regression models were fit only for ecoregion areas that had three or more years with valid area data. Absolute areas of woody vegetation in protected and unprotected areas were calculated for 2001 and 2010 using estimates from the respective linear regression models developed for each ecoregion. Regression models with a slope p of 0.10 were considered significant when analyzing ten-year trends in woody cover within and outside of TPAs. Regression estimates of woody vegetation for 2001 and 2010 were used in our analysis, rather than an area of classified pixels from respective 2001 and 2010 maps, as a means to reduce error; that is, 10 years of land-cover maps were used to estimate the start and end area of woody vegetation rather than just two single maps.

2.4. Calculation of the Woody Conservation Risk Index (WCRI)

For each ecoregion and year (2001 and 2010), we calculated a conversion-to-protection index, which we call the Woody Conservation Risk Index (WCRI), as the percent of an ecoregion’s woody vegetation area (unprotected and protected) that was converted (i.e., not woody) relative to the percent of the ecoregion area with protected woody vegetation and using year 2010 WDPA boundaries. Table S1 gives a detailed description of this calculation. The maximum WCRI was set to 100% for ecoregions but not for Biomes. This was justified because the percent converted could be over-estimated due to the underlying error in the land-cover maps in our regression models magnified by the small area of the ecoregion. The WCRI is inspired by the Conservation Risk Index (CRI) used by Hoesktra and colleagues [5] in their global assessment of ecoregions and biomes at a risk of biodiversity loss. In that study, CRI was calculated as the percent area of biome area converted by humans (cultivated, managed, or artificial surfaces) by the year 2000, relative to the percent of biome area that was protected, regardless of its land cover (i.e., not excluding converted parts of TPAs). Note that Hoekstra and colleagues [5] used a modified version of the Global Land Cover (GLC) 2000 map products for South and North America with 1-km pixels, and treated herbaceous cover, shrublands, and forests as natural vegetation. In contrast, our maps were produced at the 250-m resolution and our woody vegetation class is similar to combining the forests and shrublands classes in GLC (excluding herbaceous cover). Biomes and ecoregions with less than 10% woody cover were not considered in our 2001–2010 woody change analysis, leaving 148 ecoregions of the original 173 (Table 1).

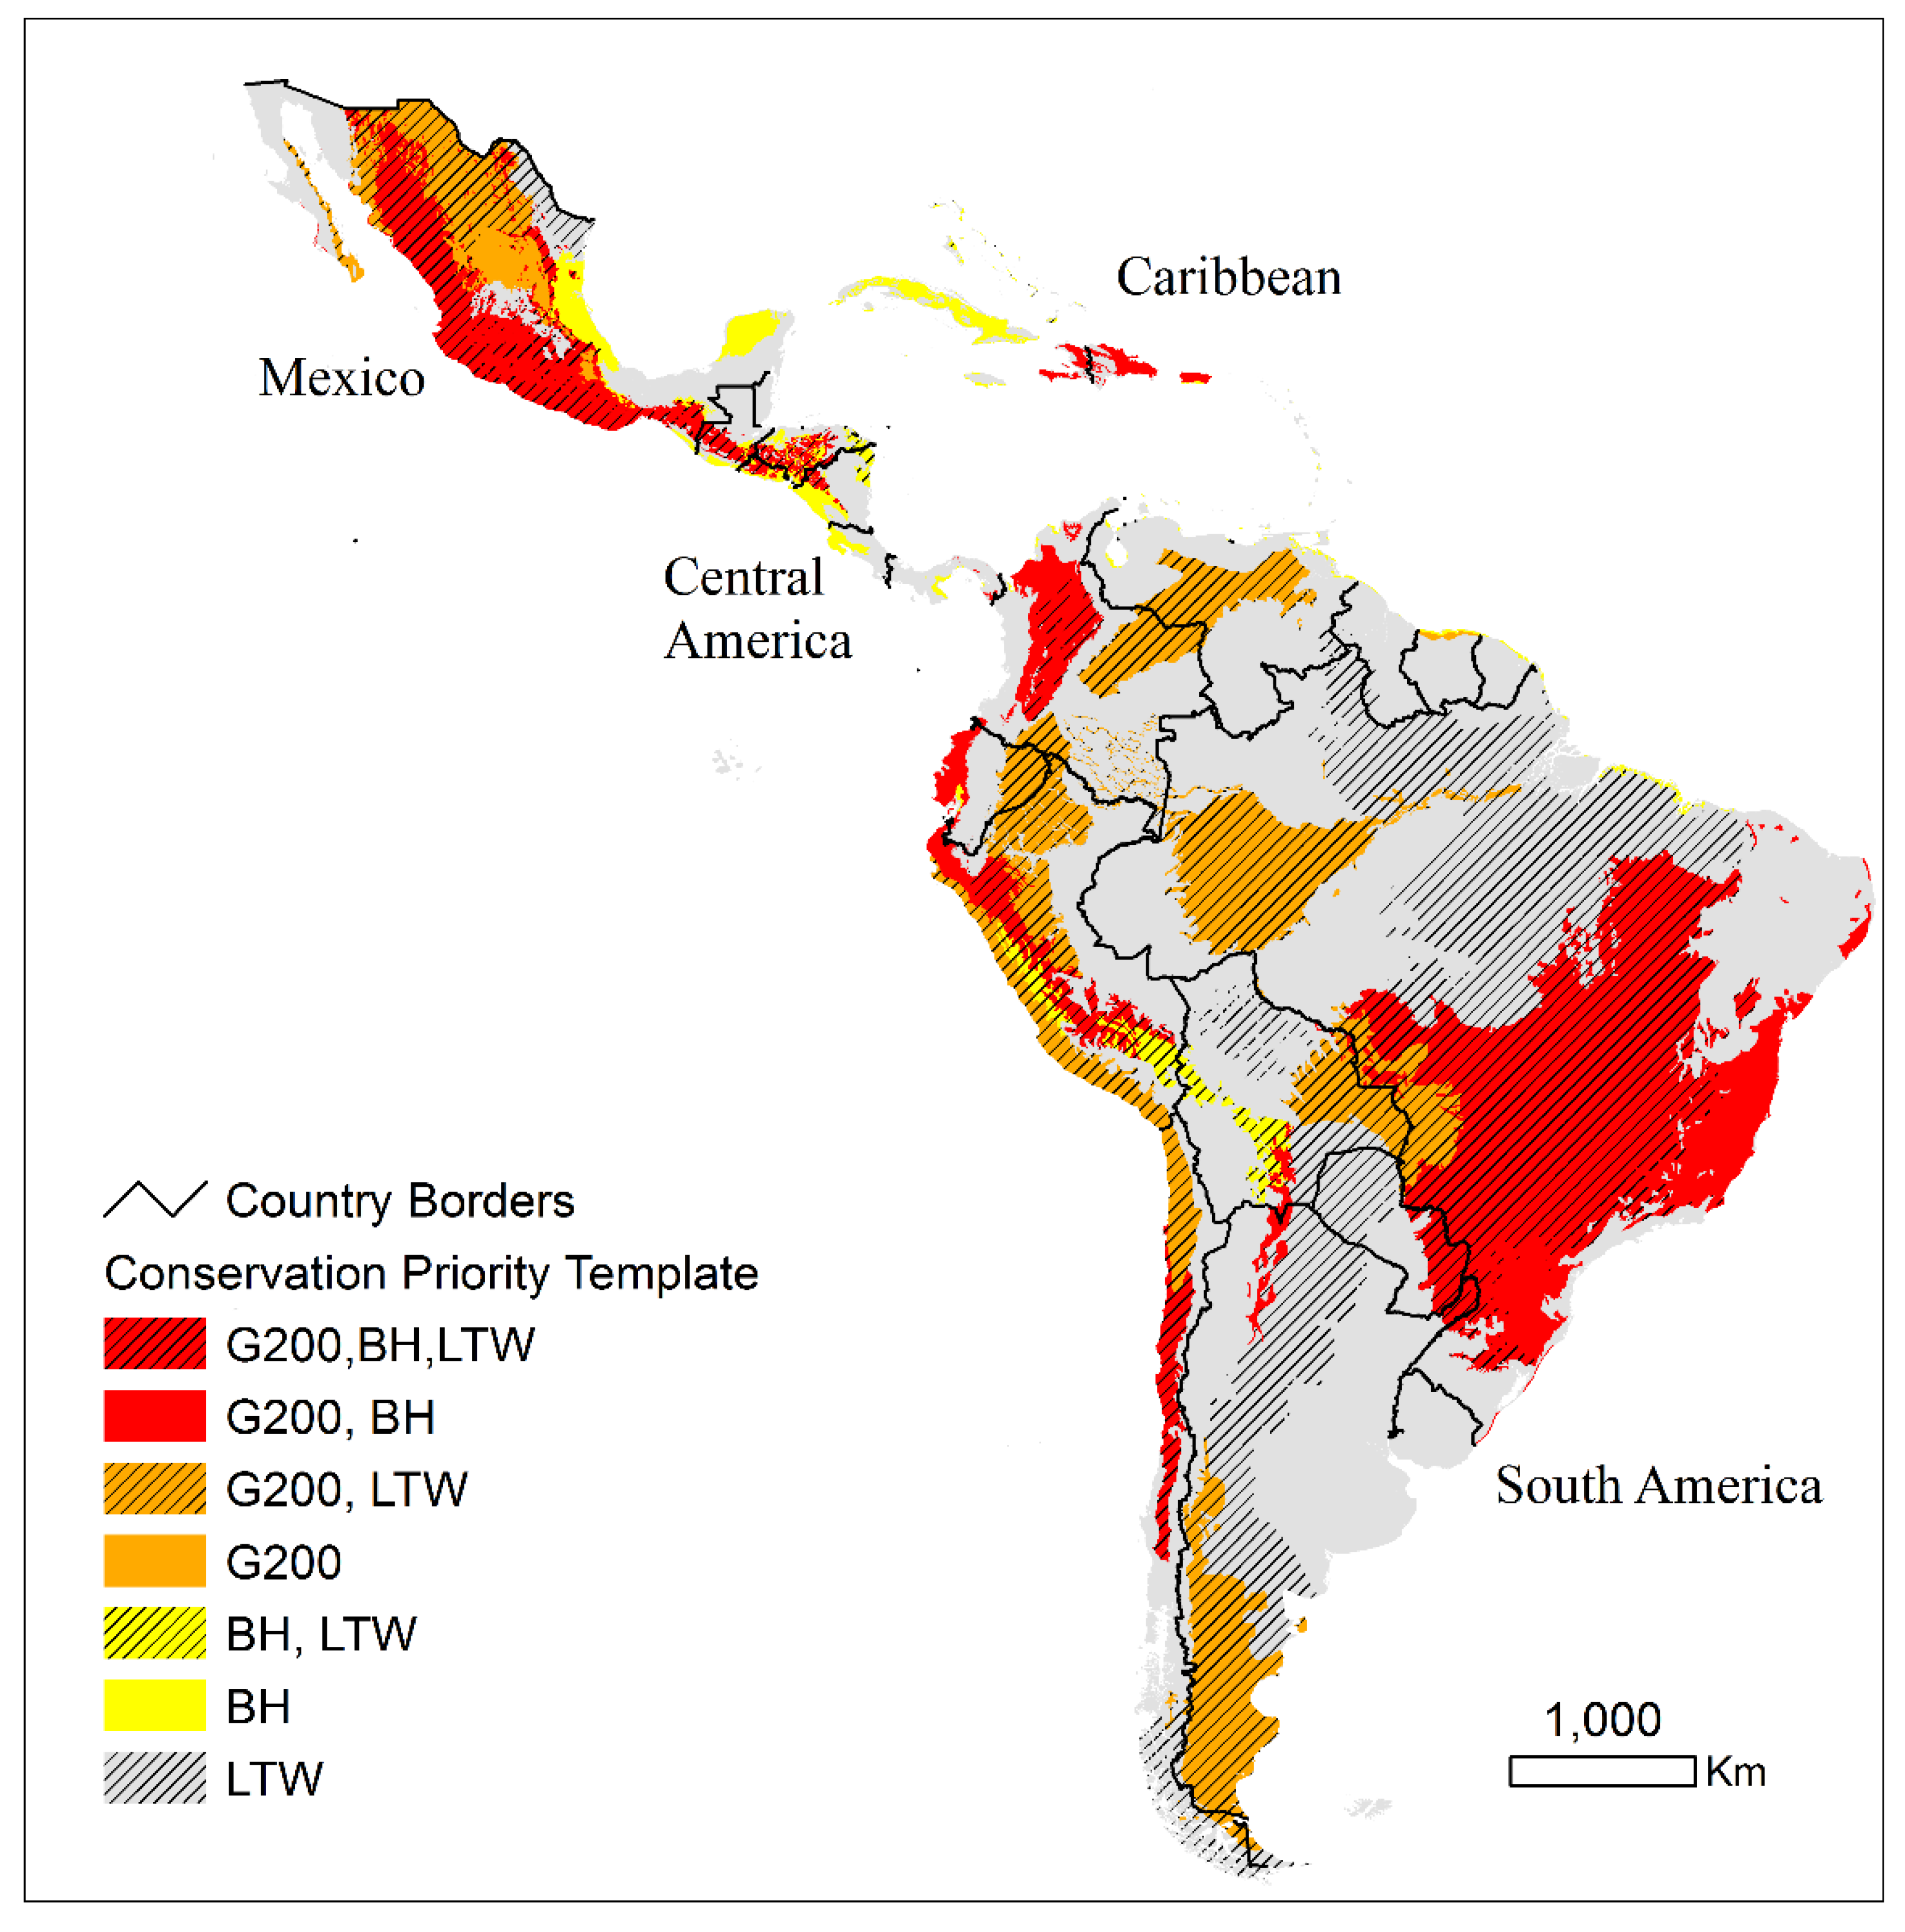
2.5. Analyses of Trends in Relation to Existing Conservation Priorities

To broaden the context to our analysis of woody vegetation in ecoregions for conservation goals, we used data summarized by Soutullo and colleagues [37] that links ecoregions to one of three global conservation templates (Figure 3): “Biodiversity Hotspots”—BH [38], “Global 200”—G200 [39], and “Last of the Wild”—LTW [40]. These templates differ in their goals and ranking criteria, but together cover three main ways of conservation prioritization [41], finding those that are highly vulnerable (e.g., habitat loss, protection level), irreplaceable (e.g., endemism, rarity, species richness, uniqueness) or have low vulnerability (e.g., areas with low human footprint, wilderness). The BH ecoregions have high vulnerability and irreplaceability, G200 ecoregions have irreplaceability, and LTW ecoregions have a low vulnerability.

3. Results

3.1. TPAs in Biomes and Ecoregions

We first summarize patterns of TPAs by biomes and ecoregions, without considering land cover. There were 5373 TPAs polygons in the WDPA database that covered a total of 5,283,973 km2, but with overlap removed, the actual surface area covered by TPAs was 4,129,697 km2 or 19.8% of LAC (Figure 2; Table 2).
Of the 173 ecoregions analyzed, 99 (57%) had 10% or more of their area in a protected area (Table 3). Moist Forests had the most ecoregions, and 76% of these had over 10% area protected (Table 3). Moist Forest ecoregions with less protection were outside the Amazon basin, particularly near the Brazilian Atlantic coast (Figure 4 and Table S1). At the biome level, about one-third of Moist Forests were protected (Table 2). The Temperate Forest biome also had 33% overall protection (Table 2) and both of its two ecoregions in Chile and Argentina had over 10% protection (Table 3, Figure 4). Mediterranean Forests and Pampas/Patagonia had less than 2% area in protection at the biome level (Table 2) and none of their six ecoregions had over 10% protection (Table 3). The remaining biomes had less than 14% overall area protected (Table 2; Figure 4), with 26% (Dry Forests) to 89% (Montane Grasslands/Shrublands) of their respective ecoregions with over 10% protection (Table 3).

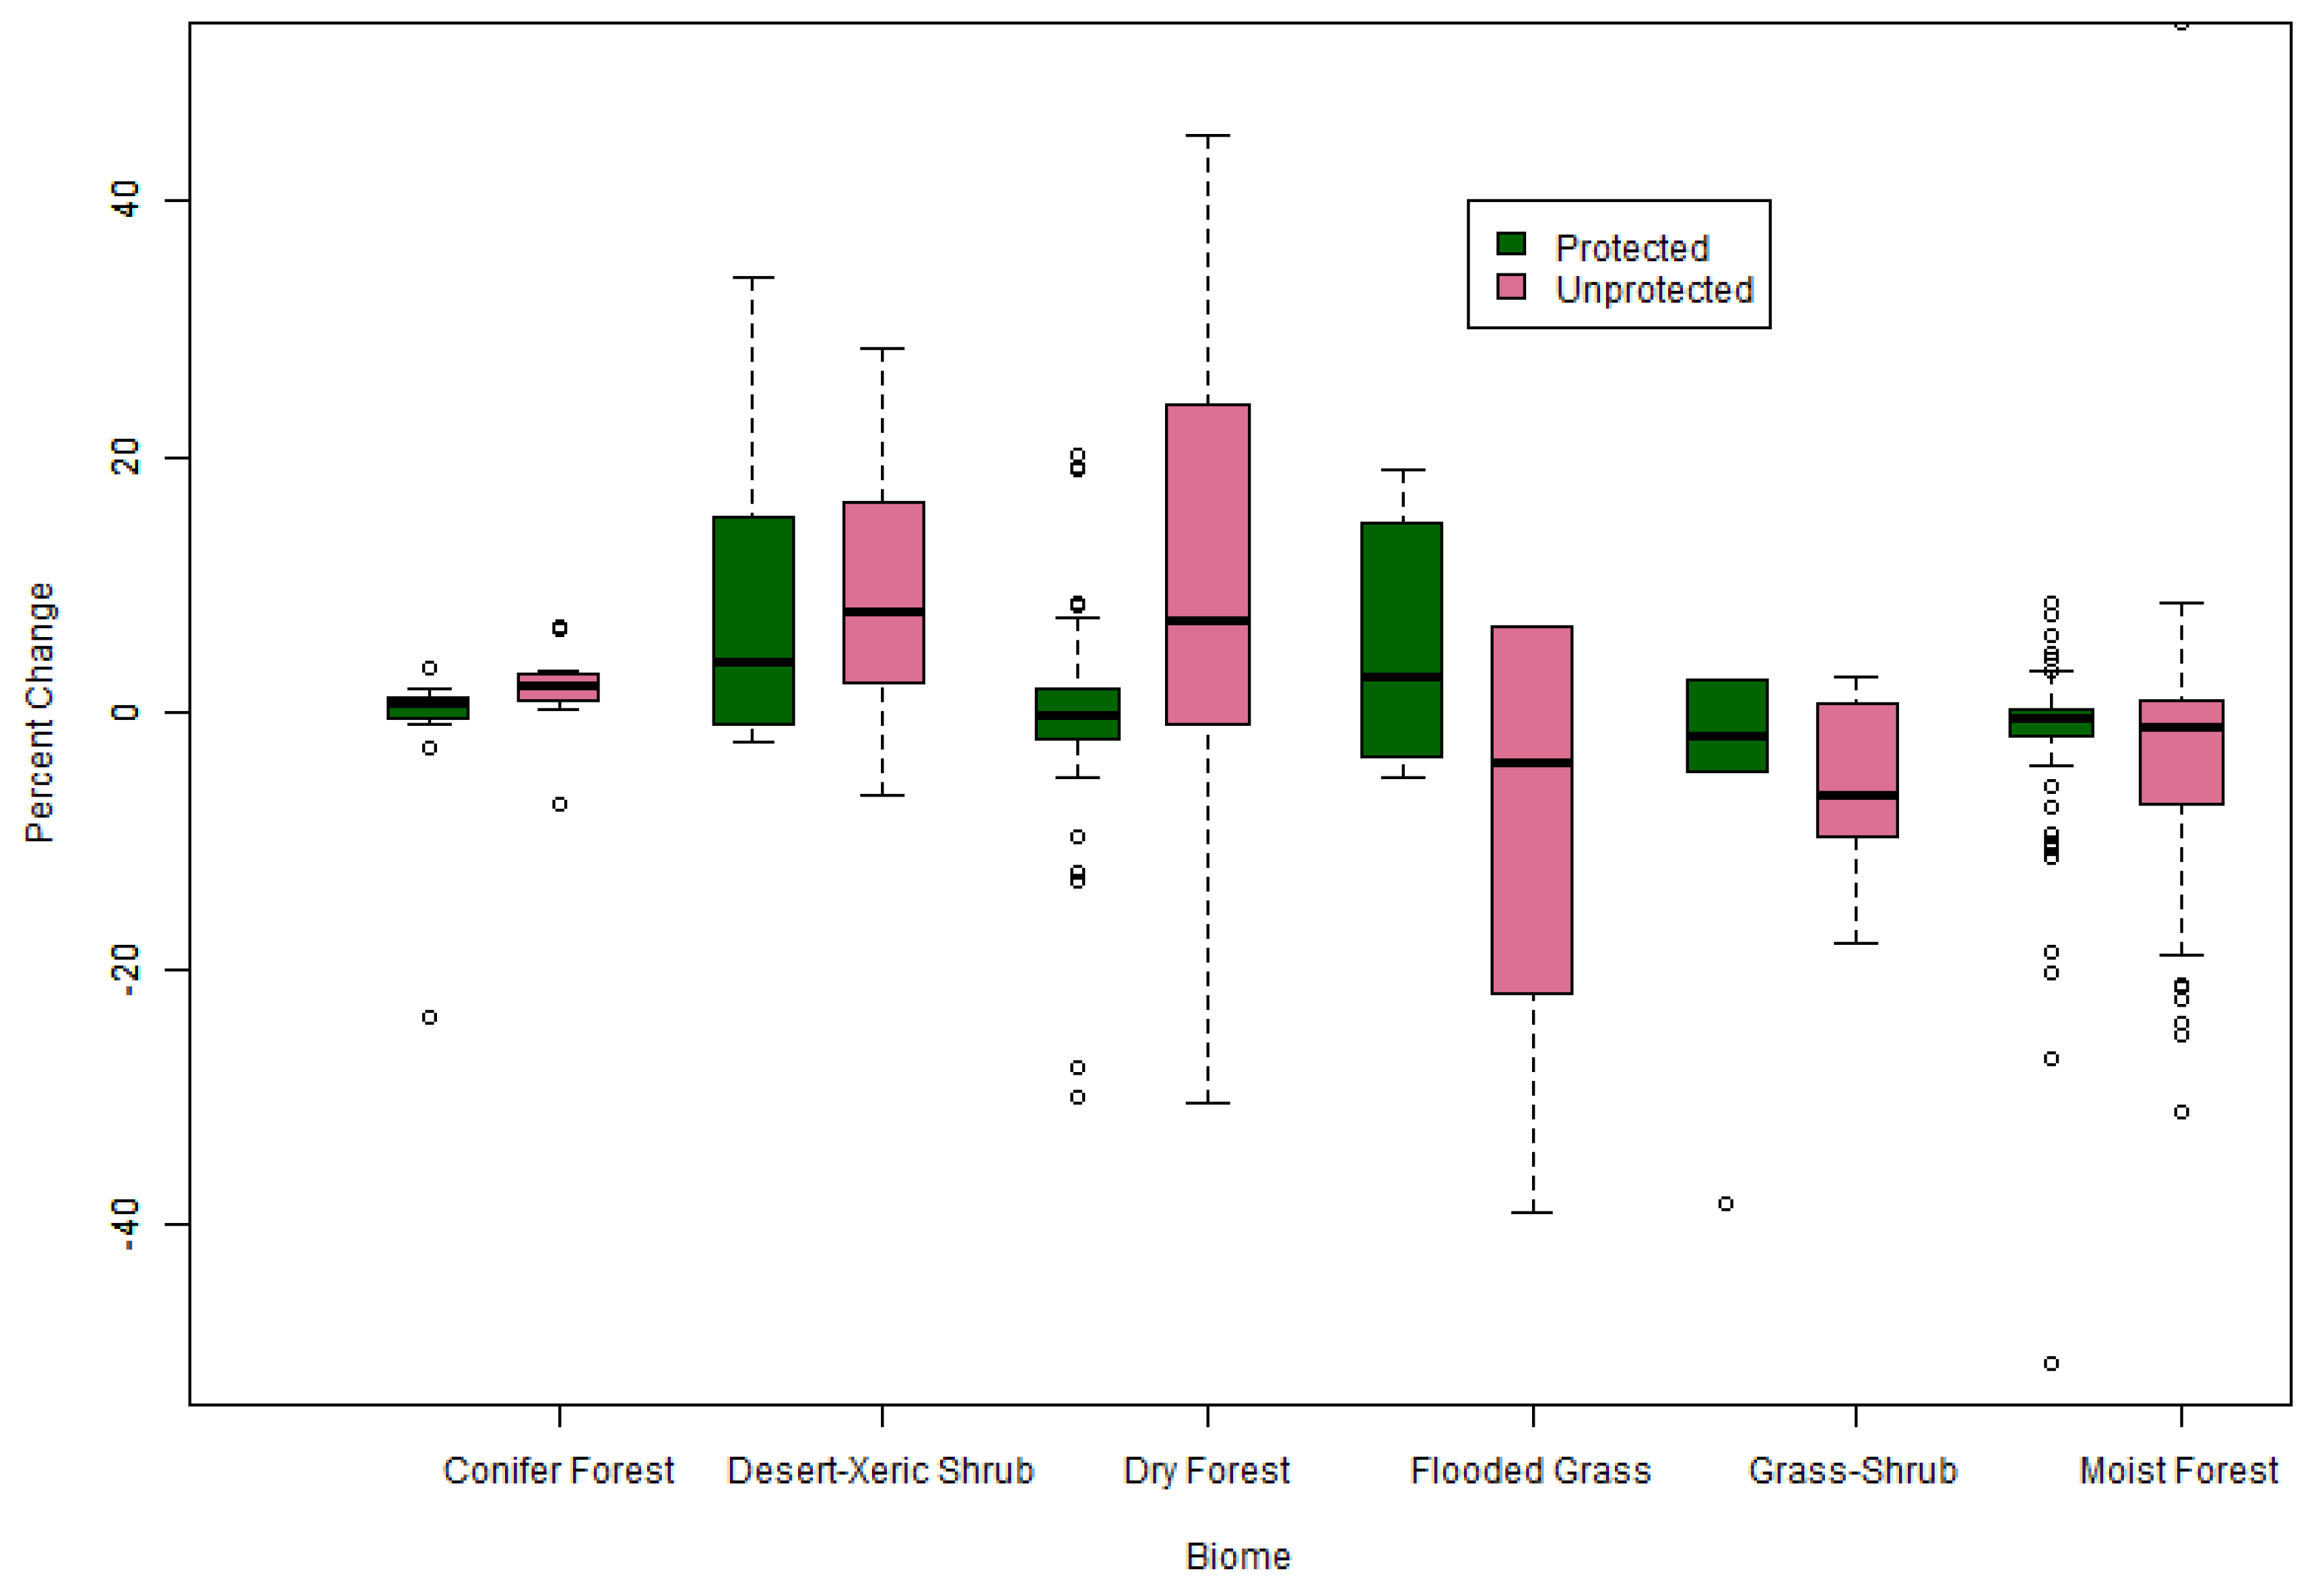
3.2. Analysis of Woody Vegetation Change within and outside of TPAs

3.2.1. Biome-Level Woody Vegetation and TPAs for the Year 2010

Next, we focus on patterns and protection status of woody vegetation in the year 2010, as estimated from our regression analyses. We found that roughly half of LAC was covered by woody vegetation (54%, 11,232,458 km2), and 84% of woody vegetation was found in the Moist Forests, Dry Forests, and the Grasslands/Savannas/Shrublands biomes (Figure 5, Table 4). The Pampas/Patagonia and Montane Grasslands/Shrublands biomes had less than 10% woody cover and are not considered further.
The LAC region lost an estimated 2.2% of its woody cover from years 2001 to 2010. Relatively high woody losses were observed for the Flooded Grasslands/Savannas biomes, while Mediterranean Forests exhibited a 5.9% increase (Table 4). Surprisingly, the most threatened ecoregion in the world, Dry Forests, experienced a gain of 2% woody cover. We expected a decline in woody cover in this type of forest, but our results indicate a slight recovery. The above is not what was expected since the net result of the change in forest cover of all biomes was a loss of 2.2% (Table 4).
The LAC region had 3,297,182 km2 of protected woody vegetation (29% of total woody) in the year 2010 (Table 5). There were 2,759,463 km2 of protected Moist Forests, representing 40% of the biome’s total forest cover. At the regional scale, protected Moist Forests represented 84% of protected and 25% of all woody vegetation (protected and unprotected), respectively. Dry Forests, Conifer Forests, Grasslands/Savannas/Shrublands, and Desert/Xeric Shrublands all had less than 15% protected woody vegetation. These biomes had scope for further conservation. Of remaining unprotected woody vegetation, 48% was outside of Moist Forests, mainly in Dry Forests (15%), Grasslands/Savannas/Shrublands (14%), Desert/Xeric Shrublands (9%), and Conifer Forests (6%); and these biomes had at least 30% of woody vegetation in their unprotected areas. Although Temperate Forests of Chile and Argentina represent a relatively small portion of regional forest cover, 32.4% of total biome area and 30% of forests were protected by the year 2010. In contrast, Mediterranean Forests on the Chilean coast and in northern Baja California were the most threatened biomes in LAC, with just 0.86% of woody vegetation in TPAs and only 25% (45,180 km2) of the remaining unprotected area covered by forests/woodlands (Table 5).

3.2.2. Ecoregion-Level Woody Vegetation Change within and outside of TPAs

A majority of ecoregions had no significant trends in woody cover change, both inside TPAs (82% of ecoregions) and outside TPAs (67% of ecoregions) (Table 6; Figure 6). Significant losses were found in unprotected areas of 32 ecoregions (22%) and TPAs of 19 ecoregions (13%). Surprisingly, there were 5% more ecoregions with significant gains of woody vegetation cover outside TPAs in comparison to inside TPAs (Table 6). Across LAC, with the exception of Desert/Xeric Shrublands, TPAs of ecoregions had less variation in woody loss or gain (Figure 6), indicating that protection afforded more stability of woody cover through time. However, the median percent area of woody change over the decade was not significantly different between protected and unprotected parts of ecoregions (one-way paired Wilcoxon, p = 0.9597), although there were significant differences at the biome level. Median percent woody loss in Moist Forests and Grasslands/Savannas/Shrublands ecoregions was 1% and 6% significantly more negative in unprotected areas than TPAs, respectively (one-way paired Wilcoxon, p = 0.0006, and p = 0.0380, respectively). In contrast, the Conifer Forest, Dry Forest, and Deserts/Xeric Shrublands ecoregions had 2%, 7%, and 4% significantly higher median percent gains in woody vegetation in unprotected areas relative to TPAs, respectively (one-way paired Wilcoxon, p = 0.0171, p = 0.0035, and p = 0.0324, respectively).

3.3. Changes in the Woody Conservation Risk Index (WCRI)

These patterns where similar when assessing the components of our WCRI—percent of ecoregion/biome converted (i.e., not woody) relative to the percent of ecoregion/biome with protected woody. Moist Forests included many ecoregions that had increasing woody conversion and stable to decreasing woody protection (Figure 7). At the biome level, these patterns for Moist Forests led to a slight increase in WCRI between 2001 and 2010 (Figure 8). In contrast, Deserts/Xeric Shrublands, Dry Forests, and Conifer Forests ecoregions tended to have woody gain (e.g., decrease in percent converted), with none to the slight increases in woody protection (Figure 7), indicating significant reforestation or woody expansion—particularly outside of TPAs (Table 5). At the aggregate scale of the biome, these patterns tended to lower WCRI from 2001 to 2010 in the case of Deserts/Xeric Shrublands and Conifer Forests and stabilize WCRI for Dry Forests (Figure 8). Mediterranean Forest ecoregions had the highest WCRI in both 2001 and 2010, as well as the highest CRI found by Hoekstra and colleagues [5] (Figure 8).

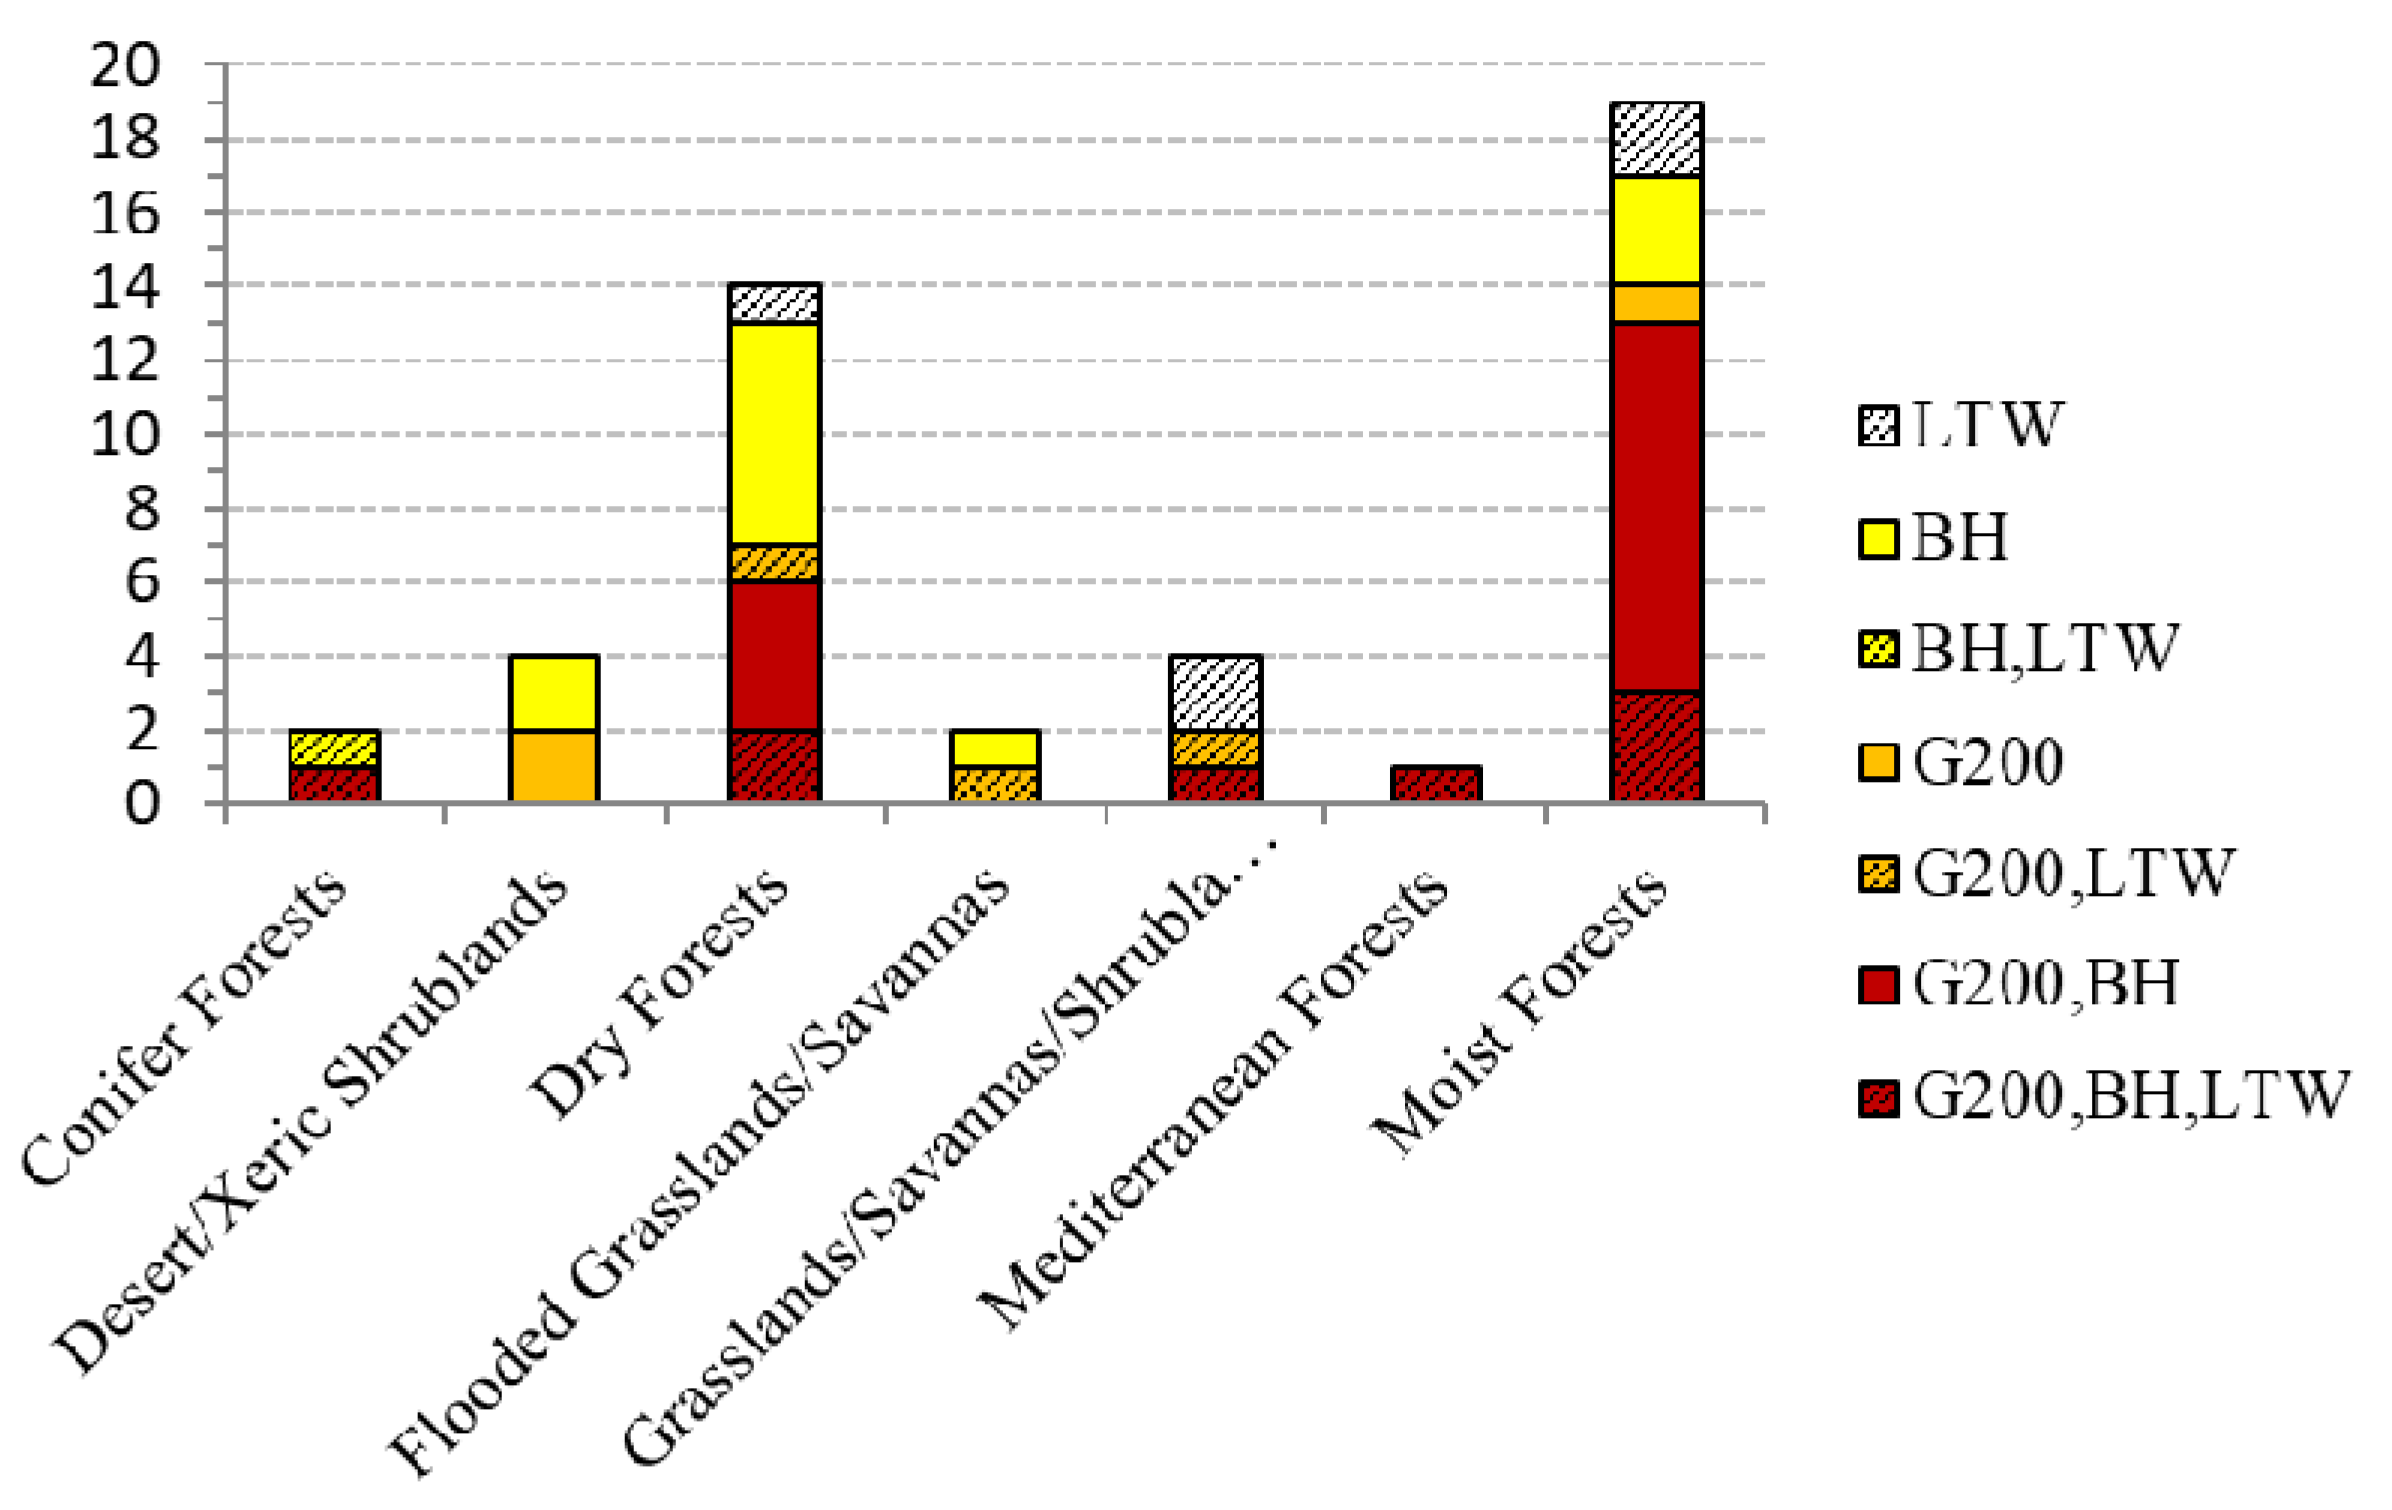
3.4. Trends in Relation to Existing Conservation Priorities

Latin America and the Caribbean had 94 of 173 Ecoregions (54%) targeted for conservation by one of the G200, BH, or LTW templates (Figure 3; Table S1). Of these priority ecoregions, there were 61 BH, 62 G200, and 49 LTW ecoregions; and, 36%, 47%, and 17% of these ecoregions were in one, two, or three conservation templates, respectively. The biomes with the most priority ecoregions (at least one template) were Moist Forests (38), Dry Forests (26), Desert/Xeric Shrublands (10), and Conifer Forests (8). There were 46 ecoregions of conservation priority with a WCRI value over 3, with 35 in BH, 28 in G200, and 17 in LTW templates, respectively (Figure 9).

4. Discussion

4.1. TPAs in LAC Biomes and Ecoregions: Comparison of Regional and Global Assessments of TPAs

At the biome scale, the WDPA data revealed that Moist Forests and Temperate Forests had a third of their surface area in some form of protection status, while other biomes had less than 14% protection. When considering the ecoregion scale, 57% of LAC’s ecoregions had 10% protection—a global goal for the year 2010 envisioned in the Convention on Biological Diversity-CBD [42]. Moist and Temperate Forest ecoregions were relatively well protected while the two Mediterranean Forest and four Pampas/Patagonia ecoregions were mostly unprotected.
Some areas are not well represented, such as the Atlantic Moist Forest ecoregions (Figure 4). With <5% protection, 15% forest left in this region, and highly fragmented successional-state forests, protecting the remaining large blocks of forest and promoting reforestation in the matrix are necessary.
Our study provides support for the leading role of Brazil in absolute and relative terms of TPAs in the region. Nonetheless, Pack et al. [17] warns about a recent trend of downgrading, downsizing, and degazettement of Brazilian TPAs (more details are available from http://www.padddtracker.org (accessed on: 3 October 2021).
It is important to note that conservation assessments vary due to fundamental methodological choices, including analysis only of TPAs with IUCN categories; creating circular buffer polygons around TPAs that are located only with points; double-counting area of TPA spatial overlap; and using different versions of the WDPA database [37]. In our analysis, we used the WDPA database from 2012. Our analysis is best compared to a global analysis of the year 2009 WDPA data by Jenkins and Joppa [42]. That study estimated global land area in some form of protection (IUCN and other categories) at 13%, while we found LAC regional protection to be 20%. Jenkins and Joppa found 50% of global ecoregions with less than 10% protection, while we found 43% of LAC ecoregions with this level of protection. Furthermore, they found that the Temperate Grasslands, Savannahs, and Shrublands biome (Pampas/Patagonia in our study) had the worst protection at a global scale (3.5%), a similar finding in our regional scale analysis. At a global scale, Jenkins and Joppa found that the Moist Forest biome had some of the best protection (21% of global extent) and most new TPAs were in Brazilian moist forests in the Amazon basin [42]. These global trends in protection for Moist Forests are encouraging given the notable pressures exerted on them in recent years ([43,44,45]), and extremely high levels of biodiversity, endemism, and vulnerability that make these ecoregions high in conservation priorities found in BH, LTW, and G200 templates. Nepstad and colleagues [46] found that parks in this region are typically in remote areas while indigenous reserves are often located in frontier areas of intense human pressure along their boundaries.

4.2. Woody Vegetation Change in Biomes and Ecoregions between 2001 and 2010, within and outside of TPAs

As a synthesis of ecoregion results, we summarize significant woody vegetation change inside and outside of TPAs with the broad patterns described below and illustrated in Figure 10. We denote declining and increasing woody vegetation between 2001 and 2010 with (−) and (+), respectively.
Deforestation inside and outside of TPAs: Protected (−), Unprotected (−). This pattern characterizes many Moist Forests ecoregions (Table 3). Example ecoregions include many within the Amazon basin (e.g., Madeira-Tapajós and Tapajós-Xingu moist forests, Mato Grosso seasonal forests), as well as the Petén-Veracruz and Yucatán moist forests of northern Guatemala and eastern Mexico, and the Central American Atlantic moist forests of Nicaragua and Honduras. There was a broad range of TPA categories represented in these ecoregions, including national parks (e.g., Sierra del Lacandón and Laguna del Tigre in Guatemala), biosphere reserves (e.g., Maya in Guatemala), and vast indigenous reserves in Brazil (e.g., Capoto/Jarina and Xingú in Mato Grosso seasonal forests). While TPAs have been reported to be relatively efficient in preventing deforestation in the Brazilian Amazon [47,48] or in southern Yucatan [49], our results make clear that deforestation inside TPAs is still significant in Moist Forest ecoregions (Figure 10).
High deforestation in the ecoregion, but TPAs remain stable: Protected (NC), Unprotected (−). This pattern is exemplified by some Amazonian ecoregions (e.g., Juruá-Purus moist forest). In some cases (e.g., Copo National Park, Argentina; and the core Amazonian region), this pattern likely reflects an efficient protection that controls deforestation pressure [50]. However, and of more general importance, many of the TPAs of these ecoregions are in less accessible areas relatively far from the deforestation frontier and with soils and climatic conditions less suitable for agriculture expansion [50], such as the Chriribiquete National Park in the Colombian Amazon.
Woody vegetation remains stable both within and outside TPAs: Protected (NC) Unprotected (NC): Biomes that follow this pattern are Grasslands/Savannas, Mediterranean and Flooded Grassland/Savannas. Most of the Antilles, Chile, Mexico, the Guianas, and central and southern Brazil follow this pattern. In the case of Puerto Rico, central Chile, Brazil, and western Mexico, this stationary scenario is important, given the overlap with G200, LTW, and BH polygons (Figure 3).
Woody vegetation expansion in TPAs but no change in the ecoregion: Protected (+), Unprotected (NC). This pattern is rare in LAC and occurred primarily in northeastern Mexico.
High deforestation in TPAs but the ecoregion remains stable: Protected (-), Unprotected (NC): The Pacific coast of Colombia, as well as the Colombian-Panamanian border and central Mexico, follow this pattern.
Woody vegetation expansion in the ecoregion, but TPAs remain stable: Protected (NC), Unprotected (+). This pattern characterizes ecoregions that include mountain areas such as Mexico and the Pacific Ocean watershed of most of Central America dry and conifer (pine-oak) forests, Baja California desert, and the Eastern Cordillera Real montane moist forests in Ecuador. In general, most TPAs had been established prior to the period of this study and in areas of high elevation and steep slope where agriculture is not suitable, and they were already highly forested by 2000 and remained stable over the decade (e.g., [51,52]). Outside TPAs, recent trends of population urbanization, socioeconomic changes, and a slowdown of agriculture expansion is favoring the growth of woody vegetation over marginal areas of traditional agriculture [29,53,54].
Woody vegetation expansion inside and outside of TPAs: Protected (+), Unprotected (+). This pattern is found in ecoregions such as Sonoran-Sinaloan transition subtropical dry forest and Sierra Madre Occidental pine-oak forests in Mexico, where TPAs were established for flora and fauna protection and natural resource conservation. These areas may include marginal agriculture activities that have been abandoned, favoring woody growth. Some of this pattern of abandonment, especially outside TPAs, may be favored by socioeconomic changes other than the formal protection (e.g., [55]).
A caveat to our analysis is that change in woody vegetation could have a different meaning for biodiversity and ecological integrity depending on the biome under consideration. For example, when interpreting data from more arid biomes, woody vegetation change may not relate to biodiversity change or change in ecosystem integrity and function to the same degree as an area with moist tropical forests. Despite this variability, woody cover change remains the best proxy available for habitat change when using remotely sensed data to achieve a continental-scale analysis in a consistent and systematic way. Our methodology captured savannas such as the Llanos that are shared by Colombia and Venezuela, and the Chaco in Paraguay, characterized by natural grasslands with at least 20% forest cover.

4.3. Changes in the Woody Conservation Risk Index (WCRI)

At the biome scale, WCRI was substantially different in magnitude for years 2001 and 2010 relative to the CRI developed by Hoekstra et al. (Figure 8) [5]. There were several reasons for this difference: CRI was calculated at the global scale with a land-cover map with 1-km pixels [45] while we used 250-m pixels with fewer mixed pixels; CRI habitat conversion was generally lower as it included grasslands as natural habitat, while we limited our analysis to woody vegetation (i.e., shrublands, forests); CRI considered the proportion of the entire biome in TPAs in contrast to our use of percent of protected woody vegetation; and CRI used TPAs defined in the year 2000 while WCRI used those from the year 2012.
The Mediterranean Forests biome had the highest conservation risk in both indices due to high levels of conversion and little protection (Figure 8). In contrast, the Moist Forests biome had relatively low risk in both indices due to high levels of protected forest (Figure 8). The Desert/Xeric Shrublands, Grasslands/Savannas/Shrublands, Flooded Grasslands/Savannas, and Temperate Forests biomes had relatively higher WCRI than CRI due to our focus on woody vegetation that greatly increased area converted—grasslands and open areas were considered converted in our analysis, but not with CRI (Figure 8). Finally, Dry and Conifer Forests biomes had 30–50% lower values of WCRI relative to CRI, largely due to lower levels of deforestation in our data.

4.4. Trends in Relation to Existing Conservation Priorities

Our definition of woody vegetation includes forests, woodlands, and shrublands, which we consider an indicator of overlapping conservation values, such as habitat and ecosystem services (e.g., carbon storage, water provision). We therefore use woody cover as a proxy for conservation as it acts as an umbrella for biodiversity and environmental services. However, it may be that, even in areas with continuous woody cover, species compositional and functional diversity varies due to successional states (e.g., recovery from past disturbance in the case of the flora), or that on the other hand, it does not capture a deterioration in native species (e.g., loss of key predators). Furthermore, we use the database of protected areas from 2012 that should not exhibit major change today. However, our observation window of woody cover from 2001 to 2010 may have undergone significant changes. In Colombia, for example, the post-conflict era left gaps that, when the guerrillas left, were occupied by other actors, leading to renewed loss in forest cover. We hope that other authors use our methodology for more recent studies and focus on research at national, regional, and local scales, perhaps using remote sensing imagery of finer spatial resolution.
At the LAC regional scale, we estimated that nearly a third of woody vegetation was protected in the year 2010. We found that, across ecoregions, there were no significant differences in woody vegetation change over 10 years within or outside TPAs established in 2010; however, there was less variability in woody vegetation change within TPAs.
We found that half of the ecoregions in LAC were found in one of the three global lists of ecoregions of conservation priority (Biodiversity Hotspots, Global 2000, Last of the Wild) [38,39,40]. Half of Moist Forest priority ecoregions (19) had high WCRI, and 68% of these were both BH and G200 ecoregions (Figure 9) due to high endemism, species diversity, and vulnerability. These ecoregions were in the Atlantic forests of east and southeast Brazil), Yungas forests of Andean foothills (South, Peruvian), Magdalena montane and Magdalena-Urabá forests of Colombia, Oaxacan montane and Veracruz forests of Mexico, and Costa Rican seasonal moist forests. Of these, Alto Paraná and Magdalena-Urabá moist forests had BH and G200 designation, <5% protection, and significant woody loss outside of TPAs, making these areas especially critical for conservation.
Fourteen (54%) of Dry Forest priority ecoregions had high WCRI, with 86%, 50%, and 29% of these ecoregions in BH, G200, or LWT templates, respectively (Figure 9). Only Jamaican dry forests had over 10% protection, making the remaining ecoregions potential targets for conservation. The Dry Chaco ecoregion has extensive forest cover and is listed as an LTW ecoregion, yet we observed a significant loss in forest cover, due largely to agricultural expansion as documented by other studies [26,28]. In contrast, the dry forests of Sonoran-Sinaloan transition of Mexico (G200, LTW), Central America (BH), and Marañón of northwest Peru (BH, G200, LTW) [38,39,40] all had significant gains in woody vegetation in the last decade, and thus they may reach protection goals through natural and socioeconomic processes already underway. Hoekstra [5] has proposed the use of Modern Portfolio Theory (MPT) for biodiversity conservation. Since the WCRI can be usefully coupled with MPT, our results are a valuable tool in consonance with MPT for crafting informed TPA management policy. It is clear from our study that TPAs in LAC are not following MPT, since the moist biome is overrepresented.

5. Conclusions

The results of our study suggest the importance of biome and ecoregion scales in measuring forest/shrubland change, levels of protection, and potential impacts on habitat loss and biodiversity. Biome-level analyses are a useful scale for designing and assessing conservation policy and management across the globe, for example by international environmental protection agencies and non-profit organizations. Ecoregions may present trends in land change and protection that deviate from those observed in their biomes, as patterns respond to more localized environmental factors, such as regional climate change, and national and transnational socioeconomic factors, such as policy goals, levels of enforcement, economic development, and population growth.
From the biome perspective of conservation, we found that patterns of woody vegetation change in the LAC’s Moist Forest biome deserve special attention, as these areas contain a quarter of the region’s woody vegetation, have high biodiversity and endemism, and many of its ecoregions are found in conservation priority templates. The largest net loss of woody vegetation occurred in the Moist Forest biome; however, the biome also comprises relatively large areas that, on paper, at least, remain protected, especially in relatively new indigenous areas in the Amazon. These are high biodiversity ecoregions, which calls for a focus on the Global 200 ecoregions and consideration of their ecoregion-level WCRI. In contrast, the Deserts/xeric shrublands biome had a net gain in woody vegetation, despite minimal formal protection within its ecoregions, suggesting an opportunity for protection initiatives to be concentrated elsewhere, in areas where there are more critical needs.

Supplementary Materials

The following are available online at https://www.mdpi.com/article/10.3390/land10101067/s1, Table S1: List of LAC ecoregions (organized by biomes) showing, for protected and unprotected woody vegetation, estimated area in km2 2010, percent change from 2001 to 2010, statistical significance of change based on regression slope, and 2010 Woody Conservation Risk Index (WCRI). Figure S1. Map of ecoregions in Mexico. Figure S2. Map of ecoregions in Central America and the Caribbean. Figure S3. Map of ecoregions in Northern South America. Figure S4. Map of ecoregions in Southern South America.

Author Contributions

Conceptualization, M.L.C.; methodology, M.L.C.; software, M.L.C.; validation, M.L.C., D.L.-C., J.R., M.C.F.; formal analysis, M.L.C., J.R.; investigation, M.L.C., J.R.; resources, M.L.C., D.L.-C.; data curation, M.L.C.; writing—original draft preparation, M.L.C., D.L.-C., J.R., M.C.F.; writing—review and editing, M.L.C., D.L.-C., J.R., M.C.F.; visualization, M.L.C.; funding acquisition, M.L.C., D.L.-C., J.R.; supervision, M.L.C., D.L.-C. All authors have read and agreed to the published version of the manuscript.

Funding

This research was funded by a Dynamics of Coupled Natural and Human Systems grant from the U.S. National Science Foundation (NSF #0709645 and #0709627) and a Fulbright Specialist Program grant (#4738) to M.C. Jorge Ruiz was funded by Universidad Pedagógica y Tecnológica de Colombia during a postdoctoral position at the Department of Geography, University of California, Santa Barbara.

Data Availability Statement

WDPA data are available at www.protectedplanet.net (accessed on 3 October 2021). Ecoregion delineation are available at https://www.worldwildlife.org/publications/terrestrial-ecoregions-of-the-world (accessed on 3 October 2021). Land cover data from this study are available upon request.

Acknowledgments

We thank Ricardo Grau for valuable input into an early version of this manuscript.

Conflicts of Interest

The authors declare no conflict of interest.

References

  1. Olson, D.M.; Graham, D.J.; Webster, A.L.; Primm, S.A.; Bookbinder, M.P.; Ledec, G. A Conservation Assessment of the Terrestrial Ecoregions of Latin America and the Caribbean. The World Bank: Washington, DC, USA, 1995; p. 157. [Google Scholar]
  2. Aukema, J.E.; Pricope, N.G.; Husak, G.J.; López-Carr, D. Biodiversity Areas under Threat: Overlap of Climate Change and Population Pressures on the World’s Biodiversity Priorities. PLoS ONE 2017, 12, e0170615. [Google Scholar] [CrossRef]
  3. Myers, N.; Mittermeier, R.A.; Mittermeier, C.G.; Da Fonseca, G.A.B.; Kent, J. Biodiversity hotspots for conservation priorities. Nature 2000, 403, 853–858. [Google Scholar] [CrossRef]
  4. Pereira, H.M.; Navarro, L.M.; Martins, I.S. Global biodiversity change: The bag, the good and the unknown. Annu. Rev. Environ. Resour. 2012, 37, 25–50. [Google Scholar] [CrossRef] [Green Version]
  5. Hoekstra, J.M.; Boucher, T.M.; Ricketts, T.H.; Roberts, C. Confronting a biome crisis: Global disparities of habitat loss and protection. Ecol. Lett. 2004, 8, 23–29. [Google Scholar] [CrossRef]
  6. Andam, K.S.; Ferraro, P.S.; Hanauer, M.M. The effects of protected area systems on ecosystem restoration: A quasi-experimental design to estimate the impact of Costa Rica’s protected area system on forest regrowth. Conserv. Lett. 2013, 6, 317–323. [Google Scholar] [CrossRef]
  7. Carr, D.L. Farm Households and Land Use in a Core Conservation Zone of the Maya Biosphere Reserve, Guatemala. Hum. Ecol. 2008, 36, 231–248. [Google Scholar] [CrossRef]
  8. Carr, D.L.; Lopez, A.C.; Bilsborrow, R.E. The population, agriculture, and environment nexus in Latin America: Coun-try-level evidence from the latter half of the twentieth century. Popul. Environ. 2009, 30, 222–246. [Google Scholar] [CrossRef]
  9. Painter, M. Social Change and Applied Anthropology; Taylor & Francis Group: London, UK, 1990; Development and Conservation of Natural Resources in Latin America. [Google Scholar] [CrossRef]
  10. Rocha, J.C.; Baraibar, M.M.; Deutsch, L.; De Bremond, A.; Oestreicher, J.S.; Rositano, F.; Gelabert, C.C. Toward understanding the dynamics of land change in Latin America: Potential utility of a resilience approach for building archetypes of land-systems change. Ecol. Soc. 2019, 24, 17. [Google Scholar] [CrossRef]
  11. Seymour, F.; Harris, N.L. Reducing tropical deforestation. Science 2019, 365, 756–757. [Google Scholar] [CrossRef] [Green Version]
  12. Armenteras, D.; Espelta, J.M.; Rodríguez, N.; Retana, J. Deforestation dynamics and drivers in different forest types in Latin America: Three decades of studies (1980–2010). Glob. Environ. Chang. 2017, 46, 139–147. [Google Scholar] [CrossRef]
  13. Blackman, A.; Epanchin-Niell, R.; Siikamäki, J.; Velez-Lopez, D. Biodiversity Conservation in Latin America and the Caribbean; Taylor & Francis Group: London, UK, 2014. [Google Scholar] [CrossRef]
  14. Ceddia, M.G. The impact of income, land, and wealth inequality on agricultural expansion in Latin America. Proc. Natl. Acad. Sci. USA 2019, 116, 2527–2532. [Google Scholar] [CrossRef] [Green Version]
  15. Poorter, L.; Bongers, F.; Aide, T.M.; Zambrano, A.M.A.; Balvanera, P.; Becknell, J.M.; Boukili, V.; Brancalion, P.H.; Broadbent, E.N.; Chazdon, R.L.; et al. Biomass resilience of tropical secondary forests. Nature 2016, 530, 211–214. [Google Scholar] [CrossRef] [PubMed]
  16. Chazdon, R.L.; Broadbent, E.N.; Rozendaal, D.M.A.; Bongers, F.; Zambrano, A.M.A.; Aide, T.M.; Balvanera, P.; Becknell, J.M.; Boukili, V.; Brancalion, P.H.S.; et al. Carbon sequestration potential of second-growth forest regeneration in the Latin American tropics. Sci. Adv. 2016, 2, e1501639. [Google Scholar] [CrossRef] [PubMed] [Green Version]
  17. Pack, S.M.; Ferreira, M.N.; Krithivasan, R.; Murrow, J.; Bernard, E.; Mascia, M.B. Protected area downgrading, downsizing, and degazettement (PADDD) in the Amazon. Biol. Conserv. 2016, 197, 32–39. [Google Scholar] [CrossRef]
  18. Nolte, C.; Agrawal, A.; Silvius, K.; Soares-Filho, B.A. Governance regime and location influence avoided deforestation suc-cess of protected areas in the Brazilian Amazon. Proc. Natl. Acad. Sci. USA 2013, 110, 4956–4961. [Google Scholar] [CrossRef] [Green Version]
  19. Bruner, A.G.; Gullison, R.E.; Rice, R.E.; Da Fonseca, G.A.B. Effectiveness of Parks in Protecting Tropical Biodiversity. Science 2001, 291, 125–128. [Google Scholar] [CrossRef] [Green Version]
  20. Leroux, S.J.; Krawchuk, M.A.; Schmiegelow, F.; Cumming, S.G.; Lisgo, K.; Anderson, L.G.; Petkova, M. Global protected ar-eas and IUCN designations: Do the categories match the conditions? Biol. Conserv. 2010, 143, 609–616. [Google Scholar] [CrossRef]
  21. Leverington, F.; Costa, K.L.; Pavese, H.; Lisle, A.; Hockings, M. A global analysis of protected area management effective-ness. J. Environ. Manag. 2010, 46, 685–698. [Google Scholar] [CrossRef]
  22. Locke, H.; Dearden, P. Rethinking protected area categories and the new paradigm. Environ. Conserv. 2005, 32, 1–10. [Google Scholar] [CrossRef]
  23. Rodrigues, A.S.L.; Andelman, S.J.; Bakarr, M.I.; Boitani, L.; Brooks, T.; Cowling, R.M.; Fishpool, L.D.C.; Da Fonseca, G.A.B.; Gaston, K.J.; Hoffmann, M.; et al. Effectiveness of the global protected area network in representing species diversity. Nature 2004, 428, 640–643. [Google Scholar] [CrossRef]
  24. Liu, J.; Hull, V.; Batistella, M.; DeFries, R.; Dietz, T.; Fu, F.; Hertel, T.W.; Izaurralde, R.C.; Lambin, E.F.; Li, S.; et al. Framing Sustainability in a Telecoupled World. Ecol. Soc. 2013, 18. [Google Scholar] [CrossRef]
  25. Whittaker, R.J.; Araújo, M.B.; Jepson, P.R.; Ladle, R.; Watson, J.; Willis, K. Conservation Biogeography: Assessment and prospect. Divers. Distrib. 2005, 11, 3–23. [Google Scholar] [CrossRef]
  26. Grau, H.R.; Gasparri, N.I.; Aide, T.M. Balancing food production and nature conservation in the Neotropical dry forests of northern Argentina. Glob. Chang. Biol. 2008, 14, 985–997. [Google Scholar] [CrossRef]
  27. Soares-Filho, B.; Moutinho, P.; Nepstad, D.; Anderson, A.; Rodrigues, H.; Garcia, R.; Dietzsch, L.; Merry, F.; Bowman, M.; Hissa, L.; et al. Role of Brazilian Amazon protected areas in climate change mitigation. Proc. Natl. Acad. Sci. USA 2010, 107, 10821–10826. [Google Scholar] [CrossRef] [PubMed] [Green Version]
  28. Aide, T.M.; Clark, M.L.; Grau, H.R.; López-Carr, D.; Levy, M.; Redo, D.; Bonilla-Moheno, M.; Riner, G.; Andrade-Núñez, M.J.; Muñiz, M. Deforestation and Reforestation of Latin America and the Caribbean (2001-2010). Biotropica 2012, 45, 262–271. [Google Scholar] [CrossRef]
  29. Redo, D.; Grau, H.R.; Aide, T.M.; Clark, M. Asymmetric forest transition driven by the interaction of socioeconomic development and environmental heterogeneity in Central America. Proc. Natl. Acad. Sci. USA 2012, 23, 8839–8844. [Google Scholar] [CrossRef] [Green Version]
  30. Wright, S.J. The future of tropical forests. Ann. N. Y. Acad. Sci. 2010, 1995, 1–27. [Google Scholar]
  31. Loyola, R.D.; Kubota, U.; da Fonseca, G.A.B.; Lewinsohn, T.M. Key Neotropical ecoregions for conservation of terrestrial vertebrates. Biodivers. Conserv. 2009, 18, 2017–2031. [Google Scholar] [CrossRef]
  32. Olson, D.M.; Dinerstein, E.; Wikramanayake, E.D.; Burgess, N.D.; Powell, G.V.; Underwood, E.C.; D’amico, J.A.; Itoua, I.; Strand, H.E.; Morrison, J.C.; et al. Terrestrial ecoregions of the worlds: A new map of life on Earth. Bioscience 2001, 51, 933–938. [Google Scholar] [CrossRef]
  33. Nelson, A.; Chomitz, K.M. Effectiveness of Strict vs. Multiple Use Protected Areas in Reducing Tropical Forest Fires: A Global Analysis Using Matching Methods. PLoS ONE 2011, 6, e22722. [Google Scholar] [CrossRef]
  34. IUCN, UNEP-WCMC. The World Database on Protected Areas (WDPA) [On-line]. UNEP-WCMC: Cambridge, UK, 2012; Available online: www.protectedplanet.net (accessed on 31 October 2012).
  35. Clark, M.L.; Aide, T.M.; Riner, G. Land change for all municipalities in Latin America and the Caribbean assessed from 250-m MODIS imagery (2001–2010). Remote Sens. Environ. 2012, 126, 84–103. [Google Scholar] [CrossRef]
  36. Breiman, L. Random forests. Mach. Learn. 2001, 45, 5–32. [Google Scholar] [CrossRef] [Green Version]
  37. Soutullo, A.; De Castro, M.; Urios, V. Linking political and scientifically derived targets for global biodiversity conservation: Implications for the expansion of the global network of protected areas. Divers. Distrib. 2008, 14, 604–613. [Google Scholar] [CrossRef]
  38. Mittermeier, R.A.; Mittermeier, C.G.; Brooks, T.M.; Pilgrim, J.D.; Konstant, W.R.; Da Fonseca, G.A.; Kormos, C. Wilderness and biodiversity conservation. Proc. Natl. Acad. Sci. USA 2003, 100, 10309–10313. [Google Scholar] [CrossRef] [Green Version]
  39. Olson, D.M.; Dinerstein, E. The Global 200: A Representation Approach to Conserving the Earth's Most Biologically Valuable Ecoregions. Conserv. Biol. 1998, 12, 502–515. [Google Scholar] [CrossRef] [Green Version]
  40. Sanderson, E.W.; Jaiteh, M.; Levy, M.A.; Redford, K.H.; Wannebo, A.V.; Woolmer, G. The human footprint and the last of the wild: The human footprint is a global map of human influence on the land surface, which suggests that human beings are stewards of nature, whether we like it or not. BioScience 2002, 52, 891–904. [Google Scholar] [CrossRef]
  41. Brooks, T.M.; Mittermeier, R.A.; Da Fonseca, G.A.B.; Gerlach, J.; Hoffmann, M.; Lamoreux, J.F.; Mittermeier, C.G.; Pilgrim, J.D.; Rodrigues, A. Global Biodiversity Conservation Priorities. Science 2006, 313, 58–61. [Google Scholar] [CrossRef] [Green Version]
  42. Jenkins, C.; Joppa, L. Expansion of the global terrestrial protected area system. Biol. Conserv. 2009, 142, 2166–2174. [Google Scholar] [CrossRef]
  43. Fearnside, P.M. Deforestation soars in the Amazon. Nature 2015, 521, 423. [Google Scholar] [CrossRef] [PubMed] [Green Version]
  44. Gibbs, H.K.; Munger, J.; L’Roe, J.; Barreto, P.; Pereira, R.; Christie, M.; Amaral, T.; Walker, N.F. Did ranchers and slaughter-houses respond to zero-deforestation agreements in the Brazilian Amazon? Conserv. Lett. 2016, 9, 32–42. [Google Scholar] [CrossRef]
  45. Cabral, A.I.; Saito, C.; Pereira, H.; Laques, A.E. Deforestation pattern dynamics in protected areas of the Brazilian Legal Amazon using remote sensing data. Appl. Geogr. 2018, 100, 101–115. [Google Scholar] [CrossRef]
  46. Nepstad, D.; Schwartzman, S.; Bamberger, B.; Santilli, M.; Ray, D.; Schlesinger, P.; Lefebvre, P.; Alencar, A.; Prinz, E.; Fiske, G.; et al. Inhibition of Amazon Deforestation and Fire by Parks and Indigenous Lands. Conserv. Biol. 2006, 20, 65–73. [Google Scholar] [CrossRef]
  47. Adeney, J.M.; Christensen, N.L.; Pimm, S.L. Reserves Protect against Deforestation Fires in the Amazon. PLoS ONE 2009, 4, e5014. [Google Scholar] [CrossRef] [PubMed]
  48. European Commission, Joint Research Centre. Global Land Cover 2000 database, 2003. Available online: http://bioval.jrc.ec.europa.eu/products/glc2000/glc2000.php (accessed on 3 October 2021).
  49. Chowdhury, R.R. Landscape change in the Calakmul Biosphere Reserve: Modeling driving forces of smallholder deforestation in land parcels. Appl. Geogr. 2006, 26, 129–152. [Google Scholar] [CrossRef]
  50. Lambin, E.; Gibbs, H.; Ferreira, L.; Grau, R.; Mayaux, P.; Meyfroidt, P.; Morton, D.; Rudel, T.; Gasparri, N.I.; Munger, J. Estimating the world's potentially available cropland using a bottom-up approach. Glob. Environ. Chang. 2013, 23, 892–901. [Google Scholar] [CrossRef]
  51. Sanchez-Azofeifa, A.; Harriss, R.C.; Skole, D.L. Deforestation in Costa Rica: A quantitative analysis using remote sensing imagery. Biotropica 2001, 33, 378–384. [Google Scholar] [CrossRef]
  52. Southworth, J.; Tucker, C. The Influence of Accessibility, Local Institutions, and Socioeconomic Factors on Forest Cover Change in the Mountains of Western Honduras. Mt. Res. Dev. 2001, 21, 276–283. [Google Scholar] [CrossRef] [Green Version]
  53. Álvarez-Berríos, N.L.; Redo, D.J.; Aide, T.M.; Clark, M.L.; Grau, R. Land Change in the Greater Antilles between 2001 and 2010. Land 2013, 2, 81–107. [Google Scholar] [CrossRef] [Green Version]
  54. Graesser, J.; Aide, T.M.; Grau, H.R.; Ramankutty, N. Cropland/pastureland dynamics and the slowdown of deforestation in Latin America. Environ. Res. Lett. 2015, 10. [Google Scholar] [CrossRef]
  55. Bonilla-Moheno, M.; Aide, T.M.; Clark, M. The influence of socioeconomic, environmental and demographic factors on mu-nicipality-scale land cover change in Mexico. Reg. Environ. Chang. 2012, 12, 543–557. [Google Scholar] [CrossRef]
Figure 1. Terrestrial biomes of Latin America and the Caribbean with the short names used in this study (see Table 1).
Land 10 01067 g001
Figure 2. TPAs in Latin America and the Caribbean [34], designated as of September 2012.
Land 10 01067 g002
Figure 3. Conservation priorities as designated in the Global 200 (G200), Biodiversity Hotspot (BH) and Last of the Wild (LTW) templates [38,39,40].
Land 10 01067 g003
Figure 4. Percent of ecoregions that have protection (including all WDPA categories, but not including points).
Land 10 01067 g004
Figure 5. Estimated percent woody vegetation by ecoregion [32] for the year 2010.
Land 10 01067 g005
Figure 6. Percent woody change within and outside of protected areas for ecoregions within biomes.
Land 10 01067 g006
Figure 7. Percent of ecoregion converted (i.e., not woody) relative to the percent of ecoregion with protected woody, organized by biome for years 2001 (solid line) and 2010 (dashed line). Arrows indicate the direction and amount of change between 2001 and 2010. Red arrows are those ecoregions with significant trends in unprotected or protected areas (p ≤ 0.10). ecoregions with <10% total woody cover were removed from the analysis.
Land 10 01067 g007
Figure 8. Biome summary of percent converted (not woody) relative to percent effective protection (protected woody) and the Woody Conservation Risk Index (WCRI = ratio of converted to protected). For comparison, Conservation Risk Index (CRI) data from [5] are included.
Land 10 01067 g008
Figure 9. Number of ecoregions within biomes that had WCRI in the year 2010 greater ≥3 and conservation priorities as designated in the Global 200 (G200), Biodiversity Hotspot (BH), and Last of the Wild (LTW) templates [38,39,40].
Land 10 01067 g009
Figure 10. Ecoregions with significant (p ≤ 0.10) gain (+) or loss (−) of woody vegetation from 2001 to 2010 in their protected and unprotected areas (NC = no significant change; Ecoregions or biomes with <10% total woody cover in the year 2010 were not analyzed).
Land 10 01067 g010
Table 1. Biome abbreviated name, biome name, number of ecoregions, and area.
Biome Short NameBiome NameNumber of EcoregionsArea (km2)Percentage of Total Area
Moist ForestsTropical & Subtropical Moist Broadleaf Forests 789,275,40444.5
Dry ForestsTropical & Subtropical Dry Broadleaf Forests 311,985,2039.5
Conifer ForestsTropical & Subtropical Coniferous Forests12605,9472.9
Temperate ForestsTemperate Broadleaf & Mixed Forests2412,7632.0
Grasslands/Savannas/ShrublandsTropical & Subtropical Grasslands, Savannas, Shrublands83,274,02115.7
Pampas/PatagoniaTemperate Grasslands, Savannas & Shrublands41,629,6727.8
Flooded Grasslands/SavannasFlooded Grasslands & Savannas7250,8791.2
Montane Grasslands/ShrublandsMontane Grasslands & Shrublands9874,7000.04
Mediterranean ForestsMediterranean Forests, Woodlands, and Scrub2183,5850.9
Desert/Xeric ShrublandsDeserts & Xeric Shrublands202,346,67611.5
All biomes 17320,838,849100.0
Table 2. The area covered by TPAs by biome in LAC (TPAs are from the WDPA database that included those designated up to the year 2012). Note: the Pampas/Patagonia and Montane Grasslands/Shrublands are not included in analyses of woody cover change.
Biome NameTotal Area
km2
Area Covered by TPAs
km2
% of Area Protected
Moist Forests9,275,4043,043,91732.8
Dry Forests1,985,203164,7958.3
Conifer Forests605,94772,34211.9
Temperate Forests412,763133,84432.4
Grasslands/Savannas/Shrublands3,274,021353,56710.8
Pampas/Patagonia1,629,67232,9522.0
Flooded Grasslands/Savannas250,87931,19212.4
Montane Grasslands/Shrublands874,700117,73413.5
Mediterranean Forests183,58514720.8
Desert/Xeric Shrublands2,346,676177,8817.6
All biomes20,838,8494,129,69719.8
Table 3. Biome abbreviated name, biome name, number of ecoregions, and number of ecoregions with 10 or more percent of the area with TPAs and its corresponding percentage overall.
Biome Short NameBiome NameNumber of EcoregionsNumber of
Ecoregions with ≥10% of Area with TPAs
Percentage of Ecoregions with ≥10% of Area with TPAs
Moist ForestsTropical & Subtropical Moist Broadleaf Forests 785975.6
Dry ForestsTropical & Subtropical Dry Broadleaf Forests 31825.8
Conifer ForestsTropical & Subtropical Coniferous Forests12650.0
Temperate ForestsTemperate Broadleaf & Mixed Forests22100.0
Grasslands/Savannas/ShrublandsTropical & Subtropical Grasslands, Savannas, Shrublands8337.5
Pampas/PatagoniaTemperate Grasslands, Savannas & Shrublands400.0
Flooded Grasslands/SavannasFlooded Grasslands & Savannas7457.1
Montane Grasslands/ShrublandsMontane Grasslands & Shrublands9888.9
Mediterranean ForestsMediterranean Forests, Woodlands, and Scrub200.0
Desert/Xeric ShrublandsDeserts & Xeric Shrublands20945.0
All biomes 1739957.2
Table 4. Biome summary of estimated woody vegetation in years 2001 and 2010. Area data are in km2.
BiomeWoody Area 2001Woody Area 2010Woody Change %
Moist Forests7,096,6046,852,251−3.4
Dry Forests1,336,8911,362,9952.0
Conifer Forests492,670507,4983.0
Temperate Forests145,849145,559−0.2
Grasslands/Savannas/Shrublands1,277,3781,256,820−1.6
Flooded Grasslands/Savannas108,76396,620−11.2
Mediterranean Forests43,31645,8455.8
Desert/Xeric Shrublands786,539772,470−1.8
All biomes11,228,01011,040,058−2.2
Table 5. Unprotected and protected woody vegetation change in LAC 2001–2010 by biome.
Unprotected Woody VegetationProtected Woody Vegetation
Biome NameArea
2001
Area
2010
Change %Area
2001
Area
2010
Change
%
Protected Woody Relative to 2010 Woody Area
%
Moist Forests4,308,2434,092,788−5.02,788,3612,759,463−1.040.3
Dry Forests1,194,8961,224,4602.5141,995138,535−2.410.2
Conifer Forests429,397443,7543.363,27363,7440.712.6
Temperate Forests101,501101,8780.444,34843,681−1.530.0
Grasslands/Savannas/Shrublands1,107,3811,086,495−1.9169,997170,3250.213.6
Flooded Grasslands/Savannas86,21975,030−13.022,54421,590−4.222.3
Mediterranean Forests42,67745,1805.96396654.11.5
Desert/Xeric Shrublands705,667687,340−2.680,87285,1305.311.0
All biomes7,975,9817,756,925−2.73,312,0293,283,133−2.729.7
Table 6. Number (percentage) of ecoregions within each biome that had significant (p ≤ 0.10) gains or losses in woody vegetation from 2001 to 2010 inside and outside of TPAs. Ecoregions and biomes with <10% total woody cover were removed from the analysis, leaving 148 ecoregions.
Inside TPAsOutside TPAs
Biome NameGainLossNo ChangeGainLossNo Change
Moist Forests0 (0.0)15 (19.2)63 (80.8)3 (3.8)29 (37.2)46 (59.0)
Dry Forests3 (10.0)3 (10.0)24 (80.0)7 (23.3)3 (10.0)20 (66.7)
Conifer Forests2 (18.2)1 (9.1)8 (72.7)2 (18.2)0 (0.0)9 (81.8)
Temperate Forests0 (0.0)0 (0.0)1 (100.0)0 (0.0)0 (0.0)1 (100.0)
Grasslands/Savannas/Shrublands0 (0.0)0 (0.0)6 (100.0)0 (0.0)0 (0.0)6 (100.0)
Flooded Grasslands/Savannas1 (16.7)0 (0.0)5 (83.3)1 (16.7)0 (0.0)5 (83.3)
Mediterranean Forests0 (0.0)0 (0.0)1 (100.0)0 (0.0)0 (0.0)1 (100.0)
Desert/Xeric Shrublands1 (6.7)0 (0.0)14 (93.3)4 (26.7)0 (0.0)11 (73.3)
All biomes7 (4.7)19 (12.8)122 (82.4)17 (11.5)32 (21.6)99 (66.9)
Publisher’s Note: MDPI stays neutral with regard to jurisdictional claims in published maps and institutional affiliations.

