Article

Spatial Distribution Equilibrium and Relationship between Construction Land Expansion and Basic Education Schools in Shanghai Based on POI Data

School of Maritime Economics and Management, Dalian Maritime University, Dalian 116026, China
*
Author to whom correspondence should be addressed.
Land 2021, 10(10), 1059; https://doi.org/10.3390/land10101059
Submission received: 3 September 2021 / Revised: 3 October 2021 / Accepted: 6 October 2021 / Published: 8 October 2021
(This article belongs to the Topic Climate Change and Environmental Sustainability)

Abstract

:
Basic education is about improving the quality of life of a country’s population and promote social cohesions, and it is also an important factor in shaping a country and region’s person-to-person relationship. This study analyzes the spatial morphological patterns, aggregation characteristics, and distribution inequality among kindergarten, elementary, and junior high schools within districts in Shanghai, using point of interest data, kernel density estimation, Ripley’s K-function, location quotient, and grid analysis to investigate the effect on the distribution of schools using construction land growth data. The findings were as follows. (1) There was little difference in the spatial distribution characteristics of the three school types. They all exhibited the spatial distribution characteristics of core area clustering and the coexistence of multiple circadian layers, in which both the agglomeration size and the aggregation intensity showed the order of kindergarten > elementary school > junior high schools. The spatial distribution characteristics of the three types of schools are highly positively correlated with the population distribution. (2) Spatially, low-level schools were adjacent to high-level schools, and the structure of the three school types showed an uneven distribution overall. The aggregation characteristics of the seven inner districts within Shanghai were relatively balanced, while Pudong District showed the phenomenon of being “high in the southeast and low in the northeast”, and the suburban areas showed an uneven distribution of core district aggregation overall. (3) The longer the construction land growth cycle, the greater the density of school points, and the more consistent the distribution of school points with the direction of construction land expansion.

1. Introduction

Education, as a practical activity to improve the comprehensive quality of human beings, has an important effect on the continuous development of the social economy. Ensuring inclusive and equitable quality education is one of the United Nation’s Sustainable Development Goals [1], and the scarcity of resources and the imbalance in the allocation of basic education resources remain substantial barriers to achieving this goal [2,3]. At present, the proximate admission model, which assigns students to schools based on their home residence, has been widely adopted worldwide in many developed countries such as the United States [4], the United Kingdom [5], and Japan [6], as well as in developing countries such as China [7]. Ensuring the inclusion and equality of basic education can improve the quality of the whole nation, promote social cohesion, and encourage economic competitiveness [8,9]. Schools are the basic units of education resource allocation. Their spatial pattern, along with all levels of school resource configuration, will affect the resource allocation in these regions [10], as their spatial distribution decides whether students can get education near their place of residence [11]. Besides, the inequality of the area is exacerbated by this situation to some extent [12,13]. Therefore, focusing on the spatial distribution laws between kindergarten, elementary, and junior high schools as the main basic education types can help achieve the equilibrium distribution of resources in basic education.
The uneven allocation of educational resources problem has received extensive attention in recent years [14,15,16]. The extant literature has mostly been dominated by studies on the imbalance of educational resources caused by urban population growth and rapid urbanization-related policies. These studies have shown that first, the rapid growth of the urban population and the greatly increased need for land use for urban construction have created a demand for infrastructure that far exceeds the service capacity of the existing service facilities [17,18]. The lack of space in the urban center and the shortage of educational facilities in the suburbs often leads to the uneven distribution of schools in the core and peripheral areas of a city [19], thus exacerbating the inequities in educational resource distribution. Liu et al. [20] used quantitative methods, such as spatial interpolation and cluster analysis, based on resource data such as elementary school building conditions, faculty, and the total amount of educational resources in Dalian City, and found that its elementary school resources exhibited a “center edge” circled layout; that is, the central urban areas were dominated by high-level secondary schools while the peripheral county cities were dominated by elementary schools, exhibiting a circled “decay” pattern. Tu et al. [21] used a log model to analyze the spatial evolution of compulsory educational facilities in Nanjing City, and found that the “core edge” structure of educational resources was still obvious and that the educational resources were highly spatially clustered.
Second, China’s school merging policies have greatly advanced the educational urbanization process [22]. Unlike the demographic changes that accompany school closures and urbanization in developed countries [23], school merging policies in China stem from a top-down administrative push. These were adopted to optimize the allocation of rural educational resources, comprehensively improve the investment efficiency and quality of primary and secondary education, and promote the healthy and sustainable development of rural basic education. China has integrated rural educational resources to abandon the way of “running schools in villages” and merge resources of adjacent schools. However, due to improper operation in some areas, students’ living conditions have decreased and have dropped out of school in some areas. Therefore, the implementation of these policies has generated greater controversy [24].
To some extent, the scale expansion caused by the school merging policy could improve students’ academic performance and enable them to obtain better academic opportunities in the long term, but the merger has resulted in the concentration of more spatially distributed schools, which has resulted in increased commuting times for students in less accessible suburban areas and the more uneven distribution of schools between urban and rural areas. Due to the lack of education data at the micro-level, most studies have focused on educational inequalities at different prefectural or provincial levels [25,26] and between rural and urban areas [27,28], rather than between urban and suburban areas. Although a few studies have been based within cities [29], there is a notable paucity of research on the overall urban and peri-urban school distribution disequilibrium and its spatial structure composition.
Scholars have mostly analyzed and evaluated the spatial layout and inequality of educational resources on different scales from a geographic perspective, using methods such as 3S technology and spatial model simulation, which reflect both the social reality of the spatial outcomes and the products of the sociopolitical and economic operation of education resources [30,31]. In addition, mixed quantitative and qualitative research methods [32] have been used to analyze the relationship between the spatial pattern of educational resources and the spatial process of different scales and scenarios, such as the urbanization process [33,34,35], regional planning [36,37], population migration, and social-spatial differentiation [38,39].
In terms of data, points of interest (POI) data, as important urban space geographic big data [40], can describe the spatial and attribute information of geographical entities in real-time, such as name, address, and coordinates; has the advantage of large sample sizes; covers information meticulously, and so on. POI-based research has been fruitful in areas such as business spatial distribution [41], urban functional area identification [42], and urban built-up area identification [43,44]. The combination of POI data and GIS technology has facilitated better analysis of the spatial structure composition of schools within cities. At present, there are relatively few studies that have combined POI data to study the spatial distribution of schools via GIS visualization, and have mainly explored the spatial distribution of schools at a single level [45] to study the equilibrium of single educational resources with urban and rural origins [46,47]. Fewer studies have analyzed the spatial distribution of school resources based on a comprehensive consideration of intrinsic connections among the different levels of schools. Meanwhile, there is also relatively scant literature on the spatial relationship among kindergarten, elementary, and junior high schools under the mechanism of the ascending studies that use schools as the entry point.
At present, the number and size of elementary schools in China have ranked among the top in the world. The 2019 data for educational and career development in China show that there are 247, 105, and 148 million students in kindergarten, elementary, and junior high schools, respectively, which correspond to school sizes of 281,000, 160,000, and 52,000 [48]. In the past few decades, China has experienced extremely drastic land-use changes [49]. Cities need to expand the land area to seek new development space as part of the process of urbanization. The primary manifestation of urbanization is the phenomenon of urban spatial expansion, the direct embodiment of urbanization development. Urban expansion has become one of the important contents of land-use change research with the continuous advancement of urbanization in the world [50]. As such, the trend of population concentration to the urban center is becoming more and more obvious, expanding the urban scale and resulting in the continuous expansion of urban construction land [51]. Through the superposition analysis of the geographical location of construction land expansion in different growth cycles and school POI points, we can better understand the main trend of school distribution and explore the rationality of its spatial distribution. Moreover, construction land, as the most active area of urban space, tends to agglomerate resources such as population, capital, and information [52]. As schools are an important part of the social infrastructure whose land types are on construction land, the expansion of construction land will have a large impact on the distribution of schools within a city. Shanghai, as a megacity in China, has a rapid expansion of urban space [53,54] and extremely representative educational career development, and the expansion of construction land is also evident. In 2020, there were 2978 school points on construction land in Shanghai, accounting for 82% of the total number of schools.
Due to the limitation of data, we only have POI data in 2020, which cannot match the time of study of the construction land. However, schools are built on construction land, and the distribution of schools is inseparable from the construction land’s expansion. Therefore, by studying the impact of the expansion of construction land in Shanghai and the change of spatial distribution of school points in different growth cycles, we can evaluate the spatial relevance under the circumstance of this timing mismatch. The research on the balance of school spatial distribution has important practical significance. The growth cycle of construction land refers to the expansion of construction land area with time growth, taking ten years as a cycle. The paper refers to 30 years from 1990 to 2020, 20 years from 2000 to 2020, and so on.
In sum, this study focuses on the following three issues. (1) Using 2019 Shanghai POI data, this study analyzes the spatial distribution laws of kindergarten, elementary, and junior high schools using GIS spatial analysis. (2) The spatial proportional relationship between the number of the three school types is analyzed using a grid net to illustrate the status of the spatial distribution of education in Shanghai. (3) Construction sites are combined with school POI points to analyze the effects of the maturity of construction sites on the distribution state and density of school POI points in different growth periods between 1990 and 2020. This study can provide a new perspective for research on the spatial balance of educational resources.

2. Materials and Methods
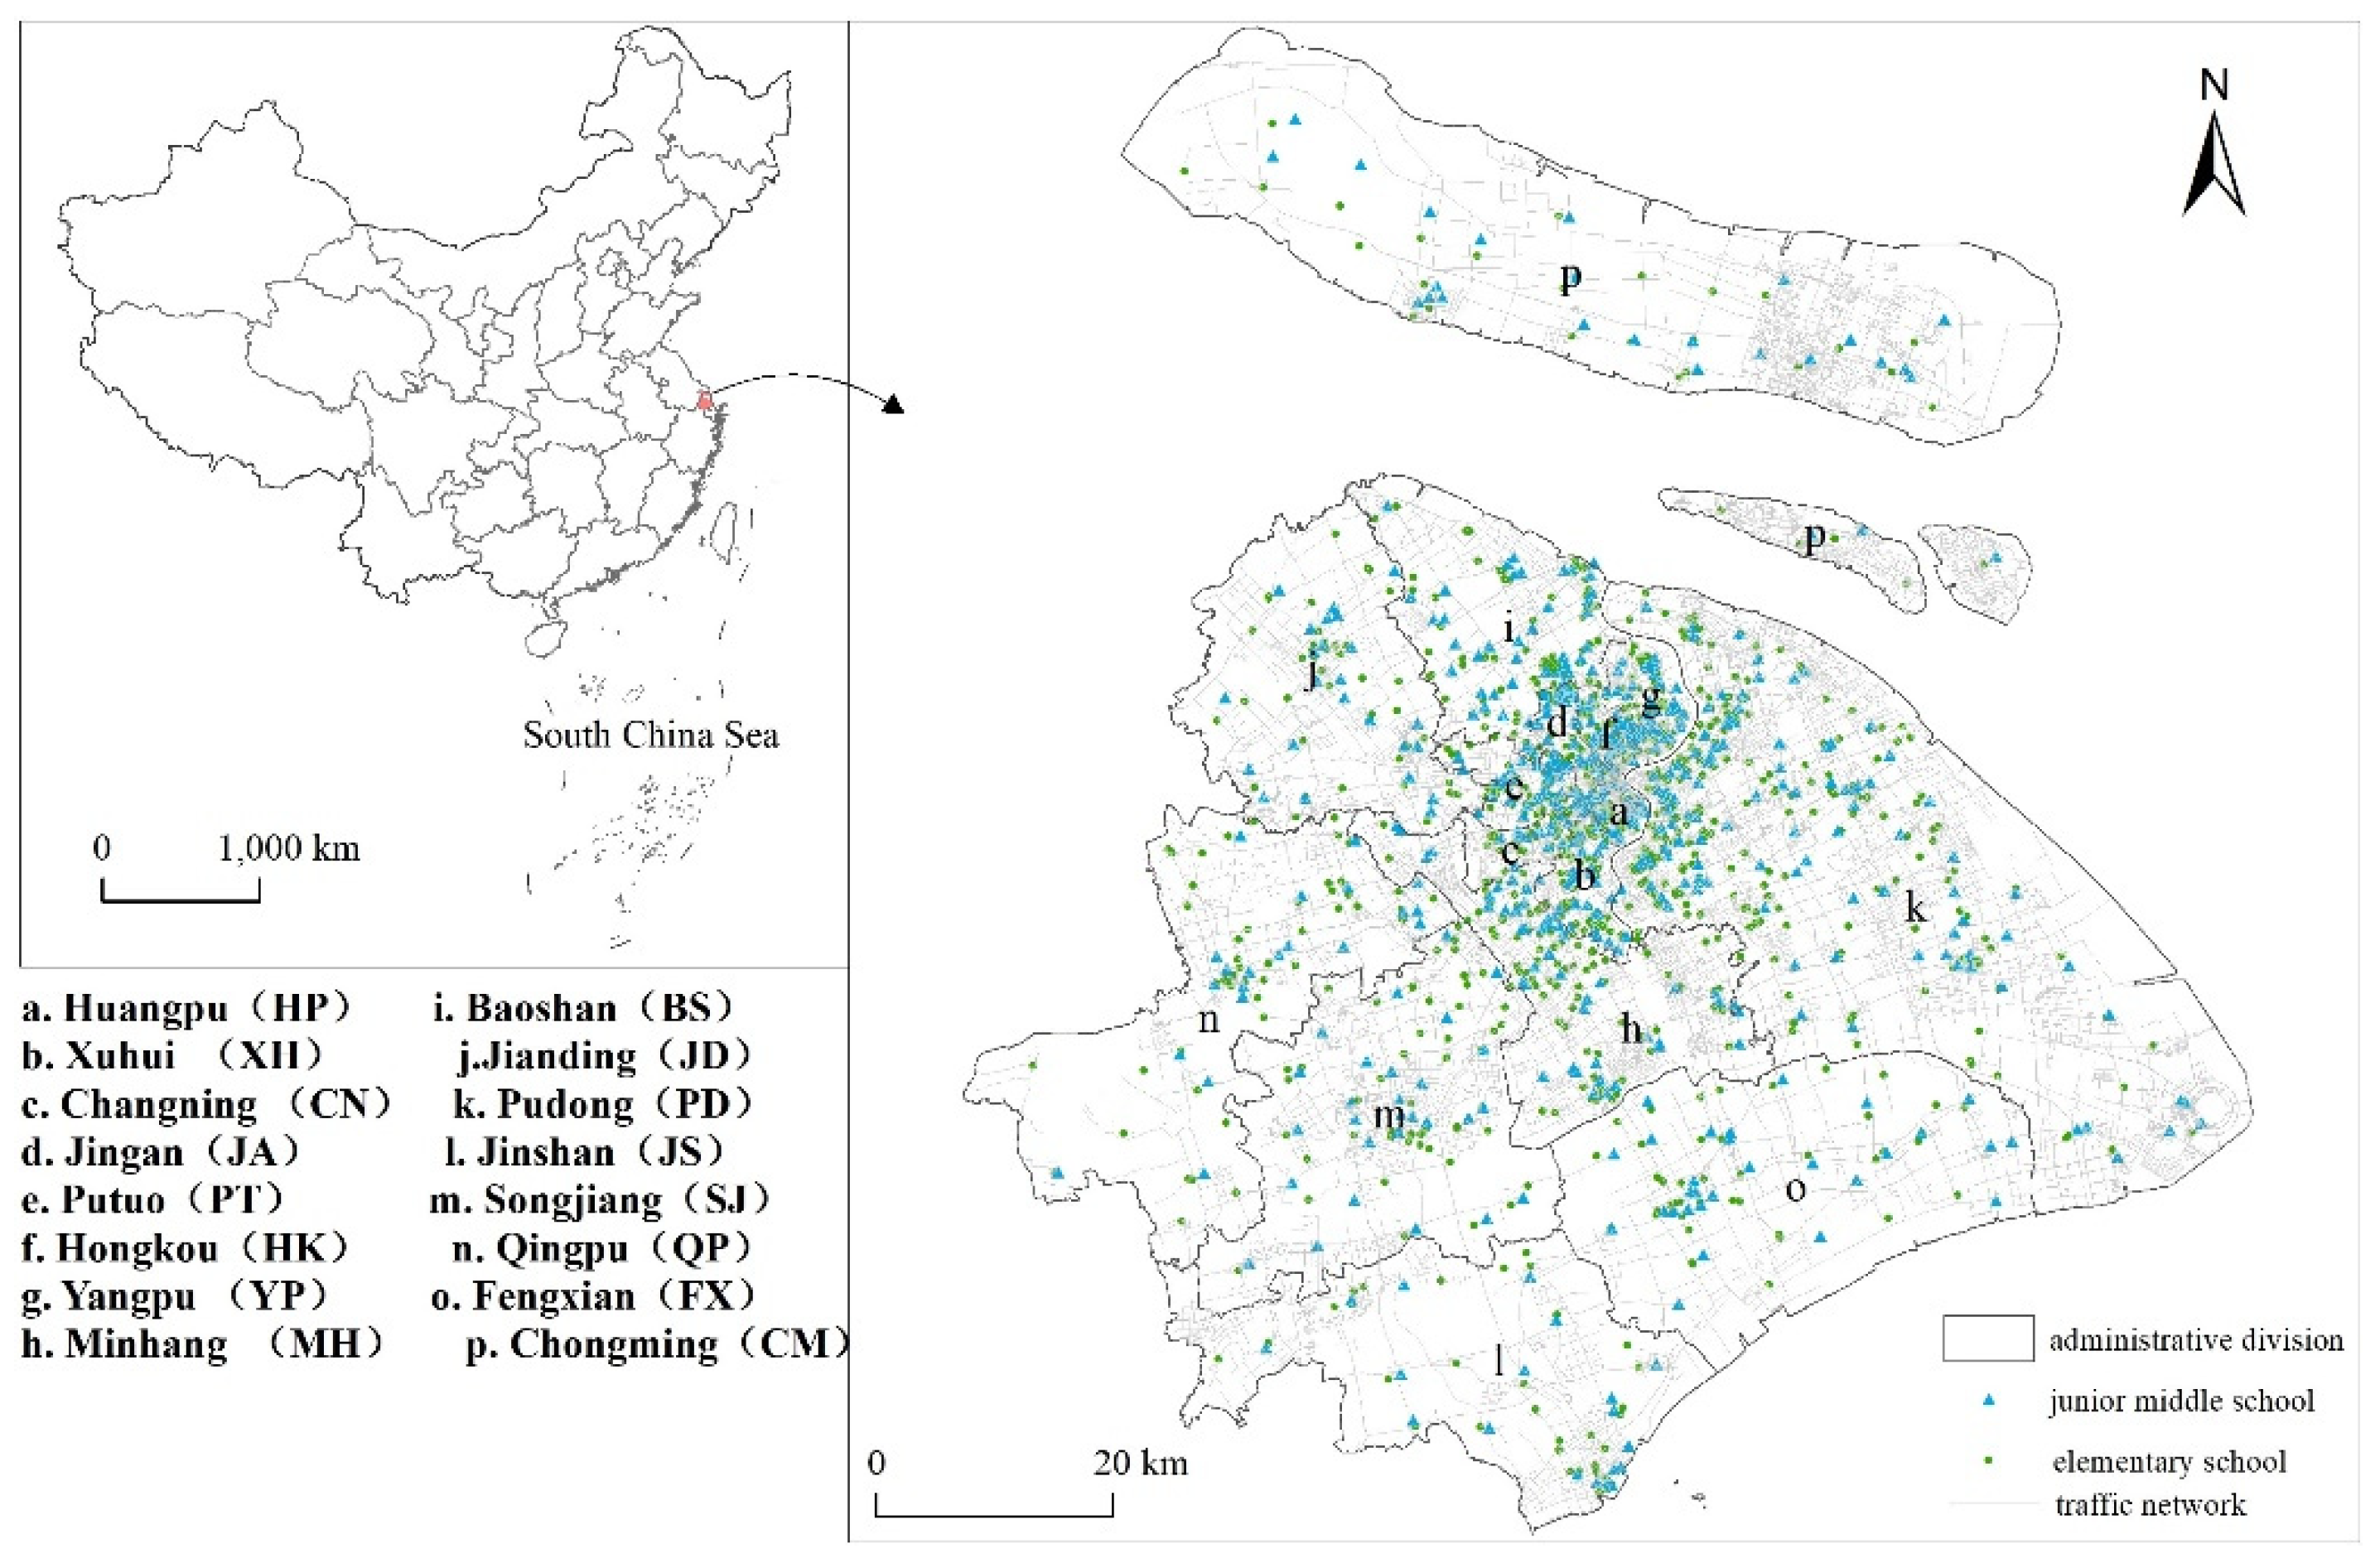
2.1. Study Area

As shown in Figure 1: Shanghai is located in the Yangtze River Delta region, East China, at the estuary of the Yangtze River and the East China Sea. It borders Jiangsu and Zhejiang Provinces in the North and West and is between 120°52′–122°12′ E and 30°40′–31°53′ N. Shanghai is a central and megacity in China, and it is an international economic, financial, trade, education, science, and technology innovation center. The education development of Shanghai is already among the highest levels of education in China. Among them, the balanced proportion of basic education, the consolidation rate of basic education, and the number of international students are higher than the average level of China, and the education infrastructure in economically developed areas is also relatively perfect. However, there are still some differences between the main urban area and the suburbs. Therefore, the study area of this research was based on the following 16 main districts in Shanghai: Huangpu, Xuhui, Changning, Jingan, Putuo, Hongkou, Yangpu in the main city; and Pudong in the semi-urban and semi-suburban areas; and Minhang, Baoshan, Jiading, Jinshan, Songjiang, Qingpu, Fengxian, and Chongming District in the suburban areas. This study focused on the spatial distribution pattern characteristics of kindergarten, elementary, and junior high schools in Shanghai and these three school types’ overall spatial distribution proportions to explore the imbalance of their spatial distribution.

2.2. Data Source and Processing

This study used Baidu Maps as the data source. The “POI query” function (Maice Data Technology) was used to input the keywords “Shanghai kindergarten” and “Shanghai elementary school”, and the deadline was set to 24 March 2020. The POI data points found 2121 kindergartens, 945 elementary, and 534 junior high schools in Shanghai, and included the schools’ names, latitude and longitude coordinates, and addresses. The data preprocessing included coordinate correction, coordinate point reverse search, and address information correction and completion, which were used to construct the Shanghai school POI basic database. Data post-processing included district name extraction and street name determination. In addition to the POI data, the supporting data also included the administrative divisions of the study area from the national basic geographic information system database. The construction land data for Shanghai between 1990 and 2020 were from the Institute of Geographical Sciences and Resources, the Chinese Academy of Sciences. Because the POI data is only in 2020, to study the influence of construction land expansion on school distribution in different periods, the construction land was divided into four growth cycles and superimposed with the POI data. 100 m × 100 m Shanghai population data is taken from WorldPop (https://www.worldpop.org/accessed on 26 September 2020).

2.3. Method

2.3.1. Kernel Density Estimation (KDE)

KDE is a nonparametric estimation method that is widely used in the spatial analysis of point data. Its purpose is mainly to estimate the density of point patterns with the help of a moving cell, obtain diagrams of the change of element density, output the continuous spatial distribution results, and reflect the relative agglomeration degree of the point distribution [55]. This study used ArcGIS software to both obtain the KDE distribution of all kinds of outlets and extract the KDE grid value of three school types. The natural segment method was used to divide them into five categories for comparative study.

2.3.2. Nearest Neighbor Indicator (NNI)

NNI counts the mean value of the closest distance between different points. This method is based on the distance of the points and is mainly used to measure the overall agglomeration and dispersion of the point distribution [56]. The calculation formula is:
d ( N N O ) = i = 1 n m i n ( d i j ) n
d ( N N E ) = 0.5 A n
N N I = d ( N N O ) d ( N N E )
where n is the number of points, min (dij) is the distance from point i to the nearest neighbor, d(NNO) is the observed average nearest neighbor distance, d(NNE) is the theoretical average distance under the condition of random spatial distribution, and NNI is the standardized nearest neighbor distance index. NNI < 1 tends to agglomerate points, NNI > 1 tends to disperse points, and NNI = 1 is the random distribution. The results were tested for reliability using the z-test.

2.3.3. Ripley’s K-Function Analysis

The NNI can judge the overall spatial agglomeration characteristics of various outlet types but cannot judge the agglomeration characteristics on different spatial scales. Ripley’s K function is a multi-distance spatial clustering analysis. It is a common method for point pattern analysis, and the number of points is counted according to the search circle range of a certain radius distance [57]. This study used it to analyze the spatial agglomeration patterns of Shanghai’s kindergartens, elementary, and junior high schools on different spatial scales. The calculation formula is:
K ( t ) = A i = 1 n j = 1 n w i j ( t ) n 2
L ( t ) = K ( t ) π t
This paper uses a common transformation of Ripley’s K function analysis, i.e., L (t), where A represents the area of the study area, n represents the number of school points, and wij(t) represents the actual distance between schools i and j within distance t. L (t) is the observed value of K, if L(t) is less than the expected value of the random distribution (that is, a negative value), then schools have the trend of discrete distribution. If L(t) is greater than the expected value (that is, a positive value), then the school has a trend of agglomeration distribution. The larger the gap between the observed L(t) and the expected value of random distribution, the higher the degree of clustering, and the corresponding t-value represents the distance used to measure the agglomeration scale.

2.3.4. Colocation Quotient Analysis (CLQ)

CLQ is usually used to judge whether an industry constitutes a specialized department of a region [58]. It is widely used in regional economics and geography. CLQ is a derivative form of the location quotient, which can be used to measure the proximity degree of distribution between different types of points. Leslie et al. verified and improved the formula for CLQ, taking Phoenix as an example to analyze the relationship between different industries [59]. The current study used it to study the proximity of the different school spaces, and the calculation formula is:
C L Q A B = C A B / N A N B / ( N 1 )
where CLQA→B refers to the CLQ of A “attracted” by B, CA→B refers to the number of A-type outlets close to B-type outlets (relative to A-type outlets themselves), NA and NB refer to the number of dot types A and B, respectively, and N is the total number of two outlets. When CLQA→B is less than 1, A tends to be far away from B; when CLQA→B is more than 1, A tends to be close to B. This study used CLQ to measure the spatial proximity relationship of POI points between kindergarten and elementary schools and junior high schools.

3. Results

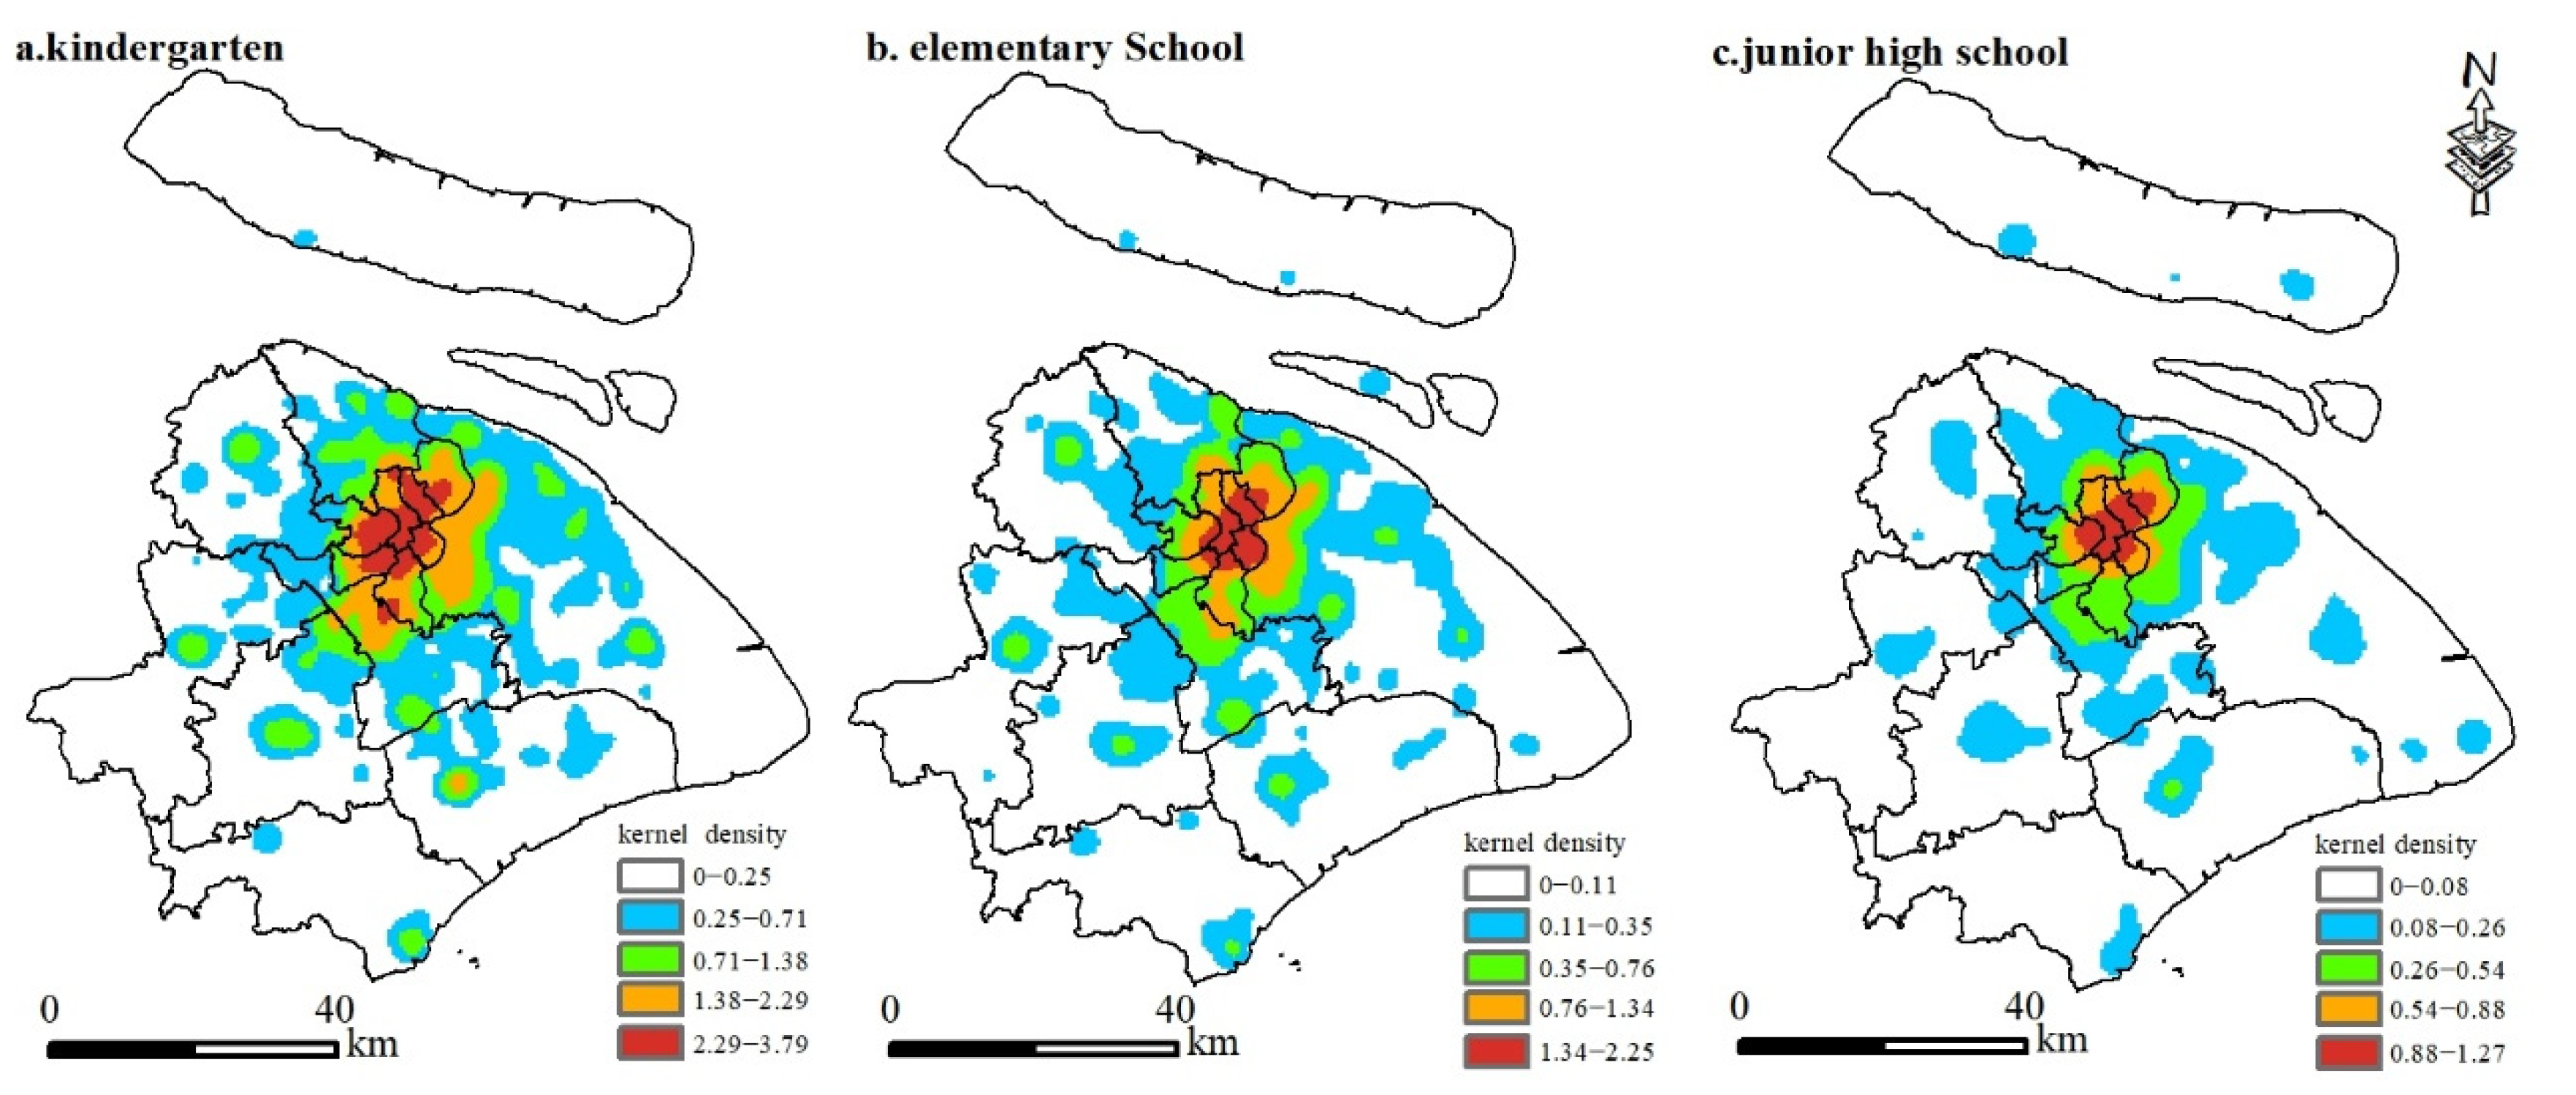
3.1. Characteristics of the Spatial Distribution of Schools

From the results of the kernel density analysis presented in Figure 2, I used “the three school types” here as this paragraph contains the results for the three school types here. The spatial distribution of the three school types showed the characteristics of core area clustering and multiple circadian distributions. The morphological consistency of the distribution among the kindergarten, elementary, and junior high schools in Shanghai was significant, while the difference was not very significant. For consistency, the high-density KDE values of the kindergarten, elementary, and junior high schools were mainly concentrated in the inner seven districts of Shanghai (Yangpu, Hongkou, Jingan, Putuo, Changning, Xuhui, and Huangpu District) and in the outer ring of Pudong District, showing a circled distribution pattern and a pooling of consecutive slices. In addition to the high KDE value, there were eight gathering centers located in Jiading, Qingpu, Songjiang, Jinshan, Fengxian, Baoshan, and Minhang District, as well as the central area of Pudong District. Overall, the distribution showed a “circled + multicentric” morphology. Differentially, the KDE’s extremely high values were ranked from high to low as kindergarten > elementary > junior high schools. The area covered by the KDE’s high values also conformed to this rule, with the extremely high values in the inner seven districts being larger than the kernel density’s extremely high values in the outer eight centers, and the peripheral distribution was also more sparse.
At the same time, this paper superimposes the three types of schools with the 100 m × 100 m grid population distribution data of Shanghai, and carries out the correlation test through SPASS software. Figure 3 shows that the population distribution is consistent with the distribution of POI, with typical core area agglomeration and multi circle spatial distribution characteristics, where the correlation coefficient reaches 0.7. It proves that the distribution of schools is highly positively correlated with the distribution of the population. This imbalance of population distribution will aggravate the imbalance of school distribution because schools are mainly established to meet people’s needs.
Combined with the NNI distance (see Table 1), the spatial distribution of the kindergarten, elementary, and junior high schools in Shanghai all exhibited significant spatial clustering characteristics. Table 1 shows that the NNI values of the three school types in the overall range are all less than 1.0, the confidence level is 99%, and they all show a significant agglomeration distribution pattern. However, the degree of agglomeration differs, and is ordered as follows: kindergarten > elementary > junior high schools. The clustering characteristic of this decreasing trend, mainly influenced by the radiation range of the schools, is that the area served by junior high schools has the largest number of elementary schools followed by the smallest number of kindergartens, thus leading to a higher number of kindergartens than elementary schools in the same area and a higher number of elementary schools than junior high schools. Moreover, kindergartens, elementary, and junior high schools are significantly regulated by the government in their spatial configuration, and their distribution in the central urban area is relatively dense.
Although all three school types appear to be significantly spatially clustered, there is a significant difference between aggregate intensity and size, reflecting the differential characteristics of spatial distribution among the three types. To describe the clustering patterns across the schools in more detail, this study used Ripley’s K-function in ArcGIS software. As shown in Figure 4, the results found that the overall observed value of the L(t) curve was larger than the expected value for all types of outlets, in an agglomerated distribution pattern, and all passed the examination at a 99% confidence rate. From the spatial feature scale of agglomeration, the difference between the observed and predicted values at the peak and the corresponding distance at the peak showed that the agglomeration degree of the three school types first increased but then decreased as the spatial scale increased. From the aggregated spatial feature scale, the three school types were showed the following order: kindergarten (20,387 m) > elementary (19,633 m) > junior high school (16,868 m). The corresponding L(t) peak represented the aggregation intensity and showed the following order: kindergarten (18,008 m) > elementary (17,249 m) > junior high school (15,936 m). The aggregation size and the aggregation intensity showed the following order: kindergarten > elementary > junior high school, which is consistent with the results obtained from the KDE and the nearest neighbor analysis because there was a hierarchy variability in the schools themselves, and this variability was also spatial in the same case.

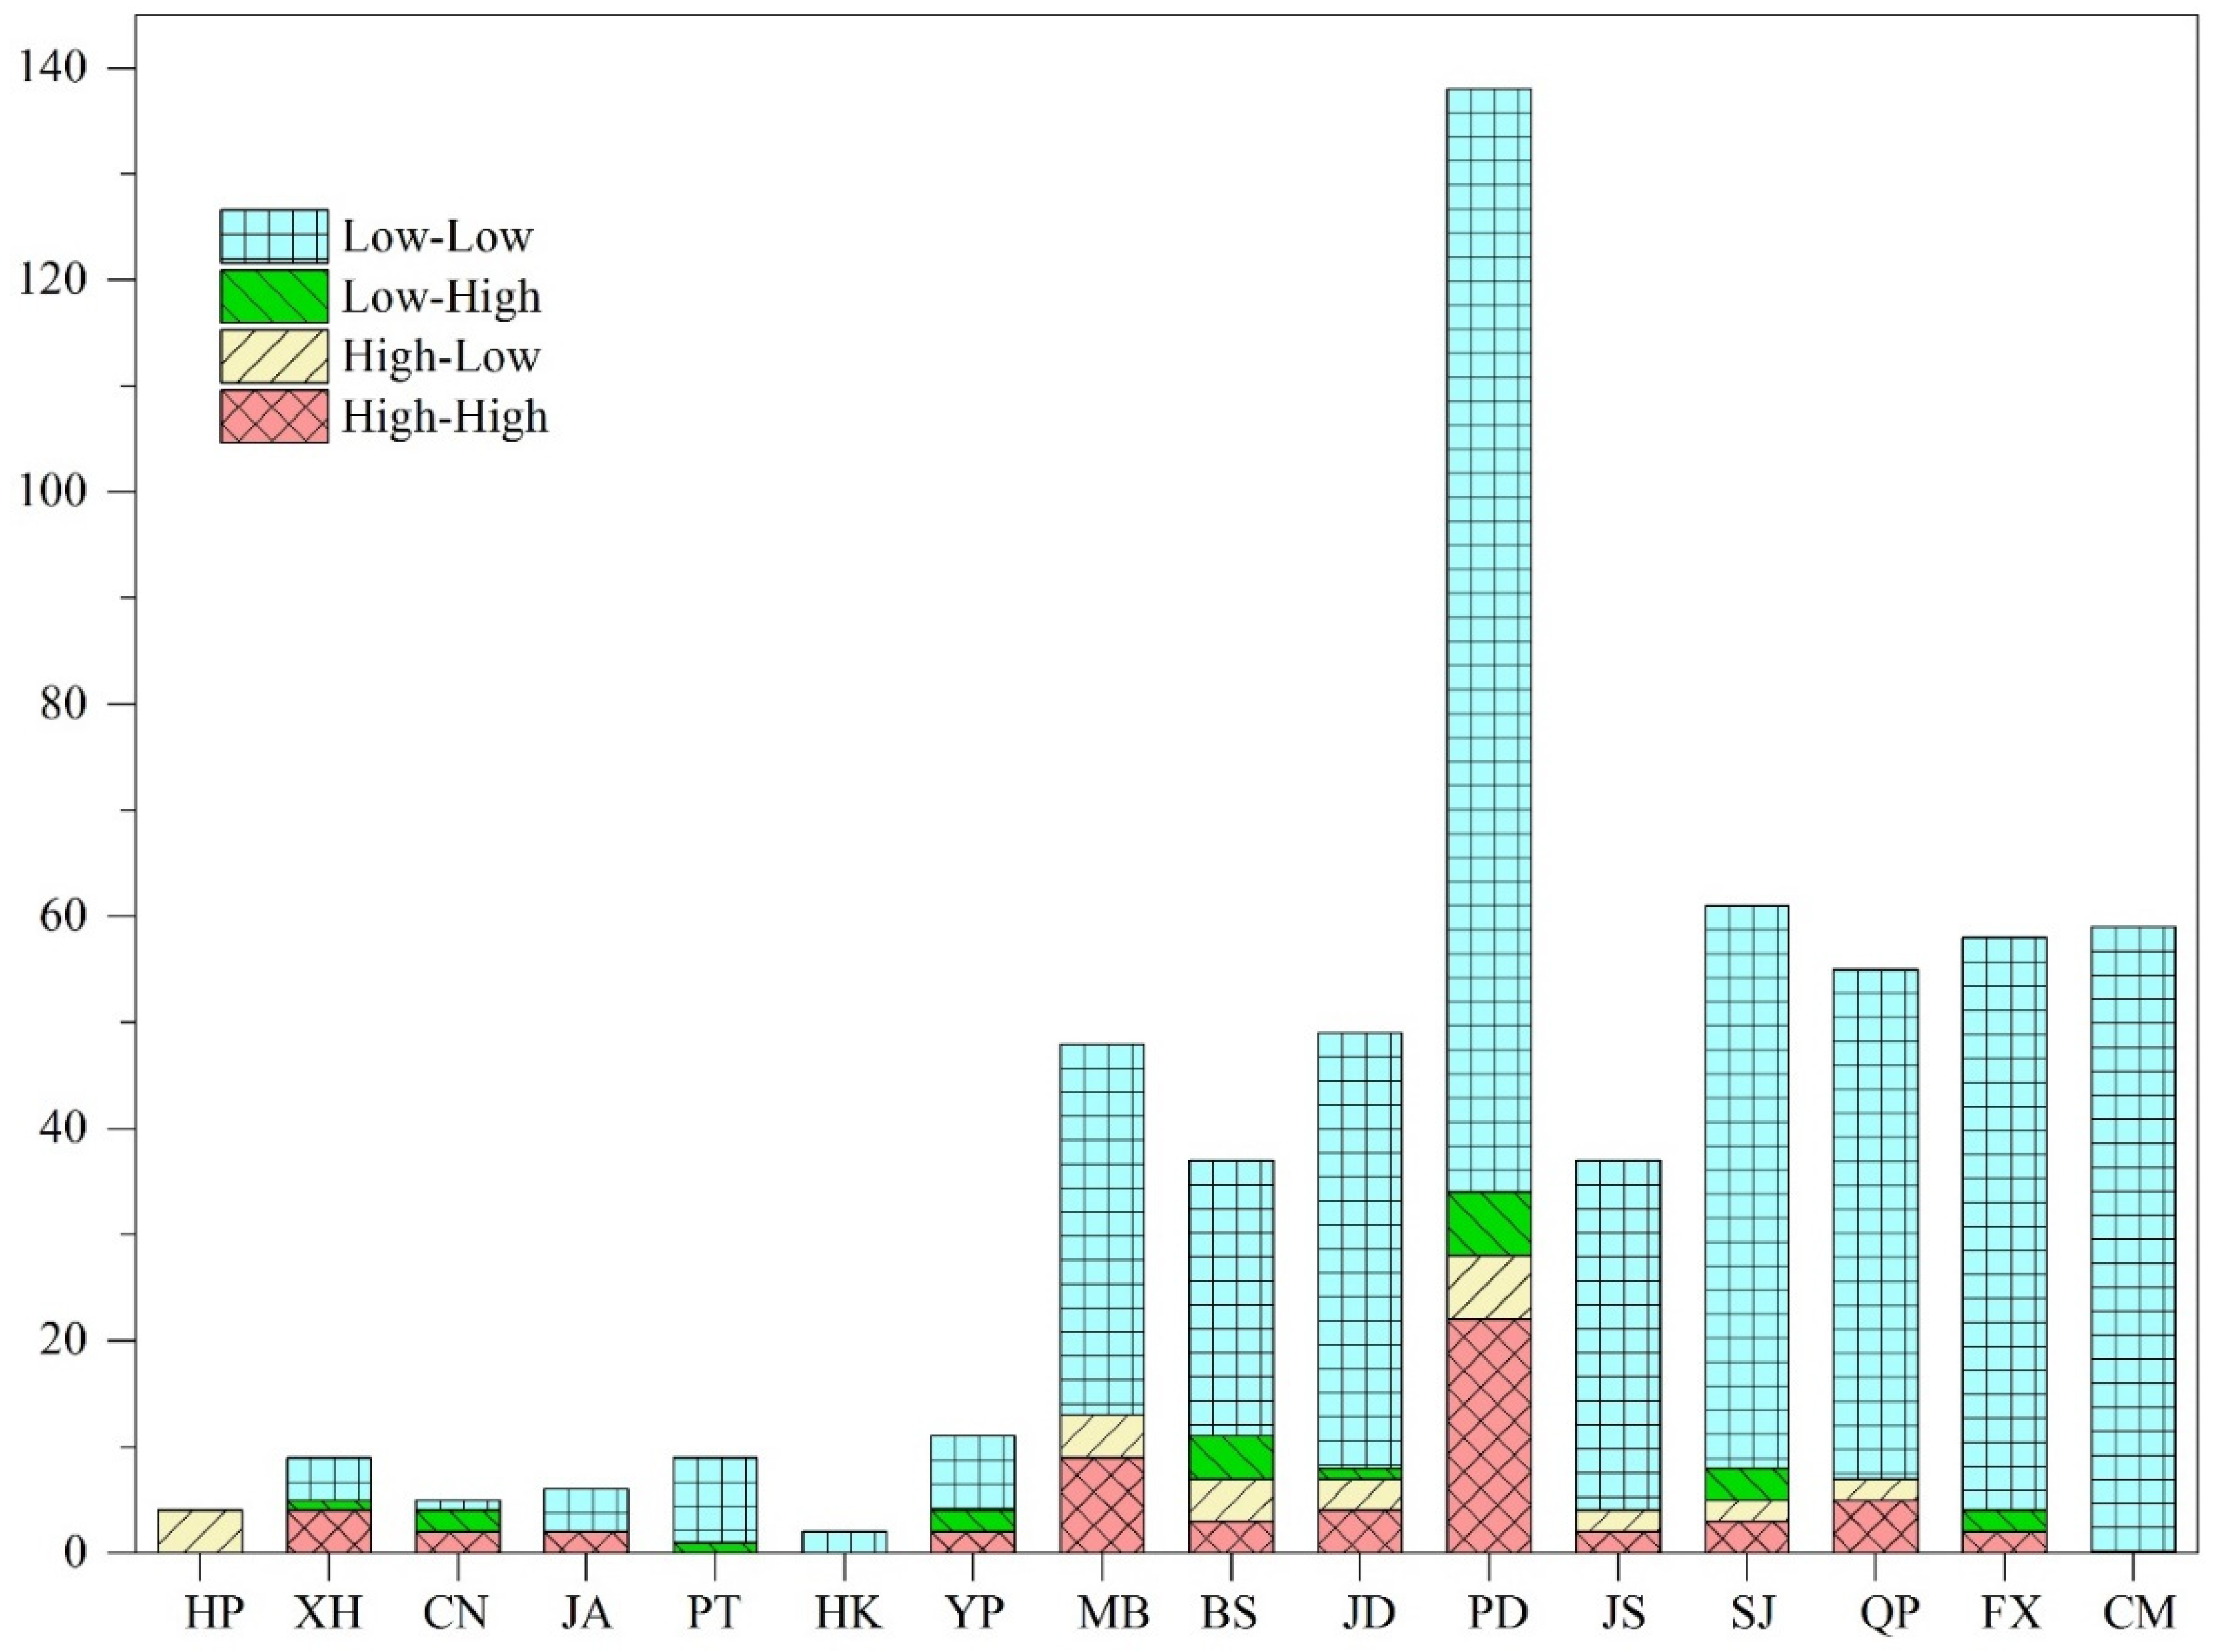
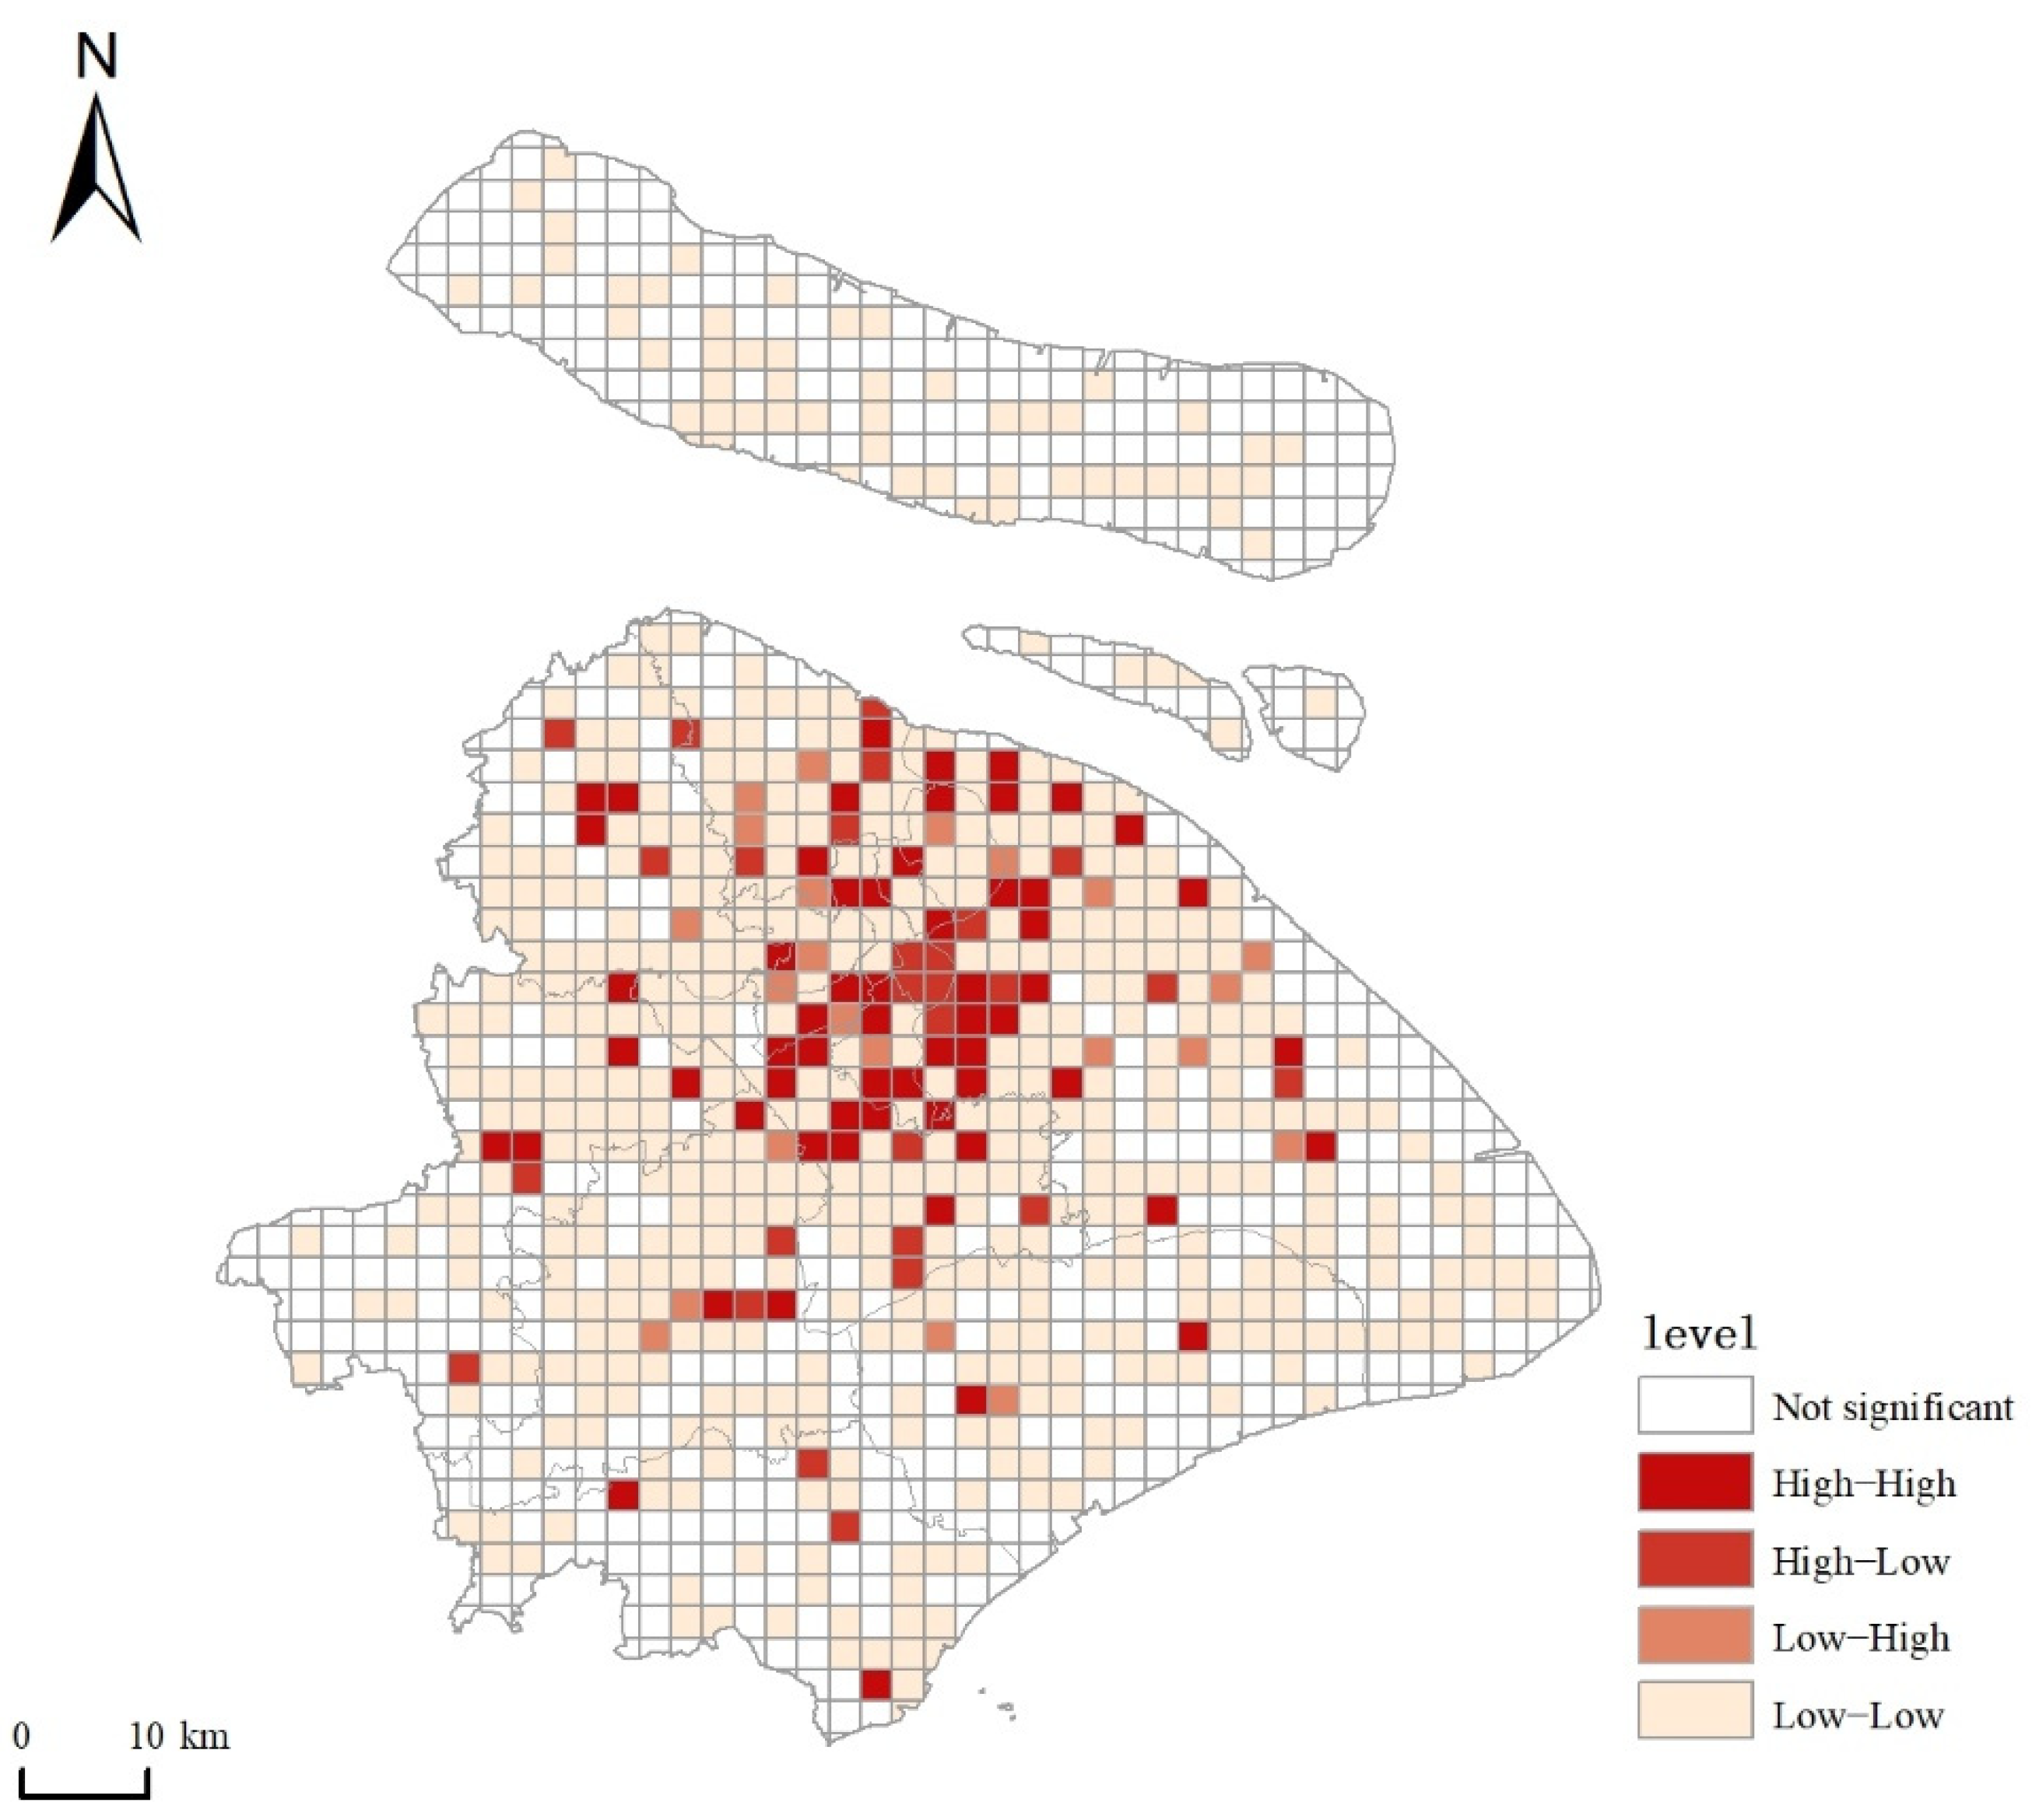
3.2. Spatial Structure Distribution Equilibrium among School Types in Shanghai

To study the spatial structure composition of the kindergarten, elementary, and junior high schools, a buffer was created with a radius of 2500 m to analyze the intersection of the three schools. As shown in Table 2, 1723 kindergartens were clustered in the elementary school-centered buffer, while 626 elementary schools were clustered in the junior high school-centered buffer. The calculated results were used as input values to analyze the spatial proximity among the kindergarten, elementary, and junior high schools in Shanghai using the same CLQ method. The results showed that C kindergarten → elementary school = 2.30, C elementary school → junior high school = 1.85, and the values of the same CLQ were all greater than 1, showing the proximity of the spatial distribution of schools. In turn, C elementary → kindergarten = 0.81 and C junior → elementary = 0.63 were all less than 1, showing discrete state distribution. Schools that were spatially distributed with low levels tended to resemble the characteristics of high-level schools.
Since the distribution of schools tended to go from low levels to high levels, a 2500 m × 2500 m grid was constructed based on the administrative divisions in Shanghai, resulting in 1233 grids, of which 589 showed the school point distribution. The different classes within each grid were obtained by the spatial linkage function of ArcGIS software in order to visualize the regional-level relationships spatially for the number of school type points, and the proportional relationship was constructed based on junior high schools. From the average proportional relationship between the number of the three school types in Shanghai, the junior high school: elementary school: kindergarten ratio was 1:1.77:3.89, which indicates that there were 1.77 elementary schools and 3.89 kindergartens for every one area near a junior high school. The number of the three school types within each grid was statistically analyzed and contrasted with the average proportional relationship, as shown in Table 3. Four levels were divided according to how many schools were distributed and used to indicate the equality of spatial distribution. Quantitatively, the imbalance of the spatial structure distribution among the schools in Shanghai was significant and lower than the average proportional relationship in Shanghai overall, where the number of meshes with the high-high, high-low, low-high aggregation types was only 18.47%, and the total number of meshes with the low-low aggregation types was 81.53%.
Figure 5 shows that for the spatial distribution of schools in Shanghai, kindergarten, elementary, and junior high schools have an unbalanced distribution overall. The agglomeration characteristics of the seven districts within Shanghai are significant, while the polarization distribution of Pudong District obviously shows the phenomenon of being “high in the northeast and low in the southeast”, and the suburban areas have an unbalanced distribution in the core areas overall; that is, the distribution of the three school types are all lower than the average for Shanghai. From the distribution of different levels in the administrative region (Figure 6), high-high agglomeration is mainly distributed in the main urban area, with 10 grids and 22 grids in Pudong District. The most distributed district in the suburbs is Minhang, with nine grids. The other districts (in order) are: Qingpu, Jiading, Baoding, Songjiang, Baoshan, Jinshan, and Fengxian. There is no high-high agglomeration in Chongming District; however, high-low agglomerations and low-high agglomerations are mainly distributed in the west Pudong District, southeast Baoshan District, and north Minhang District because the development of the main city district has reached a certain scale. As these districts are relatively close to the main city district, there will be a certain phenomenon of population migration. Thus, the required number of schools will increase, and the agglomeration state will be more obvious with a relatively high level of agglomeration and reasonable distribution. Low-low agglomeration is mainly distributed in the suburbs and in Pudong District, which has the largest number (104), while most districts are distributed in the middle and in the southeast, close to Fengxian District. Overall, there is a trend of increasing distribution from northeast to southeast. In the future, the investment and development of education should be carried out in this direction to improve the unbalanced spatial distribution of schools in the southeast. Since the proportion of the low agglomeration grids is large, this distribution state leads to the imbalance of the spatial distribution of basic education in Shanghai overall.

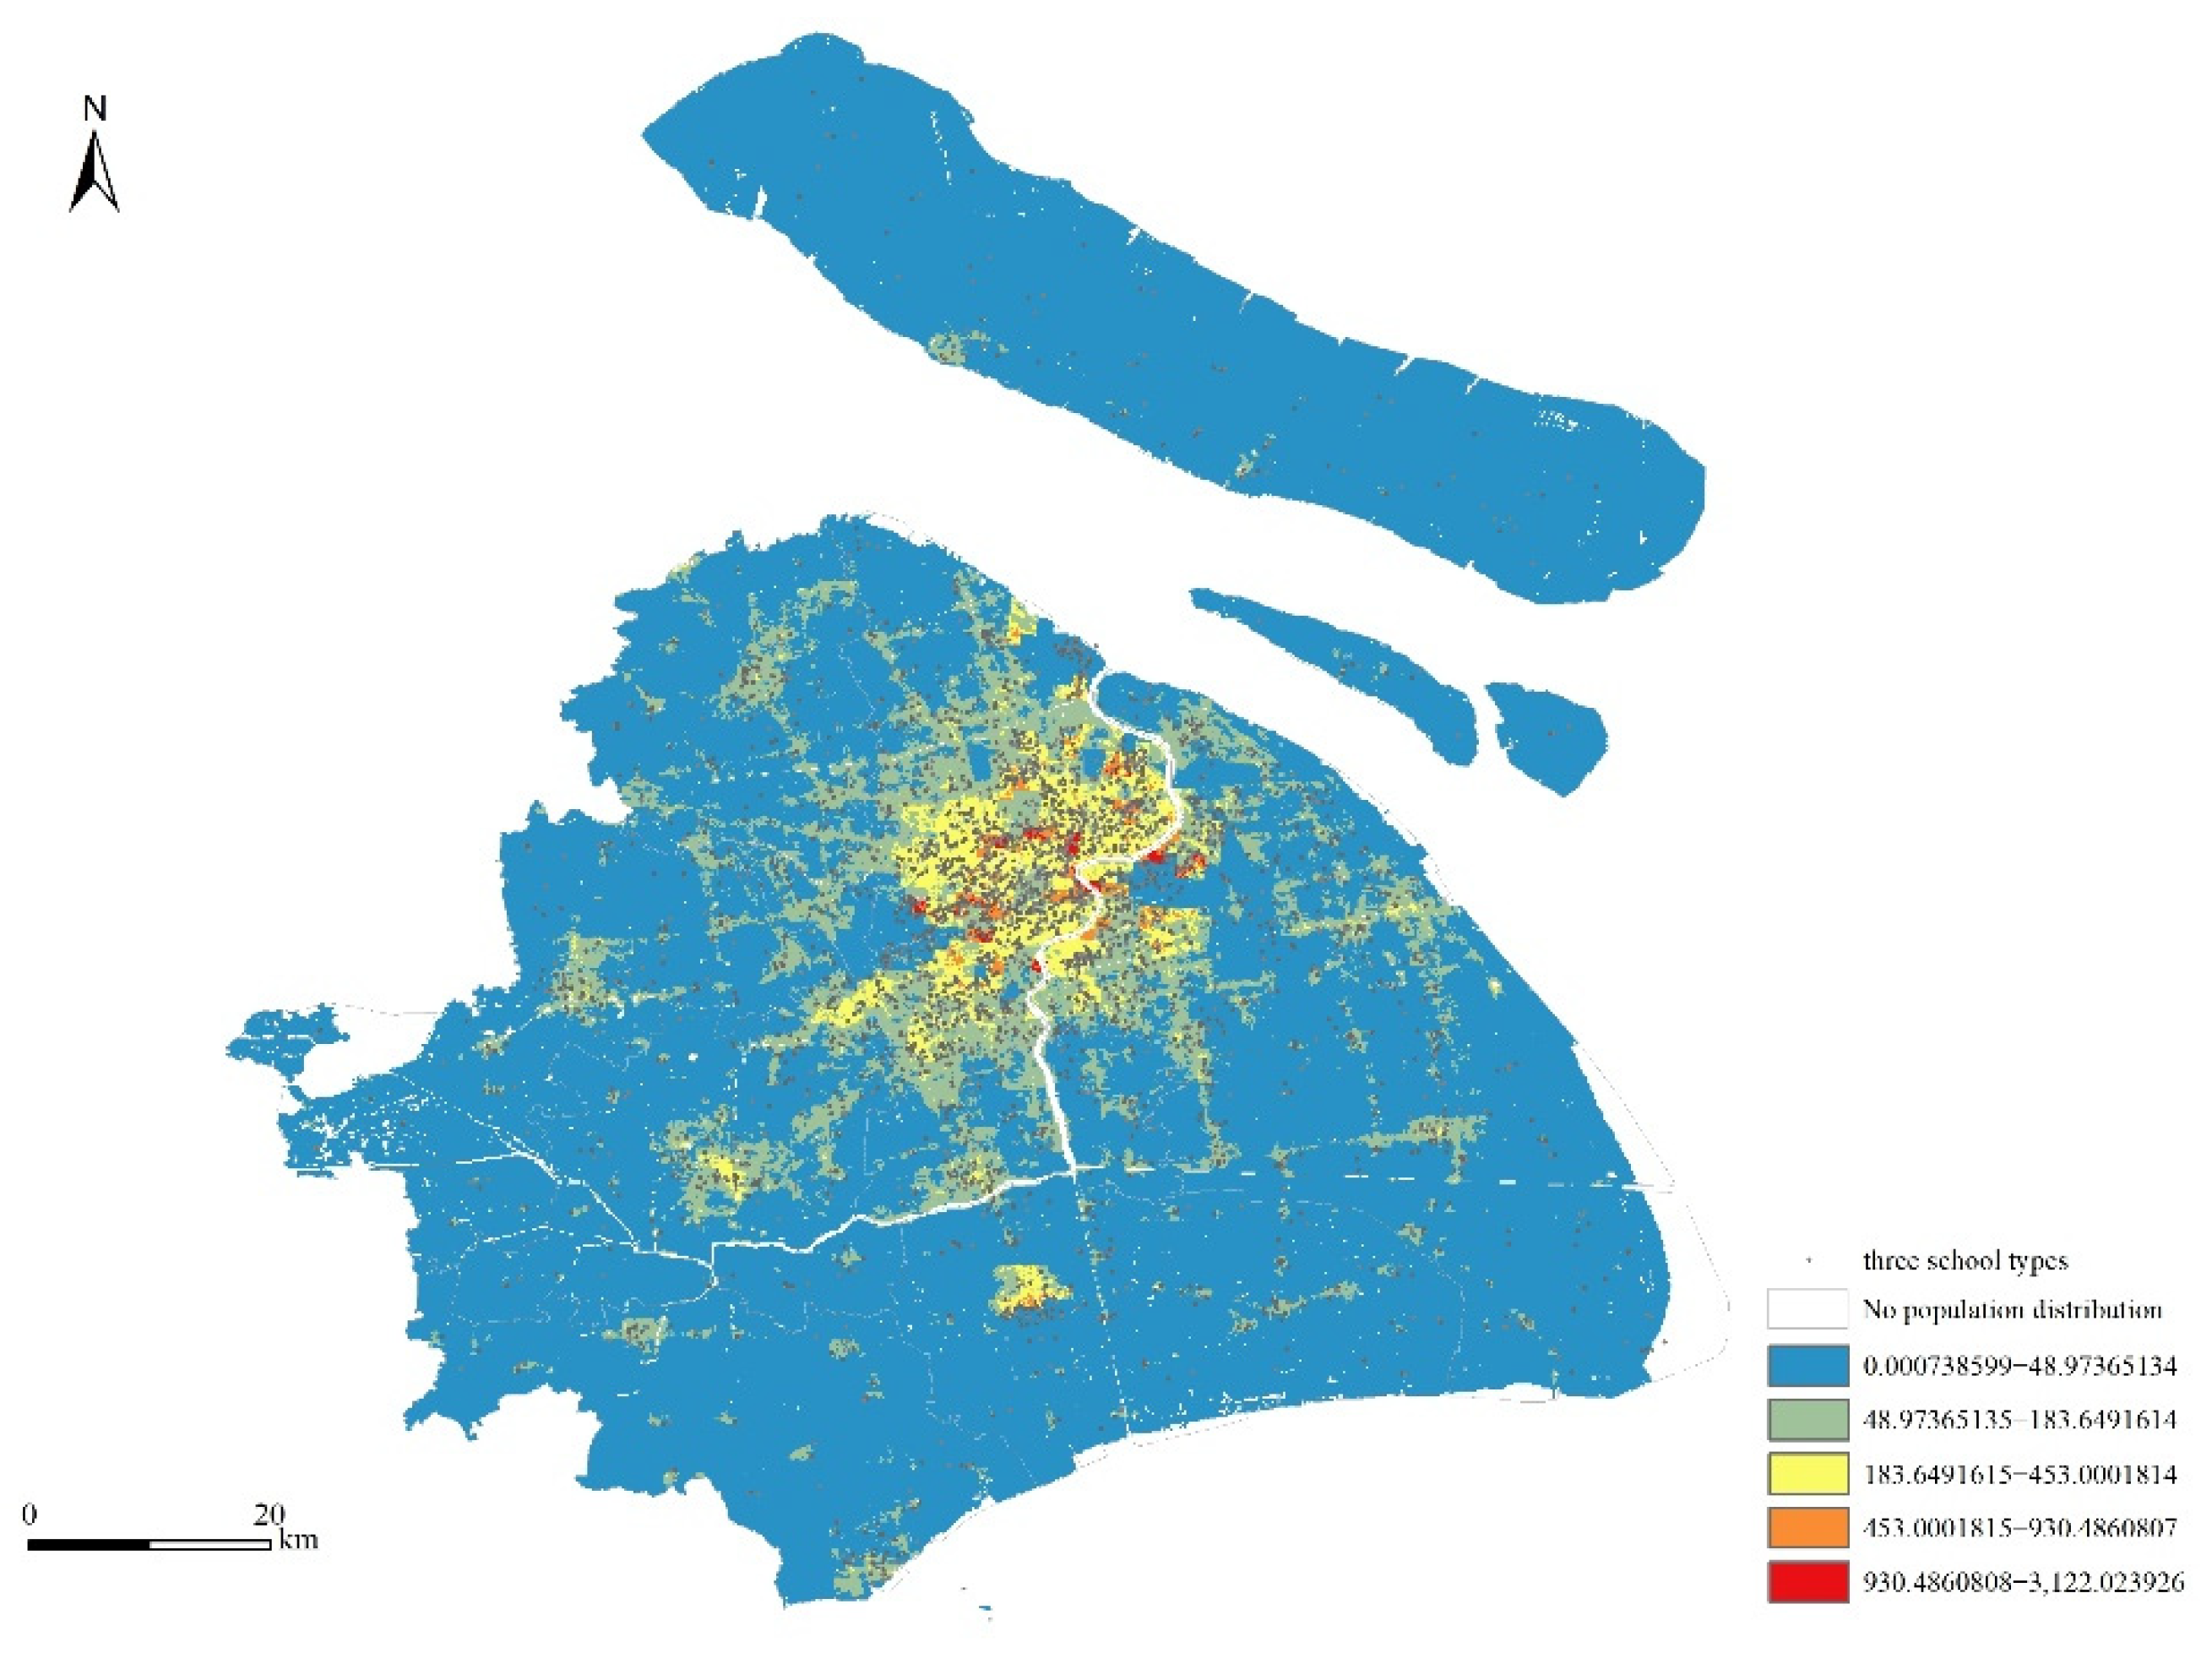
3.3. Impact of the Cycle of Construction Land Growth on the Distribution of Schools

Since the change in location will not be obvious after a school is built and the expansion of construction land will have an effect on the density of its distribution, the data from the newly-added construction land between 1990 and 2020 were selected to be superimposed with school POI points, and the expansion area of the construction land and the change in the distribution of the school sites in different growth periods were obtained.
The combination of the construction land plots with the point density distribution of the three school types (see Figure 7) and the specific number of distributions (see Table 4) yielded the following results. Between the 20-year and 30-year growth cycle periods, the construction land expansion trend was mainly driven by the inner seven districts of Shanghai to the surrounding adjacent areas and was particularly prominent in the Minhang and Baoshan Districts. Pudong District was spread eastward from the outer ring area, and the other areas were all expanded and connected on the basis of the original construction land blocks, with a total growth area of 215.58 km2. There were 397 schools on the newly-constructed land during this period. The expansion of the construction land between the 10-year and 20-year growth cycles was similar to the expansion in the previous period. However, it is obvious that the seven districts within the city did not significantly expand to reach certain saturation. There were 205 schools on the newly constructed land during this period. There were 1053 km2 of newly-constructed land between the 10-year growth cycle and the current stage, increasing the number of schools (686). The expansion of construction land from the city center to the suburbs had a significant trend. Jiading, Qingpu, and Songjiang District had a large growth area, and Pudong District continued to expand to the southeast. Although the expansion of the construction land area was positively correlated with the distributed number of schools, the density of the school points within the construction land expansion continuously decreased. This can be seen by comparing the density of the school POI points between the 30-year growth cycle and the current stage, where the density of school points under the 30-year construction land formation cycle was 3.06/km2, which was much higher than the current phase of 1.47/km2. With the shortening of the growth cycle of construction land, the distribution direction of school sites was consistent with the expansion direction of construction land, which was extended from inside to outside of the city. Although the construction land area gently increased, the distribution of school sites was increasingly sparse, and most were located in the suburbs with a relatively low degree of development.

4. Conclusions and Discussion

This study constructed a 2500-m grid based on POI point data from kindergarten, elementary, and junior high schools in Shanghai using CLQ and Ripley’s K-function. A variety of spatial point pattern analysis methods comparatively analyzed the spatial distribution pattern and the spatial aggregation characteristics of the kindergarten, elementary. Junior high schools in Shanghai, the grade of the spatial distribution of schools within the grid, and the impact of different long-term construction sites in combination with the school POI point to explore the distribution patterns of the schools. The following conclusions are drawn.
(1) The distribution of kindergarten, elementary, and junior high schools in Shanghai show remarkable consistency and little difference; overall, they show the spatial distribution characteristics of core area clustering and the coexistence of multiple circadian layers. The extremely high KDE values and covered areas rank as follows (from large to small): kindergarten > elementary > junior high school. The NNI values of the three school types are less than 1.0, with a confidence level of 99%, showing a significant clustering distribution pattern. The degree of aggregation is as follows: kindergarten > elementary > junior high school, while the aggregation size and agglomeration intensity of the three school types is as follows: kindergarten > elementary > junior high school, the spatial distribution characteristics of the three types of schools are highly positively correlated with the population distribution. This phenomenon is not only influenced by government planning but also has remarkable historical development inertia, with the seven districts within Shanghai persisting as the regions where the educational facilities are concentrated, and, with these excellent educational resources, they belong in the core region. However, the eight aggregation centers outside the core area result in a “inside high and outside low” center edge structure of schools due to the lack of relevant supporting resources, such as population migration, lagged economic development, and transportation conditions [2,3]. In the context of China’s rapid urbanization [60], the development of large cities have had an expanding morphology, from a concentric layer format to a decentralized group format [61], and this urban morphology can also directly affect the allocation of basic educational resources, resulting in a relatively perfect distribution of basic educational resources in urban areas and a relative lag in peri-urban areas. Therefore, the rational allocation of educational resources in Shanghai should be coalesced in the future and should focus on more developmentally lagged suburban areas to reduce the gap in peri-urban educational development.
(2) The structural composition of the schools in Shanghai shows uneven distribution. From the spatial relationship, C kindergarten → elementary school = 2.30, C elementary school → junior high school = 1.85, and the values of the same CLQ are all larger than 1. This indicates that low-level schools are close to the distribution of high-level schools, and that the overall distribution of kindergarten, elementary, and junior high schools in Shanghai is unbalanced. The agglomeration characteristics of the seven districts in Shanghai are significant and relatively balanced. The polarization distribution of Pudong District shows the phenomenon of being “high in the northeast and low in the southeast”. The suburban area shows the overall unbalanced distribution of the core area. In the context of high-speed development, government planning and school consolidation can lead to an imbalance in the allocation of regional resources, with consequences for the structure of schools. The results show that schools in the suburban areas of Shanghai basically have low aggregation and an uneven distribution state, which is due to both the implementation of the school merging policy and the rapid urbanization background. Transportation and other infrastructure in the suburban areas are undeveloped, leading to an increase in students’ commuting distance, which, in turn, aggravates the imbalance in the distribution of educational resources. The results show that educational infrastructure is relatively well-established, in contrast to the urban areas, and the distribution of schools presents a state of high clustering overall. Students are not restricted by distance, and the number of the three school types is also more evenly distributed. Therefore, special attention should be paid to the layout adjustment of educational resources to students’ education problems in remote suburban areas in order to prevent the blind “school merging policy” from causing an expansion of the educational gap within the city, which, in turn, may affect the intergenerational flow and opportunity fairness.
(3) The longer the construction land growth cycle, the greater the school point density, and the more consistent the school point distribution is with the construction land expansion direction. Although construction land has grown enormously, after three decades of evolution, the distribution of school sites is becoming more sparse, and the vast majority of schools are located in suburban areas where the degree of development is relatively low. The results show that, against the background of rapid urbanization in Shanghai, the distribution of schools in suburban areas is extremely uneven, with more schools concentrated in the core areas [62]. This is strongly associated with the School merging policy, as well as population migration [63,64], and the uneven distribution of schools in the peri-urban areas is also an important problem regarding educational development in Shanghai.
As this study’s research area was more refined, the research needs were difficult to meet using data from traditional census statistics or fieldwork, and the data are less time-consuming, while the use of POI data made it easy to achieve a more detailed study using different scales because of the advantages of a large volume of data, easy acquisition, and spatial attributes. This leads to new research content and methods for the study of spatial balance in urban education. Previous studies on the equilibrium of basic education have mostly focused on the resource fairness and spatial equality of education [65,66], while most of the research scales that have focused on the provincial level [67,68,69] lack the meticulous analysis of the intra-urban and peri-urban contrast from the prefectural-level urban scale. Further, many studies have focused on a single educational resource, while few have focused on the analysis of kindergarten, elementary, and junior high schools. Therefore, the current study is innovative from its research data and perspective, specifically from the combination of spatial POI big data to analyze the distribution of the three school types in Shanghai. In addition to studying the spatial distribution pattern characteristics of the three school types, this study also divided the grid to assess their overall spatial structure composition relationship. It then analyzed the imbalance of their spatial distribution and the superimposition between the growth cycle of construction land and the school points to study the impact of the construction land expansion on the distribution of schools, which provides a new perspective for studying the spatial equilibrium of basic educational resources.
This study included some limitations. First, it considered the characteristics of the distribution pattern and the spatial distribution equilibrium of schools but did not provide an in-depth exploration of the balanced influencing mechanisms and the resulting social effects. Further, the data are limited from only using 2020 POI data, which cannot make a perfect fit with the construction land data. Future studies should combine POI and construction land-use data with data on economic statistics, traffic networks, and others, based on the existing research. They should also discuss the coupling mechanisms and mechanisms of the uneven spatial distribution of schools within cities and should focus on considering the service radius of schools in basic education to provide relevant recommendations for spatial planning in basic education.

Author Contributions

Conceptualization, Z.Z. and W.L.; methodology, Z.Z.; software, Z.Z.; validation, Z.Z., W.L.; formal analysis, Z.Z.; investigation, Z.Z.; resources, Z.Z.; data curation, Z.Z.; writing—original draft preparation, Z.Z.; writing—review and editing, Z.Z.; visualization, Z.Z. and Z.L.; supervision, Z.Z. and C.T.; project administration, Z.Z.; funding acquisition, W.L. and M.S. All authors have read and agreed to the published version of the manuscript.

Funding

This research was funded by the Key Program of National Natural Science Foundation of China, grant number [42030409].

Institutional Review Board Statement

Not applicable.

Informed Consent Statement

Not applicable.

Data Availability Statement

The collection and preprocessing of data are in Section 2.2.

Acknowledgments

The authors would like to acknowledge all experts’ contributions in the building of the model and the formulation of the strategies in this study.

Conflicts of Interest

The authors declare no conflict of interest.

References

  1. Norman, C. Francis quality education and equality of educational opportunity. NASSP Bull. 1977, 61, 16–25. [Google Scholar]
  2. Burger, K. The socio-spatial dimension of educational inequality: A comparative European analysis. Stud. Educ. Eval. 2019, 62, 171–186. [Google Scholar] [CrossRef] [Green Version]
  3. Hu, L.; He, S.; Luo, Y.; Su, S.; Xin, J.; Weng, M. A social-media-based approach to assessing the effectiveness of equitable housing policy in mitigating education accessibility induced social inequalities in Shanghai, China. Land Use Policy 2020, 94, 104513. [Google Scholar] [CrossRef]
  4. Dhar, P.; Ross, S.L. School district quality and property values: Examining differences along school district boundaries. J. Urban Econ. 2012, 71, 18–25. [Google Scholar] [CrossRef]
  5. Allen, R. Allocating pupils to their nearest secondary school: The consequences for social and ability stratification. Urban Stud. 2007, 44, 751–770. [Google Scholar] [CrossRef] [Green Version]
  6. Yuta, K. The effect of school quality on housing rents: Evidence from Matsue city in Japan. J. Jpn. Int. Econ. 2018, 50, 16–25. [Google Scholar]
  7. Wen, H.; Xiao, Y.; Zhang, L. School district, education quality, and housing price: Evidence from a natural experiment in Hangzhou, China. Cities 2017, 66, 72–80. [Google Scholar] [CrossRef]
  8. Organisation for Economic Cooperation and Development (OECD). Equity and Quality in Education: Supporting Disadvantaged Students and Schools; Organisation for Economic Cooperation and Development (OECD): Paris, France, 2012. [Google Scholar]
  9. Xiang, L.; Stillwell, J.; Burns, L.; Heppenstall, A.; Norman, P. A geodemographic classification of sub-districts to identify education inequality in Central Beijing. Comput. Environ. Urban Syst. 2018, 70, 59–70. [Google Scholar] [CrossRef]
  10. Wen, J.; Chudan, G.U. The rural-urban differences in resources allocation of basic education and its social consequence: Base on the analysis of China’s education statistics. J. East China Norm. Univ. Educ. Sci. 2017, 35, 33. [Google Scholar]
  11. Yang, J.; Huang, X.; Liu, X. An analysis of education inequality in China. Int. J. Educ. Dev. 2014, 37, 2–10. [Google Scholar] [CrossRef]
  12. Wei, Y.D. Spatiality of regional inequality. Appl. Geogr. 2015, 61, 1–10. [Google Scholar] [CrossRef]
  13. Liu, R.; Li, T.; Greene, R. Migration and inequality in rental housing: Affordability stress in the Chinese cities. Appl. Geogr. 2020, 115, 102138. [Google Scholar] [CrossRef]
  14. Qian, X.; Smyth, R. Measuring regional inequality of education in China: Widening coast–inland gap or widening rural–urban gap? J. Int. Dev. 2008, 20, 132–144. [Google Scholar] [CrossRef]
  15. Li, W. Education inequality in China: Problems of policies on access to higher education. J. Asian Public Policy 2008, 1, 115–123. [Google Scholar] [CrossRef]
  16. Rodríguez, C.; Amador, A.; Tarango, B.A. Mapping educational equity and reform policy in the borderlands: LatCrit spatial analysis of grade retention. Equity Excel. Educ. 2016, 49, 228–240. [Google Scholar] [CrossRef]
  17. Li, Z.; Luan, W.; Zhang, Z.; Su, M. Relationship between urban construction land expansion and population/economic growth in Liaoning Province, China. Land Use Policy 2020, 99, 105022. [Google Scholar] [CrossRef]
  18. Wu, Y.; Zhang, T.; Zhang, H.; Pan, T.; Ni, X.; Grydehøj, A.; Zhang, J. Factors influencing the ecological security of island cities: A neighborhood-scale study of Zhoushan Island, China. Sustain. Cities Soc. 2020, 55, 102029. [Google Scholar] [CrossRef]
  19. Wu, Y.; Zheng, X.; Sheng, L.; You, H. Exploring the equity and spatial evidence of educational facilities in Hangzhou, China. Soc. Indic. Res. 2020, 151, 1075–1096. [Google Scholar] [CrossRef]
  20. Tianbao, L.; Liwen, Z.; Du, P. Spatial characteristics and distribution pattern of the equilibrium level of municipal compulsory education resources —Take Dalian primary school as an example. Econ. Geogr. 2018, 7, 67–74. [Google Scholar]
  21. Tangqi, T.; Dongsheng, Y.; Jianglong, C. Evolution of compulsory educational facilities in urban Nanjing. Sci. Geogr. Sin. 2019, 3, 433–441. [Google Scholar]
  22. Hannum, E.; Liu, X.; Wang, F. Estimating the effects of educational system contraction: The case of China’s rural school closure initiative. Econ. Dev. Cult. Chang. 2021, 70, 485–528. [Google Scholar] [CrossRef]
  23. Howley, C.; Johnson, J.; Petrie, J. Consolidation of schools and districts: What the research says and what it means. Natl. Educ. Policy Cent. 2011. [Google Scholar]
  24. Chao, L. The impact of educational public goods allocation adjustment on human capital. Econ. Res. J. 2020, 55, 140–156. [Google Scholar]
  25. Wang, W. Decomposing inequality in compulsory education finance in China: 1998–2008. Public Finance Manag. 2014, 14, 437–458. [Google Scholar]
  26. Xie, T. Analysis on inter-provincial disparities of China’s rural education and convergence rate: Empirical analysis on 31 provinces’ (municipalities’) panel data from 2001 to 2008. Int. J. Educ. Manag. 2011, 25, 714–723. [Google Scholar] [CrossRef]
  27. Rao, J.; Ye, J. From a virtuous cycle of rural-urban education to urban-oriented rural basic education in China: An explanation of the failure of China’s Rural School Mapping Adjustment policy. J. Rural Stud. 2016, 47, 601–611. [Google Scholar] [CrossRef]
  28. Zhang, D.; Li, X.; Xue, J. Education inequality between rural and urban areas of the People’s Republic of China, migrants’ children education, and some implications. Asian Dev. Rev. 2015, 32, 196–224. [Google Scholar] [CrossRef]
  29. Liu, J.; Jacob, W.J. From access to quality: Migrant children’s education in urban China. Educ. Res. Policy Pract. 2013, 12, 177–191. [Google Scholar] [CrossRef]
  30. Pacione, M. The geography of educational disadvantage in Glasgow. Appl. Geogr. 1997, 17, 169–192. [Google Scholar] [CrossRef]
  31. Mulaku, G.; Nyadimo, E. GIS in education planning: The Kenyan school mapping project. Surv. Rev. 2011, 43, 567–578. [Google Scholar] [CrossRef]
  32. Yoon, E.S.; Lubienski, C. Thinking critically in space: Toward a mixed-methods geospatial approach to education policy analysis. Educ. Res. 2018, 47, 53–61. [Google Scholar] [CrossRef]
  33. Butler, T.; Robson, G. Social capital, gentrification and neighbourhood change in London: A comparison of three south London neighbourhoods. Urban Stud. 2001, 38, 2145–2162. [Google Scholar] [CrossRef]
  34. Thrupp, M. School admissions and the segregation of school intakes in New Zealand cities. Urban Stud. 2007, 44, 1393–1404. [Google Scholar] [CrossRef]
  35. Lubienski, C.; Lee, J. Geo-spatial analyses in education research: The critical challenge and methodological possibilities. Geogr. Res. J. Inst. Aust. Geogr. 2017, 55, 89–99. [Google Scholar] [CrossRef]
  36. Yong, W.; Change, L.U.; Education, S.O. Analysis on the regional proportionality of preschool educational resources allocation: With the technical supporting of GIS. J. Mianyang Teach. Coll. 2018, 37, 27–32. [Google Scholar]
  37. Xie, C.D.; University, Y.Z.N. Analysis on the equilibrium degree of regional allocation of educational resources in weaker schools of compulsory education. J. Nanchang Coll. Educ. 2019. [Google Scholar]
  38. Yuan, Z.; Qian, J.; Zhu, H. The Xinjiang class: Multi-ethnic encounters in an eastern coastal city. China Q. 2017, 232, 1094–1115. [Google Scholar] [CrossRef] [Green Version]
  39. Glorius, B. Transnational social capital in migration: The example of educational migration between Bulgaria and Germany. Soc. Incl. 2019, 7, 232–242. [Google Scholar] [CrossRef]
  40. Liu, K.; Yin, L.; Lu, F.; Mou, N. Visualizing and exploring POI configurations of urban regions on POI-type semantic space. Cities 2020, 99, 102610. [Google Scholar] [CrossRef]
  41. Lan, T.; Yu, M.; Xu, Z.; Wu, Y. Temporal and spatial variation characteristics of catering facilities based on POI data: A case study within 5th ring road in Beijing. Procedia Comput. Sci. 2018, 131, 1260–1268. [Google Scholar] [CrossRef]
  42. Zhai, W.; Bai, X.; Shi, Y.; Han, Y.; Peng, Z.-R.; Gu, C. Beyond Word2vec: An approach for urban functional region extraction and identification by combining Place2vec and POIs. Comput. Environ. Urban Syst. 2019, 74, 1–12. [Google Scholar] [CrossRef]
  43. He, Q.; He, W.; Song, Y.; Wu, J.; Yin, C.; Mou, Y. The impact of urban growth patterns on urban vitality in newly built-up areas based on an association rules analysis using geographical ‘big data’. Land Use Policy 2018, 78, 726–738. [Google Scholar] [CrossRef]
  44. Yang, J.; Ren, J.; Sun, D.; Xiao, X.; Xia, J.; Jin, C.; Li, X. Understanding land surface temperature impact factors based on local climate zones. Sustain. Cities Soc. 2021, 69, 102818. [Google Scholar] [CrossRef]
  45. Zeng, J.; Yuanyuan, Y.E.; Zhong, Z. Research into the equalization of public service formats based on POI big data. J. West Anhui Univ. 2018, 34, 72–75. [Google Scholar]
  46. Su, F.; Mo, X.; Min, W.; Li, B. The equalization of the general high school education and its obstacle factors in China. Sci. Geogr. Sin. 2017, 10, 1478–1485. [Google Scholar]
  47. Zhao, C.; Shao, J.A.; Guo, Y.; Xu, X. Spatial pattern evolvement characteristics of rural schools and their development level in the mountainous area. Geogr. Res. 2016, 35, 455–470. [Google Scholar]
  48. Development of National Education in 2019. Available online: www.moe.gov.cn/jyb_sjzl/s5990/202008/t20200831_483697.html (accessed on 3 October 2019).
  49. Yang, J.; Xie, P.; Xi, J.; Ge, Q.; Ma, Z. LUCC simulation based on the cellular automata simulation: A case study of Dalian Economic and Technological Development Zone. Acta Geogr. Sin. 2015, 70, 461–475. [Google Scholar]
  50. Yang, J.; Wang, Y.; Xue, B.; Li, Y.; Xiaog, X.; Xia, J.; He, B. Contribution of urban ventilation to the thermal environment and urban energy demand: Different climate background perspectives. Sci. Total Environ. 2021, 795, 148791. [Google Scholar] [CrossRef]
  51. Luo, X.; Yang, J.; Sun, W.; He, B. Suitability of human settlements in mountainous areas from the perspective of ventilation: A case study of the main urban area of Chongqing. J. Clean. Prod. 2021, 310, 127467. [Google Scholar] [CrossRef]
  52. Dong, L.; Li, J.; Xu, Y.; Yang, Y.; Li, X.; Zhang, H. Study on the spatial classification of construction land types in Chinese cities: A case study in Zhejiang province. Land 2021, 10, 523. [Google Scholar] [CrossRef]
  53. Yang, J.; Guo, A.; Li, Y.; Zhang, Y.; Li, X. Simulation of landscape spatial layout evolution in rural-urban fringe areas: A case study of Ganjingzi District. GIScience Remote Sens. 2019, 56, 388–405. [Google Scholar] [CrossRef]
  54. Zhu, J.; Li, B.; He, B.-J. Is linked migration overlooked in peri-urban Shanghai? Uncovering the domino effect of driving away interregional migrants. Habitat Int. 2019, 94, 102046. [Google Scholar] [CrossRef]
  55. Silverman, B.W. Density Estimation for Statistics and Data Analysis; Routledge: Abingdon, UK, 1986. [Google Scholar]
  56. Xue, B.; Xiao, X.; Li, J. Identification method and empirical study of urban industrial spatial relationship based on POI big data: A case of Shenyang City, China. Geogr. Sustain. 2020, 1, 152–162. [Google Scholar] [CrossRef]
  57. Shen, Q.X.; Li, C.G.; Liu, Z.Y. Spatial pattern of public service facilities space and living space in Changchun. Geogr. Res. 2018, 37, 127–136. [Google Scholar]
  58. Hao, F.; Shi, X.; Xue, B.; Wang, S. Geographic detection and multifunctional land use from the perspective of urban diversity: A case study of Changchun. Geogr. Res. 2019, 38, 247–258. [Google Scholar]
  59. Leslie, T.F.; Kronenfeld, B.J. The colocation quotient: A new measure of spatial association between categorical subsets of points. Geogr. Anal. 2011, 43, 306–326. [Google Scholar] [CrossRef]
  60. Yang, J.; Yang, Y.; Sun, D.; Jin, C.; Xiao, X. Influence of urban morphological characteristics on thermal environment. Sustain. Cities Soc. 2021, 72, 103045. [Google Scholar] [CrossRef]
  61. Lin, J.; Huang, B.; Chen, M.; Huang, Z. Modeling urban vertical growth using cellular automata—Guangzhou as a case study. Appl. Geogr. 2014, 53, 172–186. [Google Scholar] [CrossRef]
  62. Li, C.; Wu, K.; Gao, X. Manufacturing industry agglomeration and spatial clustering: Evidence from Hebei Province, China. Environ. Dev. Sustain. 2020, 22, 2941–2965. [Google Scholar] [CrossRef]
  63. Haepp, T.; Lyu, L. The impact of primary school investment reallocation on educational attainment in rural China. J. Asia Pac. Econ. 2018, 23, 606–627. [Google Scholar] [CrossRef]
  64. Zhao, Z.Q.; He, B.J.; Li, L.G.; Wang, H.B.; Darko, A. Profile and concentric zonal analysis of relationships between land use/land cover and land surface temperature: Case study of Shenyang, China. Energy Build. 2017, 155, 282–295. [Google Scholar]
  65. Sherman, J.D.; Poirier, J.M. Educational Equity and Public Policy: Comparing Results From 16 Countries; UNESCO Institute for Statistics: Montreal, QC, Canada, 2007. [Google Scholar]
  66. Malczewski, J.; Jackson, M. Multicriteria spatial allocation of educational resources: An overview. Socio-Econ. Plan. Sci. 2000, 34, 219–235. [Google Scholar] [CrossRef]
  67. Peng, Y.; Wang, Z. Space operation of rural primary and secondary school location. Acta Geogr. Sin. 2013, 68, 1411–1417. [Google Scholar]
  68. Li, C.; Gao, X.; Wu, J.; Wu, K. Demand prediction and regulation zoning of urban-industrial land: Evidence from Beijing-Tianjin-Hebei Urban Agglomeration, China. Environ. Monit. Assess. 2019, 191, 412. [Google Scholar] [CrossRef] [PubMed]
  69. He, B.J.; Zhao, Z.Q.; Shen, L.D.; Wang, H.B.; Li, L.G. An approach to examining performances of cool/hot sources in mitigating/enhancing land surface temperature under different temperature backgrounds based on Landsat 8 image. Sustain. Cities Soc. 2018, 44, 416–427. [Google Scholar] [CrossRef]
Figure 1. The distribution of three types of schools in 16 districts of Shanghai.
Land 10 01059 g001
Figure 2. The spatial distribution of kernel density in the school types in Shanghai. (a) stands for kindergarten, (b) for elementary school and (c) for junior high school.
Land 10 01059 g002
Figure 3. The population and school distribution in Shanghai.
Land 10 01059 g003
Figure 4. The Ripley’s K of (a) kindergartens, and (b) elementary and (c) junior high schools in Shanghai.
Land 10 01059 g004
Figure 5. The proportional relationship of kindergartens, elementary, and junior high schools in Shanghai.
Land 10 01059 g005
Figure 6. The proportional relationship of kindergartens, elementary, and junior high schools in the 16 districts in Shanghai.
Land 10 01059 g006
Figure 7. The growth cycle of new construction land and density distribution of school sites in Shanghai.
Land 10 01059 g007
Table 1. The nearest neighbor indicator of kindergartens, elementary schools, and junior high schools in Shanghai.
TypeKindergartenElementary SchoolJunior High School
NNI0.5150.6310.69
z−42.771−21.645−13.552
P<0.01<0.01<0.01
Table 2. The Colocation quotient analysis of kindergartens, elementary schools, and junior high schools in Shanghai.
ProximityNumber of CoverageColocation Quotient
kindergarten → elementary school17232.31
elementary school → junior high school6261.85
elementary school → kindergarten21200.81
junior high school → elementary school9440.63
Table 3. The level of agglomeration in Shanghai.
LevelRationale for ClassificationNumber
High-HighJunior high school existed, and the proportions in elementary school and kindergarten were higher than the average proportion in Shanghai60
High-LowJunior high school existed, elementary school was higher than the average proportion in Shanghai, and kindergartens were lower than the average proportion in Shanghai27
Low-HighJunior high school existed, elementary school was lower than the average proportion in Shanghai, and kindergartens were higher than the average proportion in Shanghai22
Low-LowJunior high school, elementary school, kindergartens were lower than the average proportion in Shanghai480
Table 4. Land area and school density for growth cycle construction in Shanghai.
Growth CycleJunior High SchoolElementary SchoolKindergartenConstructed Land Area (km2)Density (Unit/km2)
30 Year261482964556.263.06
20 Year3175751211777.872.71
10 Year34761813431053.632.33
Less Than 10 Year42977517742031.631.47
Publisher’s Note: MDPI stays neutral with regard to jurisdictional claims in published maps and institutional affiliations.

