Article

Plant Trait Assembly in Species-Rich Forests at Varying Elevations in the Northwest Andes of Colombia

by
Angélica Ochoa-Beltrán
1,*,
Johanna Andrea Martínez-Villa
2,
Peter G. Kennedy
3,
Beatriz Salgado-Negret
4 and
Alvaro Duque
1
1
Departamento de Ciencias Forestales, Universidad Nacional de Colombia, Medellín 050034, Colombia
2
Département des Sciences Biologiques, Université du Québec à Montréal, Montreal, QC H2L 2C4, Canada
3
Department of Plant and Microbial Biology, University of Minnesota, Saint Paul, MN 55108, USA
4
Programa Ciencias Básicas de la Biodiversidad, Instituto de Investigación de Recursos Biológicos Alexander von Humboldt, Bogotá 111311, Colombia
*
Author to whom correspondence should be addressed.
Land 2021, 10(10), 1057; https://doi.org/10.3390/land10101057
Submission received: 29 July 2021 / Revised: 6 October 2021 / Accepted: 6 October 2021 / Published: 8 October 2021
(This article belongs to the Special Issue Mountains under Pressure)

Abstract

:
Andean forests are home to a strikingly high diversity of plants, making it difficult to understand the main drivers of species assembly. Trait-based approaches, however, help overcome some challenges associated with high taxonomic complexity, providing insights into the main drivers of species coexistence. Here, we evaluated the roles of climate, soil fertility, and symbiotic root associations on shaping the assembly of six plant functional traits (leaf area, specific leaf area, dry leaf matter content, leaf thickness, leaf toughness, and wood density) along an elevational gradient in the species-rich northwestern Andean forests of Colombia. The two main axes of the correspondence RLQ analysis explained 95.75% of the variability. The first axis was associated with the leaf economic spectrum, while the second axis with the tradeoff between growth and survival. Furthermore, the fourth corner method showed that both regional (climatic variables) and local factors (soil fertility, symbiotic root associations, and light distribution) played a key role in determining plant trait assembly. In summary, our study emphasizes the importance of considering both individual size and local factors to better understand drivers of plant trait assembly along environmental gradients.

1. Introduction

Andean forests represent the greatest hotspot of diversity on Earth [1,2], as well as one of the regions most threatened by deforestation and climate change [3,4,5,6]. To assure effective forest conservation in this endangered ecosystem, an improved understanding of the mechanisms determining species assembly along elevational gradients is needed [7]. One meaningful approach, which has helped to identify the underlying mechanisms shaping forest structure and function along environmental gradients, is the use of functional traits [8,9,10]. In particular, functional traits can circumvent challenges associated with high taxonomic complexity, such as is present in tropical Andean forests, thereby shedding new insights into the main drivers of species coexistence [1,11].
Leaf traits have been previously used to identify plant adaptation across the functional economic spectrum along elevational gradients [12,13,14,15,16]. Along elevational gradients, a handful of studies conducted in tropical forests have found that species at lower elevations tend to have acquisitive characteristics mainly due to greater temperature as well as higher availability of light and nutrients [12,15,17]. On the contrary, species at high elevation tend to have conservative characteristics due to constraints in resources availability [12,14,15,17]. Other factors, such as vapor pressure deficit and solar radiation, are also known to be important drivers of leaf trait variation among plant communities [18,19].
Additionally, wood-specific gravity (g cm−3), hereafter called wood density, has shown to be an efficient trait to characterize the tradeoff between hydraulic safety and efficiency, which determines plant resistance to embolisms [20,21,22,23]. This trait has also shown to be a good proxy for the life history of tropical tree species [24,25]. In general, acquisitive species have lower wood densities, due to lower investment in tissue construction and hydraulic safety, while conservative species have high wood densities to protect from hydraulic or biomechanical damage [20,26,27,28,29,30,31].
The functional composition of tropical forests also changes across strata due to a systematic reduction in light availability from canopy to understory [32,33]. For example, in the presence of low light availability, plant species favor conservative water and nutrient use and high light capture [34,35]. In contrast, in the light-exposed canopy, plant species typically have a positive correlation between photosynthetic rate and resource allocation [35,36]. Another important yet often overlooked determinant of tree fitness and community assembly at a local scale are symbiotic root associations (e.g., mycorrhizae and nitrogen-fixing bacteria) [37]. These associations can enhance plant nutrient availability as well as modify plant responses to environmental constraints such as water or light limitation [38,39,40,41,42].
In this study, we aimed to assess the main drivers of plant trait assembly along elevational gradients in the northwestern Andean forests of Colombia. We evaluated the relative roles played by climate, soil fertility, and symbiotic root associations on shaping the assembly of six functional traits (leaf area, specific leaf area, dry leaf matter content, leaf thickness, leaf toughness, and wood density) in nine one-hectare plots along an elevational gradient spanning 2850 m. Furthermore, we evaluated the local effect caused by differences in resource availability (e.g., light) between large trees (diameter at breast height-DBH ≥ 10 cm) and small trees (1 ≤ DBH < 10 cm). We hypothesized that: (i) Functional assembly gradually changes from acquisitive to conservative strategies along the elevation gradient in the northwestern Andean forests of Colombia. (ii) Climate variability overrides soil fertility and symbiotic root associations as a determinant of plant trait assembly, and iii) plant trait assembly between large and small trees has a differential local response to changes in light availability.

2. Materials and Methods
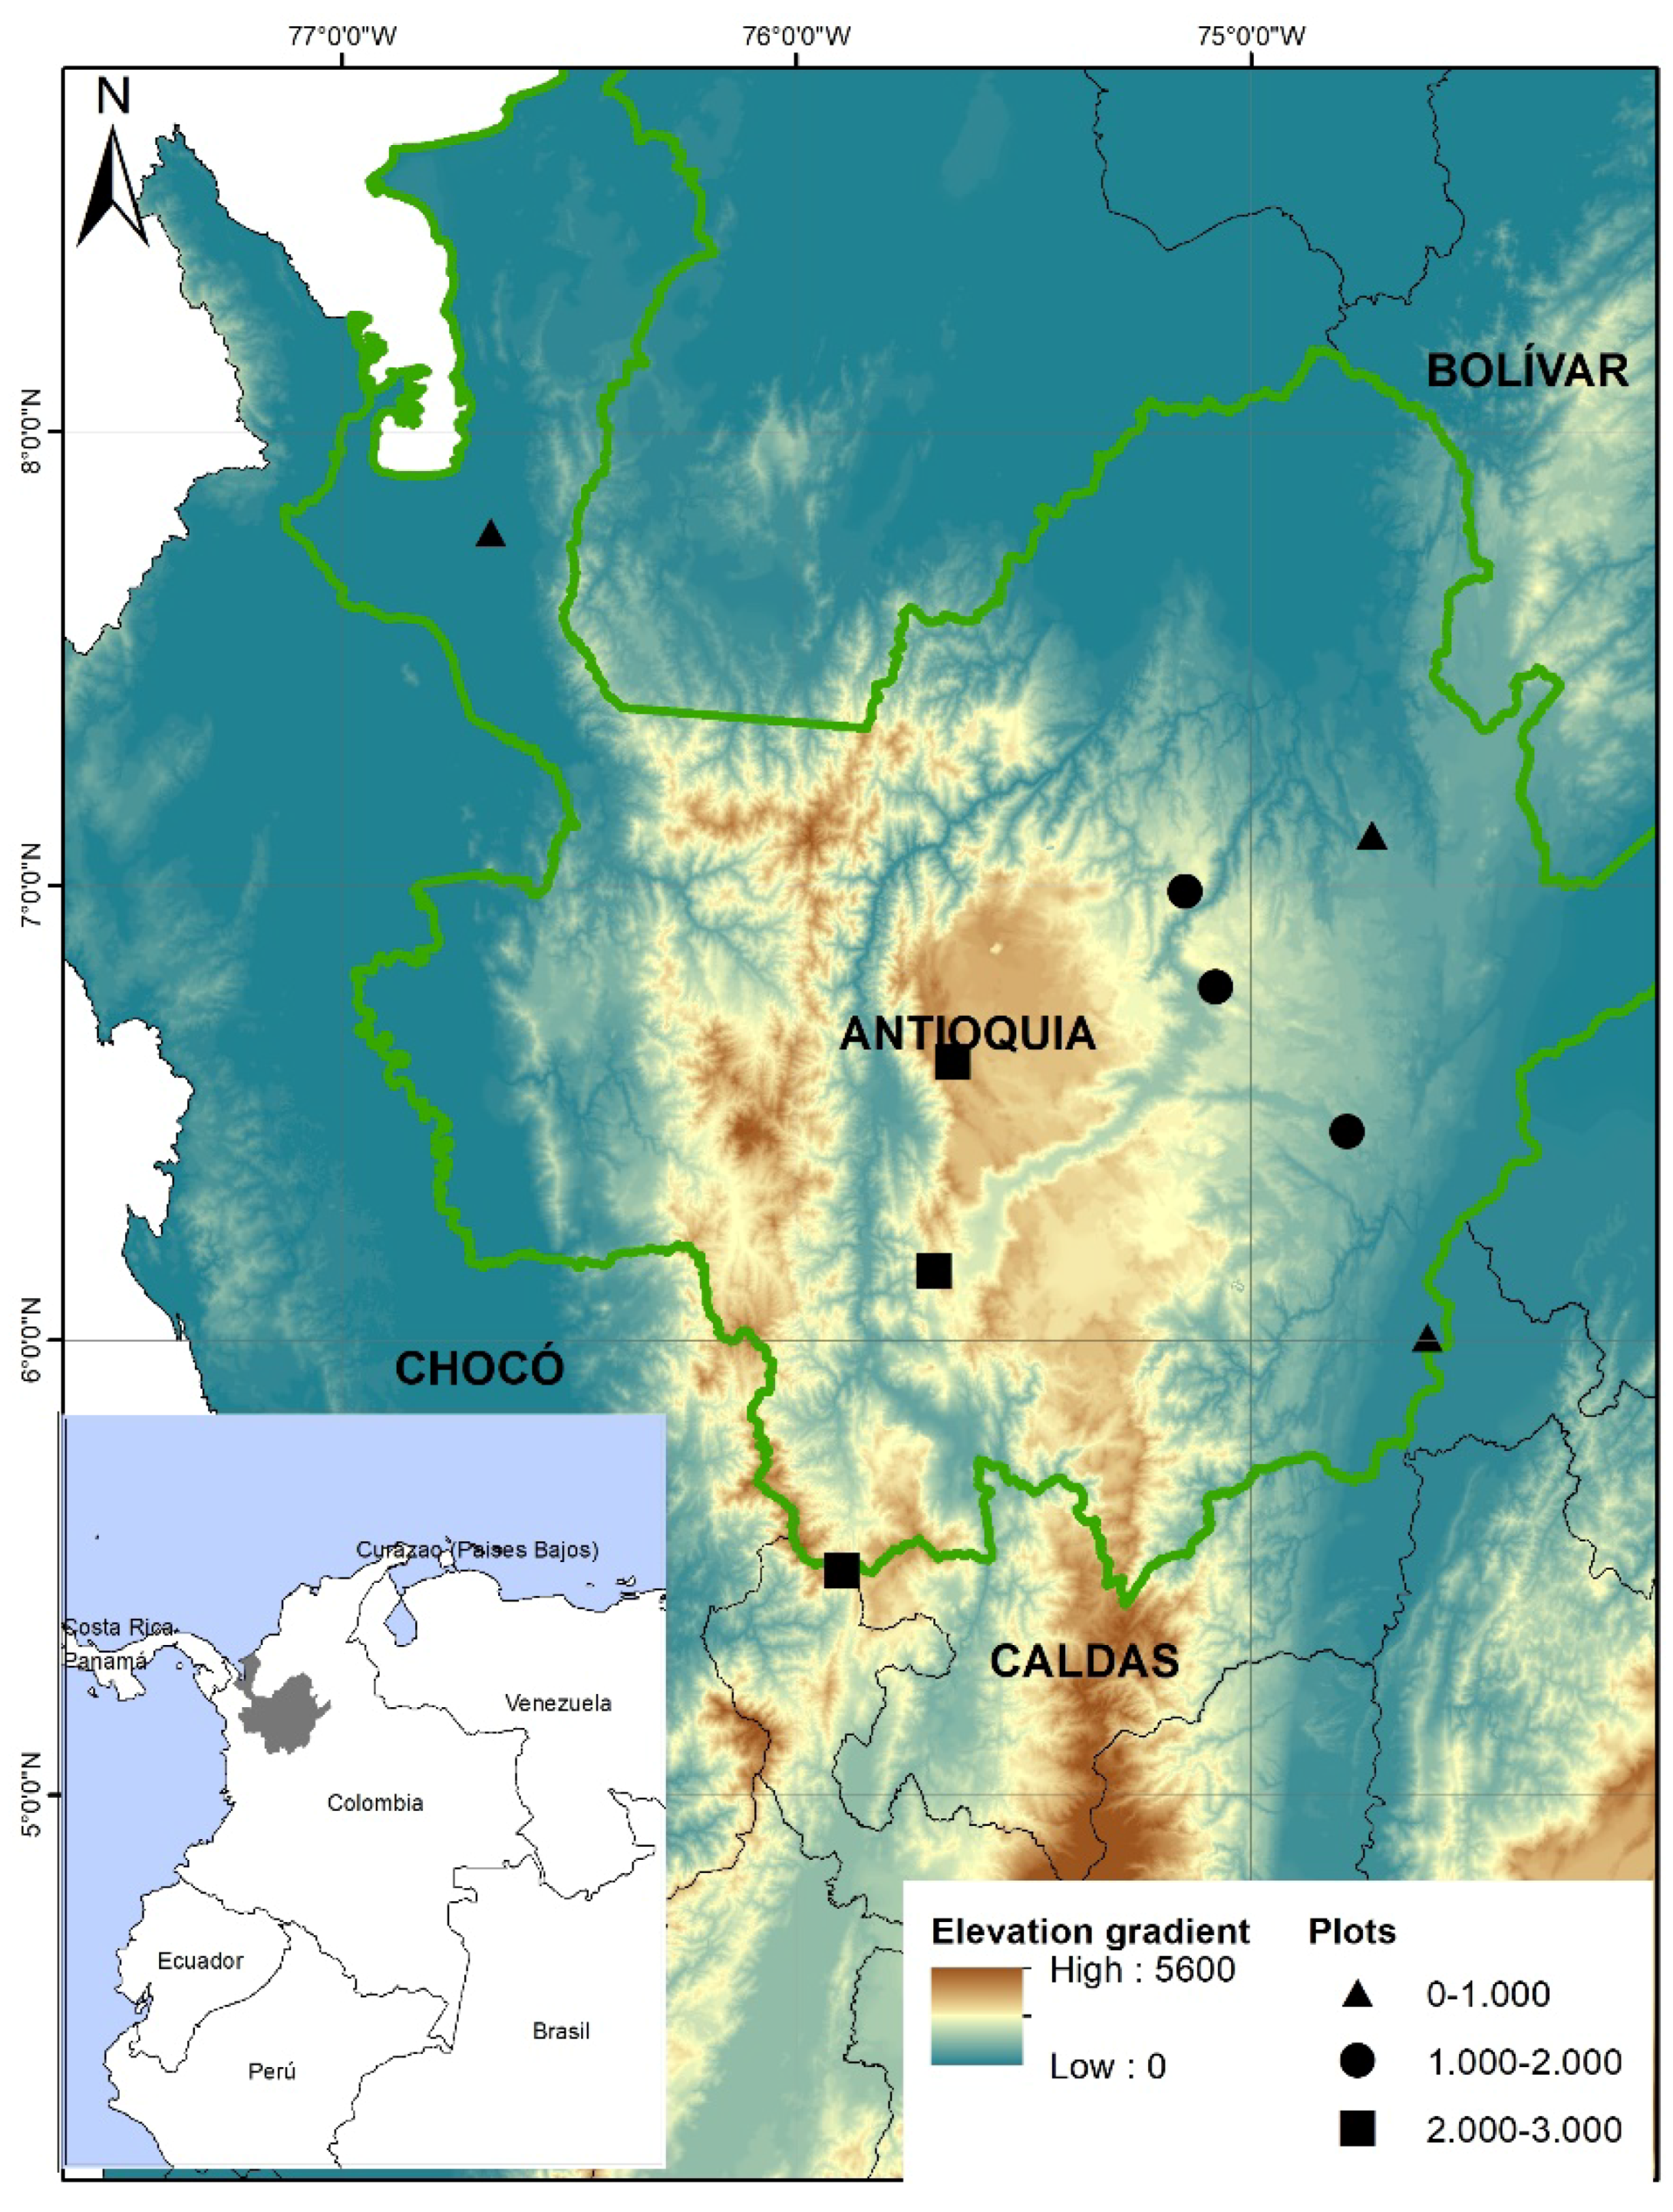
2.1. Study Area

The study area is located in the northwest region of Colombia between 5°50′ and 7°78′ North and 74°61′ and 77°67′ West. This region encompasses an elevational gradient highly variable in terms of climate, and soils. We established nine permanent monitoring 1 ha (100 m × 100 m) plots between 50 and 2900 m asl (Figure 1). The distance between plots ranged from 22.1 to 271.7 km. In Colombia, the Andean region contains only approximately 20% of its original natural cover, primarily due to historical deforestation [43]. Plots were randomly located within protected forest fragments without considering previous criteria in terms of floristic composition, structure, climate, or soils. We did, however, ensure that the location of plots was at least 100 m away from any forest edge (see supporting information).

2.2. Tree Species Abundance (L Matrix)

In each 1 ha plot (100 m × 100 m), all trees with a diameter at breast height (DBH) ≥ 10 cm (hereafter referred to as large trees) were mapped and tagged. Likewise, shrubs and small trees with 1 cm ≤ DBH < 10 cm (hereafter referred to as small trees) were tallied in a 0.16 ha subplot (40 m × 40 m) located near the center of each plot (Figure 1). Voucher specimens were collected for each potentially unique species in each plot. We collected vouchers in all cases in which there was any doubt as to whether an individual plant was the same species as another individual that was already collected within the same plot. Taxonomic identifications were made by comparing the specimens with herbarium material and with the help of specialists in particular plant groups. All of the vouchers are kept at the University of Antioquia’s Herbarium (HUA). The plants that were identified at the level of genus and family were classified as morphospecies based on differences in vegetative character morphology. We used the function correctTaxo from BIOMASS R package [44] to standardize the taxonomic name using the Taxonomic Name Resolution Service (TNRS). We built a community matrix (n × p) with species abundance information, where sites are in rows and species in columns (hereafter referred to as L matrix).

2.3. Environmental Variables (R Matrix)

We used climatic and edaphic information to characterize each plot. Each environmental variable was included in an n × m matrix, where sites are in rows and environmental values in columns (hereafter R matrix). Climatic data were downloaded from Worldclim version 2.1. (1970–2000) with a resolution of 30 arcsec–1 km (Table S1) [45]. The climatic variables are mean annual temperature (MAT °C), temperature seasonality (T.s), mean annual precipitation (PP mm), precipitation seasonality (P.s), solar radiation (Srad in kJ m−2 day−1), wind speed (Wind in m s−1), vapor air pressure (VAP in Kpa), and vapor pressure deficit (VPD in Kpa). VPD was calculated as the difference between saturated vapor pressure and VAP. The soil variables assessed were pH, calcium (Ca in meq per 100 g soil), magnesium (Mg in meq per 100 g soil), potassium (K in meq per 100 g soil), phosphorus (P in ppm), and organic matter (OM in %) (Table S2). We used the mean concentration per plot calculated from 25 composite soil samples taken in each 20 × 20 m quadrant in the 1 ha plot (Figure S1). Soil samples were analyzed in the Biogeochemical Analysis laboratory of the Department of Forest Sciences at the Universidad Nacional de Colombia-Medellin.
To incorporate the potential contributions of symbiotic root association (SRA) in explaining plant trait assembly along the elevational gradient, individuals were assigned an SRA status either as arbuscular mycorrhizal (AM), ectomycorrhizal fungi (EcM), or nitrogen-fixing bacteria (Nfix) based on the genus- or family-level designations provided in [46]. We chose these two taxonomic levels to increase the ability to provide SRA assignments to the dataset; this choice is supported by the fact that SRA is largely conserved at the genus and family level [47,48]. Here, we restricted matches for our genera and families to only those present in North and South America in the compiled list of [46]. Any genus or family lacking symbiotic root assignment was manually checked and, when possible, assigned SRA based on primary literature searches. We used the above information and L matrix (tree species abundance matrix) to calculate each SRA proportion as the ratio between the abundance of individuals with EcM, AM, or Nfix associations and the total number of individuals in each plot.

2.4. Trait Sampling (Q Matrix)

In the nine plots, we assessed six morphological traits: leaf area (LA), specific leaf area (SLA), leaf dry matter content (LDMC), leaf thickness (LT), leaf toughness (Lth), and small branches’ wood density (WD), following the methodology proposed in the “New handbook for standardized measurement of plant functional traits worldwide” [49] (see supporting information). LA is associated with plant fitness to compete for light and to regulate water balance [50,51]. SLA and LDMC represent the tradeoff between resource acquisition, plant productivity, and carbon storage [50,52]. LT and Lth are related to adaptations to harsh climatic conditions and herbivory defenses [49,50]. Finally, WD primarily represents the tradeoff between survival and growth [25] and hydraulic safety–efficiency [49,50].
We took samples of five mature leaves from five different individuals per plot. For rare species, the samples were taken in as many individuals as possible, reaching a sampling effort of 76% of the morphospecies registered in the study area. In total, we sampled 2765 individuals belonging to 1099 morphospecies. To assess WD, we took one sample from one mature branch per individual. The size of the samples was around 2–3 cm in diameter and 10 cm long. Since for some species within the plot, it was not possible to measure directly the WD due to the small size of the individuals and the lack of mature branches (approximately 18% of the individual sampled), the missing values were filled hierarchically. First, the missing WD values per individual were assigned based on the average value of the same species in other plots. If the value was not available at the species level, the value by either genus or family was applied.
We selected light-exposed leaves when possible. However, we excluded those species that had either small individuals with few leaves/branches or were out of reach due to height. Fresh weight, leaf thickness (LT), and leaf toughness (LTh) were measured in situ, while the other traits were measured in the lab. The data were organized in a p × s trait matrix, where the rows have the s trait’s mean value per species and the columns the p species (hereafter referred to as the Q matrix). To build this matrix, we used the species with information on all six traits, which correspond to 1086 morphospecies. LA, SLA, LT, and Lth were log-transformed to reduce the bias on trait distributions [53].

2.5. Data Analysis

We used the Pearson correlation coefficient to assess the correlation between the community weighted mean (CWM) of each trait weighted by species abundances in each plot, as well as the environmental variables and elevation. Elevation was used here as a valid surrogate for temperature (r = −0.99).
To assess plant trait assembly in the northwestern Andean forests of Colombia, we used correspondence analysis RLQ and fourth corner analysis [54,55,56]. The correspondence analysis RLQ and fourth corner analysis are two alternative methods that integrate information stored in the R matrix (sites × environmental characteristics), L matrix (sites × species abundance), and Q matrix (functional traits × species). The RLQ is a multivariate method that reduces the variability of the three matrices (RLQ) by applying ordination procedures [54]. The RLQ enables visualization of the structure of the three matrices by assigning scores to species, samples, traits, and environmental variables along orthogonal axes. The RLQ analysis was performed using the RLQ function. The fourth corner analysis is a multivariate permutation test that relates the R, L, and Q matrices to generate a matrix with association scores [55]. This analysis was run employing the fourthcorner function. Both analyses were performed using the ade4 R package [57]. The significance of the associations obtained from both methods, RLQ and fourth corner analysis, was tested by applying the permutation procedure in the matrix L by samples and species separately and then combining those outputs (model 6: a combination of the outputs of models 2 and 4) [58]. We used this model since it allows determination of the influence of both traits and environmental variables in the community assembly, as well as fixes the level of type I error [59]. Furthermore, we performed a high number of permutations (49,999 times) to minimize the occurrence probability of a multitesting issue and reporting of a false correlation caused by the large number of environmental variables [59].
To assess our first research hypothesis, which aimed to differentiate and identify functional groups along the elevational gradient, we applied the k-means method using the kmeans function available in the stats R package [60] to the two first trait orthogonal axes derived from the RLQ analysis. The optimal number of clusters was estimated with the elbow method, which minimizes the within-cluster sums of squares using the fviz_nbclust function available in factoextra R package [61]. We compared the distribution of each functional group per trait with the RLQ structure to determine the position of each functional group along the conservative–acquisitive leaf/wood-density economic spectrum. Significant differences between functional groups (FG) were calculated using the Tukey Honestly Significant (Tukey HSD) test. To assess the second hypothesis, we used the fourth corner analysis to test for the correlation between each trait and climatic (n = 11) and edaphic variable (n = 11). Individual correlation between each trait and each environmental variable was tested by permuting the n sites and the p species, using model 6. Finally, to test the third hypothesis, we repeated the same analysis (fourth corner) using the two tree cutoff sizes: only large trees (DBH ≥ 10 cm) and only small trees (1 cm ≤ DBH < 10 cm). Thus, the fourth corner analysis was employed to analyze the influence of the climatic and edaphic variables on determining trait functional assembly according to tree size cutoff (large and small trees).

3. Results

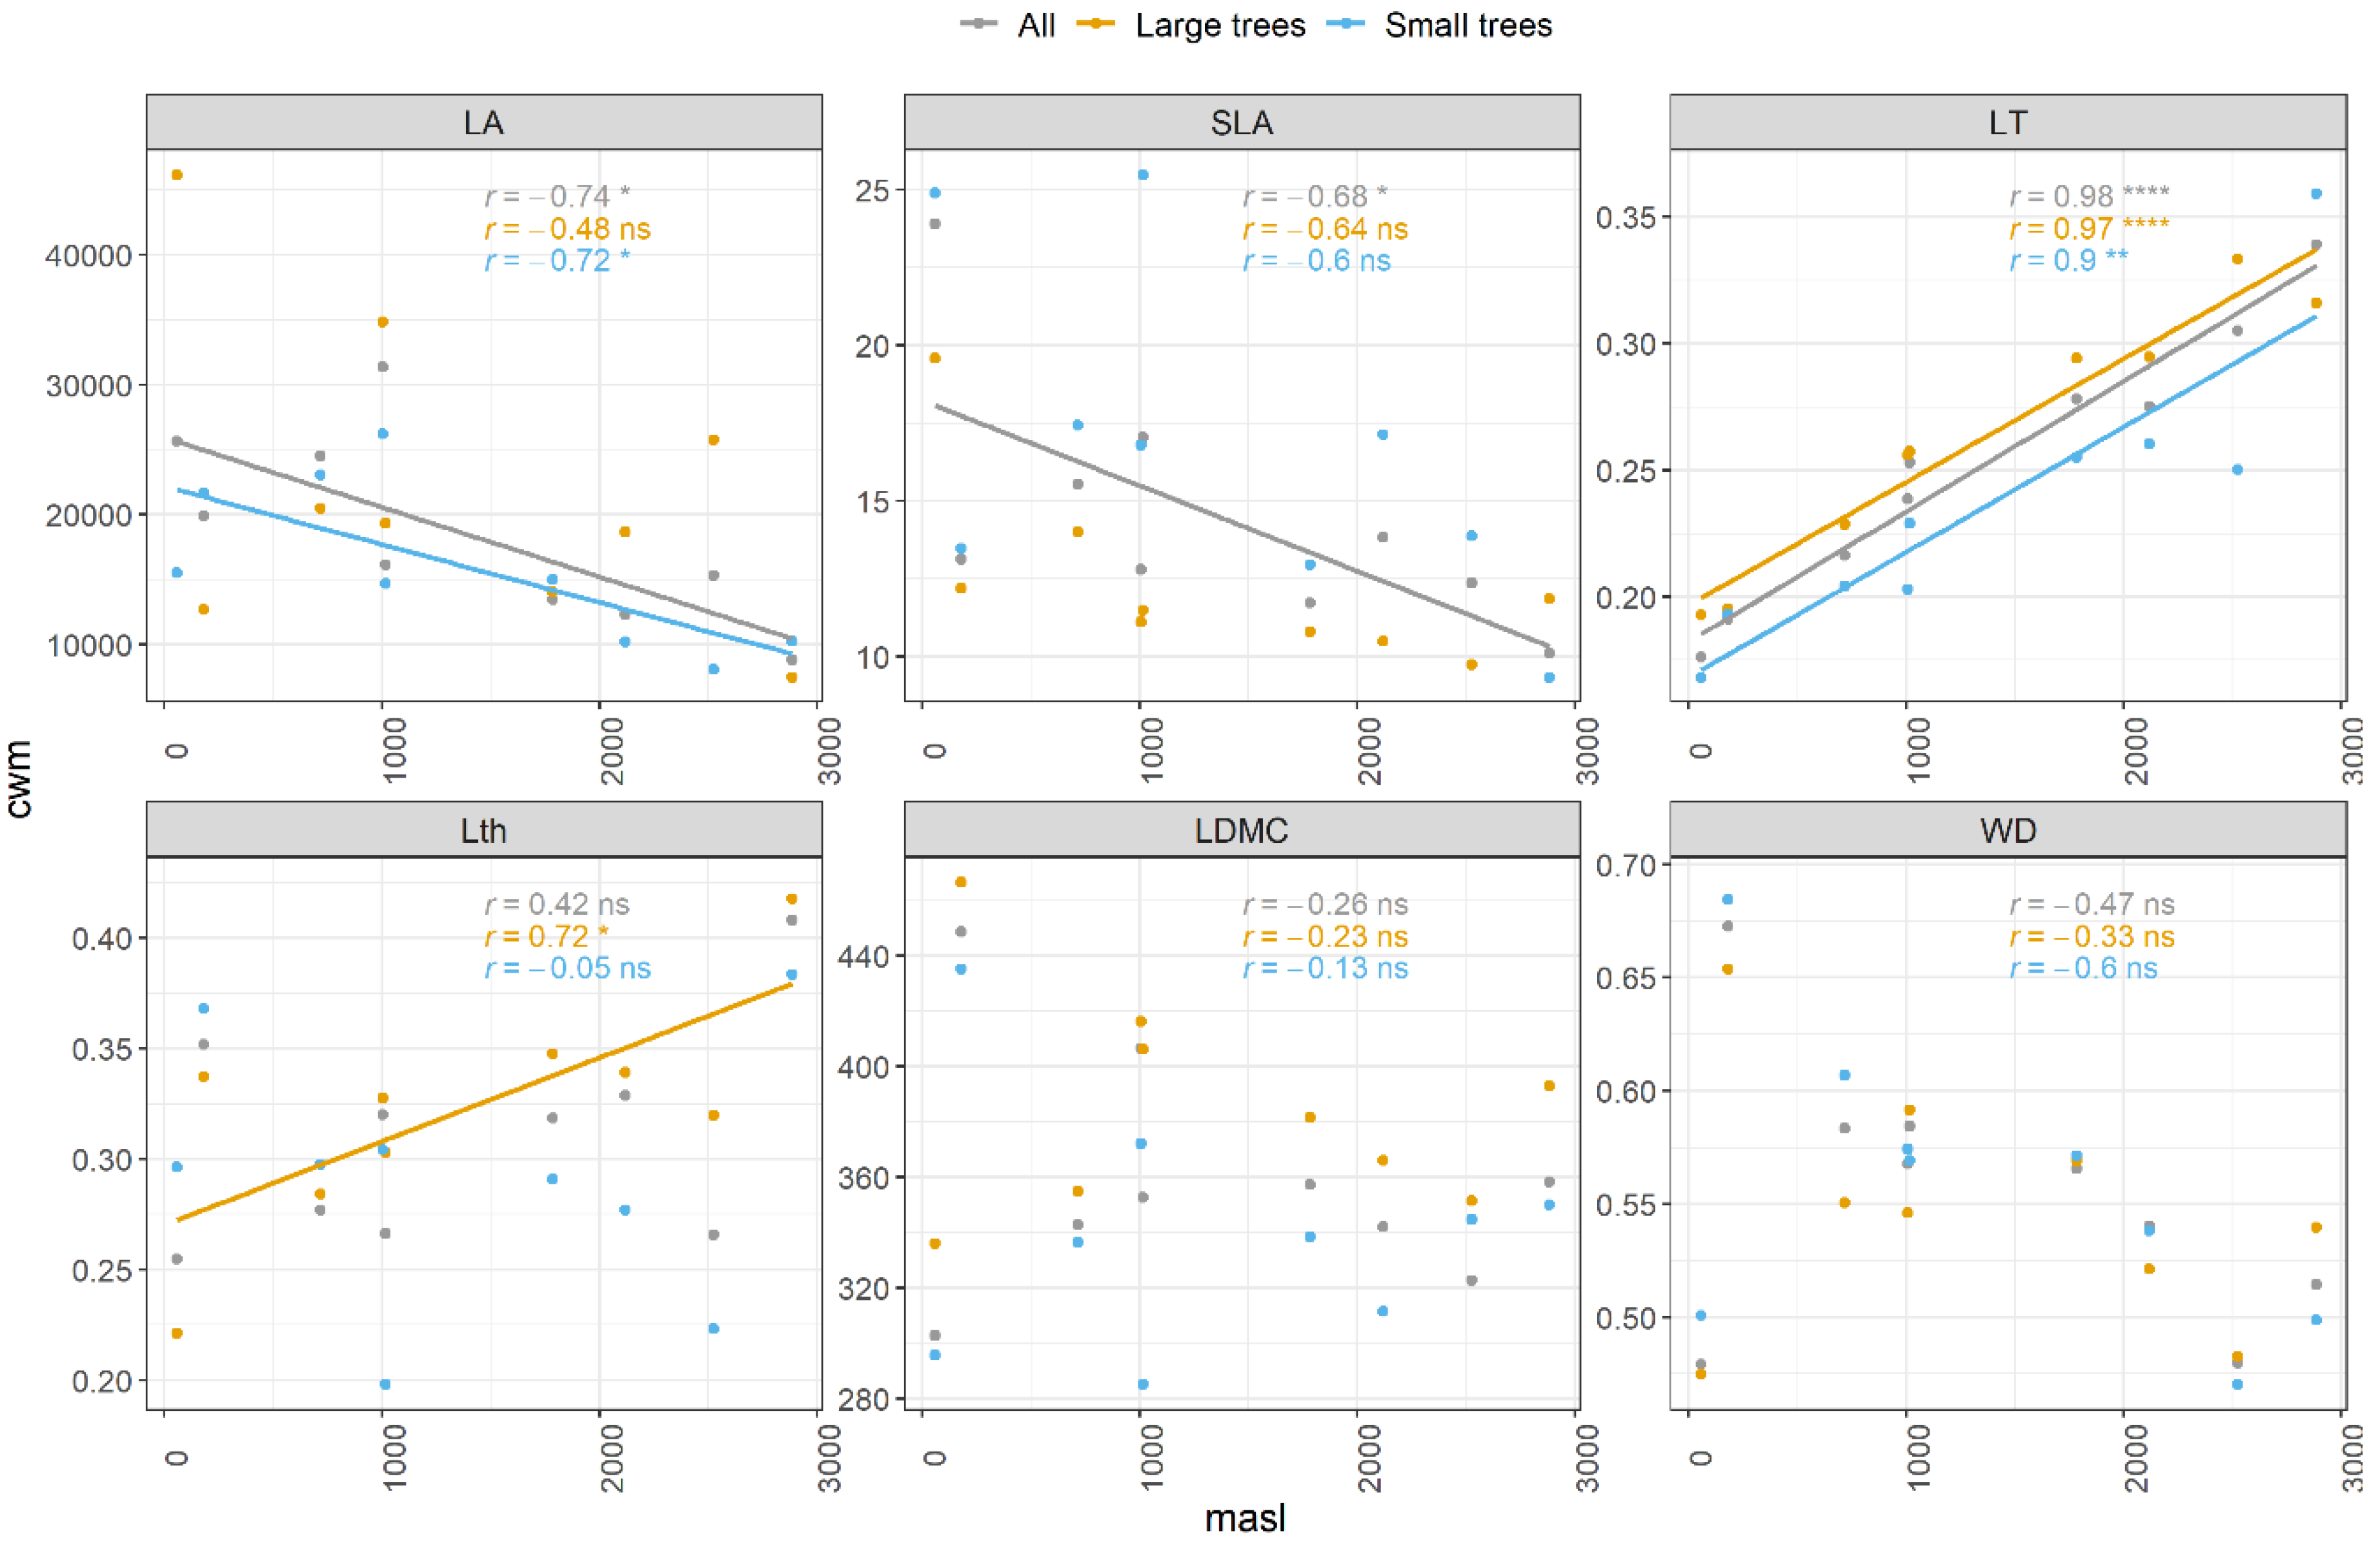
3.1. Patterns of Change with Elevation

Eight out of the 17 variables evaluated showed a significant correlation with elevation. OM and AM were positively associated, while MAT, VAP, VPD, Srad, Mg, and Nfix were negatively associated (Figure S2). Regarding functional traits, when we included all individuals (DBH ≥ 1 cm), we found a negative relationship between the community weight mean of LA/SLA with elevation, and a positive one with LT (Figure 2 and Table S3). The significant trait–elevation relationship differed when the analysis was carried out separately by tree cutoff size categories. Overall, LTh significantly increased only for large trees, while LA decreased for small trees. LT was also statistically significant, in both large and small trees (Figure 2).

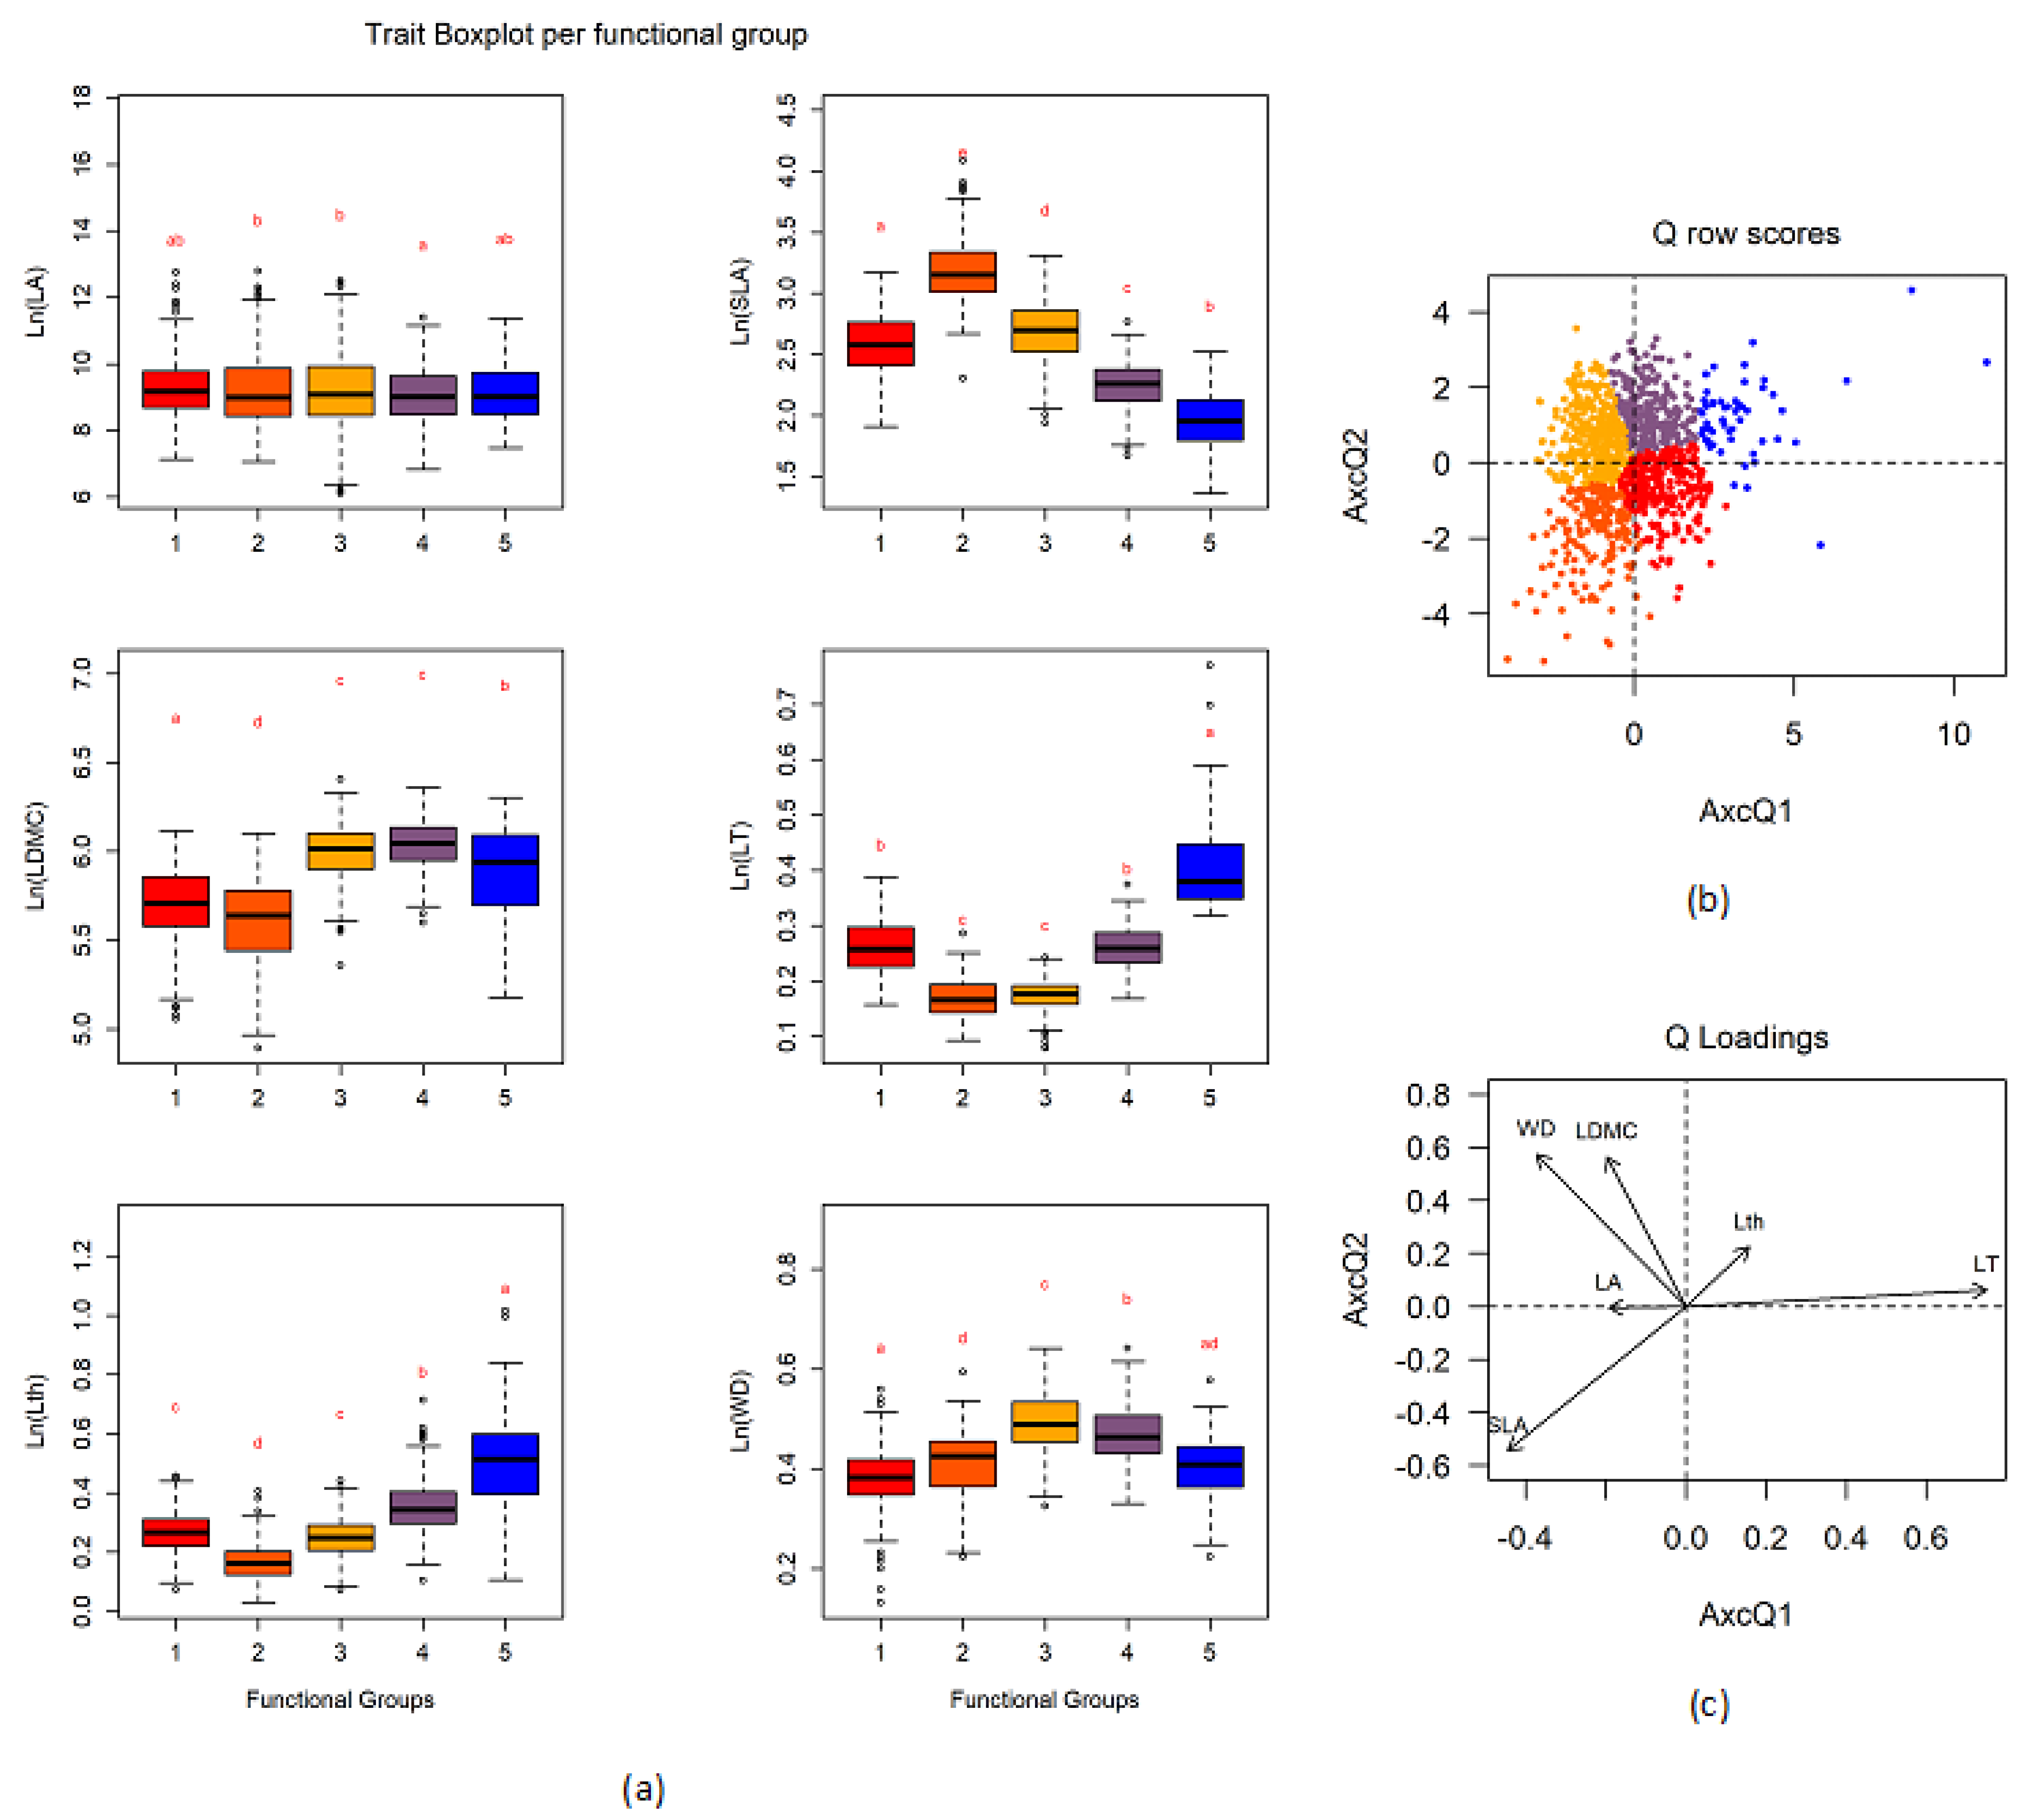
3.2. Definition of Functional Groups

According to the k-means and elbow methods applied on the RLQ scores, we found five main functional groups (FG) along the elevational gradient in northwestern Andean forest (RLQ permutation test: model 2, p-value: 0.00106 and model 4, p-value: 0.00002) (Figure 3 and Table 1). The first functional group (FG1; red) was characterized by low WD/LDCM and intermediate SLA. Some representative species were Miconia acanthocoryne, Ladenbergia macrocarpa, and Miconia micropetala. The second functional group (FG2; orange) was characterized by high SLA, but thin soft leaves with low dry matter content in their leaf and woody tissues, with respect to the mean values within the study area. Some representative species were Allomaieta pancurana, Allomaieta hirsuta, and Piper urabaensis. The species of this group were primarily located in low elevations with warm weather and relatively fertile soils (Figure S3). The third functional group (FG3; yellow) was characterized by high WD and LDMC, and was located along the entire elevation gradient, being more representative of areas with high MAT, VPD, and high presence of N-fixing root associations (Figure S3). Some representative species were Palicourea angustifolia, Matayba arborescens, and Tapirira guianensis. FG3 fell within the acquisitive second half of the leaf/wood-density economic spectrum. The fourth functional group (FG4; purple), as well as FG 3, had high WD and LDMC, but this latter group had more conservative foliar traits (higher LT / Lth and low SLA), and was primarily located between middle and high elevations. FG4 belonged to the conservative extreme of the leaf/wood-density economic spectrum. Some representative species were Matudaea colombiana, Billia rosea, and Eschweilera antioquensis. Finally, the fifth functional group (FG5; blue) was characterized by high LDMC, LT, and Lth. FG5 was located at high elevations and at the conservative extreme of the leaf economic spectrum, but lower WD (Figure 3). Some representative species were Miconia multiplinervia, Schefflera trianae, and Tibouchina lepidota.
Overall, the five main functional groups were placed along the first two RLQ orthogonal axes, which explained most of the trait–environment relationships (total explained inertia 95.76%; see Table 1). The first axis was associated with the leaf economic spectrum, while the second one with the tradeoff between growth and survival (hereafter referred as to growth). However, the wood density did not follow any systematic trend along elevation (Figure 2).

3.3. Traits–Environment Relationship for Different Cutoff Tree Sizes

When all individuals (DBH ≥ 1 cm) were included, the fourth corner analysis revealed that other explanatory variables different from climate, such as abiotic (e.g., soils) and biotic factors (e.g., SRA), were also important drivers of plant trait assembly. Water vapor (VAP) and vapor pressure deficit (VPD), positively influenced traits associated with photosynthetic rates (SLA and LA) and resistance to embolism (WD). However, MAT, VAP, and VPD were negatively associated with leaf thickness (LT). Other relevant variables were symbiotic root associations with both mycorrhizal types as well as nitrogen-fixing bacteria. The results showed that greater EcM association enhanced leaf toughness (Lth), while increased AM association decreased SLA. An increase in N-fixing association was also positively associated with WD and LDMC, but negatively with LT. Finally, there was a negative correlation between soil Mg concentration and LT (Figure 4).
The fourth corner analysis on large (DBH ≥ 10 cm) and small tree (1 cm ≤ DBH < 10 cm) categories produced partially differentiated environment–trait correlations. The gradient of MAT and VAP highlight the acquisitive/conservative leaf spectrum and a positive relation with WD. However, increases in MAT differentiated between increases in SLA for large trees and increases in LA for small trees. Large trees were influenced by other climatic variables than MAT and VAP, such as Wind, Srad in SLA, and T.s in WD. An increase in Mg was positively associated with SLA but negatively with LT in large trees. On the contrary, an increase in OM, likely associated with a reduction in N availability, was positively associated with an increase in LT in small trees. Finally, SLA was negatively associated with AM association in large trees but with increased EcM association in small trees. N-fixing association was mainly positively associated with LA and WD in small trees (Figure 5a,b).

4. Discussion

In this study, we found environmental heterogeneity as a key driver of plant community assembly in the wet tropical forests of the Northwest Andes. The climatic variation, together with soil fertility and symbiotic root associations, shaped plant trait assembly along the elevational gradient (Figure S2). Five main functional groups were distinguished along the conservative/acquisitive spectrum. Furthermore, the environment–trait relationships partially differed according to plant size (small vs. large trees) as well as the position across forest strata (understory vs. canopy, respectively). Taken together, our study shows that a combination of local-scale factors, such as microclimatic variation, soil fertility, and symbiotic root associations within forests, along with regional climatic heterogeneity, drives plant adaptation and species coexistence along tropical elevational gradients.

4.1. Functional Groups

The distribution of functional groups shifted from an acquisitive strategy in lowlands, characterized by thin leaves with low dry matter content per area (FG2), to a conservative one in highlands, which was characterized by thick and resistant leaves with high dry matter content per area (FG4 and FG5) (Figure S3), in concordance with other studies [12,14,16]. Plant adaptation to environmental heterogeneity along the elevational gradient was mainly associated with two functionally independent axes. On one hand, the first RLQ axis represented the aforementioned leaf economic spectrum, in which plants have developed mechanisms of protection against physical/biological hazards by increasing LT and Lth at lower temperature but increasing SLA and LA to improve their photosynthetic efficiency in warmer lowlands [12,30,62,63]. On the other hand, the second RLQ axis represented a growth tradeoff, which was positively correlated with LDMC and WD. The growth tradeoff highlights the capability of plants to acquire and store resources, and thus, to accumulate carbon [64,65,66]. Although the wood density did not show a clear pattern along elevation, our results agree with other studies in tropical lowlands that have demonstrated a positive correlation with low fertility [67]. However, our findings suggest a still unexplored relationship between WD and the association with nitrogen-fixing bacteria, which could support the positive correlation observed between WD and nitrogen accumulation in species with low growth rates [68] in the understory.

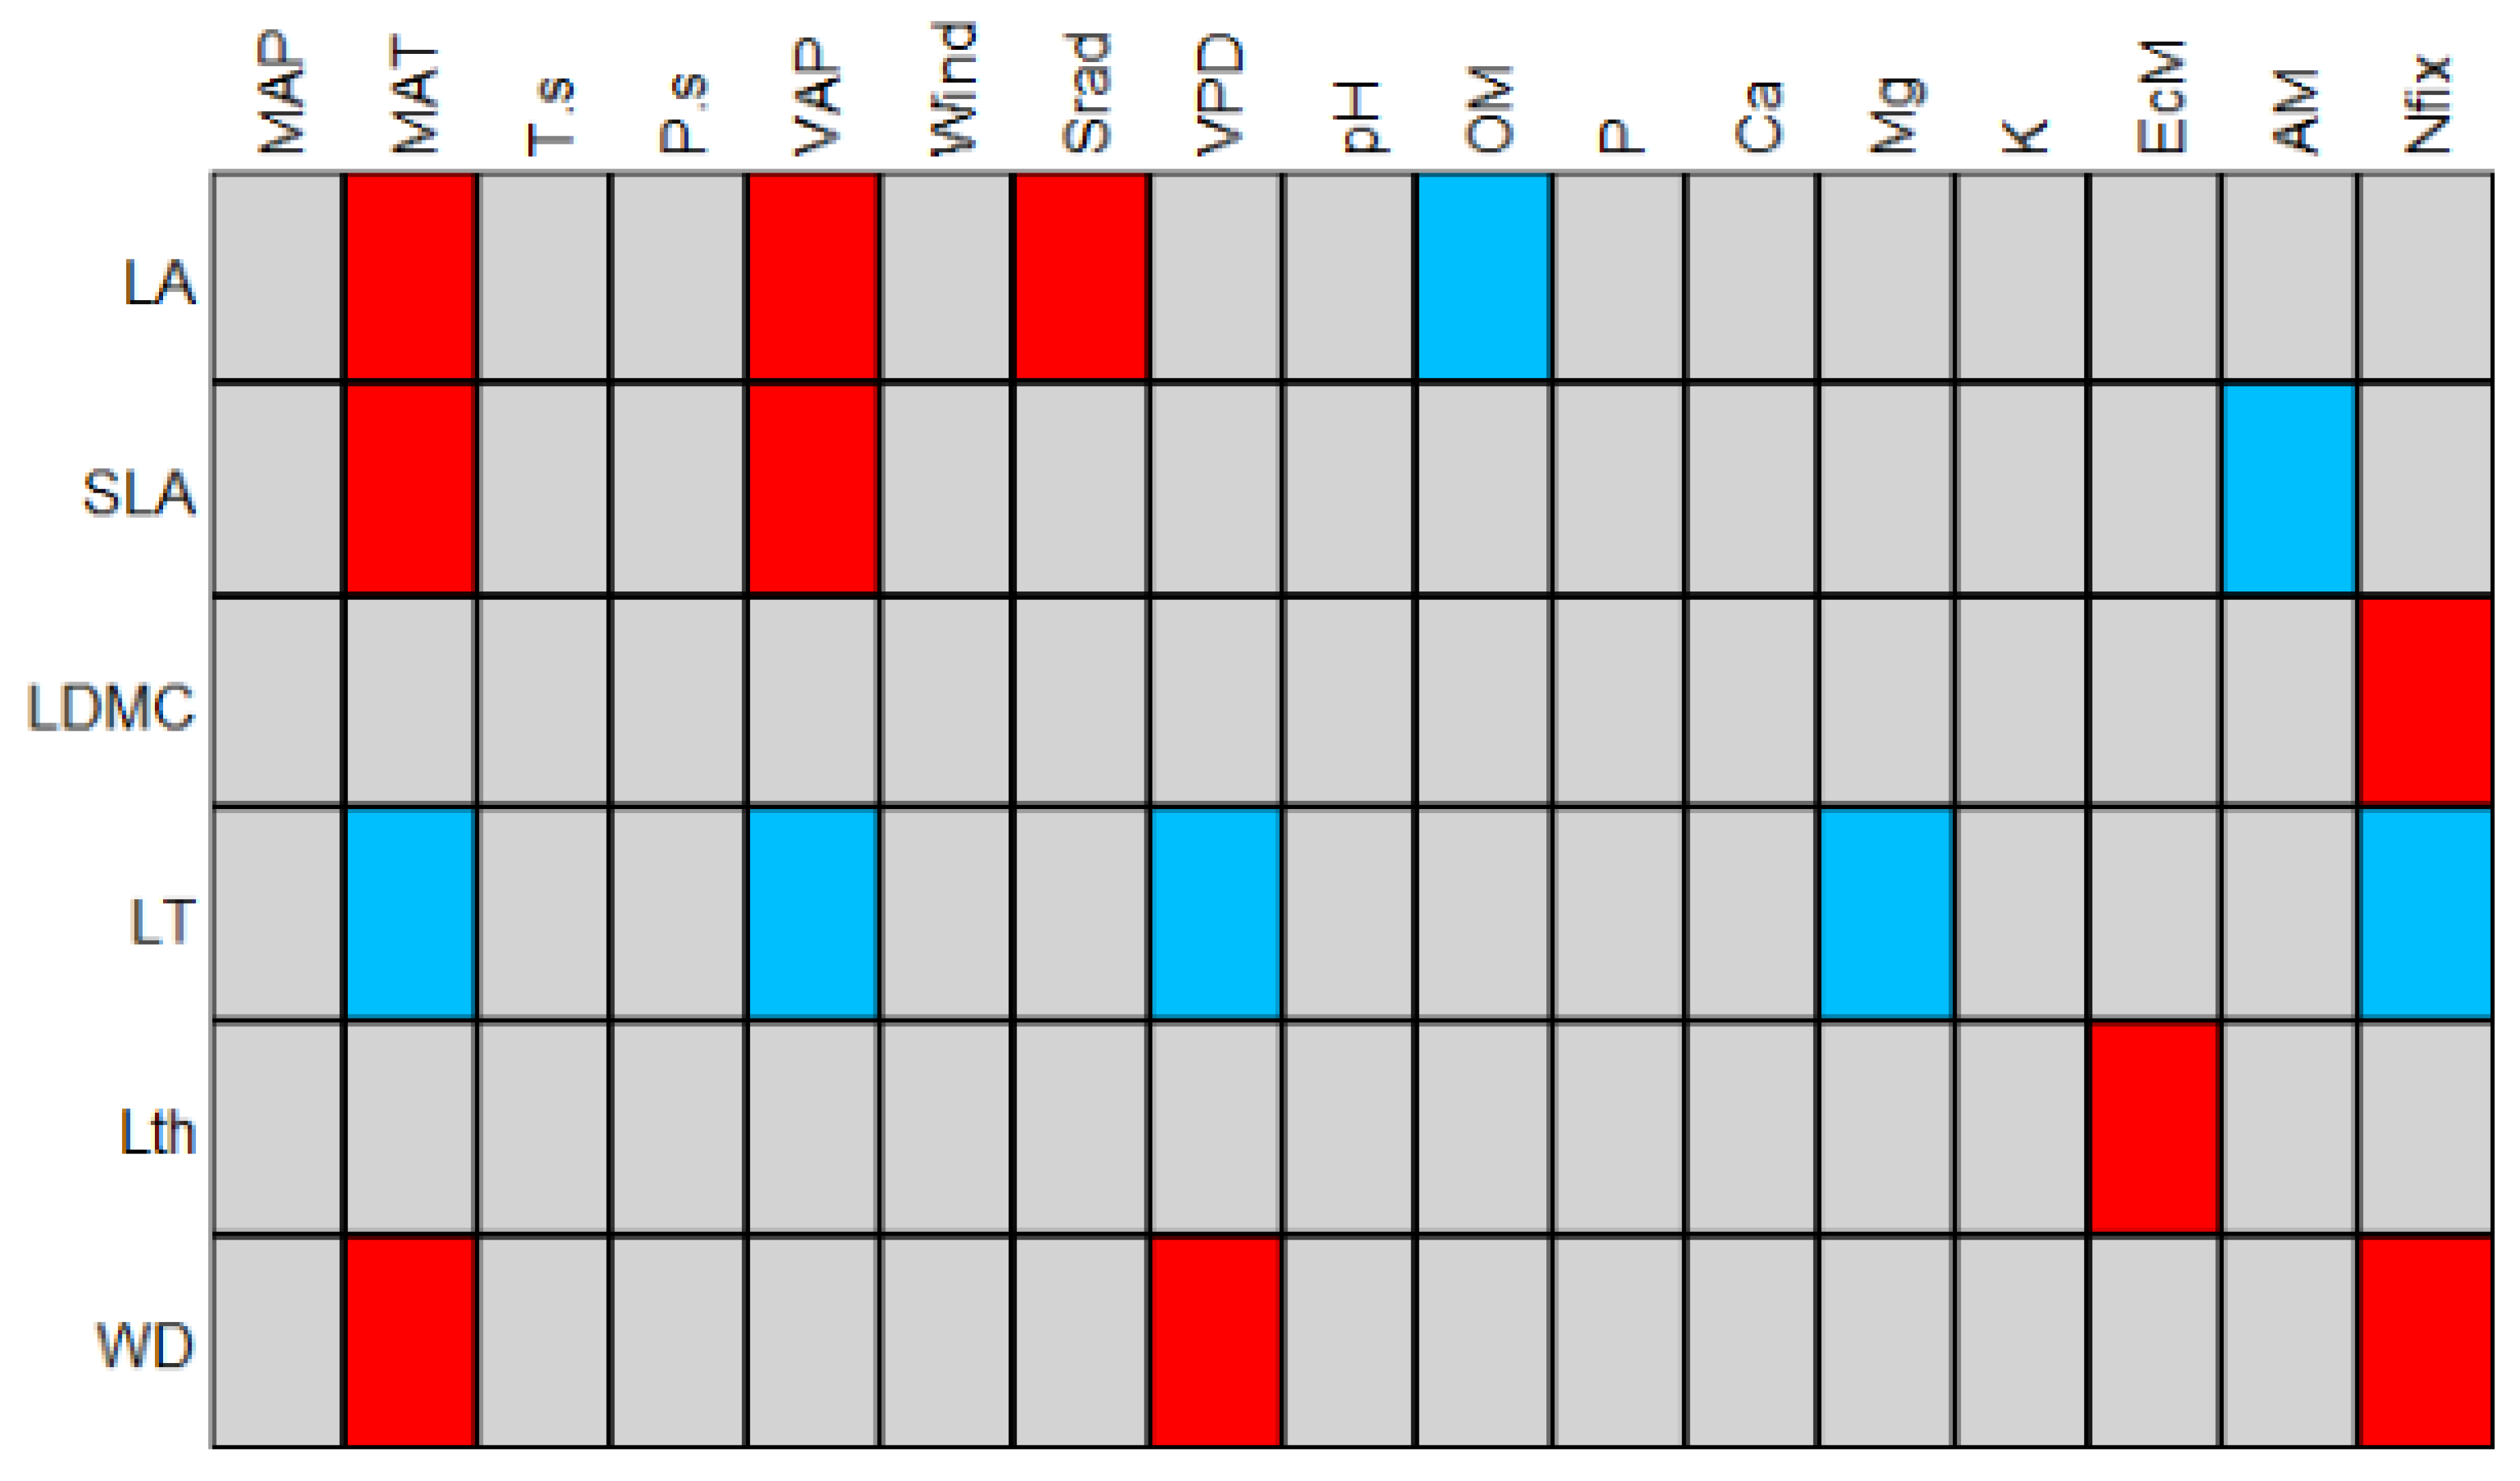
4.2. Drivers of Plant Trait Assembly

In contradiction to our second hypothesis, we found that soil environmental heterogeneity and symbiotic root associations were both significant drivers of plant trait plasticity and adaptation in wet tropical Andean forests along with climatic variation. The relevant climatic variables in our study area were MAT, VAP, VPD, and Srad, which favored SLA but reduced LT. A decrease in SLA but an increase in LT with the decline in temperature has also been reported in similar studies on tropical elevational gradients [14,69], confirming the expected tradeoff between increasing photosynthetic efficiency at low altitudes and an increase in defenses against harsher climatic conditions in the highlands [62,63]. A decrease in the evaporative demand at higher elevations may also regulate the foliar accumulation of mobile nutrients [15], as was revealed in our study for N (here understood as an increase in organic matter) and Mg. Although our study area did not present limitations due to water since they are humid forests, our analysis highlighted that in environments with a high vapor pressure deficit (low altitudes), plants increased their WD, likely as a strategy to avoid cavitation [70].
Soil fertility also played a major role in shaping trait assembly along elevational gradients [71]. Both Mg and OM were negatively and positively correlated with elevation, respectively. The negative correlation between magnesium in soils and leaf thickness emphasizes the importance of Mg concentration in leaves to enhance photosynthesis [72,73]. Alternatively, the negative correlation between leaf area and organic matter points to N limitation in high/cold elevations [74,75,76], which has been associated with low decomposition and soil mineralization rates [36,37,75]. Conversely, in our study area, phosphorus did not correlate significantly with any functional trait, which indicates that, in this region, P was not limiting for trait development [16]. This lack of correlation may be due to the high variability in P concentration along the elevation gradient (Figure S2 and Table S2) [77] or the relative young age of the Andean soils that supposes a low limitation of phosphorus [74,77].
In the whole plant community (DBH ≥ 1 cm), our findings suggest contrasting roles among symbiotic root associations in promoting plant growth. Nitrogen-fixing associations were more prevalent at low altitudes, while mycorrhizal (AM and EcM) associations were more abundant at high altitudes, with EcM associations largely constrained to higher elevations (Figure S2). The positive relations between N-fix associations with WD and LDMC suggests a primary role of this symbiosis in enhancing plant carbon assimilation in areas that contain higher availability of nutrients. However, as shown below, this trend was consistent only for small trees (Figure 5b), suggesting that N-fixing associations may enhance carbon accumulation mainly in the earlier stages of development of shade-tolerant species. In contrast, the higher abundance of AM and EcM associations in sites with lower temperatures (Figure S2) was mainly associated with conservative traits (low SLA or high Lth). This may reflect greater reliance of these plants on these symbiotic associations to ensure sufficient nutrient acquisition under harsher environmental conditions [37,78,79,80].

4.3. Traits–Environment Relationship for Different Tree Size Cutoff

When we split the whole dataset into large (DBH ≥ 10 cm) and small trees (1 cm ≤ DBH < 10 cm), our results showed only partial differences in the extent to which the explanatory variables differentially determined plant trait assembly. MAT and VPD correlated positively with LA in small trees and SLA in large trees. Small trees need to increase leaf area to increase light interception to out shade their neighbors [36]. Increases in specific leaf area in large trees aim to enhance photosynthetic efficiency [51]. Only in large trees, wind speed and solar radiation, which are promoters of boundary layer conductance [72], were positively correlated with the SLA. Finally, temperature seasonality was significantly associated with WD for large trees, while mean annual temperature was with small trees. In large trees, a greater WD has been shown to be an effective strategy to resist droughts and water shortage mainly triggered by the increase in temperature [67,81]. However, for small trees, the increase in WD seems to respond to slow-growing shade-tolerant species that tend to accumulate carbon [68].
Regarding soil fertility, K and Mg have been found to be associated with the harvest of light and the photosynthetic efficiency of plants [63,72,73]. Mg had a more significant influence on large trees (high SLA y low LT), while K influenced small trees, highlighting the prevalence of carbon assimilation (high LDCM).
In conclusion, our study emphasizes the importance of considering small individuals and local factors, such as soil fertility and symbiotic root associations, to better understand the drivers of plant trait assembly along complex environmental gradients. Likewise, we emphasize the utility of using leaf and woody traits to improve our understanding of the main drivers of plant assembly in species-rich tropical forests along elevational gradients.

Supplementary Materials

The following are available online at https://www.mdpi.com/article/10.3390/land10101057/s1, Table S1. Climatic values per plot in the northwestern Andean mountains, Colombia. Table S2. Soil values per plot in the northwestern Andean mountains, Colombia. Table S3. Community Weight Mean (CWM) of the six traits (LA, SLA, LT, LTh, LDMC, and WD). Figure S1. Sample plot design diagram. Figure S2. Correlation between elevation and environmental variables. Figure S3. Distribution of the functional group abundance along elevational gradient and plot of the first two RLQ axes with the environmental variables. Plot establishment and trait sampling. Methods used to calculate leaf and woody traits.

Author Contributions

A.O.-B.: data preparation, analysis, and writing of the manuscript. J.A.M.-V.: data collection, data preparation, and processing. P.G.K.: collaboration in writing and editing. B.S.-N.: data collection and suggestions to improve the quality of the manuscript. A.D.: data collection, analysis, writing, and editing. All authors have read and agreed to the published version of the manuscript.

Funding

Functional characterization was funded by the Alexander von Humboldt Biological Resources Research Institute and Université du Québec à Montréal.

Data Availability Statement

The datasets generated and analyzed during the current study are not publicly available. The data employed for the analysis are available from the AD on reasonable request.

Acknowledgments

We thank the Dirección de Investigaciones de la Universidad Nacional de Colombia Sede Medellín (DIME) and Johanna Martinez Villa for financing and facilitating the establishment of monitoring plots. We also thank the Alexander von Humboldt Biological Resources Research Institute for funding the trait measurement.

Conflicts of Interest

The authors declare that they have no competing interest.

References

  1. Myers, N.; Mittermeier, R.; Mittermeier, C.; da Fonseca, G.; Kent, J. Biodiversity hotspots for conservation priorities. Nature 2000, 403, 853–858. [Google Scholar] [CrossRef] [PubMed]
  2. Orme, C.D.L.; Davies, R.G.; Burgess, M.; Eigenbrod, F.; Pickup, N.; Olson, V.A.; Webster, A.J.; Ding, T.S.; Rasmussen, P.C.; Ridgely, R.S.; et al. Global hotspots of species richness are not congruent with endemism or threat. Nature 2005, 436, 1016–1019. [Google Scholar] [CrossRef] [PubMed]
  3. Aide, T.M.; Clark, M.L.; Grau, H.R.; López-Carr, D.; Levy, M.A.; Redo, D.; Bonilla-Moheno, M.; Riner, G.; Andrade-Núñez, M.J.; Muñiz, M. Deforestation and reforestation of Latin America and the Caribbean (2001–2010). Biotropica 2013, 45, 262–271. [Google Scholar] [CrossRef]
  4. Duque, A.; Peña, M.A.; Cuesta, F.; González-Caro, S.; Kennedy, P.; Phillips, O.L.; Calderón-Loor, M.; Blundo, C.; Carilla, J.; Cayola, L.; et al. Mature Andean forests as globally important carbon sinks and future carbon refuges. Nat. Commun. 2021, 12, 2138. [Google Scholar] [CrossRef]
  5. Rodríguez, N.; Armenteras, D.; Morales, M.; Romero, M. Ecosistemas de los Andes Colombianos, 2nd ed.; Instituto de Investigación de Recursos Biológicos Alexander von Humboldt: Bogotá, Colombia, 2006; ISBN 9588151309. [Google Scholar]
  6. Sánchez-Cuervo, A.M.; Aide, T.M. Consequences of the armed conflict, forced human displacement, and land abandonment on forest cover change in Colombia: A multi-scaled analysis. Ecosystems 2013, 16, 1052–1070. [Google Scholar] [CrossRef]
  7. Martínez-Villa, J.A.; González-Caro, S.; Duque, Á. The importance of grain and cut-off size in shaping tree beta diversity along an elevational gradient in the northwest of Colombia. For. Ecosyst. 2020, 7, 2–12. [Google Scholar] [CrossRef] [Green Version]
  8. Booth, B.D.; Swanton, C.J. Assembly theory applied to weed communities. Weed Sci. 2002, 50, 2–13. [Google Scholar] [CrossRef]
  9. Keddy, P.A. A pragmatic approach to functional ecology. Funct. Ecol. 1992, 6, 621–626. [Google Scholar] [CrossRef]
  10. Mcgill, B.J.; Enquist, B.J.; Weiher, E.; Westoby, M. Rebuilding community ecology from functional traits. Trends Ecol. Evol. 2006, 21, 178–185. [Google Scholar] [CrossRef]
  11. Malizia, A.; Blundo, C.; Carilla, J.; Acosta, O.O.; Cuesta, F.; Duque, A.; Aguirre, N.; Aguirre, Z.; Ataroff, M.; Baez, S.; et al. Elevation and latitude drives structure and tree species composition in Andean forests: Results from a large-scale plot network. PLoS ONE 2020, 14, e0231553. [Google Scholar] [CrossRef] [Green Version]
  12. Agudelo, C.M.; Benavides, A.M.; Taylor, T.; Feeley, K.J.; Duque, A. Functional composition of epiphyte communities in the Colombian Andes. Ecology 2019, 100, 1–11. [Google Scholar] [CrossRef] [PubMed]
  13. Blonder, B.; Salinas, N.; Bentley, L.P.; Shenkin, A.; Chambi Porroa, P.O.; Valdez Tejeira, Y.; Cyrille, V.; Fyllas, N.M.; Goldsmith, G.R.; Martin, R.E.; et al. Predicting trait-environment relationships for venation networks along an Andes-Amazon elevation gradient. Ecology 2017, 98, 1239–1255. [Google Scholar] [CrossRef] [Green Version]
  14. Ding, Y.; Zang, R.; Lu, X.; Huang, J.; Xu, Y. The effect of environmental filtering on variation in functional diversity along a tropical elevational gradient. J. Veg. Sci. 2019, 30, 973–983. [Google Scholar] [CrossRef]
  15. Homeier, J.; Seeler, T.; Pierick, K.; Leuschner, C. Leaf trait variation in species—Rich tropical Andean forests. Sci. Rep. 2021, 11, 9993. [Google Scholar] [CrossRef] [PubMed]
  16. van de Weg, M.J.; Meir, P.; Grace, J.; Atkin, O.K. Altitudinal variation in leaf mass per unit area, leaf tissue density and foliar nitrogen and phosphorus content along an Amazon-Andes gradient in Peru. Plant Ecol. Divers. 2009, 2, 243–254. [Google Scholar] [CrossRef]
  17. Read, Q.D.; Moorhead, L.C.; Swenson, N.G.; Bailey, J.K.; Sanders, N.J. Convergent effects of elevation on functional leaf traits within and among species. Funct. Ecol. 2014, 28, 37–45. [Google Scholar] [CrossRef]
  18. Grossiord, C.; Buckley, T.N.; Cernusak, L.A.; Novick, K.A.; Poulter, B.; Siegwolf, R.T.W.; Sperry, J.S.; McDowell, N.G. Plant responses to rising vapor pressure deficit. N. Phytol. 2020, 226, 1550–1566. [Google Scholar] [CrossRef] [Green Version]
  19. Wieczynski, D.J.; Boyle, B.; Buzzard, V.; Duran, S.M.; Henderson, A.N.; Hulshof, C.M.; Kerkhoff, A.J.; McCarthy, M.C.; Michaletz, S.T.; Swenson, N.G.; et al. Climate shapes and shifts functional biodiversity in forests worldwide. Proc. Natl. Acad. Sci. USA 2019, 116, 587–592. [Google Scholar] [CrossRef] [Green Version]
  20. Chave, J.; Coomes, D.; Jansen, S.; Lewis, S.L.; Swenson, N.G.; Zanne, A.E. Towards a worldwide wood economics spectrum. Ecol. Lett. 2009, 12, 351–366. [Google Scholar] [CrossRef]
  21. Hacke, U.G.; Sperry, J.S.; Pockman, W.T.; Davis, S.D.; McCulloh, K.A. Trends in wood density and structure are linked to prevention of xylem implosion by negative pressure. Oecologia 2001, 126, 457–461. [Google Scholar] [CrossRef]
  22. Reich, P.; Wright, I.; Bares, J.C.; Craine, J.M.; Oleksyn, J.; Walters, M.B.; Reich, P.B.; Wright, I.J.; Craine, J.M.; Oleksyn, J.; et al. The evolution of plant functional variation: Traits, spectra, and strategies. Int. J. Plant Sci. 2003, 164, 143–164. [Google Scholar] [CrossRef]
  23. Worthy, S.J.; Swenson, N.G. Functional perspectives on tropical tree demography and forest dynamics. Ecol. Process. 2019, 8, 1–11. [Google Scholar] [CrossRef] [Green Version]
  24. Poorter, L.; Wright, S.J.; Paz, H.; Ackerly, D.; Condit, R.; Ibarra-Manríquez, G.; Harms, K.E.; Licona, J.; Martínez-Ramos, M.; Mazer, S.J.; et al. Are functional traits good predictors of demographic rates? Evidence from five neotropical forests. Ecol. Res. 2008, 89, 1908–1920. [Google Scholar] [CrossRef] [PubMed]
  25. Wright, S.J.; Kitajima, K.; Kraft, N.J.B.; Reich, P.B.; Wright, I.J.; Bunker, D.E.; Condit, R.; Dalling, J.W.; Davies, S.J.; Díaz, S.; et al. Functional traits and the growth—Mortality trade-off in tropical trees. Ecography 2010, 91, 3664–3674. [Google Scholar] [CrossRef] [PubMed]
  26. Baraloto, C.; Paine, C.E.T.; Poorter, L.; Beauchene, J.; Bonal, D.; Domenach, A.-M.; Hérault, B.; Patiño, S.; Roggy, J.-C.; Chave, J. Decoupled leaf and stem economics in rain forest trees. Ecol. Lett. 2010, 13, 1338–1347. [Google Scholar] [CrossRef]
  27. Muscarella, R.; Uriarte, M.; Erickson, D.L.; Swenson, N.G.; Kress, W.J.; Zimmerman, J.K. Variation of tropical forest assembly processes across regional environmental gradients. Perspect. Plant Ecol. Evol. Syst. 2016, 23, 52–62. [Google Scholar] [CrossRef] [Green Version]
  28. Pinho, B.X.; Tabarelli, M.; Engelbrecht, B.M.J.; Sfair, J.; Melo, F.P.L. Plant functional assembly is mediated by rainfall and soil conditions in a seasonally dry tropical forest. Basic Appl. Ecol. 2019, 40, 1–11. [Google Scholar] [CrossRef]
  29. Poorter, L.; Mcdonald, I.; Alarco, A.; Fichtler, E.; Licona, J.; Marielos, P.-C.; Sterck, F.; Villegas, Z.; Sass-klaassen, U. The importance of wood traits and hydraulic conductance for the performance and life history strategies of 42 rainforest tree species. N. Phytol. 2010, 185, 481–492. [Google Scholar] [CrossRef]
  30. Reich, P.B. The world-wide ‘fast–slow’ plant economics spectrum: A traits manifesto. J. Ecol. 2014, 102, 275–301. [Google Scholar] [CrossRef]
  31. Shen, Y.; Yu, S.; Lian, J.; Shen, H.; Cao, H.-L.; Lu, H.-P.; Ye, W.-H. Inferring community assembly processes from trait diversity across environmental gradients. J. Trop. Ecol. 2016, 32, 1–10. [Google Scholar] [CrossRef]
  32. Capers, R.S.; Chazdon, R.L. Rapid assessment of understory light availability in a wet tropical forest. Agric. For. Meteorol. 2004, 123, 177–185. [Google Scholar] [CrossRef]
  33. Montgomery, R.A.; Chazdon, R.L. Forest structure, canopy architecture, and light transmittance in Tropical Wet Forests. Ecology 2001, 82, 2707–2718. [Google Scholar] [CrossRef]
  34. Poorter, L. Leaf traits show different relationships with shade tolerance in moist versus dry tropical forests. N. Phytol. 2009, 181, 890–900. [Google Scholar] [CrossRef]
  35. Salgado-Luarte, C.; Gianoli, E. Herbivores modify selection on plant functional traits in a temperate rainforest understory. Am. Nat. 2012, 180, 42–53. [Google Scholar] [CrossRef] [Green Version]
  36. Liu, F.; Zhang, M.; Yang, W.; Liu, Y.; Wang, W.; Zheng, J.; An, S. Leaf functional traits and trait relationships of tropical woody vegetation in relation to successional stage: Shifts in understory and canopy layers leaf functional traits and trait relationships of tropical woody vegetation in relation to successional. Ecoscience 2012, 19, 198–208. [Google Scholar] [CrossRef] [Green Version]
  37. Dantas de Paula, M.; Forrest, M.; Langan, L.; Bendix, J.; Homeier, J.; Velescu, A.; Wilcke, W.; Hickler, T. Nutrient cycling drives plant community trait assembly and ecosystem functioning in a tropical mountain biodiversity hotspot. N. Phytol. 2021, 232, 551–566. [Google Scholar] [CrossRef]
  38. Dixon, R.; Rao, M.V.; Garg, V.K. Water relations and gas exchange of mycorrhizal leucaena leucocephala seedlings. J. Trop. For. Sci. 1994, 6, 542–552. [Google Scholar]
  39. Hernández-Vargas, G.; Perroni, Y.; López-Acosta, J.C.; Noa-Carrazana, J.C.; Sánchez-Velásquez, L.R. Do the distribution patterns of plant functional traits change during early secondary succession in tropical montane cloud forests? Acta Oecologica 2019, 95, 26–35. [Google Scholar] [CrossRef]
  40. Maherali, H. Mutualism as a plant functional trait: Linking variation in the mycorrhizal symbiosis to climatic tolerance, geographic range and population dynamics. Int. J. Plant Sci. 2020, 181, 1–30. [Google Scholar] [CrossRef]
  41. Shi, L.; Wang, J.; Liu, B.; Nara, K.; Lian, C.; Shen, Z.; Xia, Y.; Chen, Y. Ectomycorrhizal fungi reduce the light compensation point and promote carbon fixation of Pinus thunbergii seedlings to adapt to shade environments. Mycorrhiza 2017, 27, 823–830. [Google Scholar] [CrossRef] [Green Version]
  42. Valladares, F.; Gianoli, E.; Gómez, J.M. Ecological limits to plant phenotypic plasticity. N. Phytol. 2007, 176, 749–763. [Google Scholar] [CrossRef]
  43. Etter, A.; McAlpine, C.; Possingham, H. Historical patterns and drivers of landscape change in Colombia since 1500: A regionalized spatial approach. Ann. Assoc. Am. Geogr. 2008, 98, 2–23. [Google Scholar] [CrossRef]
  44. Herault, M.R.-M.; Tanguy, A.; Piponiot, C.; Chave, J.; Herault, B. BIOMASS: An {R} package for estimating above-ground biomass and its uncertainty in tropical forests. Methods Ecol. Evol. 2017, 8, 1163–1167. [Google Scholar] [CrossRef]
  45. Fick, S.; Hijmans, R. WorldClim 2: New 1-km spatial resolution climate surfaces for global land areas. Int. J. Climatol. 2017, 37, 4302–4315. [Google Scholar] [CrossRef]
  46. Steidinger, B.S.; Crowther, T.W.; Liang, J.; Van Nuland, M.E.; Werner, G.D.A.; Reich, P.B.; Nabuurs, G.; De-Miguel, S.; Zhou, M.; Picard, N.; et al. Climatic controls of decomposition drive the global biogeography of forest-tree symbioses. Nature 2019, 569, 404–408. [Google Scholar] [CrossRef] [PubMed] [Green Version]
  47. Maherali, H.; Oberle, B.; Stevens, P.F.; Cornwell, W.K.; McGlinn, D.J. Mutualism persistence and abandonment during the evolution of the mycorrhizal symbiosis. Am. Nat. 2016, 188, 113–125. [Google Scholar] [CrossRef] [PubMed]
  48. Tedersoo, L.; Laanisto, L.; Rahimlou, S.; Toussaint, A.; Hallikma, T.; Pärtel, M. Global database of plants with root-symbiotic nitrogen fixation: NodDB. J. Veg. Sci. 2018, 29, 560–568. [Google Scholar] [CrossRef]
  49. Perez-Harguindeguy, N.; Díaz, S.; Garnier, E.; Lavorel, S.; Poorter, H.; Jaureguiberry, P.; Cornwell, W.K.; Craine, J.M.; Gurvich, D.E.; Urcelay, C.; et al. New handbook for standardised measurement of plant functional traits worldwide. Aust. J. Bot. 2016, 64, 715–716. [Google Scholar] [CrossRef] [Green Version]
  50. Cornelissen, J.H.C.; Lavorel, S.; Garnier, E.; Diaz, S.; Buchmann, N.; Gurvich, D.E.; Reich, P.B.; Steege, H. A Handbook of protocols for standardised and easy measurement of plant functional traits worldwide. Aust. J. Bot. 2003, 51, 335–338. [Google Scholar] [CrossRef] [Green Version]
  51. Niinemets, Ü. A review of light interception in plant stands from leaf to canopy in different plant functional types and in species with varying shade tolerance. Ecol. Res. 2010, 25, 693–714. [Google Scholar] [CrossRef]
  52. Albert, C.H.; Thuiller, W.; Yoccoz, N.G.; Douzet, R.; Aubert, S.; Lavorel, S. A multi-trait approach reveals the structure and the relative importance of intra- vs. interspecific variability in plant traits. Funct. Ecol. 2010, 24, 1192–1201. [Google Scholar] [CrossRef]
  53. Kerkhoff, A.J.; Enquist, B.J. Multiplicative by nature: Why logarithmic transformation is necessary in allometry. J. Theor. Biol. 2009, 257, 519–521. [Google Scholar] [CrossRef]
  54. Dolédec, S.; Chessel, D.; Ter Braak, C.J.F.; Champely, S. Matching species traits to environmental variables: A new three-table ordination method. Environ. Ecol. Stat. 1996, 3, 143–166. [Google Scholar] [CrossRef]
  55. Legendre, P.; Galzin, R.G.; Harmelin-Vivien, M.L. Relating behavior to habitat: Solutions to the fourth-corner problem. Ecology 1997, 78, 547–562. [Google Scholar] [CrossRef]
  56. Ter Braak, C.J.; Cormont, A.; Dray, S. Improved testing of species traits–environment relationships in the fourth-corner problem. Ecology 2012, 93, 1525–1526. [Google Scholar] [CrossRef]
  57. Dray, S.; Dufour, A.-B. The ade4 package: Implementing the duality diagram for ecologists. J. Stat. Softw. 2007, 22, 1–20. [Google Scholar] [CrossRef] [Green Version]
  58. Dray, S.; Legendre, P. Testing the species traits environment relationships: The fourth-corner problem revisited. Ecology 2008, 89, 3400–3412. [Google Scholar] [CrossRef]
  59. Dray, S.; Choler, P.; Dolédec, S.; Peres-Neto, P.R.; Thuiller, W.; Pavoine, S.; Ter Braak, C.J.F. Combining the fourth-corner and the RLQ methods for assessing trait responses to environmental variation. Ecology 2014, 95, 14–21. [Google Scholar] [CrossRef] [Green Version]
  60. Hartigan, J.A.; Wong, M.A. Algorithm AS 136: A K-means clustering algorithm. Appl. Stat. 1979, 28, 100–108. [Google Scholar] [CrossRef]
  61. Alboukadel, K.; Mundt, F.; Kassambara, A.; Mundt, F. Factoextra: Extract and Visualize the Results of Multivariate Data Analyses. 2020. Available online: https://rpkgs.datanovia.com/factoextra/index.html (accessed on 7 October 2021).
  62. Körner, C.; Neumayer, M.; Menendez-Riedl, S.P.; Smeets-Scheel, A. Functional morphology of mountain plants. Flora 1989, 182, 353–383. [Google Scholar] [CrossRef]
  63. Wright, I.; Reich, P.B.; Cornelissen, J.H.C.C.; Falster, D.S.; Garnier, E.; Hikosaka, K.; Lamont, B.B.; Lee, W.; Oleksyn, J.; Osada, N.; et al. Assessing the generality of global leaf trait relationships. N. Phytol. 2005, 166, 485–496. [Google Scholar] [CrossRef] [PubMed]
  64. Hodgson, J.G.; Montserrat-Martí, G.; Charles, M.; Jones, G.; Wilson, P.; Shipley, B.; Sharafi, M.; Cerabolini, B.E.L.; Cornelissen, J.H.C.; Band, S.R.; et al. Is leaf dry matter content a better predictor of soil fertility than specific leaf area? Ann. Bot. 2011, 108, 1337–1345. [Google Scholar] [CrossRef] [PubMed] [Green Version]
  65. Wilson, P.J.; Thompson, K.; Hodgson, J.G. Specific leaf area and leaf dry matter content as alternative predictors of plant strategies. N. Phytol. 1999, 143, 155–162. [Google Scholar] [CrossRef]
  66. Jager, M.M.; Richardson, S.J.; Bellingham, P.J.; Clearwater, M.J.; Laughlin, D.C. Soil fertility induces coordinated responses of multiple independent functional traits. J. Ecol. 2015, 103, 374–385. [Google Scholar] [CrossRef]
  67. Zuleta, D.; Duque, A.; Cardenas, D.; Muller-Landau, H.; Davies, S. Comparison between different D-Dimer cutoff values to assess the individual risk of recurrent venous thromboembolism: Analysis of results obtained in the DULCIS study. Ecology 2017, 98, 2538–2546. [Google Scholar] [CrossRef]
  68. Martin, A.; Erickson, D.; Kress, J.; Thomas, S. Wood nitrogen concentrations in tropical trees: Phylogenetic patterns and ecological correlates. N. Phytol. 2014, 204, 484–495. [Google Scholar] [CrossRef]
  69. Asner, G.P.; Knapp, D.E.; Anderson, C.B.; Martin, R.E.; Vaughn, N. Large-scale climatic and geophysical controls on the leaf economics spectrum. Proc. Natl. Acad. Sci. USA 2016, 113, 4043–4051. [Google Scholar] [CrossRef] [Green Version]
  70. Swenson, N.G.; Enquist, B.J. Ecological and evolutionary determinants of a key plant functional trait: Wood density and its community-wide variation across latitude and elevation. Am. J. Bot. 2007, 94, 451–459. [Google Scholar] [CrossRef]
  71. Cárate-Tandalla, D.; Leuschner, C.; Homeier, J. Performance of seedlings of a shade-tolerant tropical tree species after moderate addition of N and P. Front. Earth Sci. 2015, 3, 75. [Google Scholar] [CrossRef] [Green Version]
  72. Tränkner, M.; Tavakol, E.; Jákli, B. Functioning of potassium and magnesium in photosynthesis, photosynthate translocation and photoprotection. Physiol. Plant. 2018, 163, 414–431. [Google Scholar] [CrossRef] [Green Version]
  73. Wang, J.; Wen, X.; Zhang, X.; Li, S.; Zhang, D.Y. Co-regulation of photosynthetic capacity by nitrogen, phosphorus and magnesium in a subtropical Karst forest in China. Sci. Rep. 2018, 8, 1–9. [Google Scholar] [CrossRef] [PubMed]
  74. Fisher, J.B.; Malhi, Y.; Torres, I.C.; Metcalfe, D.B.; van de Weg, M.J.; Meir, P.; Silva-Espejo, J.E.; Huasco, W.H. Nutrient limitation in rainforests and cloud forests along a 3000-m elevation gradient in the Peruvian Andes. Oecologia 2013, 172, 889–902. [Google Scholar] [CrossRef] [PubMed]
  75. Tanner, E.V.J.; Vitousek, P.M.; Cuevas, E. Experimental investigation of nutrient limitation of forest growth on wet tropical mountains. Ecology 1998, 79, 10–22. [Google Scholar] [CrossRef]
  76. Camenzind, T.; Hättenschwiler, S.; Treseder, K.; Lehmann, A.; Rillig, M. Nutrient limitation of soil microbial processes in tropical forests. Ecol. Monogr. 2017, 88, 4–21. [Google Scholar] [CrossRef]
  77. Asner, G.P.; Martin, R.E. Convergent elevation trends in canopy chemical traits of tropical forests. Glob. Chang. Biol. 2016, 22, 2216–2227. [Google Scholar] [CrossRef]
  78. Bunn, R.A.; Simpson, D.T.; Bullington, L.S.; Lekberg, Y.; Janos, D.P. Revisiting the ‘direct mineral cycling’ hypothesis: Arbuscular mycorrhizal fungi colonize leaf litter, but why? ISME J. 2019, 13, 1891–1898. [Google Scholar] [CrossRef] [Green Version]
  79. Nuccio, E.E.; Hodge, A.; Pett-Ridge, J.; Herman, D.J.; Weber, P.K.; Firestone, M.K. An arbuscular mycorrhizal fungus significantly modifies the soil bacterial community and nitrogen cycling during litter decomposition. Environ. Microbiol. 2013, 15, 1870–1881. [Google Scholar] [CrossRef]
  80. Phillips, R.P.; Brzostek, E.; Midgley, M.G. The mycorrhizal-associated nutrient economy: A new framework for predicting carbon-nutrient couplings in temperate forests. N. Phytol. 2013, 199, 41–51. [Google Scholar] [CrossRef]
  81. Esquivel-Muelbert, A.; Baker, T.R.; Dexter, K.G.; Lewis, S.L.; Ter Steege, H.; Lopez-Gonzalez, G.; Monteagudo Mendoza, A.; Brienen, R.; Feldpausch, T.R.; Pitman, N.; et al. Seasonal drought limits tree species across the Neotropics. Ecography 2017, 40, 618–629. [Google Scholar] [CrossRef] [Green Version]
Figure 1. Plot locations in the northwest Andes in Colombia. The symbol shape and the colors represent the change in the elevational gradient.
Land 10 01057 g001
Figure 2. Relationship between traits CWM and elevation in the northwest Andes of Colombia. LA: leaf area (mm2), SLA: specific leaf area (mm2 mg−1), LDMC: leaf dry matter content (mg g−1), LT: thickness (mm), Lth: toughness (N mm), and WD: wood density (g cm−3). Gray: all individuals (DBH ≥ 1 cm), orange: large individuals (DBH ≥ 10 cm), blue: small individuals (1 cm ≤ DBH < 10 cm). Not significant (ns), 0.05 (*), 0.01 (**), 0.001 (****).
Land 10 01057 g002
Figure 3. (a) Boxplot of trait per functional group resulting from the k-mean analysis. Tukey’s test estimated the significant mean differences with a 95% confidence level. (b) Species clustering according to K-mean results (Q row scores). (c) Traits lineal combination (Q loadings). LA (leaf area-mm2), SLA (leaf specific area-mm2 mg−1), LDMC (leaf dry matter content- mg g−1), LT (leaf thickness-mm), Lth (leaf toughness-N mm), and WD (wood density-g cm−3).
Land 10 01057 g003
Figure 4. Fourth corner analysis for all individuals (DBH ≥ 1 cm). Red cells represent a positive correlation and blue ones a negative correlation (α ≤ 0.05). Traits: LA (leaf area), SLA (leaf specific area), LDMC (leaf dry matter content), LT (leaf thickness), Lth (leaf toughness), and WD (wood density). Environmental factors: MAT (mean annual temperature), MAP (mean annual precipitation), T.s (temperature seasonality), P.s (precipitation seasonality), VAP (water vapor pressure), Wind (wind speed), SRad (solar radiation), VPD (vapor pressure deficit). Edaphic variables: pH, soil nutrients (Ca, K, Mg, and P), OM (organic matter content), EcM (ectomycorrhizal fungi), AM (arbuscular mycorrhizal fungi), and Nfix (Nitrogen-fixing bacteria).
Land 10 01057 g004
Figure 5. Outputs of the fourth corner analysis for large trees (a) and small trees (b), Cells in red represent a positive correlation and blue a negative one (α ≤ 0.05). Traits: LA (leaf area), SLA (leaf specific area), LDMC (leaf dry matter content), LT (leaf thickness), Lth (leaf toughness) and WD (wood density). Environmental factors: MAT (mean annual temperature), MAP (mean annual precipitation), T.s (temperature seasonality), P.s (precipitation seasonality), VAP (water vapor pressure), Wind (wind speed), SRad (solar radiation), VPD (vapor pressure deficit). Edaphic variables: pH, soil nutrients (Ca, K, Mg, and P), OM (organic matter content), EcM (ectomycorrhizal fungi), AM (arbuscular mycorrhizal fungi), and Nfix (Nitrogen-fixing bacteria).
Land 10 01057 g005
Table 1. RLQ Statistics. Each Ax represents the first five orthogonal axes with their respective Eigenvalues (Eig), projected inertia (Eig %), and cumulative projected inertia (%) (Accumulative). The two first orthogonal axes decomposition with their covariance (covar), R matrix variance (sdR), Q matrix variance (sdQ), and Q-R correlation (corr). Outputs of the permutation test, which alternative hypothesis is “greater” and p-value is estimated as: (number of random values equal to or greater than the observed one + 1)/(number of permutations + 1).
Total Inertia: 4,16
A × 1A × 2A × 3A × 4A × 5
Eig3.230.750.130.030.01
Eig %77.6618.103.040.840.27
Acumulative77.6695.7698.8199.6599.92
Eigenvalues Decomposition
EigcovarsdRsdQcorr
13.231.802.481.220.59
20.750.871.441.390.43
Permutation Test (Randtest)
TestObsStd. ObsAlterp value
1Model 24.163.98greater0.00006
2Model 44.1615.26greater0.00002
Publisher’s Note: MDPI stays neutral with regard to jurisdictional claims in published maps and institutional affiliations.

