
An Effectiveness Study on the Use of Different Types of LID for Water Cycle Recovery in a Small Catchment


Abstract
:1. Introduction
2. Materials and Methods
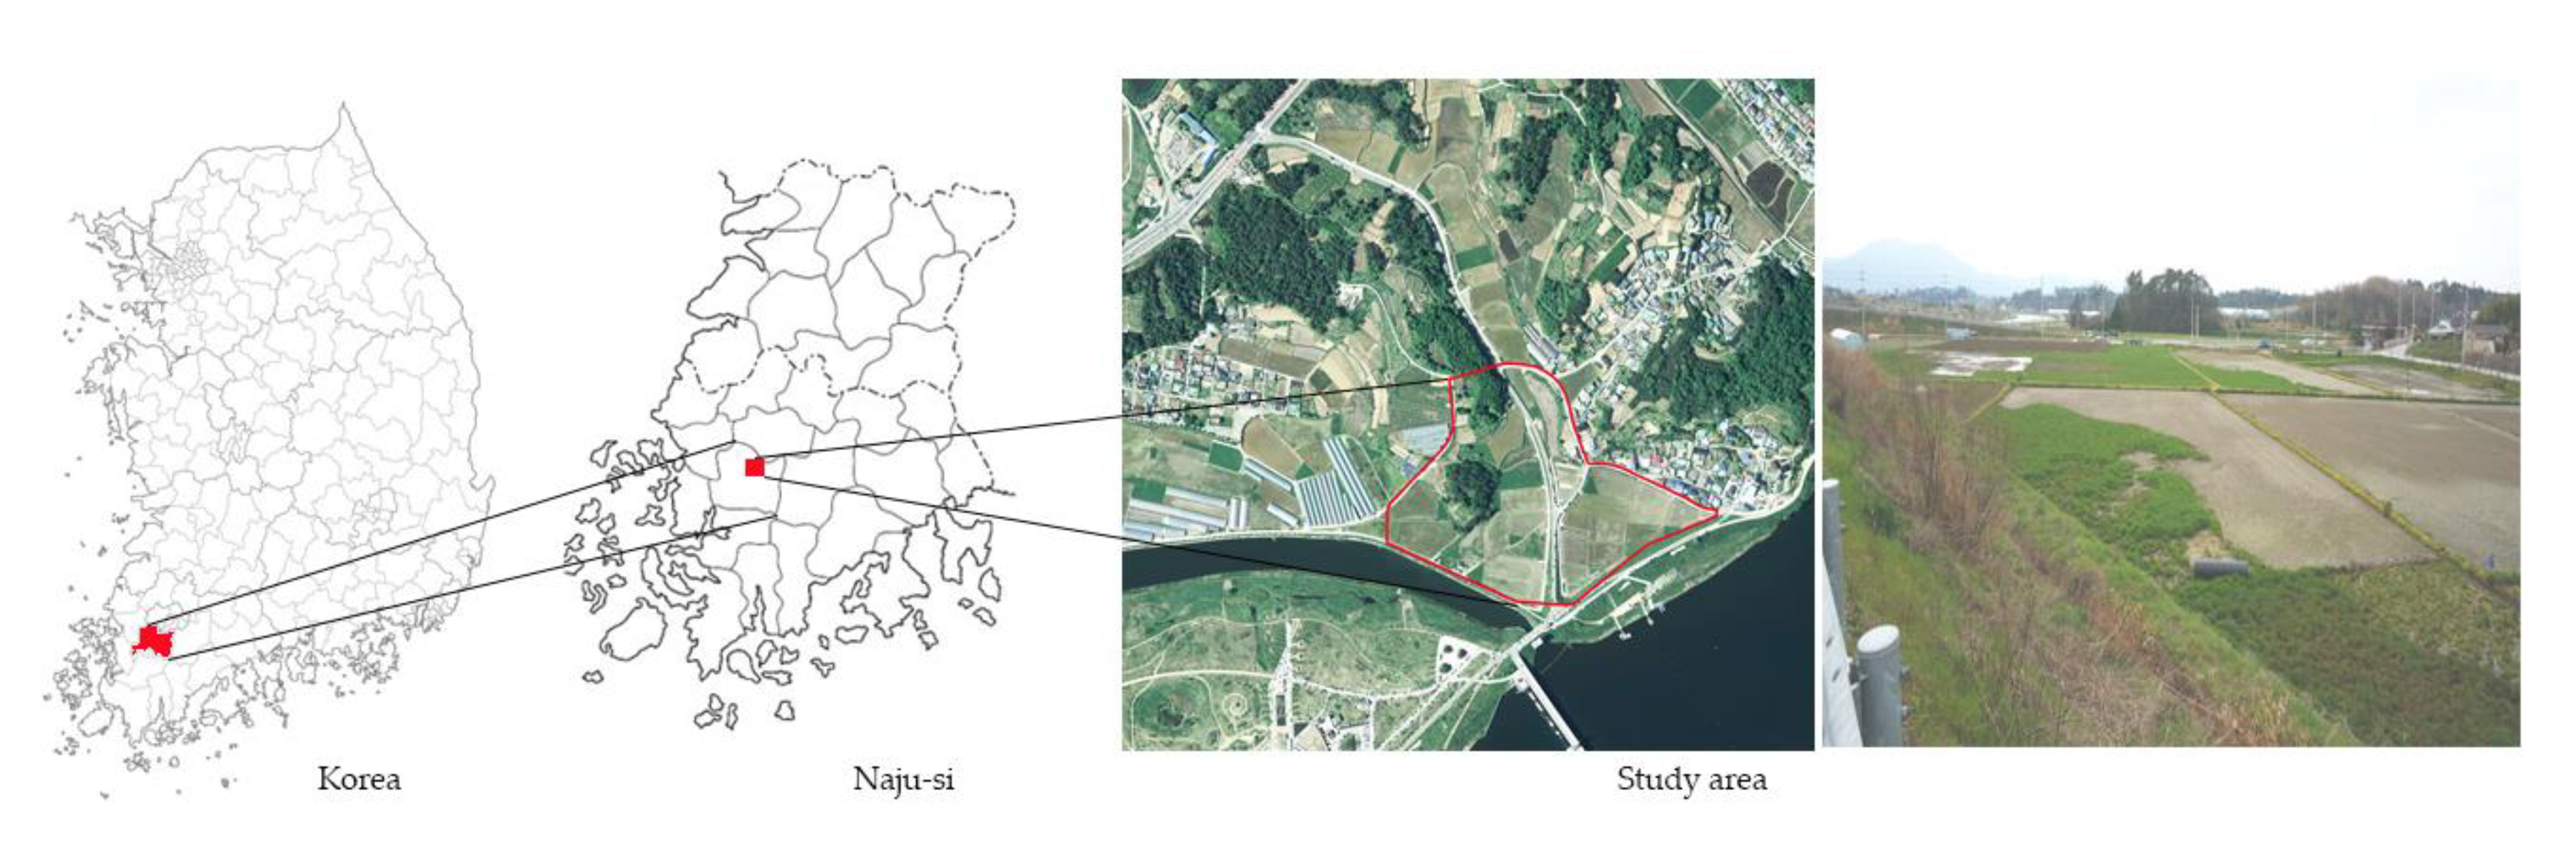
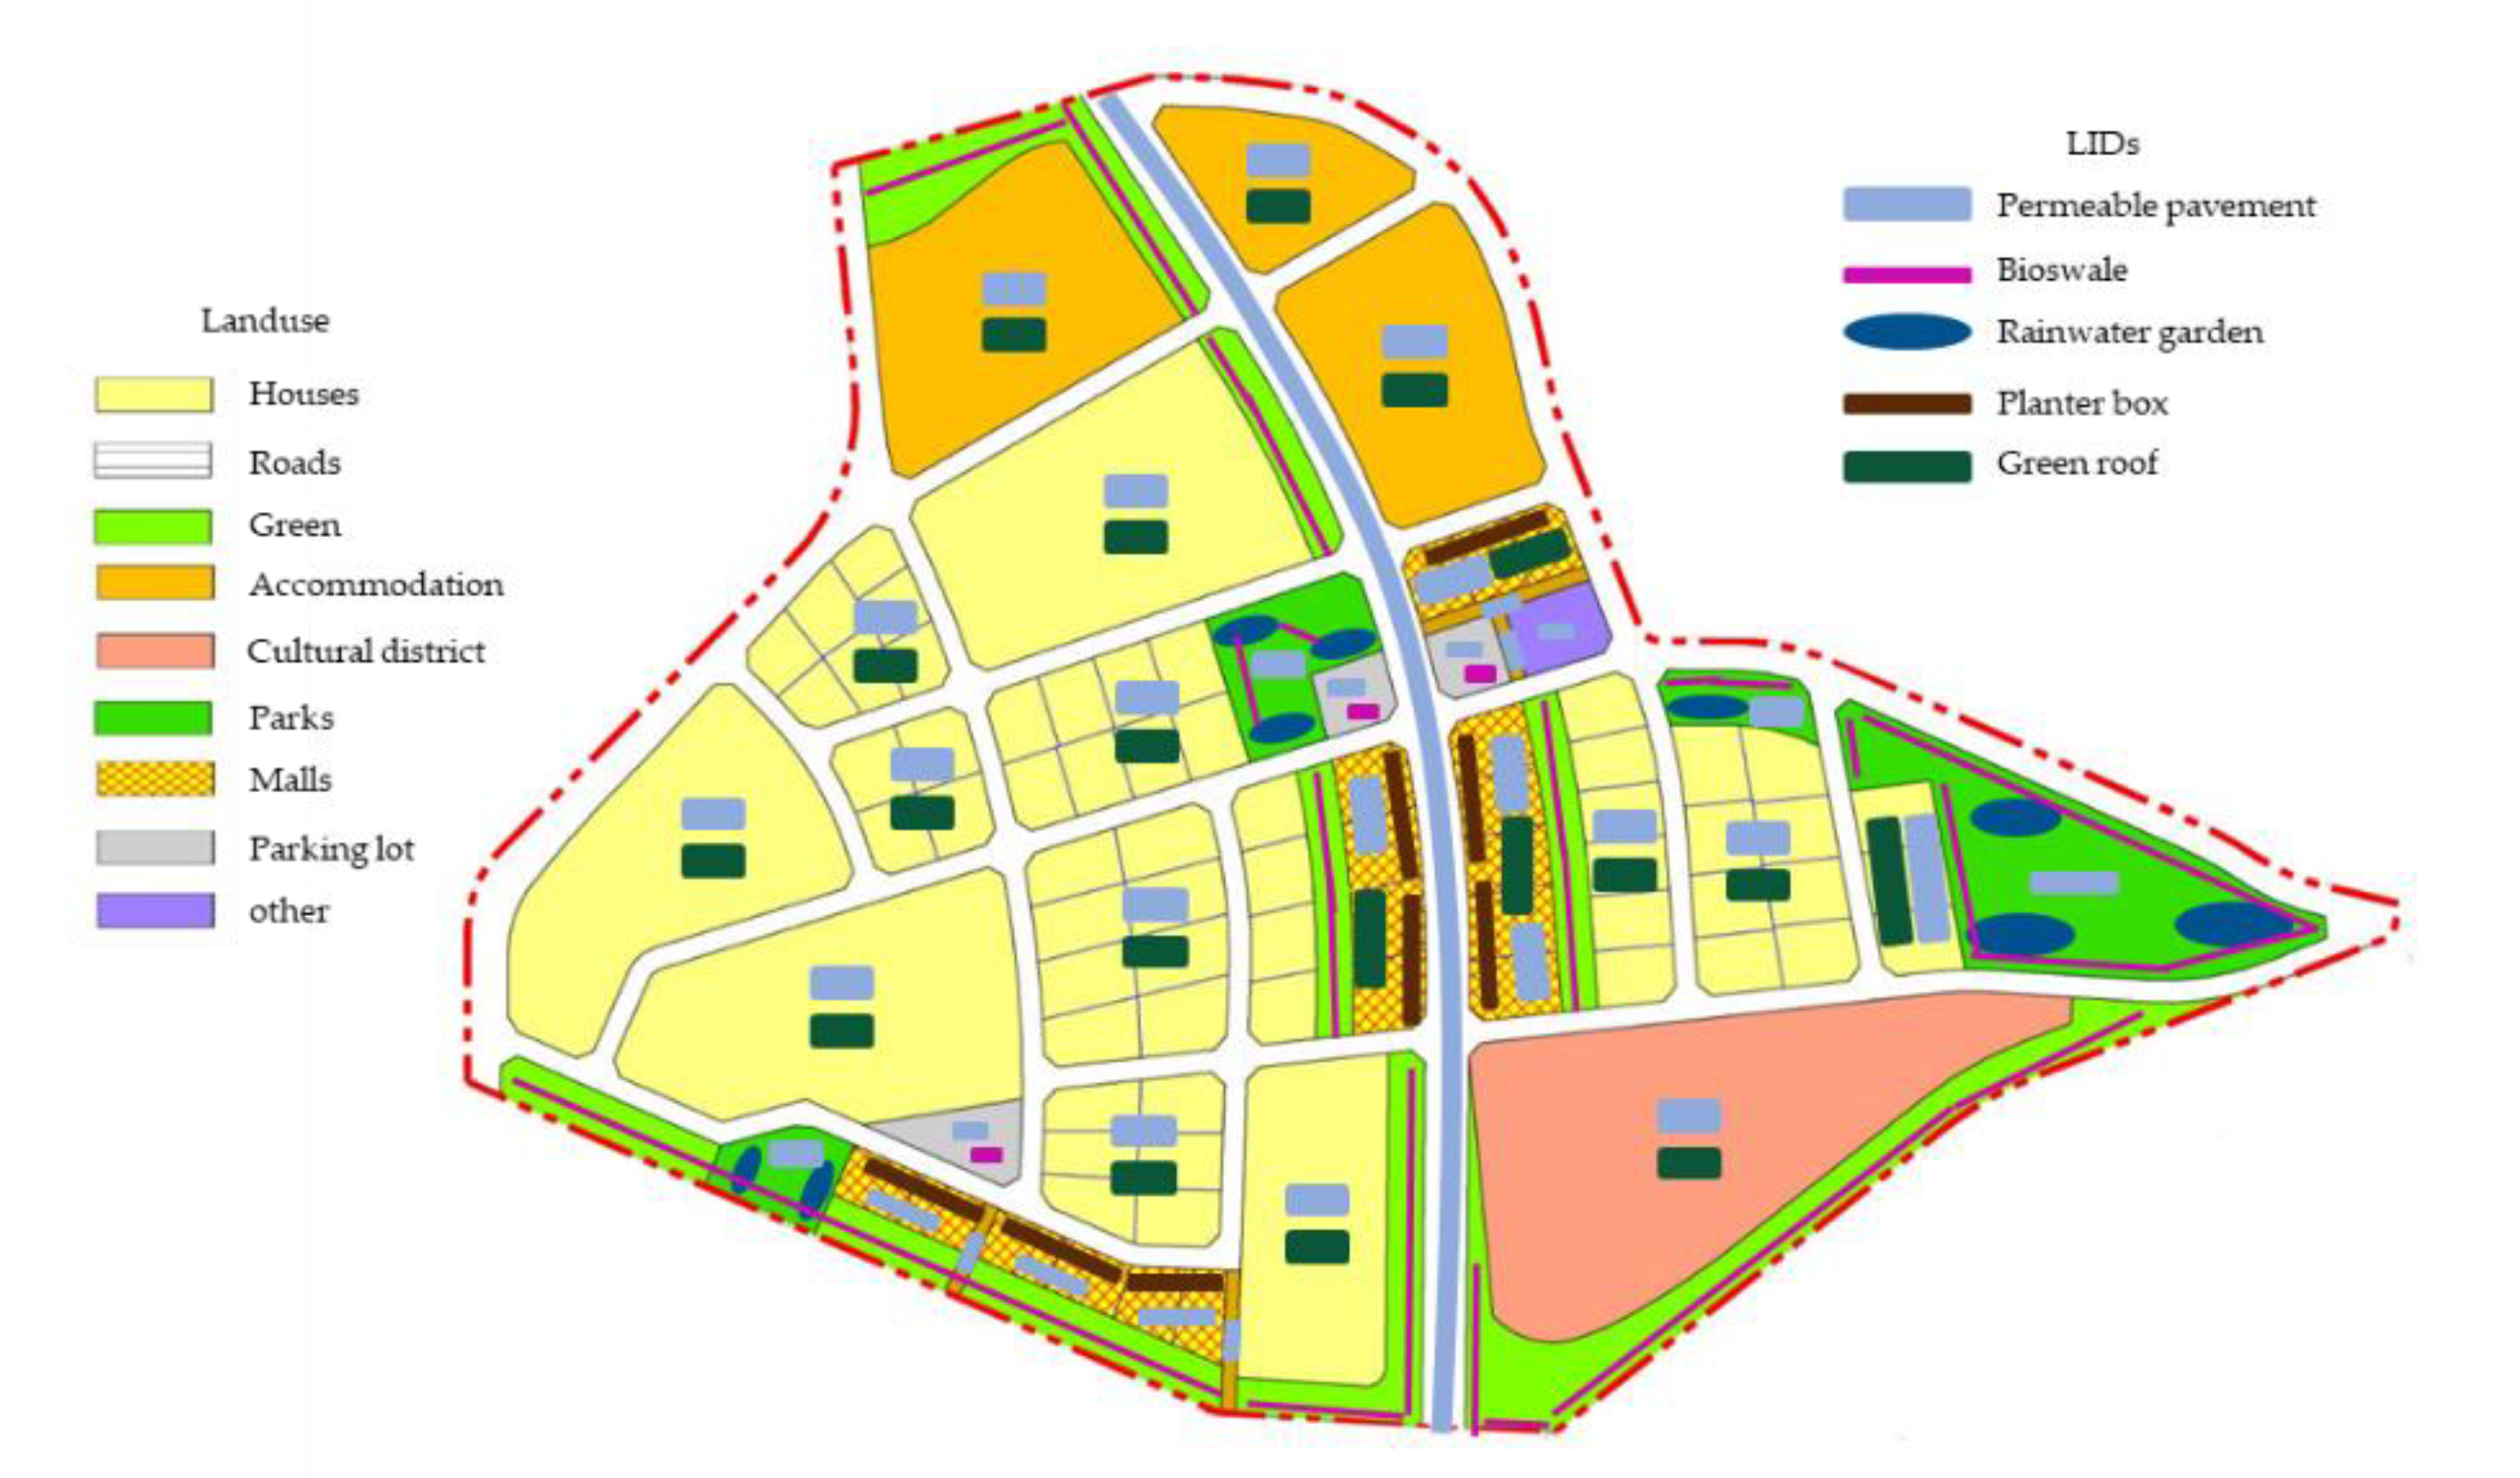
2.1. Research Location
2.2. SWMM
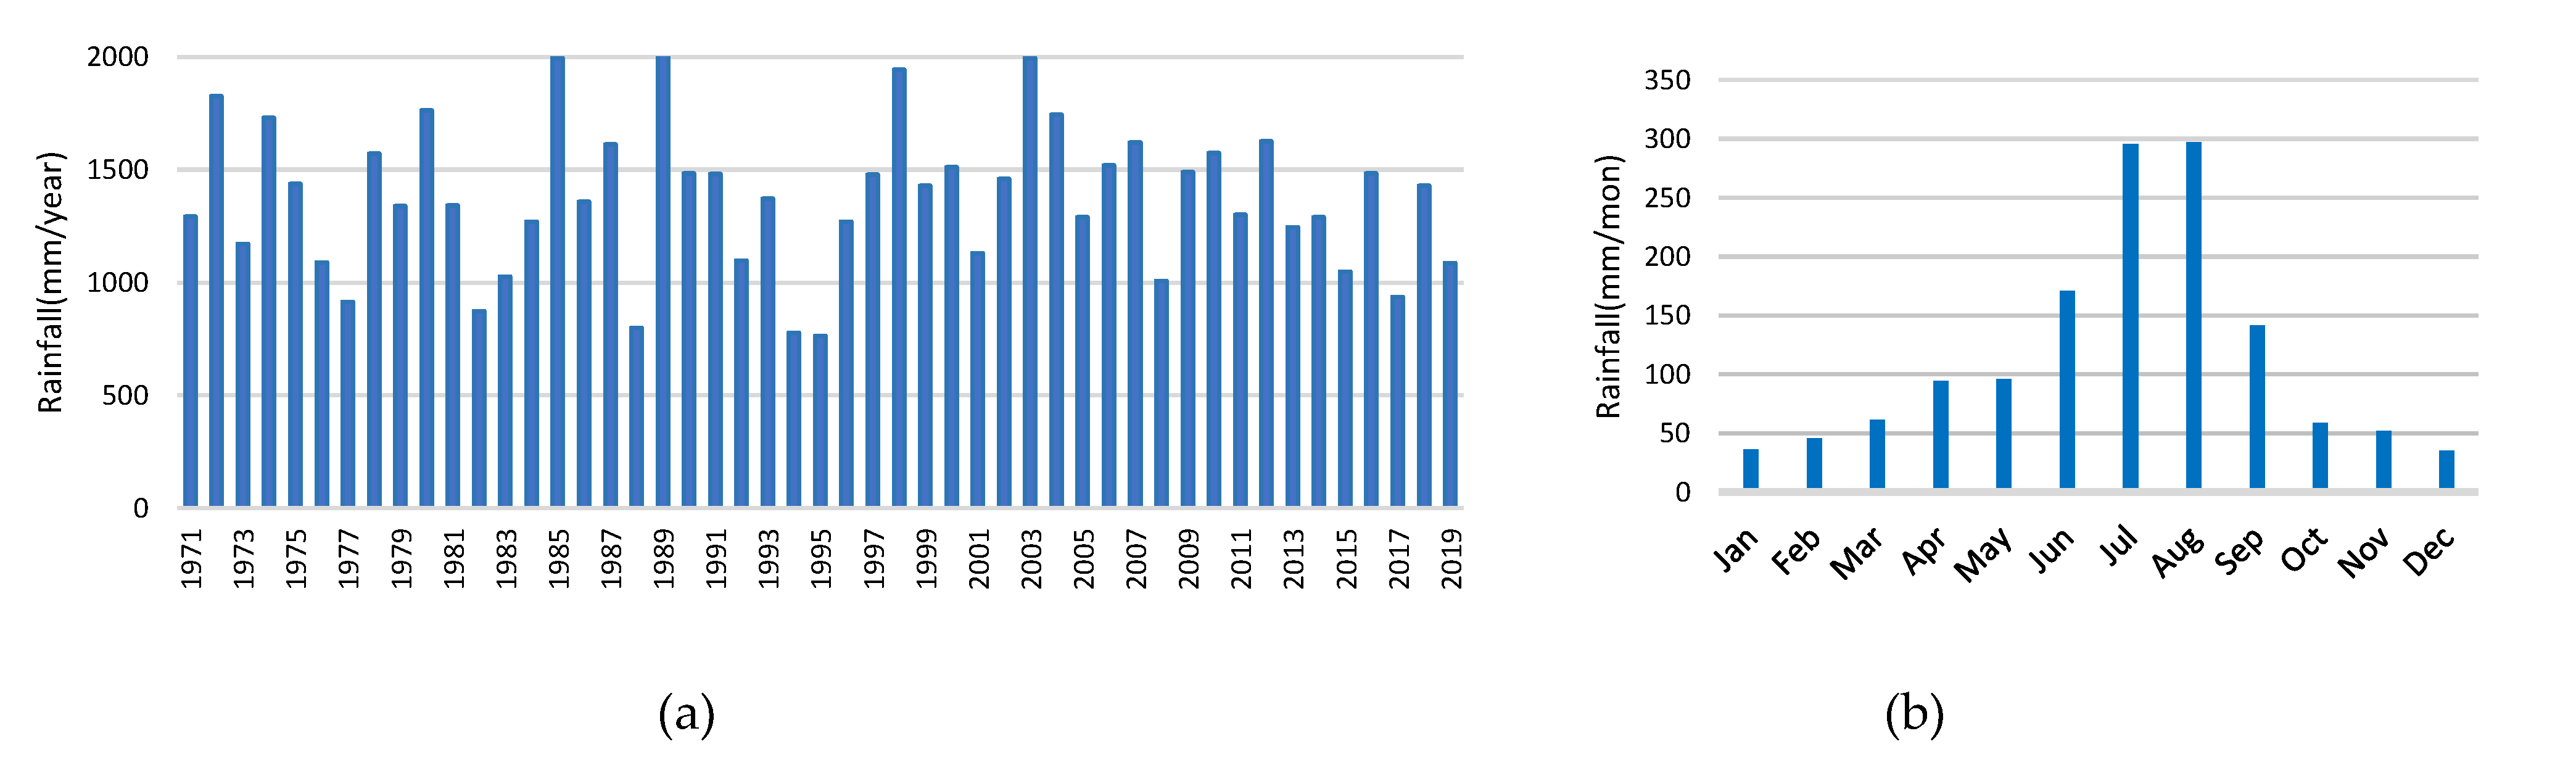
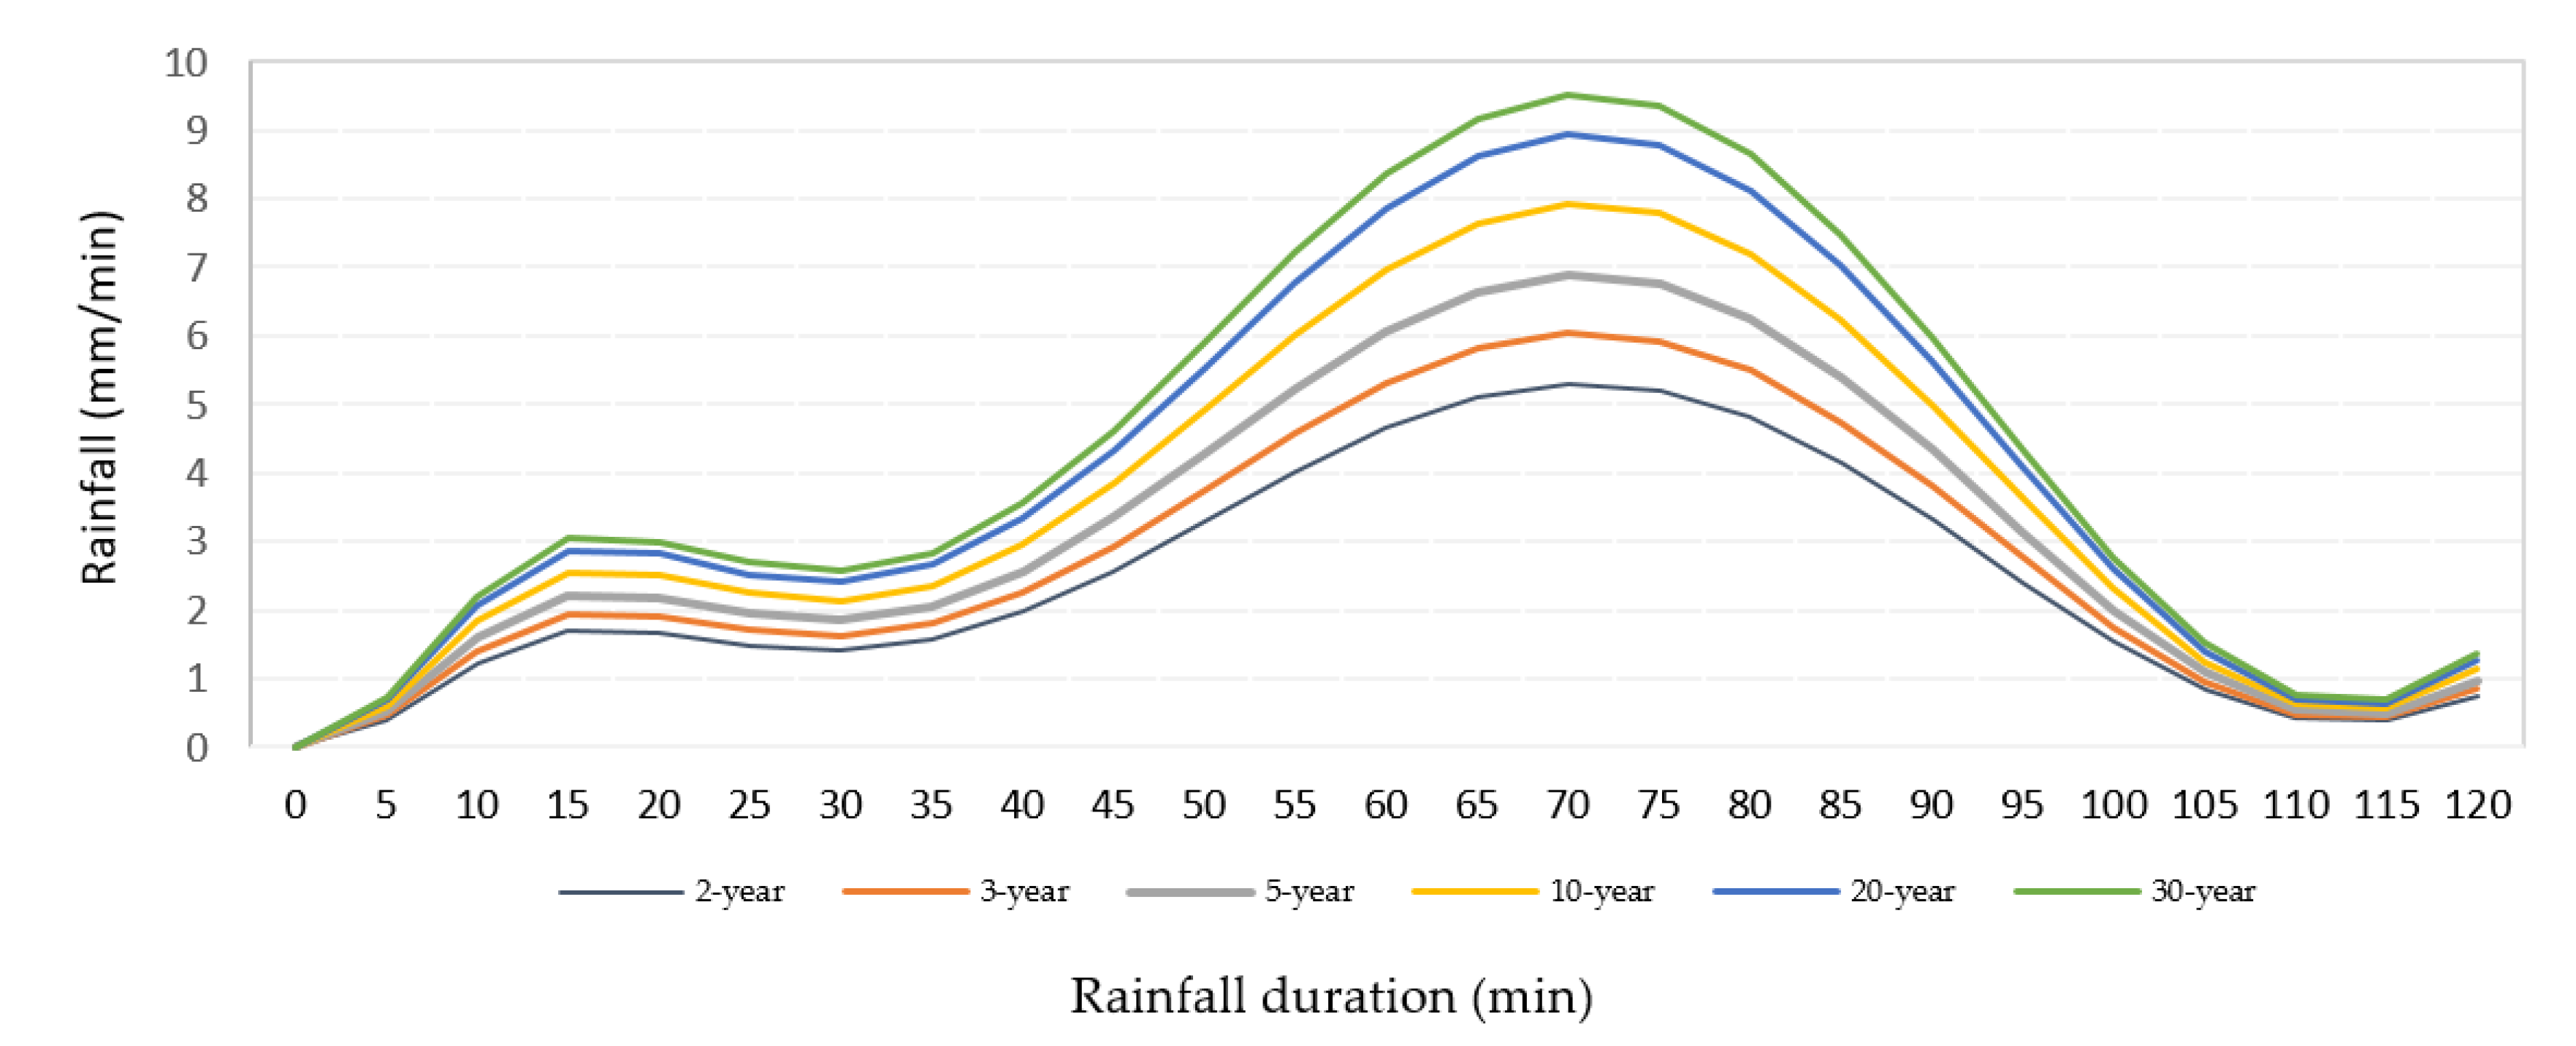
2.3. Precipitation Analysis
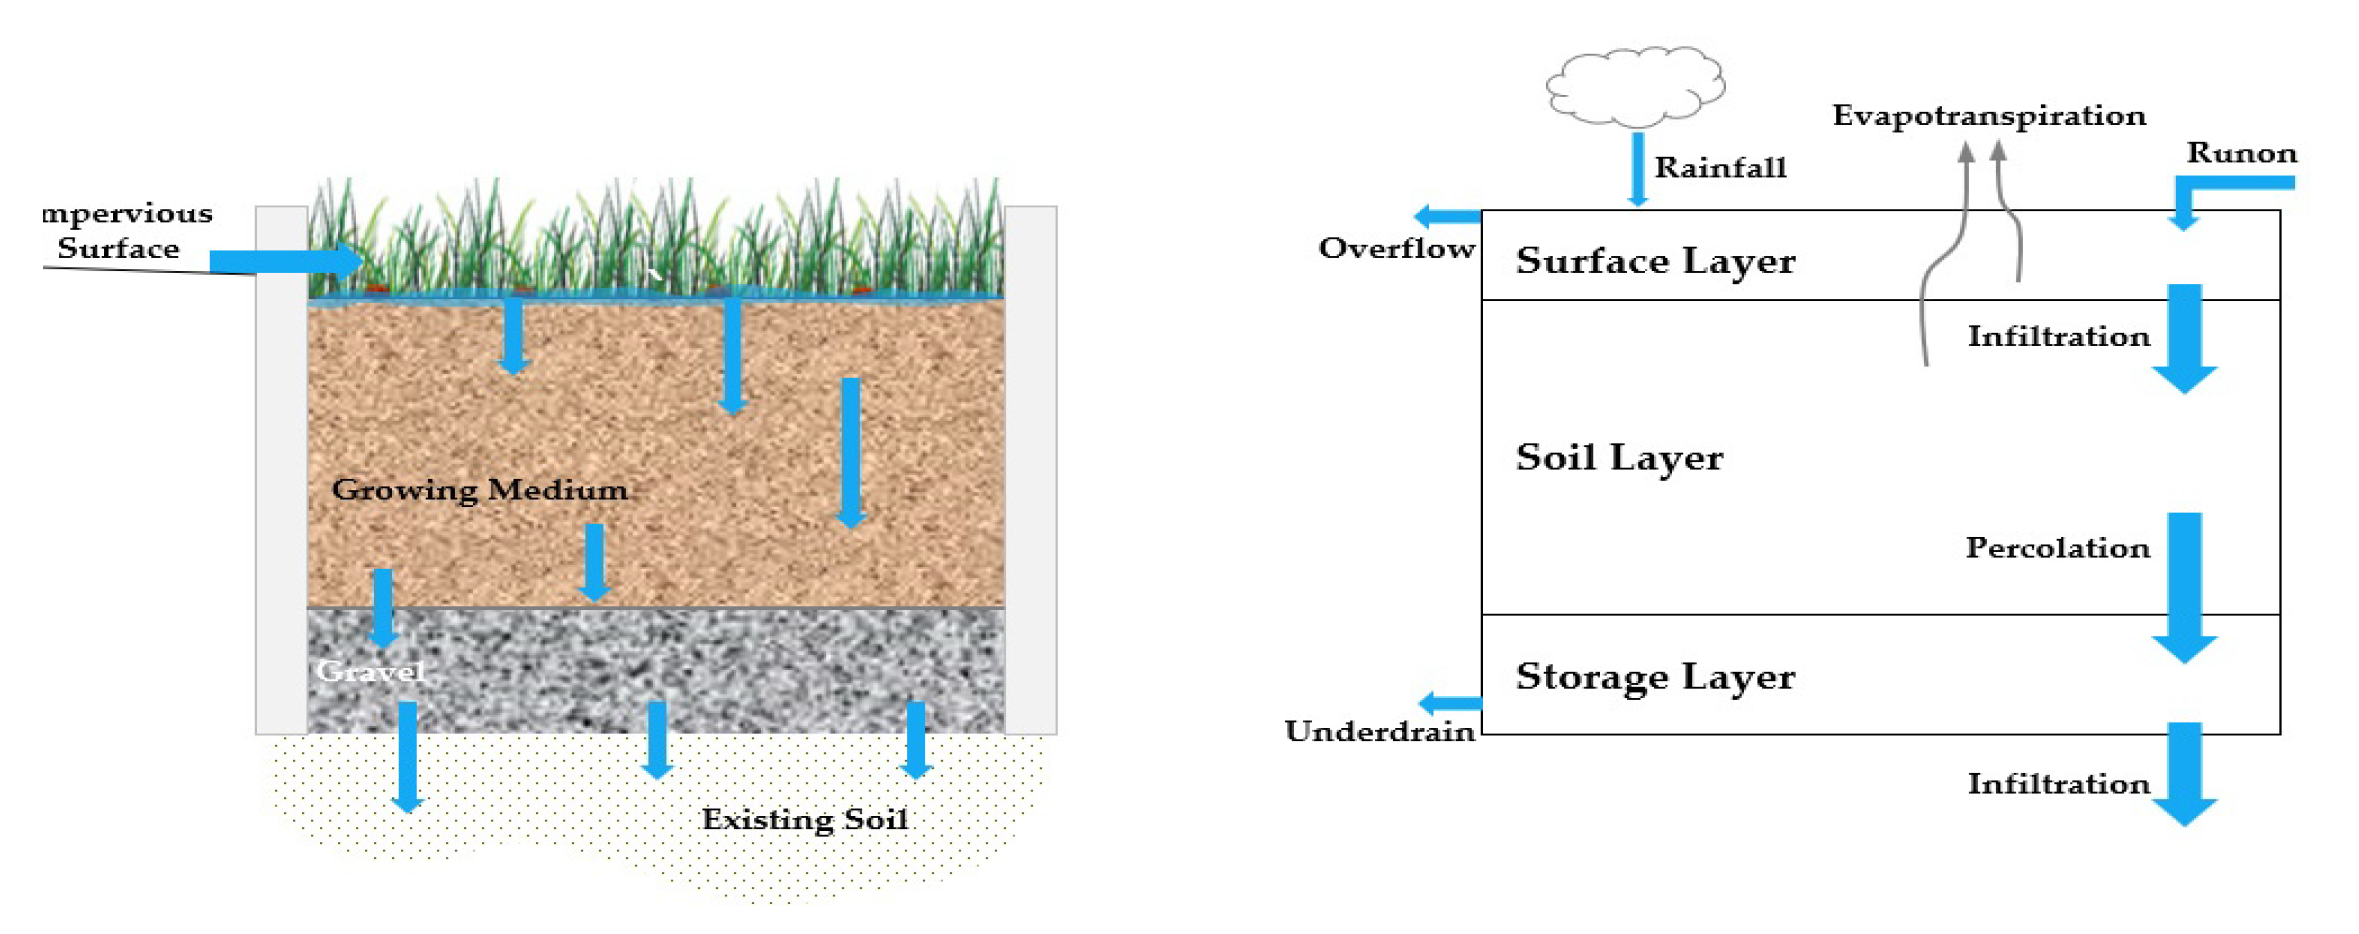
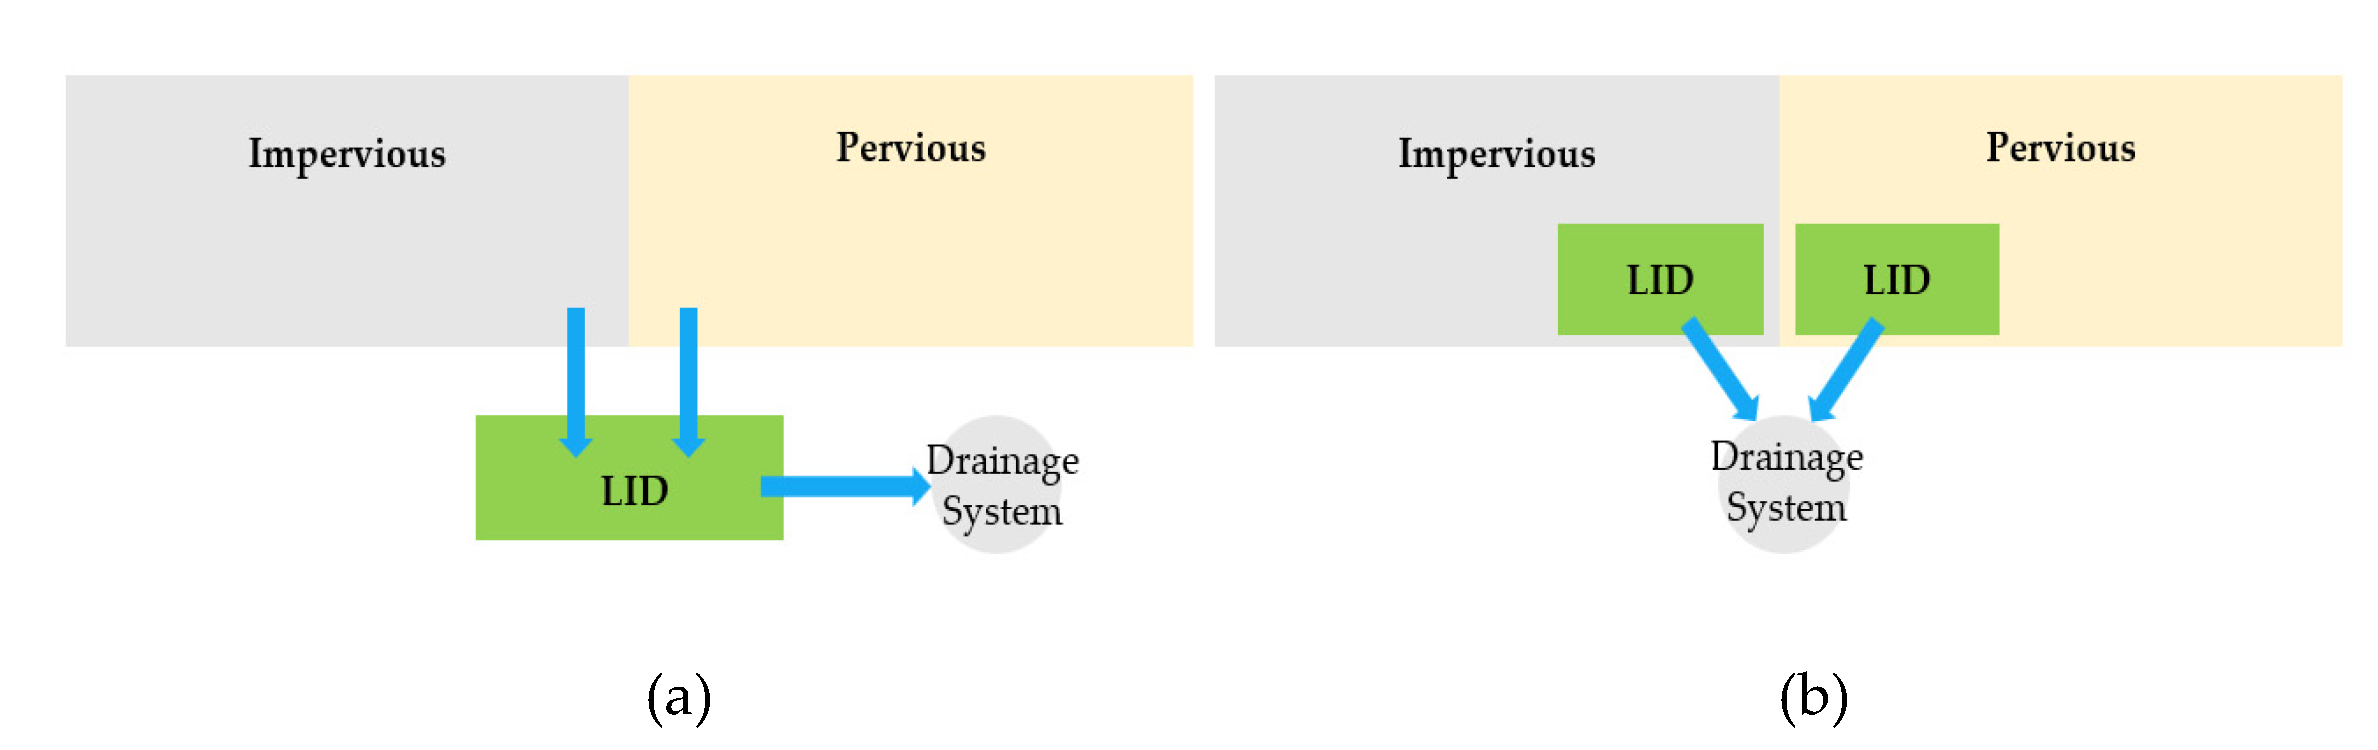
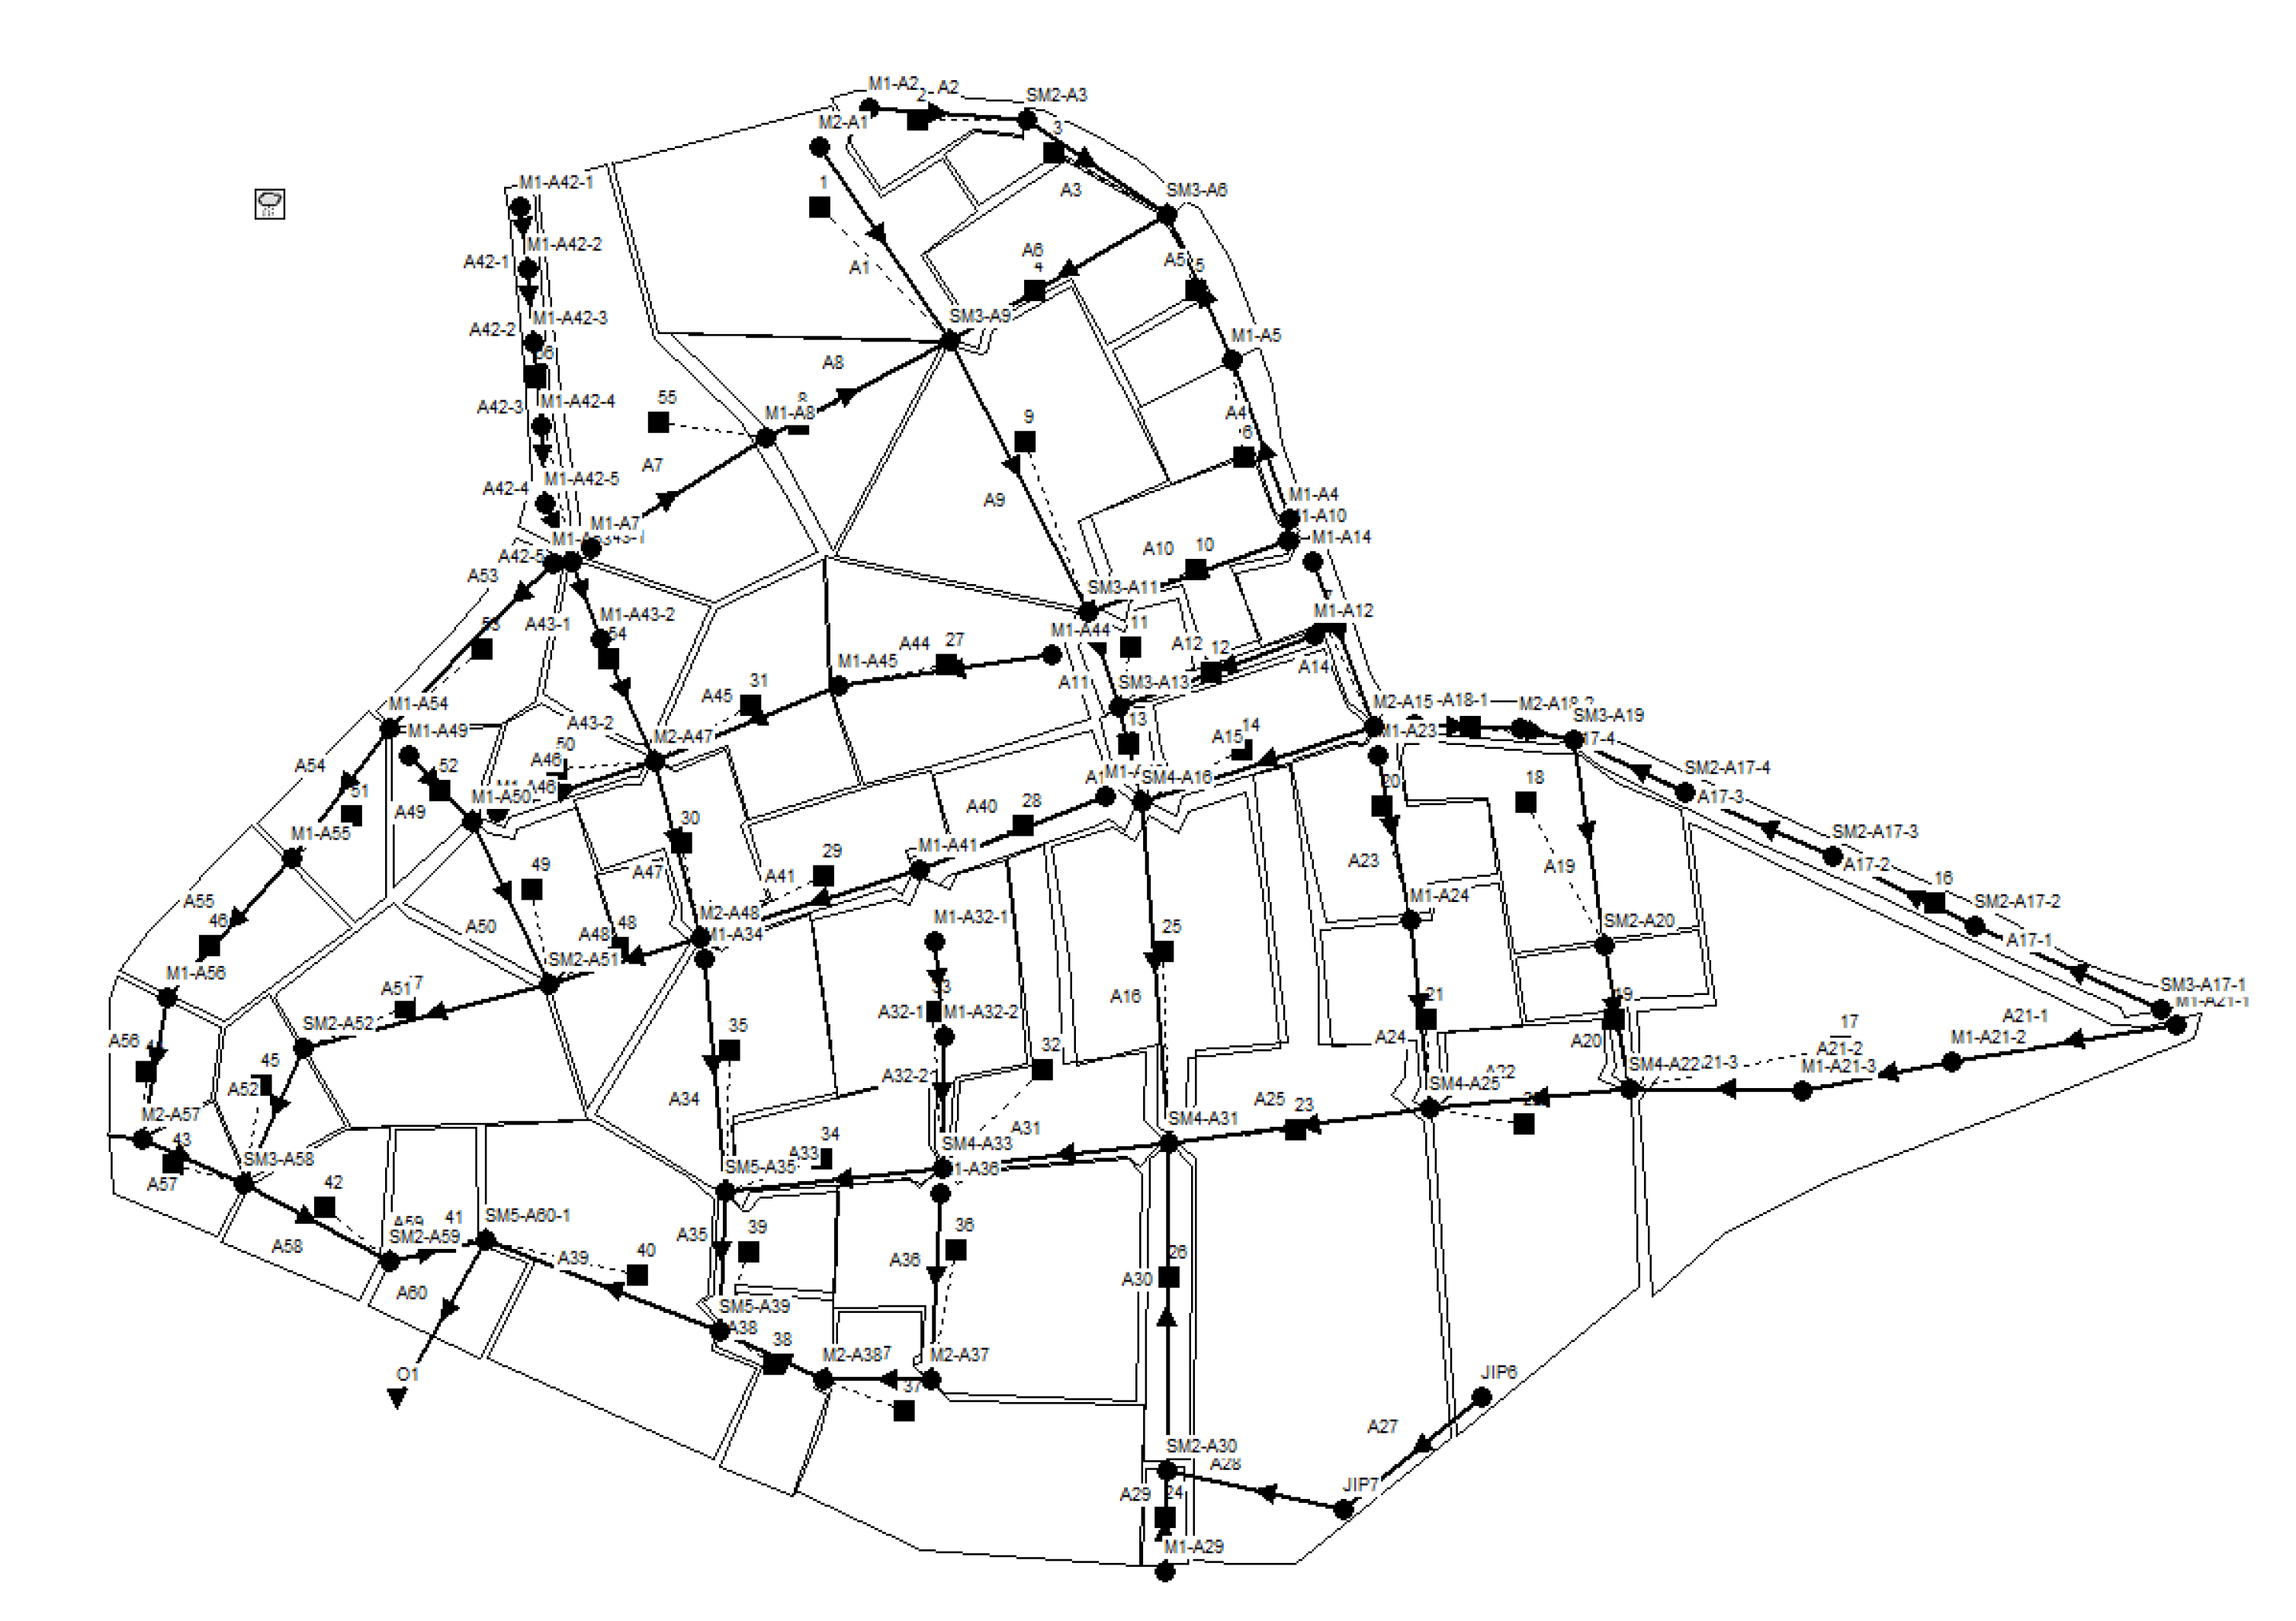
2.4. Model Construction
2.5. Management Goal
3. Results
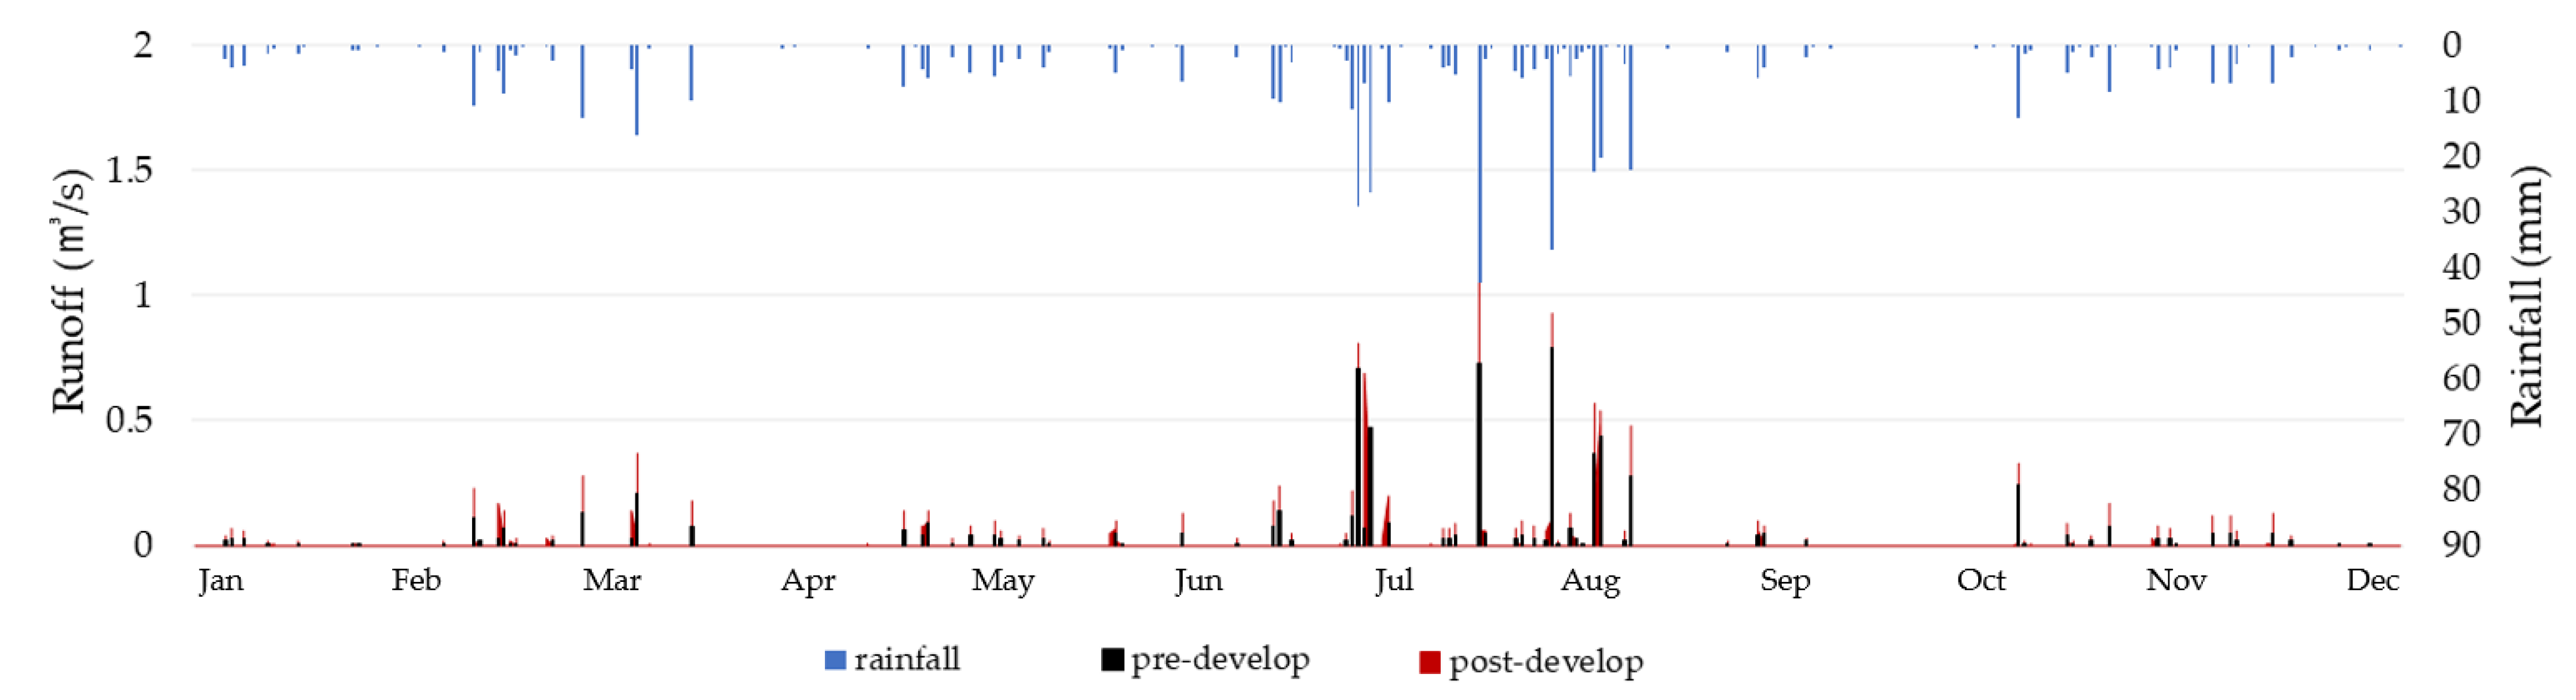
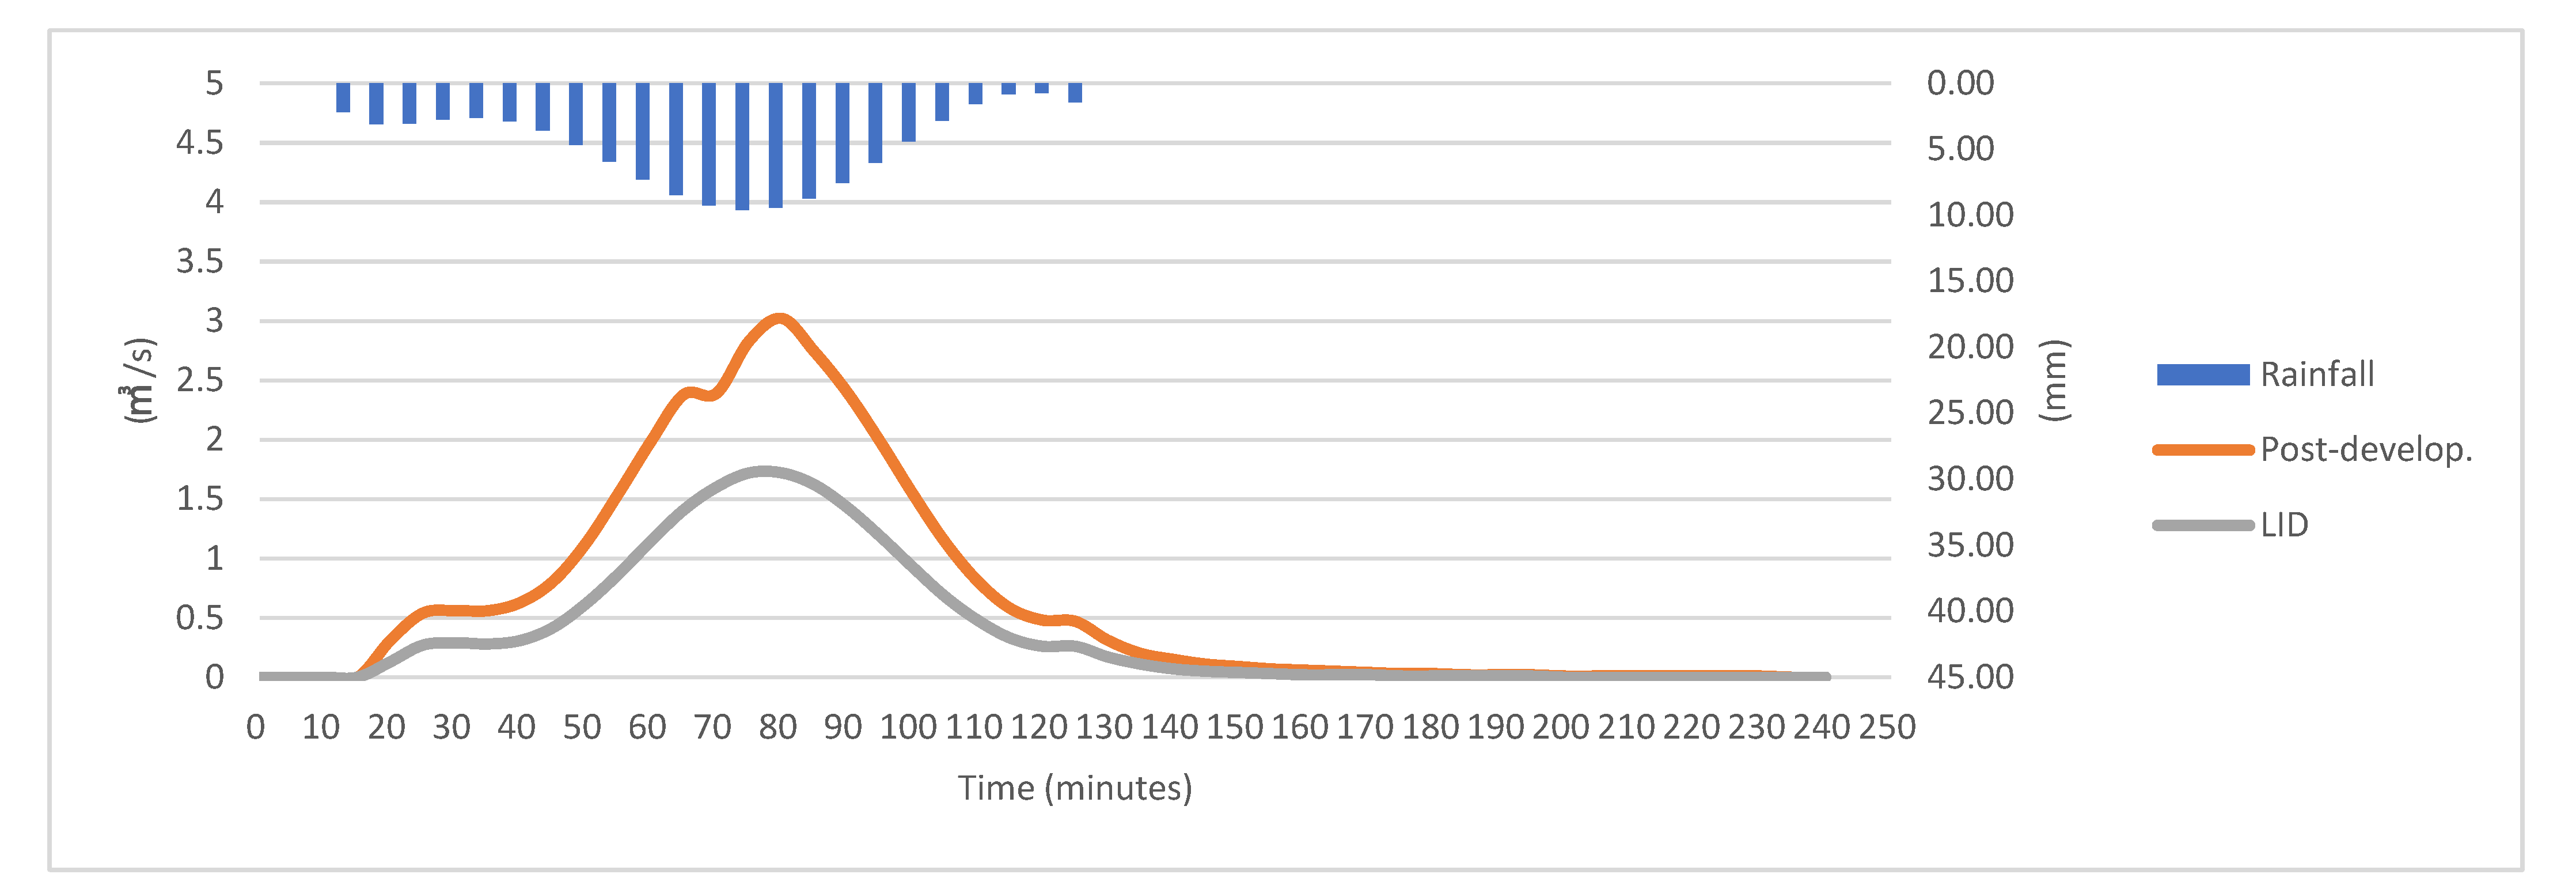
3.1. Hydrological Change
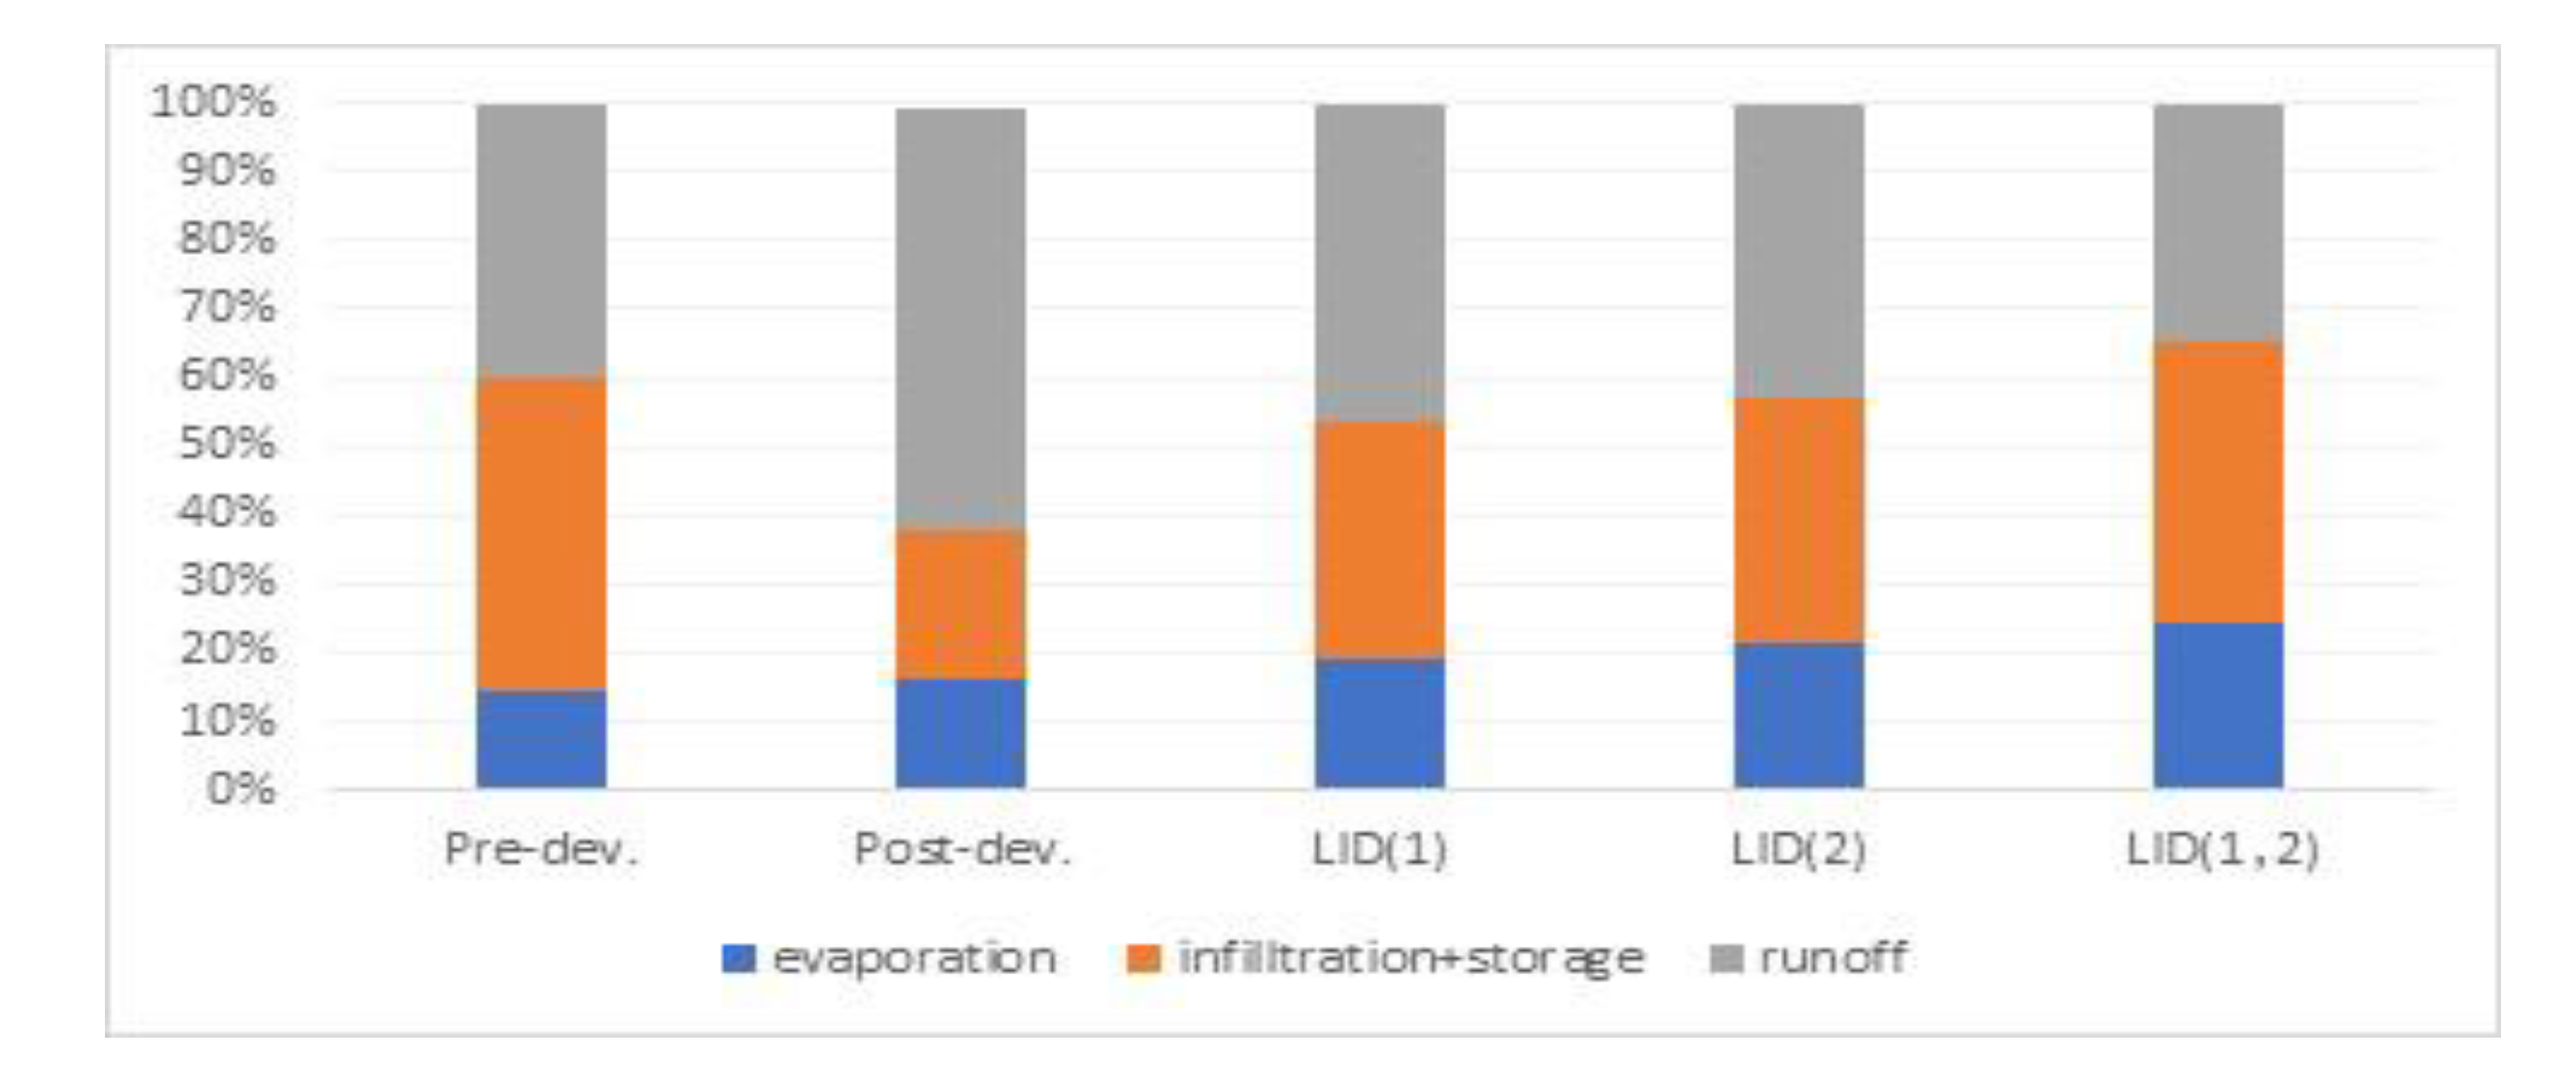
3.2. Application of LID and Effect Analysis with Respect to the Management Goals
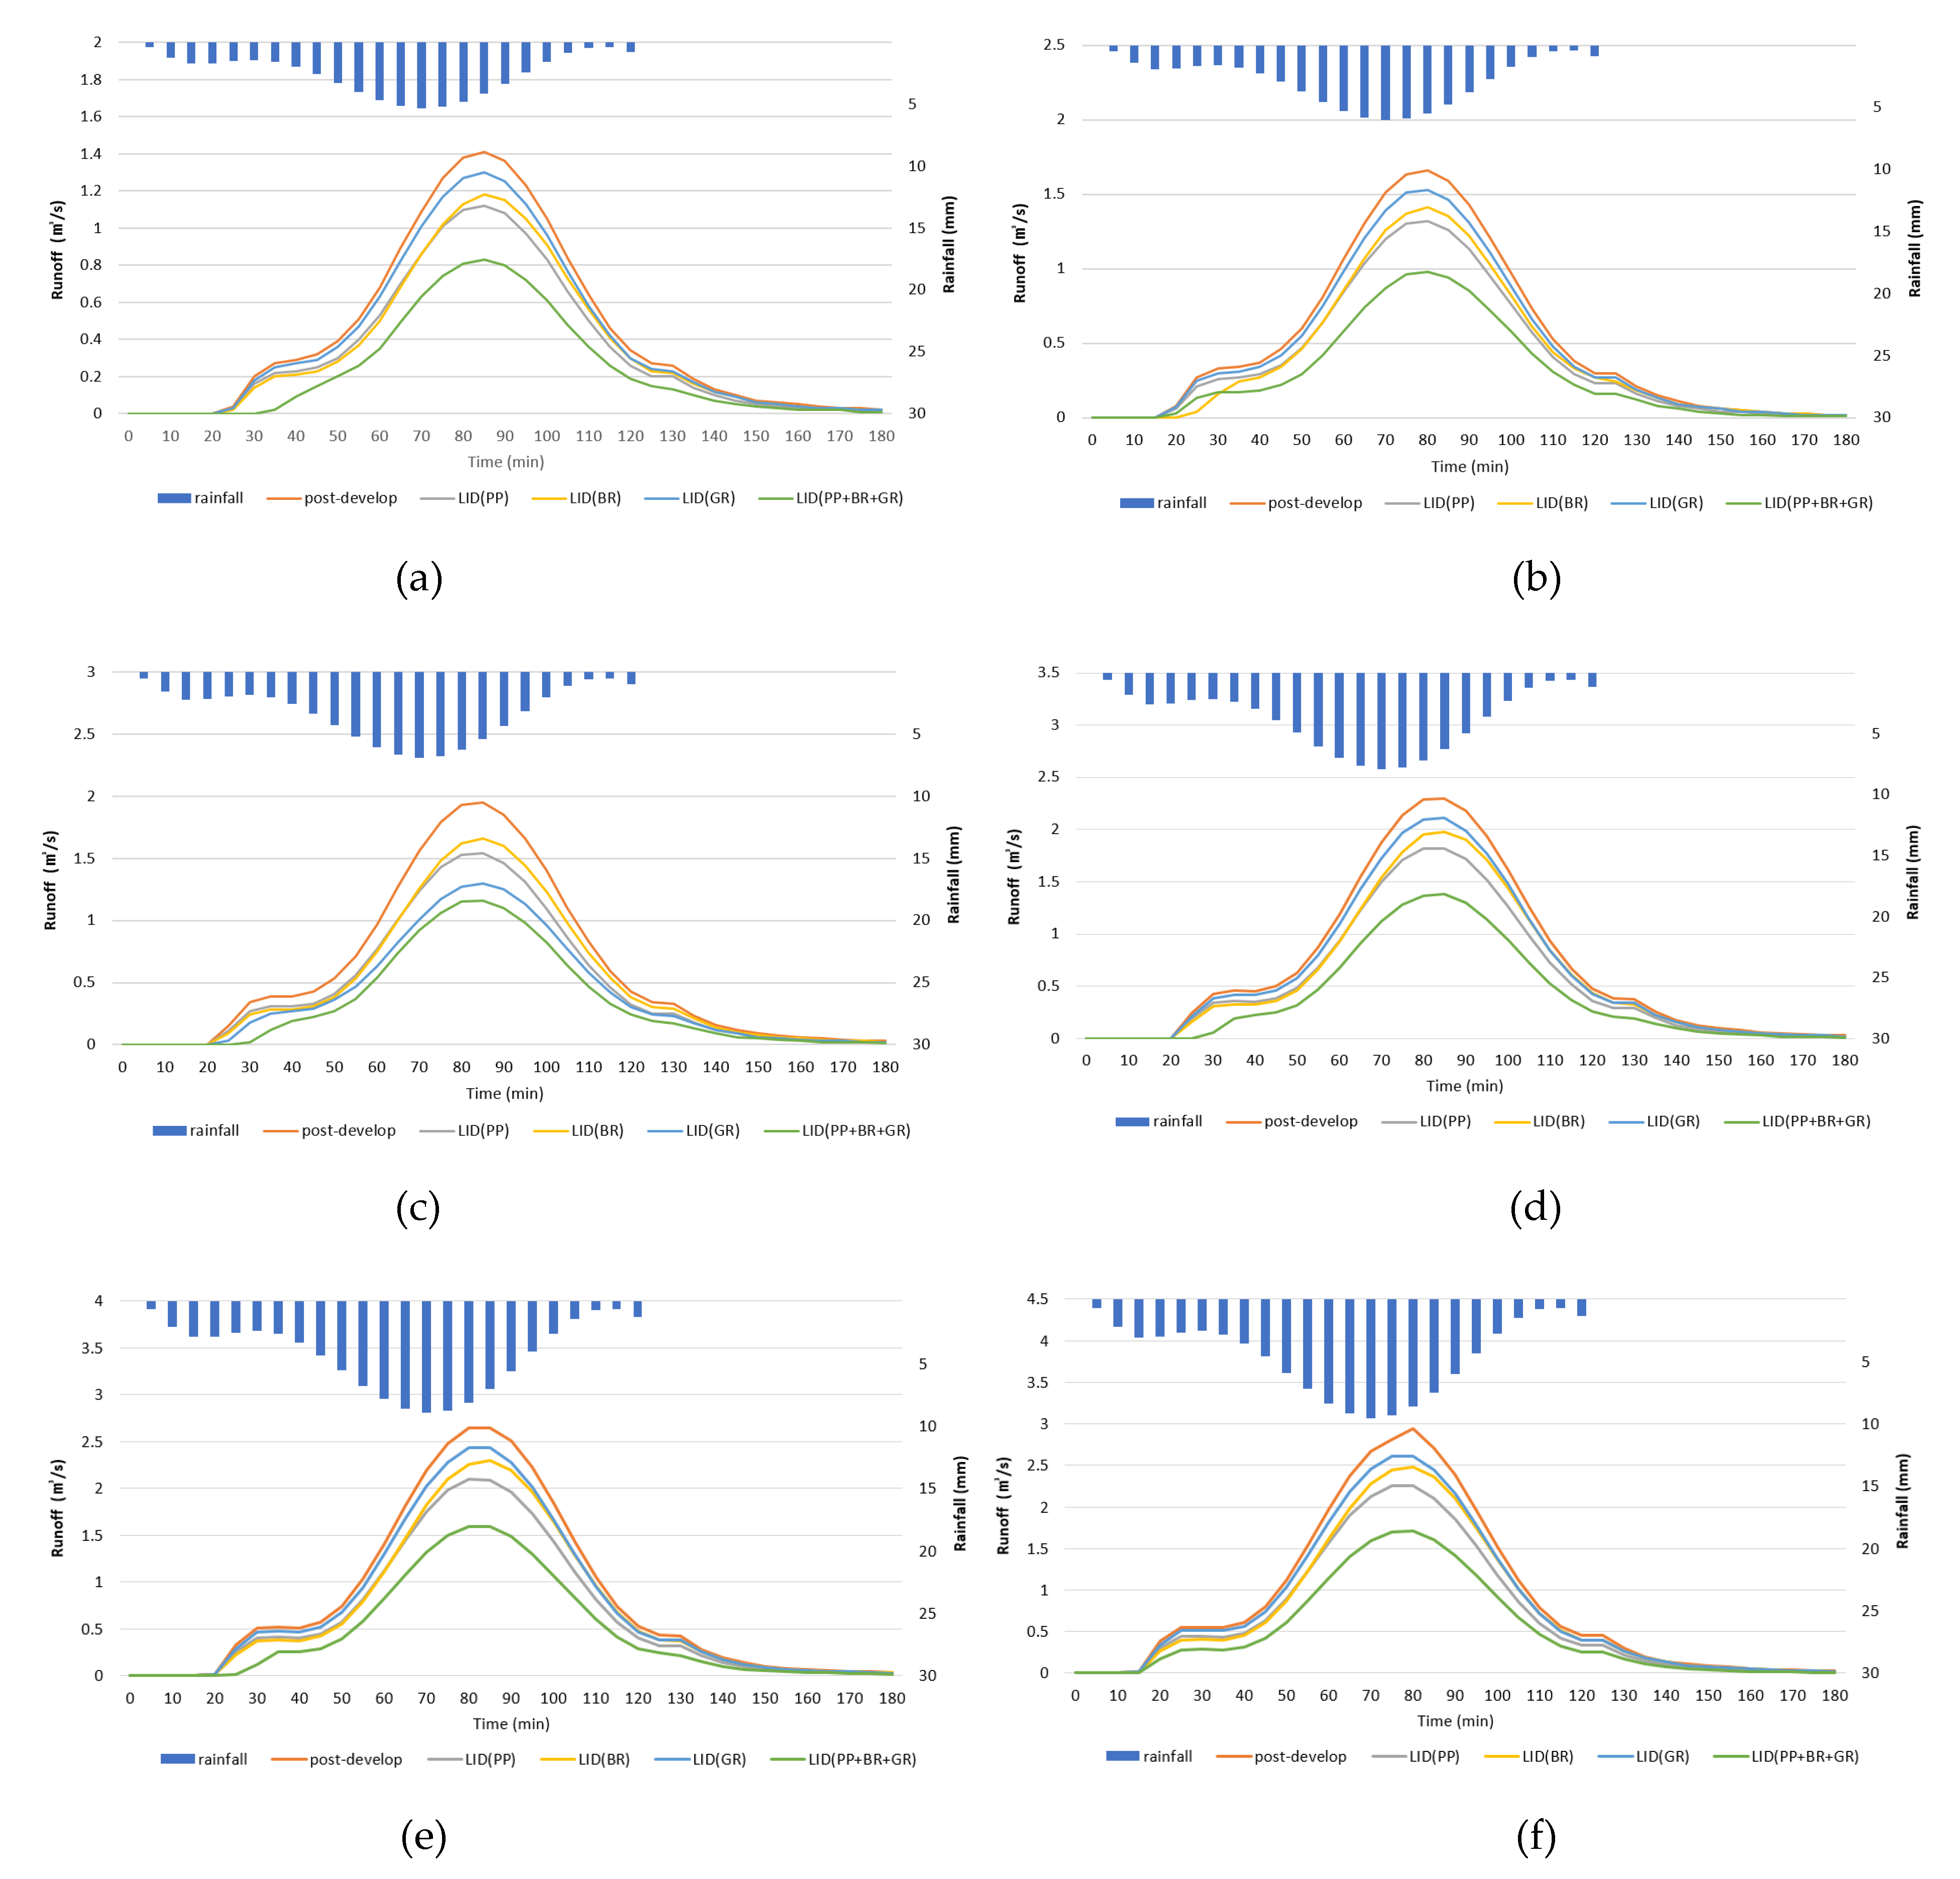
3.3. The Efficacy of LID under Various Precipitation Conditions
4. Discussion
5. Conclusions
Author Contributions
Funding
Data Availability Statement
Conflicts of Interest
References
- Fletcher, T.D.; Andrieu, H.; Hamel, P. Understanding, Management and Modelling of Urban Hydrology and Its Consequences for Receiving Waters: A State of the Art. Adv. Water Resour. 2013, 51, 261–279. [Google Scholar] [CrossRef]
- Jia, H.; Yao, H.; Tang, Y.; Yu, S.L.; Field, R.; Tafuri, A.N. LID-BMPs Planning for Urban Runoff Control and the Case Study in China. J. Environ. Manag. 2015, 149, 65–76. [Google Scholar] [CrossRef]
- United Nations. World Urbanization Prospects: The 2018 Revision; United Nations: New York, NY, USA, 2019. [Google Scholar]
- Lin, J.-Y.; Yuan, T.-C.; Chen, C. Water Retention Performance at Low-Impact Development (LID) Field Sites in Taipei, Taiwan. Sustainability 2021, 13, 759. [Google Scholar] [CrossRef]
- Shuster, W.D.; Bonta, J.; Thurston, H.; Warnemuende, E.; Smith, D.R. Impacts of Impervious Surface on Watershed Hydrology: A Review. Urban Water J. 2005, 2, 263–275. [Google Scholar] [CrossRef]
- Eckart, K.; McPhee, Z.; Bolisetti, T. Performance and Implementation of Low Impact Development—A Review. Sci. Total Environ. 2017, 607–608, 413–432. [Google Scholar] [CrossRef]
- Choi, J.; Jo, S. An Investigation and Improvement of the Impervious Area Percentage of Korea; Ministry of the Environment: Sejong-si, Korea, 2013. [Google Scholar]
- Kong, F.; Ban, Y.; Yin, H.; James, P.; Dronova, I. Modeling Stormwater Management at the City District Level in Response to Changes in Land Use and Low Impact Development. Environ. Modell. Softw. 2017, 95, 132–142. [Google Scholar] [CrossRef]
- Palla, A.; Gnecco, I.; Lanza, L. Hydrologic Restoration in the Urban Environment Using Green Roofs. Water 2010, 2, 140–154. [Google Scholar] [CrossRef]
- Zhu, Z.; Chen, X. Evaluating the Effects of Low Impact Development Practices on Urban Flooding under Different Rainfall Intensities. Water 2017, 9, 548. [Google Scholar] [CrossRef]
- Palla, A.; Gnecco, I.; La Barbera, P. Assessing the Hydrologic Performance of a Green Roof Retrofitting Scenario for a Small Urban Catchment. Water 2018, 10, 1052. [Google Scholar] [CrossRef] [Green Version]
- Palla, A.; Gnecco, I. Hydrologic Modeling of Low Impact Development Systems at the Urban Catchment Scale. J. Hydrol. 2015, 528, 361–368. [Google Scholar] [CrossRef]
- Joksimovic, D.; Alam, Z. Cost Efficiency of Low Impact Development (LID) Stormwater Management Practices. Procedia Eng. 2014, 89, 734–741. [Google Scholar] [CrossRef] [Green Version]
- Rossman, L.A. Modeling Low Impact Development Alternatives with SWMM. J. Water Manag. Model. 2010, R236-11. [Google Scholar] [CrossRef] [Green Version]
- Cipolla, S.S.; Maglionico, M.; Stojkov, I. A Long-Term Hydrological Modelling of an Extensive Green Roof by Means of SWMM. Ecol. Eng. 2016, 95, 876–887. [Google Scholar] [CrossRef]
- Li, J.; Li, Y.; Li, Y. SWMM-Based Evaluation of the Effect of Rain Gardens on Urbanized Areas. Environ. Earth Sci. 2016, 75, 17. [Google Scholar] [CrossRef]
- Xie, J.; Wu, C.; Li, H.; Chen, G. Study on Storm-Water Management of Grassed Swales and Permeable Pavement Based on SWMM. Water 2017, 9, 840. [Google Scholar] [CrossRef] [Green Version]
- K-water. Environmental Impact Assessment Report for Naju-Noan Waterfront Zone Construction Project; 2012. [Google Scholar]
- Niazi, M.; Nietch, C.; Maghrebi, M.; Jackson, N.; Bennett, B.R.; Tryby, M.; Massoudieh, A. Storm Water Management Model: Performance Review and Gap Analysis. J. Sustain. Water Built Environ. 2017, 3, 04017002. [Google Scholar] [CrossRef] [Green Version]
- Metcalf and Eddy. Storm Water Management Model. Univ. of Florida, Water Resources Engineers, U.S.; EPA, US Government Printing Office: Washington, DC, USA, 1971. [Google Scholar]
- Rossman, L.A. Storm Water Management Model User’s Manual Version 5.1; Environmental Protection Agency: Washington, DC, USA, 2015. [Google Scholar]
- Rossman, L.A. Storm Water Management Model Reference Manual; Water Quality, Environmental Protection Agency: Washington, DC, USA, 2016; Volume III. [Google Scholar]
- McCutcheon, M.; Wride, D. Shades of Green: Using SWMM LID Controls to Simulate Green Infrastructure. J. Water Manag. Model. 2013, R246-15. [Google Scholar] [CrossRef] [Green Version]
- McCutcheon, M.; Wride, D.; Reinicke, J. An Evaluation of Modeling Green Infrastructure Using LID Controls. J. Water Manag. Model. 2012, R245-12. [Google Scholar] [CrossRef] [Green Version]
- The Ministry of Land, Transport and Maritime Affairs. Methods for Calculating the Amount of Design Flood; The Ministry of Land, Transport and Maritime Affairs: Seoul, Korea, 2012. [Google Scholar]
- Bae, K.; Ahn, J.; Choi, Y.; Kim, B.; Yi, J. Analysis of the Improved Drainage Capacity of Urban Basins at a LID Facility. J. Korean Soc. Hazard Mitig. 2019, 19, 311–322. [Google Scholar] [CrossRef]
- Hwang, S.; Ham, D.; Lee, D. Improvement and Supplement of Probability Rainfall in South Korea. In Proceedings of the Korea Water Resources Association Conference, Korea, 16 May 2012. [Google Scholar]
- Ministry of the Environment. Standard Guidelines for Estimating Flood Volume; Ministry of the Environment: Sejong-si, Korea, 2019. [Google Scholar]
- Bai, Y.; Zhao, N.; Zhang, R.; Zeng, X. Storm Water Management of Low Impact Development in Urban Areas Based on SWMM. Water 2019, 11, 33. [Google Scholar] [CrossRef] [Green Version]
- Ministry of the Environment. Design Guidelines for Low Impact Development (LID) Techniques; Ministry of the Environment: Sejong-si, Korea, 2016. [Google Scholar]
- Park, J.; Lim, H.; Lee, H.; Yoon, Y.; Oh, H.; Water, W.-J.K. Balance and Pollutant Load Analysis According to LID Techniques for a Town Development. J. Korean Soc. Environ. Eng. 2013, 35, 795–802. [Google Scholar] [CrossRef]
- K-water. Disaster Impact Assessment Report for Naju-Noan Waterfront Zone Construction Project; 2020. [Google Scholar]
- Korea Land & Housing Corporation. A Study on Introduction Plan of Low Impact Development Techniques in Multifunctional Administrative City (MAC)(I); Korea Land & Housing Corporation: Jinju-si, Korea, 2017. [Google Scholar]
- The Korean Law Information Center. Available online: https://www.law.go.kr/LSW/eng/engLsSc.do?menuId=2§ion=lawNm&query=water+front&x=33&y=38 (accessed on 22 September 2021).


| Before Development (m², %) | Rice Paddy Field | Crop Field | Coniferous Forest | Traffic Area | Residential Area | ||||
| 60,618 (57.4) | 27,358 (25.9) | 13,463 (12.8) | 3552 (3.4) | 503 (0.5) | |||||
| After Development (m², %) | Houses | Roads | Green | Accommodations | Cultural District | Parks | Malls in Residential Complex | Parking Lot | Other |
| 37,835 (35.9) | 22,248 (21.1) | 10,700 (10.1) | 10,554 (10.0) | 8403 (8.0) | 7285 (6.9) | 6140 (5.8) | 1296 (1.2) | 1033 (1.0) | |
| Name of Station | Method of Observation | Address | North Latitude | East Longitude | Elevation (EL. m) | Date of Observation |
|---|---|---|---|---|---|---|
| Gwangju | T/M | Unam-dong, Buk-gu, Gwangju | 126-53-29 | 35-10-22 | 0.6 | 1 May 1939 |
| Return Periods (Year) | Duration (h) and Design Rainfalls (mm) | |||||||||
|---|---|---|---|---|---|---|---|---|---|---|
| 1 h | 2 h | 3 h | 5 h | 6 h | 9 h | 12 h | 15 h | 20 h | 24 h | |
| 2 | 44.3 | 60.2 | 69.2 | 84.1 | 90.5 | 104.6 | 114.2 | 121.1 | 130.8 | 139.6 |
| 3 | 50.1 | 68.7 | 79.7 | 97.4 | 105.0 | 122.3 | 133.6 | 142.3 | 153.9 | 164.5 |
| 5 | 56.5 | 78.3 | 91.4 | 112.1 | 121.1 | 142.0 | 155.3 | 165.9 | 179.7 | 192.2 |
| 10 | 64.7 | 90.2 | 106.1 | 130.7 | 141.5 | 166.8 | 182.4 | 195.5 | 212.0 | 226.9 |
| 20 | 72.5 | 101.7 | 120.2 | 148.5 | 160.9 | 190.6 | 208.5 | 224.0 | 243.1 | 260.3 |
| 30 | 77.0 | 108.3 | 128.3 | 158.7 | 172.1 | 204.3 | 223.5 | 240.3 | 260.9 | 279.5 |
| 50 | 82.6 | 116.5 | 138.5 | 171.5 | 186.1 | 221.4 | 242.3 | 260.8 | 283.2 | 303.5 |
| 100 | 90.1 | 127.6 | 152.2 | 188.8 | 205.0 | 244.4 | 267.6 | 288.4 | 313.3 | 335.8 |
| Month | Jan | Feb | Mar | Apr | May | Jun | Jul | Aug | Sep | Oct | Nov | Dec |
|---|---|---|---|---|---|---|---|---|---|---|---|---|
| Evaporation (mm/mon) | 39.6 | 47.4 | 84.0 | 121.8 | 146.8 | 143.7 | 130.4 | 143.6 | 107.0 | 92.7 | 54.1 | 41.3 |
| Land Use | Type | Comprehensive Runoff Coefficient |
|---|---|---|
| built central area | Densely | 0.6–0.8 |
| built residential area | 0.5–0.7 | |
| Sparsely | 0.4–0.6 | |
| populated area | 0.3–0.5 |
| Constituent | Total | Permeable Pavement | Bioswale | Rainwater Garden | Planter Box | Green Roof |
|---|---|---|---|---|---|---|
| Area (m²) | 38,189 | 22,946 | 3589 | 1634 | 543 | 9459 |
| Area percentage (%) | 36.2 | 21.8 | 3.4 | 1.5 | 0.5 | 9.0 |
| SWMM-LID method | - | Permeable pavement | Bioretention cell | Bioretention cell | Bioretention cell | Green roof |
| Layer | Parameter | Unit | Permeable Pavement | Bioswale | Rainwater Garden | Planter Box | Green Roof |
|---|---|---|---|---|---|---|---|
| Surface | Berm Height | mm | 200 | 300 | 300 | 0 | |
| Vegetation Volume Fraction | - | 0.1 | 0.2 | 0.1 | 0.2 | ||
| Surface Roughness (Manning’s n) | - | 0.014 | 0.15 | 0.24 | 0.15 | 0.41 | |
| Surface Slope | % | 1.5 | 1.0 | 1.0 | 1.0 | 0.5 | |
| Pavement | Thickness | mm | 60 | - | - | - | - |
| Void Ratio | - | 0.2 | - | - | - | - | |
| Permeability | mm/hr | 3600 | - | - | - | - | |
| Soil | Thickness | mm | 40 | 500 | 500 | 500 | 300 |
| Porosity | - | 0.35 | 0.52 | 0.8 | 0.52 | 0.6 | |
| Storage | Thickness | mm | 300 | 500 | 500 | 1000 | - |
| Void Ratio | - | 0.4 | 0.4 | 0.4 | 0.4 | - | |
| Drain | Flow Coefficient | - | - | 0 | 0 | 0 | - |
| Flow Exponent | - | - | 0.5 | 0.5 | 0.5 | - | |
| Offset | mm | - | 6 | 6 | 6 | - | |
| Drainage Mat | Thickness | mm | - | - | - | - | 50 |
| Void Fraction | - | - | - | - | - | 0.5 | |
| Roughness | - | - | - | - | - | 0.3 |
| Time Step (min) | 2-Year | 3-Year | 5-Year | 10-Year | 20-Year | 30-Year |
|---|---|---|---|---|---|---|
| 0 | 0.00 | 0.00 | 0.00 | 0.00 | 0.00 | 0.00 |
| 10 | 1.62 | 1.85 | 2.11 | 2.43 | 2.74 | 2.93 |
| 20 | 3.37 | 3.84 | 4.38 | 5.05 | 5.69 | 6.06 |
| 30 | 2.91 | 3.32 | 3.79 | 4.37 | 4.92 | 5.25 |
| 40 | 3.54 | 4.05 | 4.61 | 5.31 | 5.99 | 6.38 |
| 50 | 5.86 | 6.68 | 7.62 | 8.77 | 9.89 | 10.53 |
| 60 | 8.67 | 9.89 | 11.27 | 12.99 | 14.64 | 15.59 |
| 70 | 10.40 | 11.86 | 13.53 | 15.57 | 17.57 | 18.70 |
| 80 | 10.01 | 11.42 | 13.01 | 14.99 | 16.90 | 17.98 |
| 90 | 7.49 | 8.55 | 9.73 | 11.22 | 12.64 | 13.45 |
| 100 | 3.95 | 4.52 | 5.14 | 5.92 | 6.68 | 7.11 |
| 110 | 1.25 | 1.43 | 1.64 | 1.88 | 2.12 | 2.27 |
| 120 | 1.13 | 1.29 | 1.47 | 1.70 | 1.92 | 2.05 |
| Pre or Post | Rainfall (m³) | Evaporation (m³, %) | Infiltration (m³, %) | Runoff (m³, %) | Peak Runoff (m³/s) |
|---|---|---|---|---|---|
| (1) Pre- Development | 144,748 (100.0 %) | 20,459 (14.1%) | 67,342 (46.5%) | 56,947 (39.4%) | 0.77 |
| (2) Post- Development | 23,354 (16.1%) | 31,162 (21.5%) | 90,232 (62.4%) | 1.08 | |
| Difference (2) − (1) | - | 2895 (1.9%) | 36,180 (25.0%) | 33,285 (23.1%) | 0.31 |
| Public Land Use Roads, Greens, Parks, Parking Lot, etc. | Private Land Use Houses, Accommodations, Malls in Residential Complexes, etc. | ||||
|---|---|---|---|---|---|
| Total area: 42,062 m² | Total area: 63,432 m² | ||||
| LID-applied area (10,294 m², 24.5%) | LID-applied area (27,895 m², 44.0%) | ||||
| Permeable pavement | Bioswale | Rainwater garden | Permeable pavement | Planter box | Green roof |
| 5071 m² (12.1%) | 3589 m² (8.5%) | 1634 m² (3.9%) | 17,893 m² (28.2%) | 543 m² (0.9%) | 9459 m² (14.9%) |
| Constituent | Rainfall (m³) | Evaporation (m³, %) | Infiltration + Storage (m³, %) | Runoff (m³, %) | Peak Runoff (m³/s) |
|---|---|---|---|---|---|
| Pre- development | 144,748 | 20,459 (14.1%) | 67,342 (46.5%) | 56,947 (39.4%) | 0.77 |
| Post- development | 23,354 (16.1%) | 31,162 (21.5%) | 90,232 (62.4%) | 1.08 | |
| LID(1) (public) | 27,968 (19.3%) | 49,748 (34.4%) | 67,032 (46.3%) | 0.88 | |
| LID(2) (private) | 31,313 (21.6%) | 51,407 (35.5%) | 62,028 (42.9%) | 0.91 | |
| LID(1,2) (public, private) | 35,292 (24.4%) | 59,249 (40.9%) | 50,207 (34.7%) | 0.78 |
| Constituent | Total | Permeable Pavement (PP) | Bioretention (BR) | Green Roofs (GR) |
|---|---|---|---|---|
| Area (m²) | 38,189 | 22,964 | 5766 | 9459 |
| Area percentage (%) | 36.2 | 21.8 | 5.4 | 9.0 |
| Simulation Item | 2-Year Period | 3-Year Period | 5-Year Period | |||||||||
|---|---|---|---|---|---|---|---|---|---|---|---|---|
| Rainfall (m³) | Runoff (m³, %) | Peak Flow (m³/s, %) | Peak Flow Occurrence Time (min) | Rainfall (m³) | Runoff (m³, %) | Peak Flow (m³/s, %) | Peak Flow Occurrence Time (min) | Rainfall (m³) | Runoff (m³, %) | Peak Flow (m³/s, %) | Peak Flow Occurrence Time (min) | |
| Post- development | 6351 | 4810 ( - ) | 1.42 | 83 | 7247 | 5640 ( - ) | 1.67 | 82 | 8260 | 6580 ( - ) | 1.97 | 82 |
| LID(PP) | 3770 (21.6) | 1.13 (20.3) | 83 | 4420 (21.6) | 1.33 (20.4) | 82 | 5160 (21.6) | 1.56 (20.6) | 82 | |||
| LID(BR) | 3930 (18.3) | 1.18 (16.8) | 87 | 4650 (17.6) | 1.41 (15.9) | 87 | 5490 (16.6) | 1.67 (15.2) | 83 | |||
| LID(GR) | 4400 (8.5) | 1.31 (7.8) | 83 | 5160 (8.5) | 1.54 (7.9) | 82 | 6020 (8.5) | 1.81 (8.1) | 82 | |||
| LID (PP+BR+GR) | 2690 (44.1) | 0.83 (41.3) | 87 | 3180 (43.6) | 0.99 (41.0) | 87 | 3740 (43.2) | 1.16 (40.9) | 83 | |||
| Simulation Item | 10-Year Period | 20-Year Period | 30-Year Period | |||||||||
| Rainfall (m³) | Runoff (m³, %) | Peak Flow (m³/s, %) | Peak Flow Occurrence Time (min) | Rainfall (m³) | Runoff (m³, %) | Peak Flow (m³/s, %) | Peak Flow Occurrence Time (min) | Rainfall (m³) | Runoff (m³, %) | Peak Flow (m³/s, %) | Peak Flow Occurrence Time (min) | |
| Post- development | 9516 | 7780 ( - ) | 2.33 | 82 | 10,729 | 8940 ( - ) | 2.69 | 82 | 11,425 | 9600 ( - ) | 3.07 | 82 |
| LID(PP) | 6090 (21.7) | 1.85 (20.7) | 82 | 6990 (21.8) | 2.13 (20.7) | 82 | 7520 (21.7) | 2.29 (25.3) | 82 | |||
| LID(BR) | 6530 (16.1) | 2.00 (14.4) | 82 | 7560 (15.4) | 2.32 (13.8) | 82 | 8150 (15.1) | 2.50 (18.4) | 82 | |||
| LID(GR) | 7100 (8.7) | 2.14 (8.1) | 82 | 8160 (8.7) | 2.47 (8.3) | 82 | 8770 (8.7) | 2.65 (13.5) | 82 | |||
| LID (PP+BR+GR) | 4440 (42.9) | 1.39 (40.6) | 82 | 5140 (42.5) | 1.61 (40.1) | 82 | 5540 (42.3) | 1.74 (43.4) | 82 | |||
Publisher’s Note: MDPI stays neutral with regard to jurisdictional claims in published maps and institutional affiliations. |
© 2021 by the authors. Licensee MDPI, Basel, Switzerland. This article is an open access article distributed under the terms and conditions of the Creative Commons Attribution (CC BY) license (https://creativecommons.org/licenses/by/4.0/).
Share and Cite
Kim, H.; Kim, G. An Effectiveness Study on the Use of Different Types of LID for Water Cycle Recovery in a Small Catchment. Land 2021, 10, 1055. https://doi.org/10.3390/land10101055
Kim H, Kim G. An Effectiveness Study on the Use of Different Types of LID for Water Cycle Recovery in a Small Catchment. Land. 2021; 10(10):1055. https://doi.org/10.3390/land10101055
Chicago/Turabian StyleKim, Heenyun, and Gunwoo Kim. 2021. "An Effectiveness Study on the Use of Different Types of LID for Water Cycle Recovery in a Small Catchment" Land 10, no. 10: 1055. https://doi.org/10.3390/land10101055
APA StyleKim, H., & Kim, G. (2021). An Effectiveness Study on the Use of Different Types of LID for Water Cycle Recovery in a Small Catchment. Land, 10(10), 1055. https://doi.org/10.3390/land10101055