Article

Soil Amendments Alter Ammonia-Oxidizing Archaea and Bacteria Communities in Rain-Fed Maize Field in Semi-Arid Loess Plateau

1
Gansu Provincial Key Laboratory of Aridland Crop Science, Gansu Agricultural University, Lanzhou 730070, China
2
College of Agronomy, Gansu Agricultural University, Lanzhou 730070, China
3
State Key Laboratory of Soil and Sustainable Agriculture, Institute of Soil Science, Chinese Academy of Sciences, Nanjing 210008, China
4
Department of Crop Science, University for Development Studies, P.O. Box TL 1882, Tamale 00233, Ghana
5
Institute of Molecular Biology and Biotechnology, The University of Lahore, Lahore 54660, Pakistan
*
Author to whom correspondence should be addressed.
Land 2021, 10(10), 1039; https://doi.org/10.3390/land10101039
Submission received: 18 August 2021 / Revised: 22 September 2021 / Accepted: 28 September 2021 / Published: 2 October 2021
(This article belongs to the Section Soil-Sediment-Water Systems)

Abstract

:
Ammonia-oxidizing archaea (AOA) and ammonia-oxidizing bacteria (AOB) are key drivers of nitrification in rainfed soil ecosystems. However, within a semi-arid region, the influence of different soil amendments on the composition of soil AOA and AOB communities and soil properties of rainfed maize is still unclear. Therefore, in this study, the abundance, diversity, and composition of AOA and AOB communities and the potential nitrification activity (PNA) was investigated across five soil treatments: no fertilization (NA), urea fertilizer (CF), cow manure (SM), corn stalk (MS), and cow manure + urea fertilizer (SC). The AOB amoA gene copy number was influenced significantly by fertilization treatments. The AOB community was dominated by Nitrosospira cluster 3b under the CF and SC treatments, and the AOA community was dominated by Nitrososphaera Group I.1b under the CF and NA amendments; however, manure treatments (SM, MS, and SC) did not exhibit such influence. Network analysis revealed the positive impact of some hub taxonomy on the abundance of ammonia oxidizers. Soil pH, NO3-N, Module 3, biomass, and AOB abundance were the major variables that influenced the potential nitrification activity (PNA) within structural equation modeling. PNA increased by 142.98–226.5% under the treatments CF, SC, SM, and MS compared to NA. In contrast to AOA, AOB contributed dominantly to PNA. Our study highlights the crucial role of bacterial communities in promoting sustainable agricultural production in calcareous soils in semi-arid loess plateau environments.

1. Introduction

The Semi-Arid Loess Plateau (SALP) in north-western China is one of the most fragile agro-ecosystems worldwide [1,2]. Corn is predominantly cultivated within this region, and farmers rely heavily on both organic and inorganic fertilizers in their farming systems to achieve sustainable agriculture. An enormous corn harvest is generally achieved with the plastic mulch technique which enhances both soil humidity and temperature [2] and elevated N fertilizer applications [3]. Meanwhile, excessive application of inorganic fertilizer (urea) has dire consequences on the abundance and diversity of ammonia-oxidizing archaea (AOA) and ammonia-oxidizing bacteria (AOB) within the soil. Fertilization leads to changes in soil properties, such as soil organic carbon (SOC), pH, soil moisture, soil temperature, NO3N, as well as the ammonia concentration [4,5,6]. Therefore, the integrated use of cow manure in combination with minimal urea and corn stalk has the advantage of providing a long-lasting effect on the AOA and AOB community and abundance [7,8,9]. Diversity and abundance of AOA during the nitrification process showed vital functions in soils with low ammonia rate, high acidity, and low oxygen properties [5,10], but AOB shows dominance in alkaline soils during the nitrification process [9,11]. In comparison, organic N in the form of cow manure and corn stalk support AOA productivity dramatically [1,6], while in neutral and calcareous soils treated with high NH4+-N and NO3-N fertilizer applications, AOB is a key contributor in nitrification [8,9,12]. Therefore, to revert this defect, cow manure with urea and corn stalk is essential to help augment soil microbial abundance and richness [1,13,14].
The impact of higher nitrogen inputs on microbial community structure is an important factor affecting terrestrial ecosystems around the world [15,16]. Bacteria and archaea play a crucial role in agricultural soils. The interaction between sustainable agriculture, environmental health, and the importance of soil microbial communities contribute to the cycling of carbon and nitrogen for plant growth and soil organic matter availability [4,17]. Furthermore, soil microbes (bacteria) degrade organic wastes and recycle old plant material, by forming a relationship with plant roots that provides essential nutrients such as nitrogen and phosphorus [9,10]. However, nitrogen fertilizer application has been shown to alter microbial taxa associated with certain components of the soil nitrogen cycle [18]. The study of bacterial community dynamics in soil usually focuses on specific types of microorganisms, such as nitrifiers and denitrifiers [6,19]. The first oxidation step in the nitrogen cycle is nitrification, which is converting ammonia (NH3) to nitrite (NO2) and then to nitrate (NO3), releasing N to plants and microbes alike. However, N is lost through NO3- leaching and N2O emissions. In a preliminary stage, NH3 is converted to hydroxylamine (NH2OH) and then to nitrite (NO2) [6,11]. Until the emergence of a distinct role in the ammonia oxidizing-archaea (AOA) community dominated by Nitrososphaera, which also facilitates oxidation of ammonia [20], dominant Proteobacteria in amoA gene (AOB) was thought to have a singular influence on the nitrification process. Consequently, Nitrosospira affects the efficacy of N fertilizers in arable soils [4,9,17]. Nevertheless, chemical fertilizers (urea) and organic fertilizers (such as straw and cow manure) influence AOA and AOB abundance and diversity in different neutral and calcareous agricultural soils, is positive, and drastically increase AOB, but not AOA abundance and diversity [1,8,20].
In our dynamic global ecosystem, it has become essential to generate ideas that exist among diverse AOA and AOB taxonomies within their complex soil population [21]. The co-occurrence network can unravel the impact of environmental factors within ammonia oxidizers to mitigate dynamic microbe-to-microbe association within their taxonomies [22]. However, few studies have addressed mechanisms of competitive interaction associated with keystone species responsible for microbial diversity. More experimental evidence is needed, especially to confirm competitive interaction with keystone taxa in microbial networks. Some studies have been conducted to explore the effects of chemical and organic fertilizers on bacterial communities to discover taxonomic composition and phylogenetic diversity and its environmental drivers [1,8,23,24]. Though this knowledge is crucial in understanding soil microbial diversity, there is still the need to study the long-term effects of different fertilization regimes in the semi-arid Loess Plateau of northwestern China, where soil fertility loss and climate change are of major concern [25]. In addition, there is a knowledge gap regarding the effects of soil amendments on microbial community abundance, diversity, and composition within the semi-arid Loess Plateau of northwestern China. Co-occurrence networks are often useful for determining major changes in taxonomic interactions and module key points throughout community structure.
The present study aimed to: (i) assess the impact of fertilizer treatments within semi-arid loess plateau of northwestern China on the abundance and diversity of AOA and AOB, (ii) use co-occurrence dependent network analysis to evaluate correlations among relative abundance, microbial diversity, and soil physicochemical properties, and (iii) determine the relative contributions of AOA and AOB community to soil nitrification. Here, we hypothesized that the potential impact of combined chemical and organic fertilizers would improve the abundance, diversity, and composition of ammonia oxidizers and their interactions with soil nutrients. This study contributes to knowledge of soil bacterial community as well as N cycling and nitrification process among soil ammonia oxidizers in rainfed corn within semi-arid loess Plateau of northwestern China. It provides practical information necessary to ensure sustainable fertilizer management in the maize.

2. Materials and Methods

2.1. Description of the Experimental Site

The experiment was performed at Gansu Agricultural University Experimental Station in Dingxi, northwestern China (35°280 N, 104°440 E). The soil is sandy-loam with a low fertility level [26] and classified as Calcaric Cambisol [27]. Initial soil physiochemical properties at the experimental site before the experiment in 2019 are shown in Table 1. The research site has a mean annual temperature and precipitation were 10.8 °C and 400 mm, respectively. The daily radiation of sunlight is 5729 MJ/m2, and the average cumulative long-term temperature >10 °C of 2239 °C.

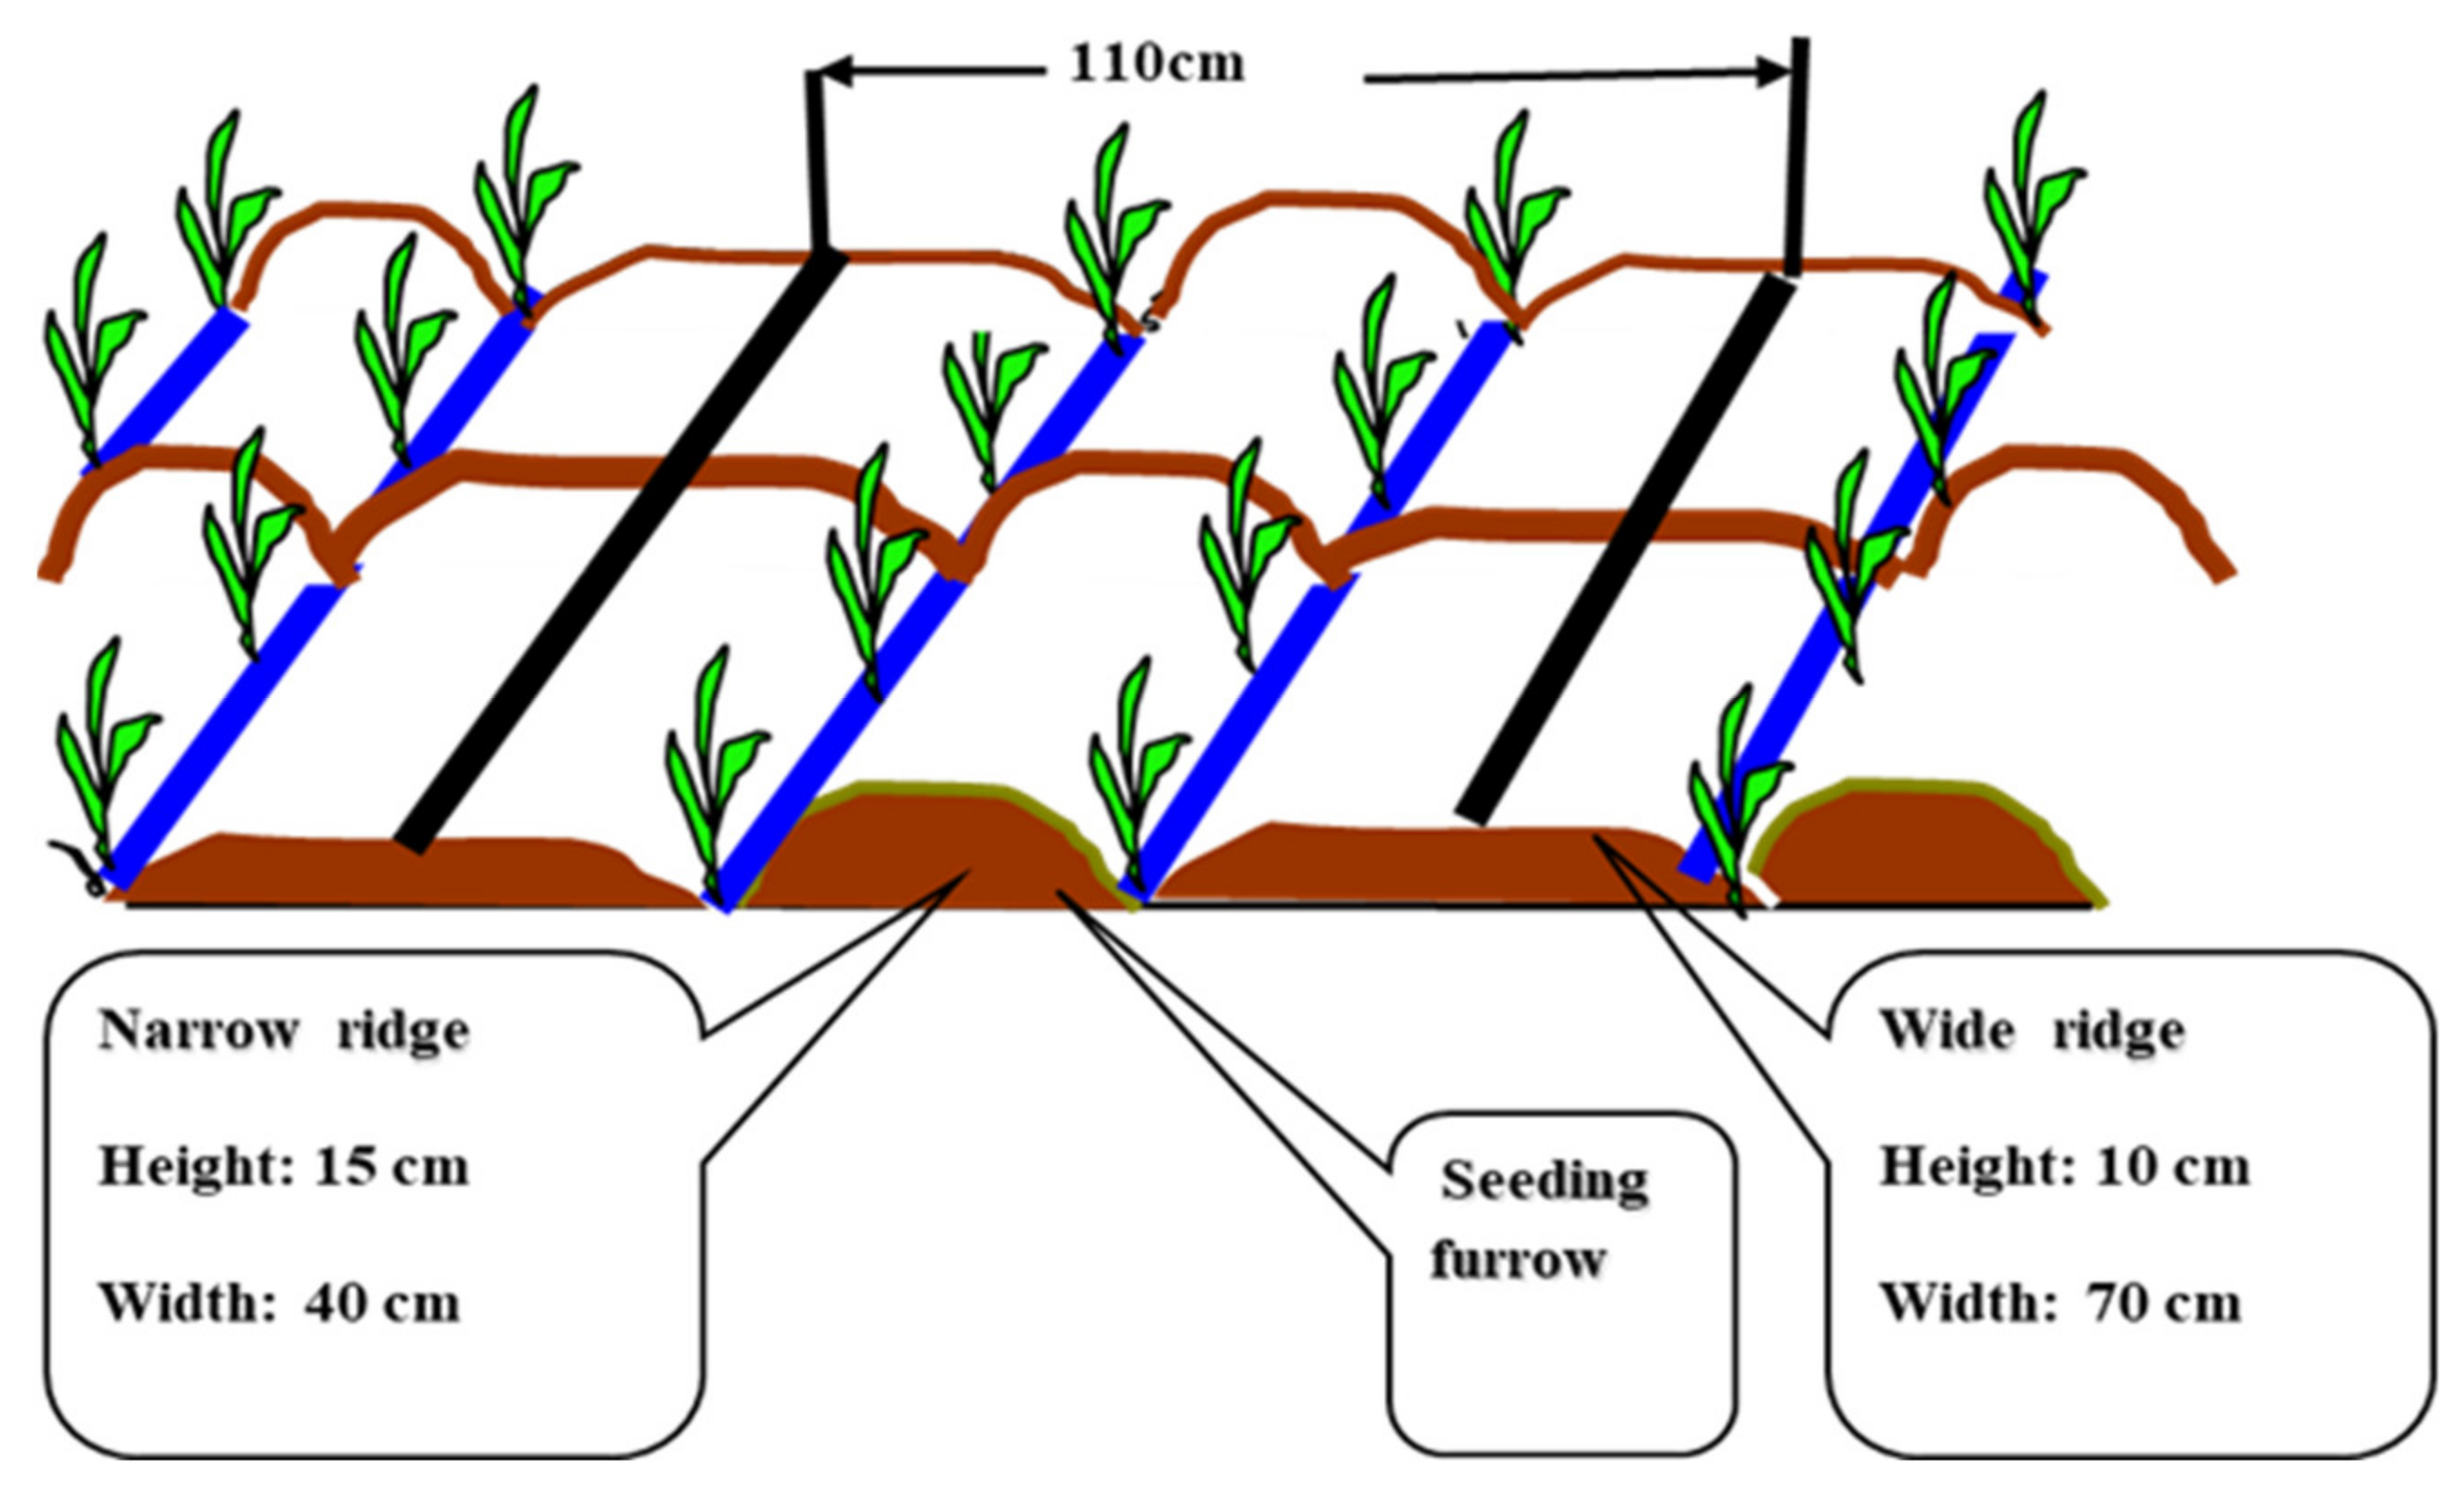
2.2. Experimental Design and Soil Sampling

The study comprised 15 samples (5 treatments × 3 replications): (i) no fertilizer (NA); (ii) chemical fertilizer (CF) containing 200 kg N/ha as urea (46-0-0 N-P2O5-K2O) plus 150 kg P2O5/ha and calcium superphosphate (0-16-0 of N-P2O5-K2O); (iii) SC was composed of 3.03 t/ha of commercial organic fertilizer (cow manure), 100 kg N/ha of urea, and 120 kg P2O5/ha of triple superphosphate; (iv) Organic fertilizer SM contained 6.06 t/ha of commercial organic fertilizer (cow manure), plus 90 kg P2O5 ha−1 as triple superphosphate; and (v) Cornstalk (MS) was applied at a rate of 28.5 t/ha with a triple superphosphate application of 36 kg ha1. These treatments were laid in a randomized complete block design. Each experimental unit had an area of 110 cm with narrow ridges 15 cm high × 40 cm long and alternating with ridges 10 cm high × 70 cm wide (Figure 1). Corn (cv. Funong 821) was planted in mid-April and harvested in late October each year. Cornstalk was collected from the entire experimental area after harvest and mixed, air-dried, shredded to 5 cm, weighed, and applied to field plots for the MS treatment. The maize straw contained 0.7% N, 0.4% P2O5, and 0.5% K2O. The commercial organic fertilizer used contained 3.3% N, 1.0% P2O5, and 0.7% K2O, with cow manure as ripened organic fertilizer (Gansu Daxing Agricultural Technology Co., Gansu, China). Every year during spring, all amendments are evenly spread on the soil surface with the help of a moldboard plough at a depth of 20 cm. ElementaryVario MACRO cube (Elementary, Hanau, Germany) was used to test representative samples of MS and SM at the time of application for nutrient concentration (Table 2). To improve soil temperature, promote crop growth, and minimize water evaporation, all furrows were covered with plastic film, and holes were implemented in furrows through the film to improve precipitation collection [28]. During the sowing, flowering, and pre-harvesting stages, plowing, ridging, and mulching were carried out. Except for fertilization, similar agronomic practices were used in treatment plots. Between sowing and harvesting, manual weeding was carried out by hand.
Soil samples on the experimental fields were sampled at the flowering stage after sowing. Fifteen soil samples (five treatments × three replicates) within a depth of 0–20 cm layer were collected using an auger (3.4 cm diameter). The 10 soil cores from each plot were pooled to form a homogeneous sample and immediately deposited on dry ice and transported to the laboratory. Before the collection of new samples, the auger was cleaned via clean tissue paper with ethanol to avoid cross-contamination. The samples were processed to extract stones and surface debris and were sieved with a 2-mm sieve mesh. Each soil sample was separated into two parts: one was preserved at −80 °C for DNA analysis, and the other was air-dried for chemical analysis. For soil mineral N chemical analysis, a portion of the soil sample is stored at −20 °C.

2.3. Soil Chemical Properties

Soil pH was measured in a 1:2.5 (weight: volume) soil suspension-water ratio [29]. Total organic carbon (TOC) was measured by Walkley-Black wet oxidation mechanism [30]. Total nitrogen (TN) was determined using the Kjeldahl method [31], and extraction of sodium bicarbonate procedure was used to determine Olsen phosphorous [32]. Using 2 M KCl and a UV-1800 spectrophotometer, the technique extracts soil nitrate-N (NO3-N) and ammonium-N (NH4+-N) content from soil samples using a modified Bremner standard protocol [33] (Mapada Instruments, Shanghai, China). A chlorate inhibition analysis was used to examine soil PNA [34]. In total, 5 g of fresh soil samples were put in a 50-mL phosphate-buffered saline bottle of 100 mL (pH 7.4) and 1 mM (NH4)2SO4. Samples were incubated in the dark at 25 °C with shaking at 180 r min−1 for 24 h and potassium chlorate was added to prevent oxidation of nitrite (final concentration 10 mg L−1). After incubation, 25 mL of 2 M KCl was added to each bottle with shaking at 180 r min−1 for 1 h, and nitrite was quantified with N-(1-naphthyl) ethylenediamine by measuring absorbance at 540 nm. The cumulative nitrite was then estimated to measure the PNA values.

2.4. DNA Isolation and Quantitative PCR Analysis

Soil DNA was extracted by OMEGA Soil DNA Kit (Omega Bio-Tek, Doraville, GA, USA). The DNA quality and quantity of the DNA extracts were checked using a spectrophotometer (Nanodrop; PeqLab, Germany). The DNA was diluted with sterilized water to 1 ngμl−1. The qPCR amplification of AOA and AOB was performed using the primer-pairs, archaeal amoA Arch-amoA-F (5′-STAATGGTCTGGCTTAGACG-3′) and Arch-amoA-R (5′-GCGGCCATCCATGGTATGT-3′) [35], and bacterial amoA1-F (5′GGGGTTTCTACTGGTGGT-3′) and amoA2-R (5′-CCCCTCKGSAAAGCCTTCTTC-3′) [36], respectively. Each qPCR reaction was made up of 25 μL reaction volume with 2.5 μL buffer, 2 μL2.5 mM deoxynucleoside triphosphate, 16.2 μL sterilized ultrapure water, 1 μL of DNA sample, 1 μL10 pmol each primer, and 0.3 μL Taq DNA polymerase (Takara). The qPCR condition used consisted of 98 °C for 1 min initial denaturation of thermal cycling, followed by 30 denaturation cycles at 98 °C for 10 s, annealing at 50 °C for 30 s, and elongation at 72 °C for 60 s. The qPCR products were left for 5 min at 72 °C and then analyzed for detection on a 2% agarose gel by electrophoresis with ethidium bromide staining. Standard curves were generated using a 10-fold systematic dilution of known copy numbers of plasmids encoding the gene of interest. Purified amplicons were pooled in equimolar amounts and paired on an Illumina Miseq® PE300 processing platform (Illumina, San Diego, USA).

2.5. High-Throughput Sequencing and Bioinformatic Analysis

Raw sequences based on barcodes were processed using Quantitative Insights Into Microbial Ecology (QIIME) software [37] to remove the low-quality 20 bp sequences with an average length of 224 bp. FLASH software [38] was used to exclude low-quality sequences with an average output score of less than 20. To eliminate non-amoA sequences, chimeras were discarded [39] by submitting them into the RDP pipeline using FrameBot software [40]. Based on 90% sequence identity, the remaining quality-screened sequences were grouped into operational taxonomic units (OTU) using a Cluster Database at High Identity with Tolerance (CD-HIT) [5] among AOA-amoA and AOB-amoA. Representatives of AOB and AOA amoA were aligned to reference sequences from the National Center for Biotechnology Information (NCBI) GenBank database. Each OTU was taxonomically categorized using BLASTN 2.2.30 against the database, then OTUs that were not assigned as AOA-amoA and AOB-amoA were omitted. After that, we built a neighbor-joining tree using a Kimura 2-parameter distance with 1000 bootstrap replicates in MEGA 6 [41] to classify AOA-AOB OTUs. We used the nomenclature for AOA-amoA clusters as defined by [42] and the nomenclature for AOB-amoA as defined by [23]. The sequences of AOA-amoA and AOB-amoA were deposited in the NCBI database (Accession number: PRJNA723364 and PRJNA722852).
Species diversity within the ecosystem and the degree of species diversity were interpreted using alpha and beta diversity analyses. Chao1, Shannon, phylogenetic diversity (PD) index, goods, and Simpson indices were used to estimate bacterial diversity and richness. MOTHUR was used to analyze and measure alpha diversity indices [39]. These include the number of operational taxonomic units (OTUs) and observed species, Chao1, Shannon, Simpson, and goods Coverage [37]. Species index measures the quantity of unique OTUs and Shannon index, while the number of organisms was calculated by the Chao 1 index. Functional gene (AOA and AOB) analyses were performed using clean chimeras from the 15 samples (5 treatments × 3 replications).

2.6. Data Analysis

Analyses of variance (ANOVA) were implemented on the effects of fertilization amendments on the copy number of AOA and AOB amoA genes, soil PNA, and plant biomass in SPSS 19.0 software (SPSS, Inc., Chicago, IL, USA), and treatment means were separated by the least significant difference (LSD) test at p < 0.05. Copy numbers of the AOA and AOB amoA gene and plant biomass were log-transformed to normalize the data. Pearson correlation analysis was used to test the relationships among amoA gene copies, soil PNA, and soil properties. Multiple stepwise linear regressions were performed to evaluate the variance in PNA explained by AOB and AOA community and all calculated soil parameters. Principal component analysis (PCA) was performed to determine the variations among fertilization amendments using R statistical software. Similarly, Pearson correlation was performed to examine the associations between the alpha diversity indices of AOA, AOB, and soil physicochemical properties.

2.7. Network, SEM, and Random Forest Analysis

Co-occurrence networks were conducted to investigate the relationships between AOA and AOB communities within their microbial interactions. Fifteen soil amendment samples (five treatments × three replications) were pooled and the OTUs occurring in all treatment replicates were retained in network analysis [43]. Following that, Pearson correlation, Bray-Curtis, and Kullback-Leibler dissimilarities were used in a collaborative approach. A true co-occurrence was described as a statistically robust association between species when the correlation coefficient (r) was >0.8 or <−0.8 and the p-value was 0.01. To minimize the chances of false-positive outcomes, all p-values less than 0.01 were adjusted using the Benjamini-Hochberg analysis process [44]. Several measures (average clustering coefficient, average patch length, and modularity) were calculated to define the topological properties of the resulting networks [45]. Using the guided network (where edges have direction) and the Fruchterman-Reingold design, the interactive framework Gephi was used to investigate and visualize the network structure [46]. We considered the first principal component of the modules (module eigengenes) in the hierarchical module expression data for co-occurrence networks [47]. Pearson correlation test was used to evaluate the relationship between soil properties, network module eigengenes, nitrification, AOA/AOB abundance, and plant biomass. Random forest modeling was used to evaluate important predictors by permuting the response variable. For the investigation of random forest modeling, the random forest package was used [48]. The sense and predictor function of the model was determined through the A3R [49] and rfPermute packages [50]. The significant output predictors realized from the random forest analysis were further used to conduct the structural equation modeling (SEM). The direct and indirect relationship between abiotic variables (soil physiological properties), biotic variables (biomass, network modules, and AOB abundance), and PNA were evaluated using SEM with SPSS (SPSS, Inc., Chicago, IL). A path was plotted to show how the abundance output was affected by abiotic variables (soil physiochemical properties) and biotic variables (biomass, nitrification, and module 3). SEM was implemented with significant chi-square test (p > 0.05), root mean square approximation error (RMSEA), and the Akaike information criterion (AIC) [51].

3. Results

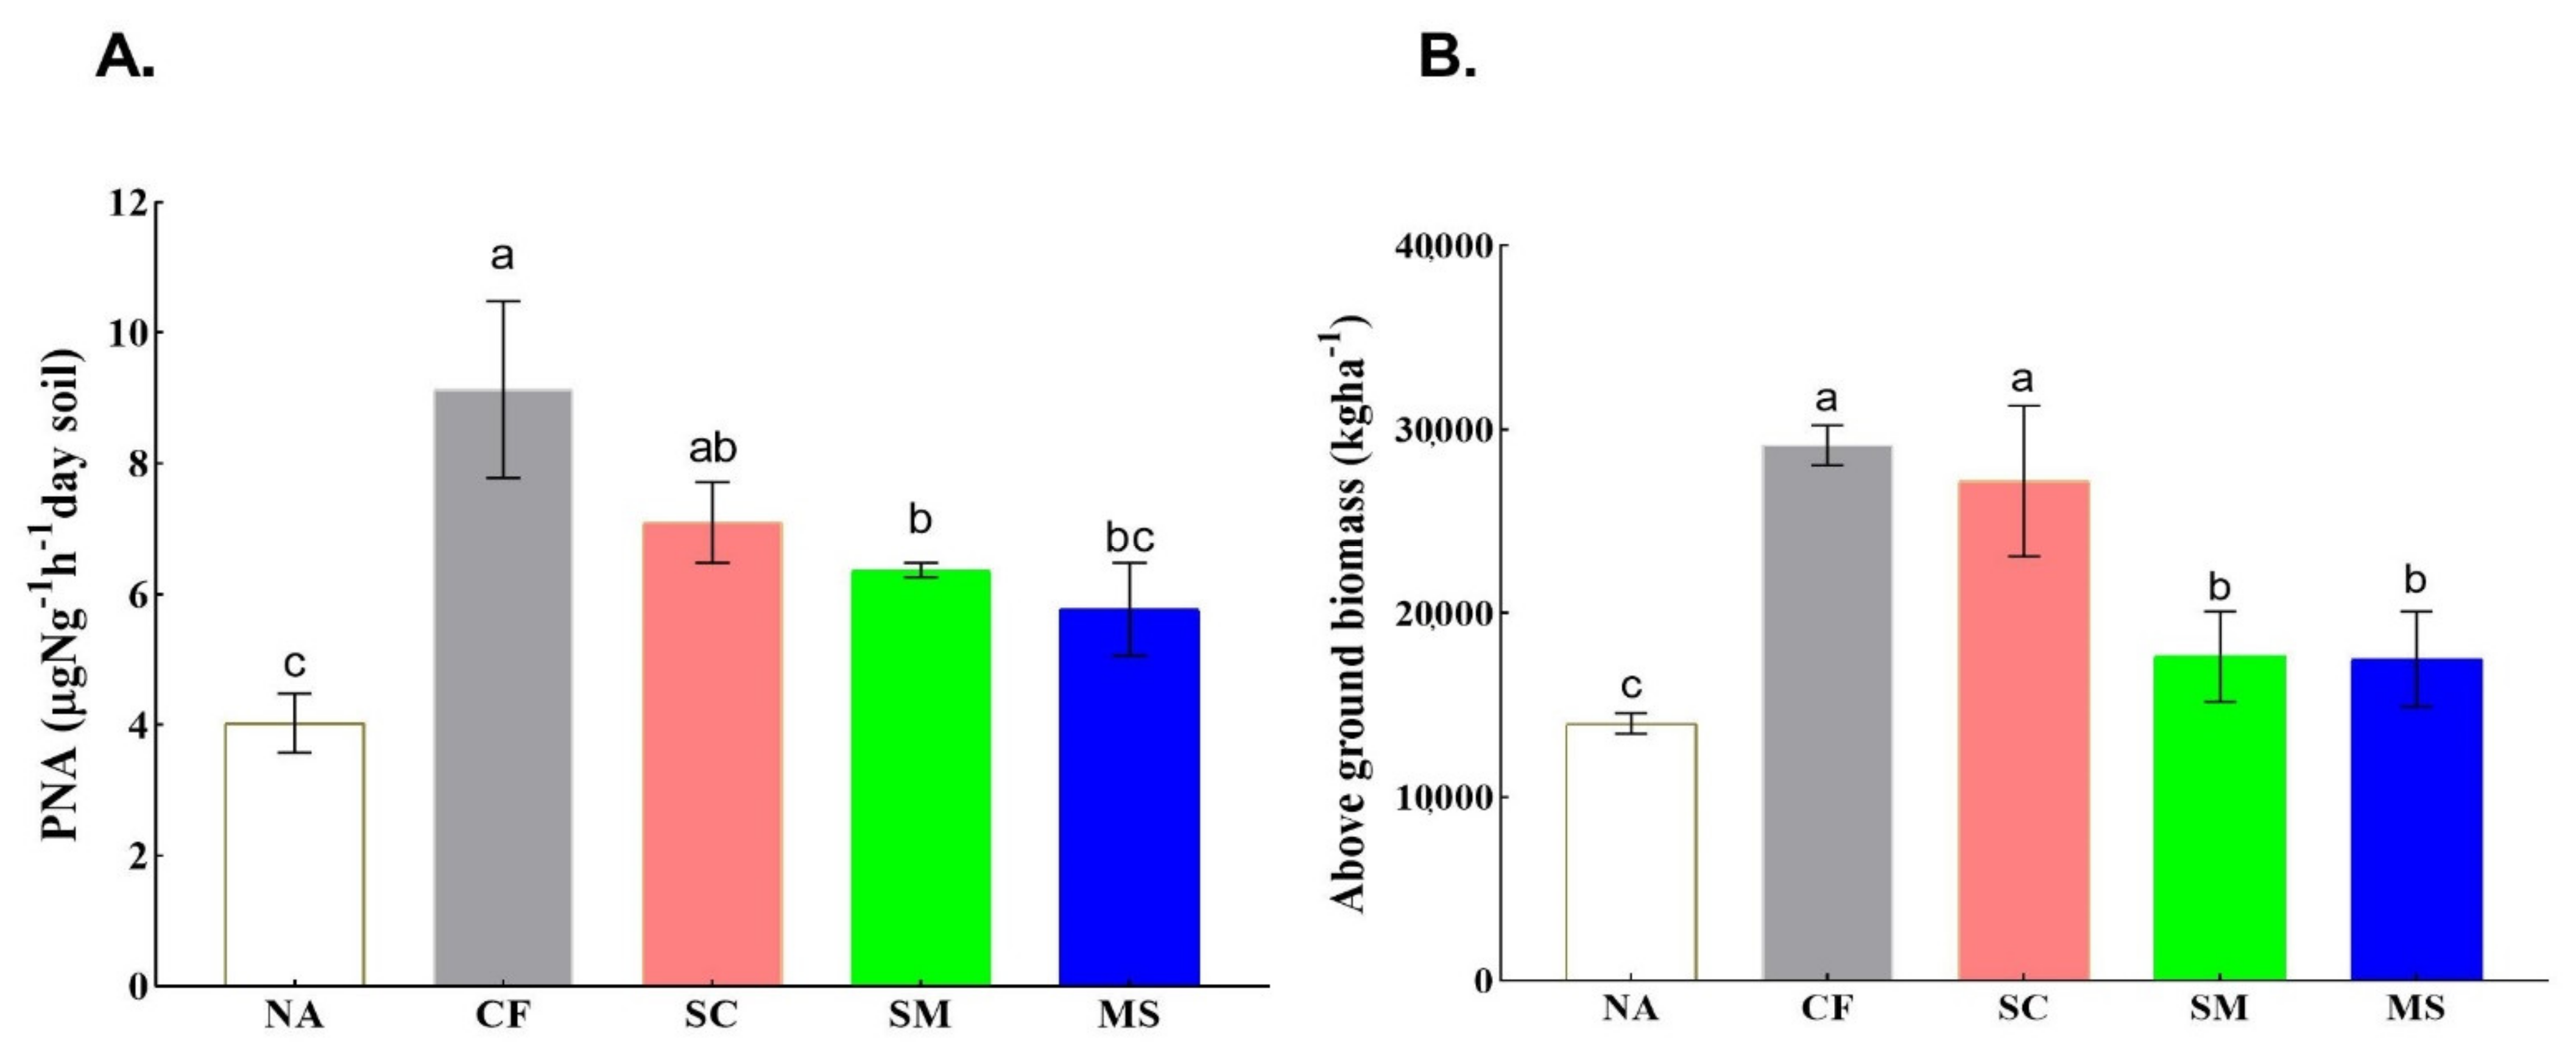
3.1. Soil Physicochemical Properties and Aboveground Biomass

Except for NH4+-N, all treatments had a significant (p < 0.05) effect on the soil’s physicochemical properties (Table 3). Soil pH ranged from 8.32 to 8.66 and was the highest under NA treatment compared to the other four treatments (CF, SM, SC, and MS). However, the SM, SC, and MS treatments showed significantly higher TN, SOC, and AP than the NA treatment. The NO3-N was the highest under the CF treatment, followed by SM, SC, and MS treatments. In addition, potential nitrification activity (PNA) was significantly affected by fertilization treatments, and was increased by 142.98–226.50% under fertilization treatments compared with the NA treatment (p < 0.05, Figure 2A). The PNA was significantly (p < 0.05) lower under SM and MS treatments than under the CF treatment. PNA was negatively correlated with pH (r = −0.62, p > 0.05) but positively correlated with NO3-N (r = 0.71, p < 0.01) (Table S1). In contrast, the was no correlation between potential nitrification rate (PNR) and AOA (Figure S1A), however there was significant correlation between AOB gene copy numbers and PNR (Figure S1B).
The aboveground biomass showed a significant difference to soil amendment materials (p < 0.05). The different soil N fertilization materials showed higher plant biomass than NA (for details see Figure 2B).

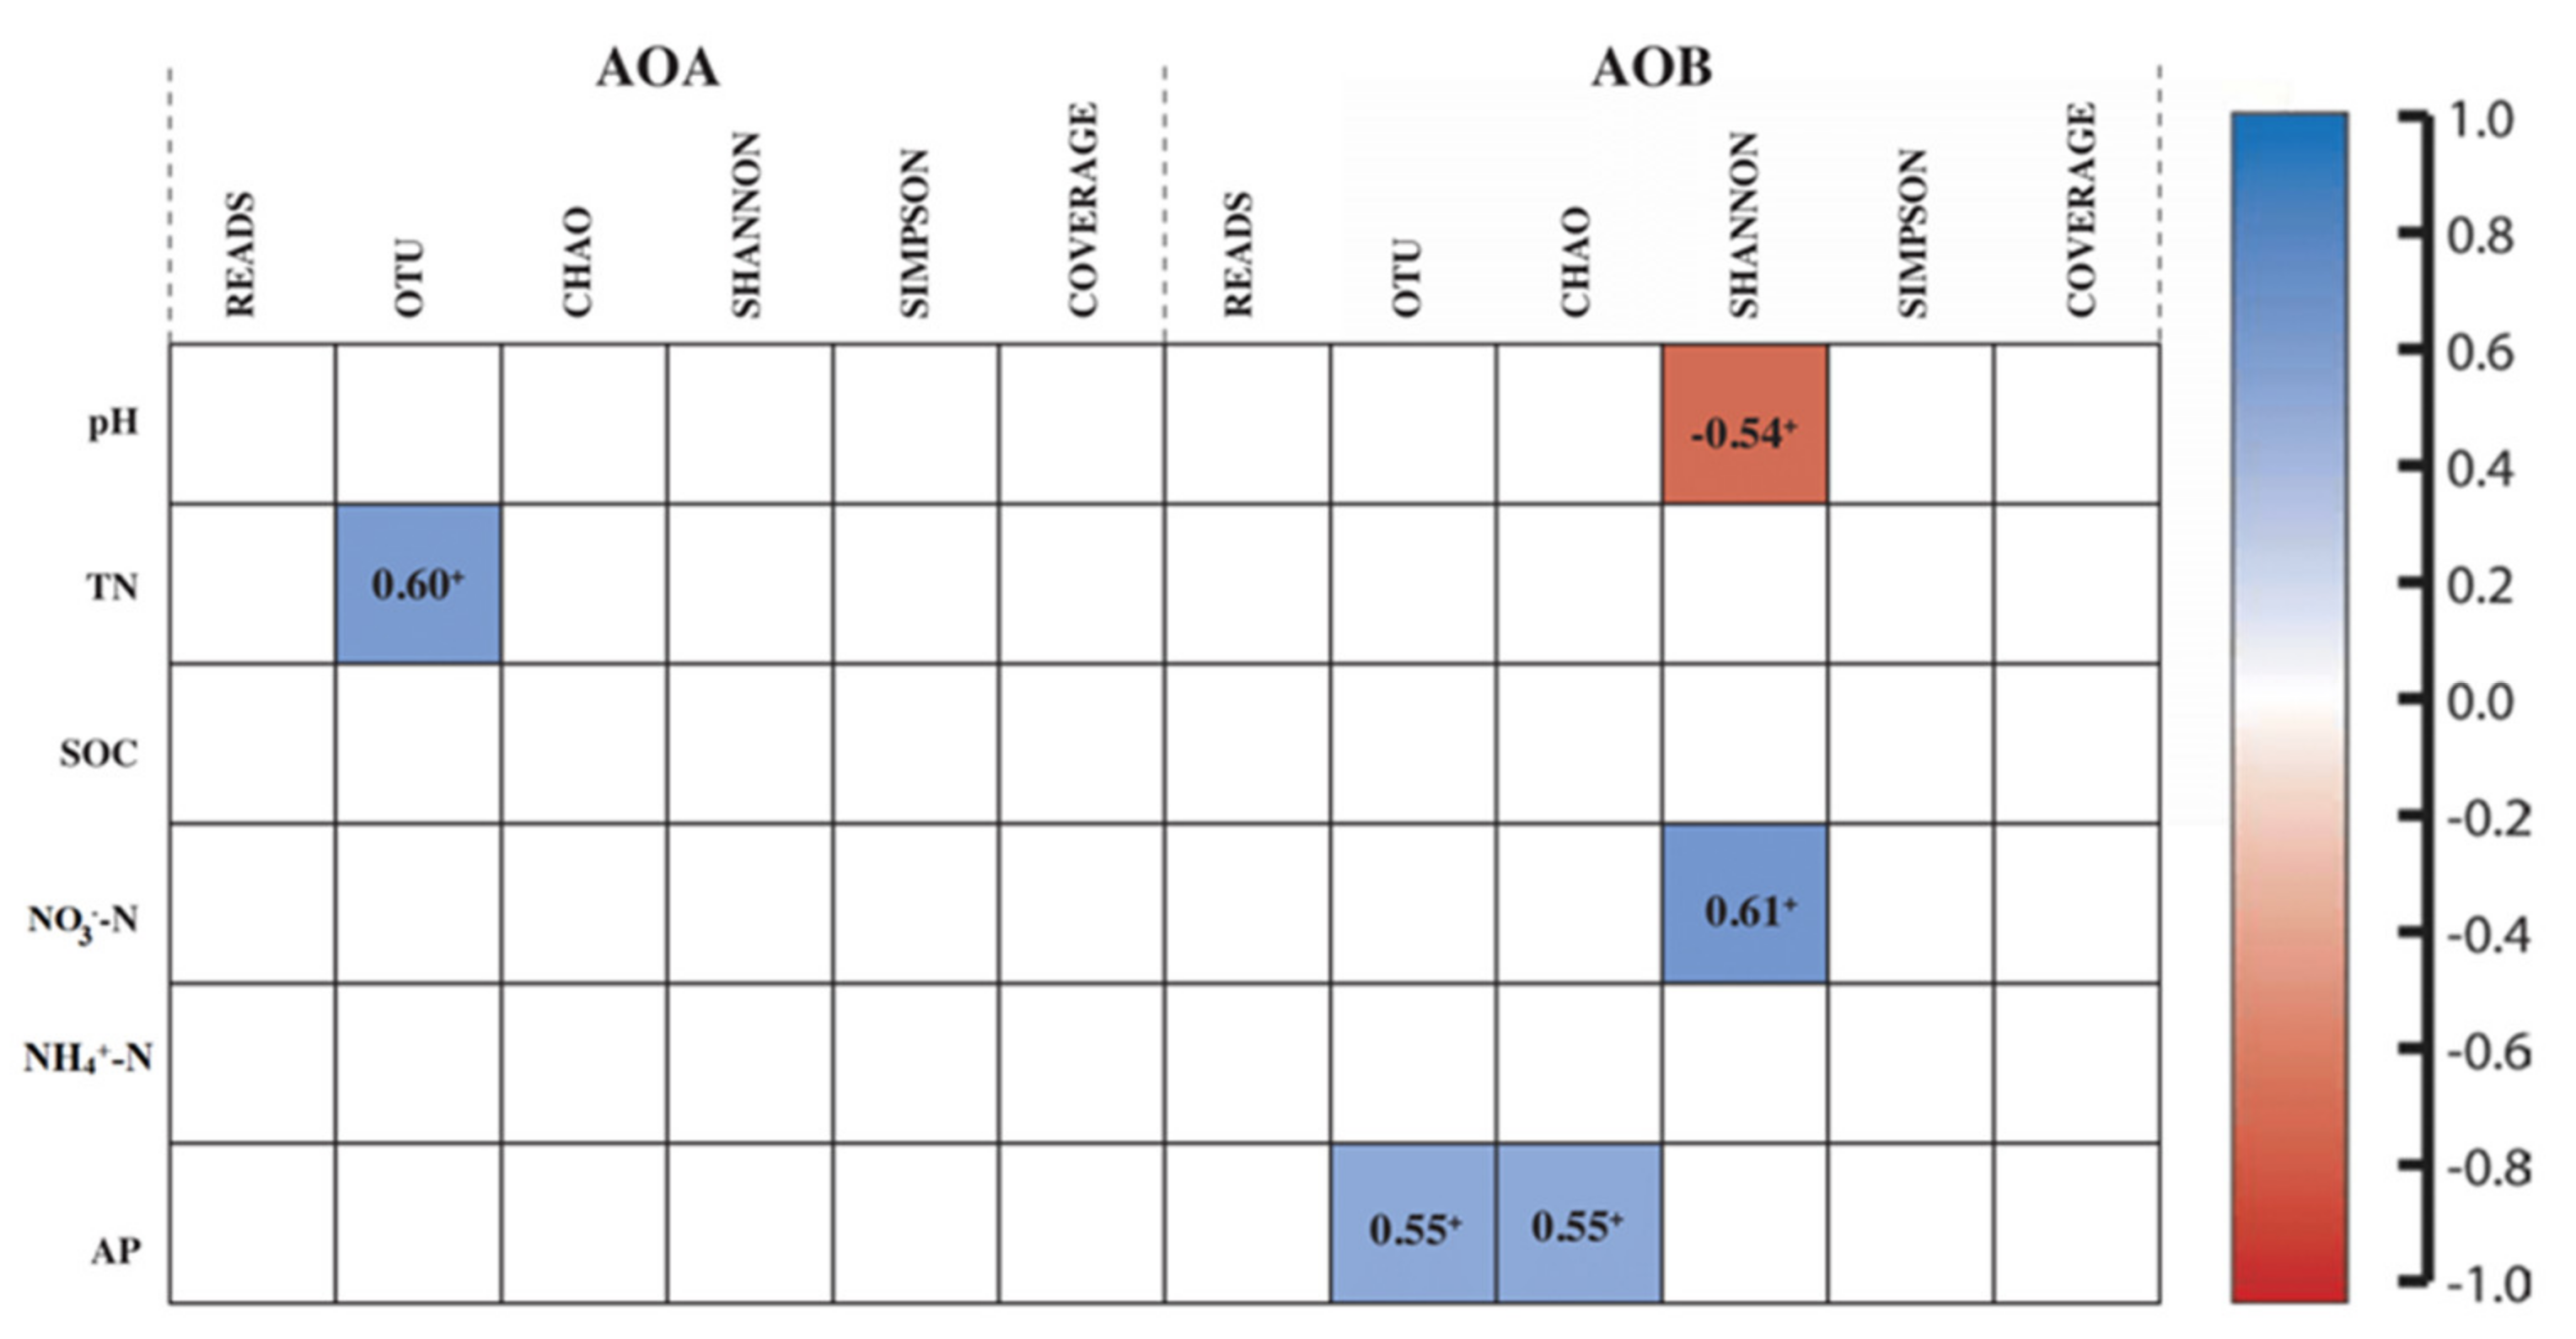
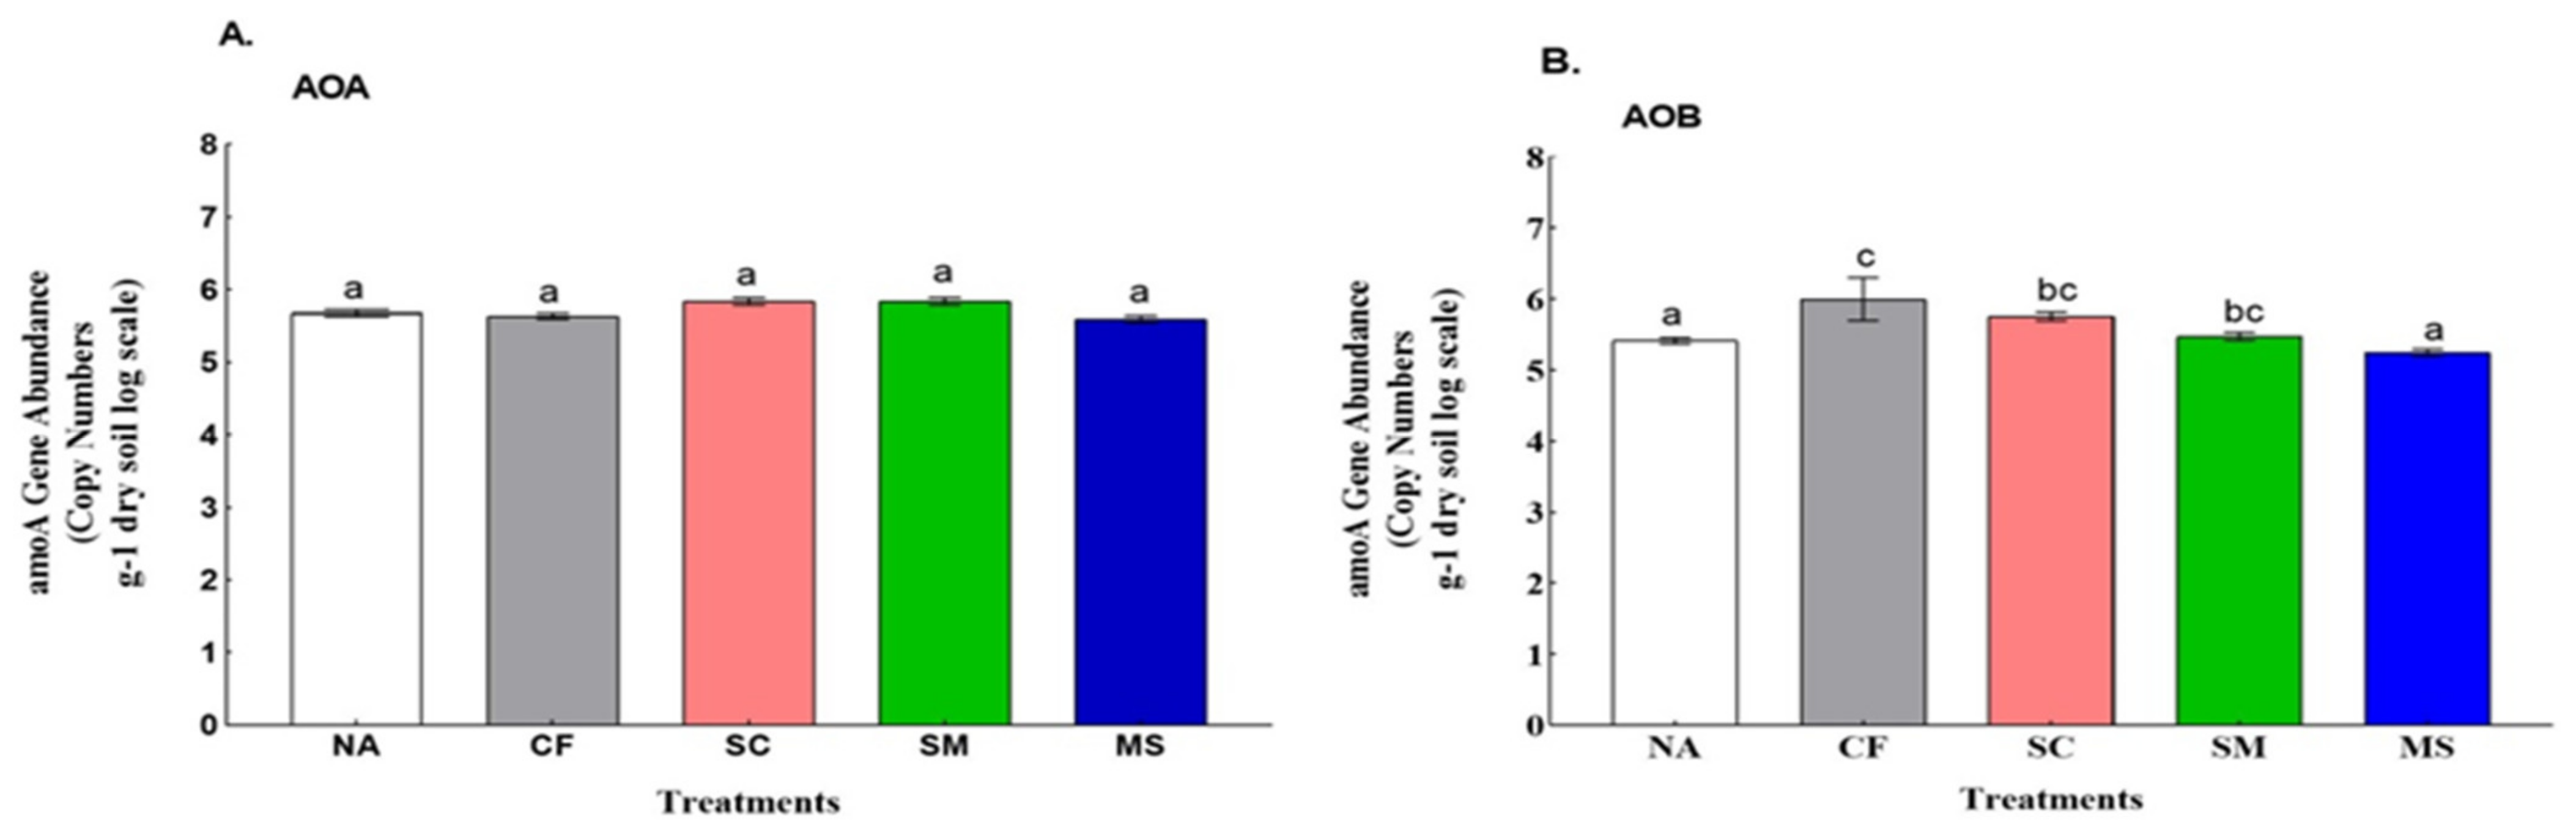
3.2. Abundance and Diversity of Ammonia Oxidizers with Its Association to Soil Physiochemical Properties

The abundance of AOA and AOB indicated by the copy numbers of amoA genes ranged from 3.91 × 10⁵ to 6.94 × 10⁵ and 1.12 × 10⁵ to 9.99 × 10⁵ copies of g−1 dry soil, respectively (Figure 3). The AOB abundance was significantly higher under the CF, SC, and SM treatments than under the NA and MS treatments (p < 0.05). The obtained bases of AOA and AOB sequences comprised 7,072,379–12,709,196 bp and 9,369,546–12,623,712 bp of valid codes, respectively. MiSeq® sequencing of AOA generated chimera-free reads with an average length size of acceptable tags of 223.89–224.91 bp compared to 224.93–226.96 bp for AOB. The sum of sequences in the soil samples from AOA and AOB varied between 31,446–56,507 and 41,283–56,125, respectively, and were determined by MOTHUR clustering (Table 4 and Table 5). With a similarity of 90%, a subsample of sequences equivalent to the minimum number of reads per sample yielded the representative OTUs for statistical sequence analysis.
In contrast, AOA abundance showed no significant difference among the five fertilization treatments. Similarly, fertilization treatments substantially varied the AOB diversity (p < 0.05), rather than AOA diversity (p > 0.05, Table 4 and Table 5). The AOB diversity indicated by the Shannon index and Chao1 richness was significantly enhanced under the CF and SC treatments compared with the NA and MS treatments (p < 0.05). The AOB abundance and diversity (Shannon index) showed negative correlations with pH (r = −0.71, p < 0.01, and r = −0.54, p < 0.05) but a positive correlation with NO3-N (r = 0.83, p < 0.01, and r = 0.61, p < 0.05) (Table S1). The Chao1 index and the richness of the AOB community were positively associated with AP (r = 0.55, p < 0.05 and r = 0.55, p < 0.05). The AOB abundance exhibited a significantly positive relationship with PNA (r = 0.67, p < 0.005). However, there are no significant associations between the diversity and abundance of the AOA community, soil properties, and PNA.
In order to ascertain associations between soil properties and AOA/AOB diversity, a Pearson Correlation was conducted (Figure 4). Only the OTU had a positive association with soil TN among the AOA abundance (r = 0.60, p < 0.05). The AOB abundance had an OTU and Chao 1 positively associated with accessible soil-available P (r = 0.55, p < 0.05 and r = 0.55, p < 0.05). The Shannon index was associated with soil PH negatively (r = −0.54, p < 0.05) and with N03-N positively (r = 0.61, p < 0.05).

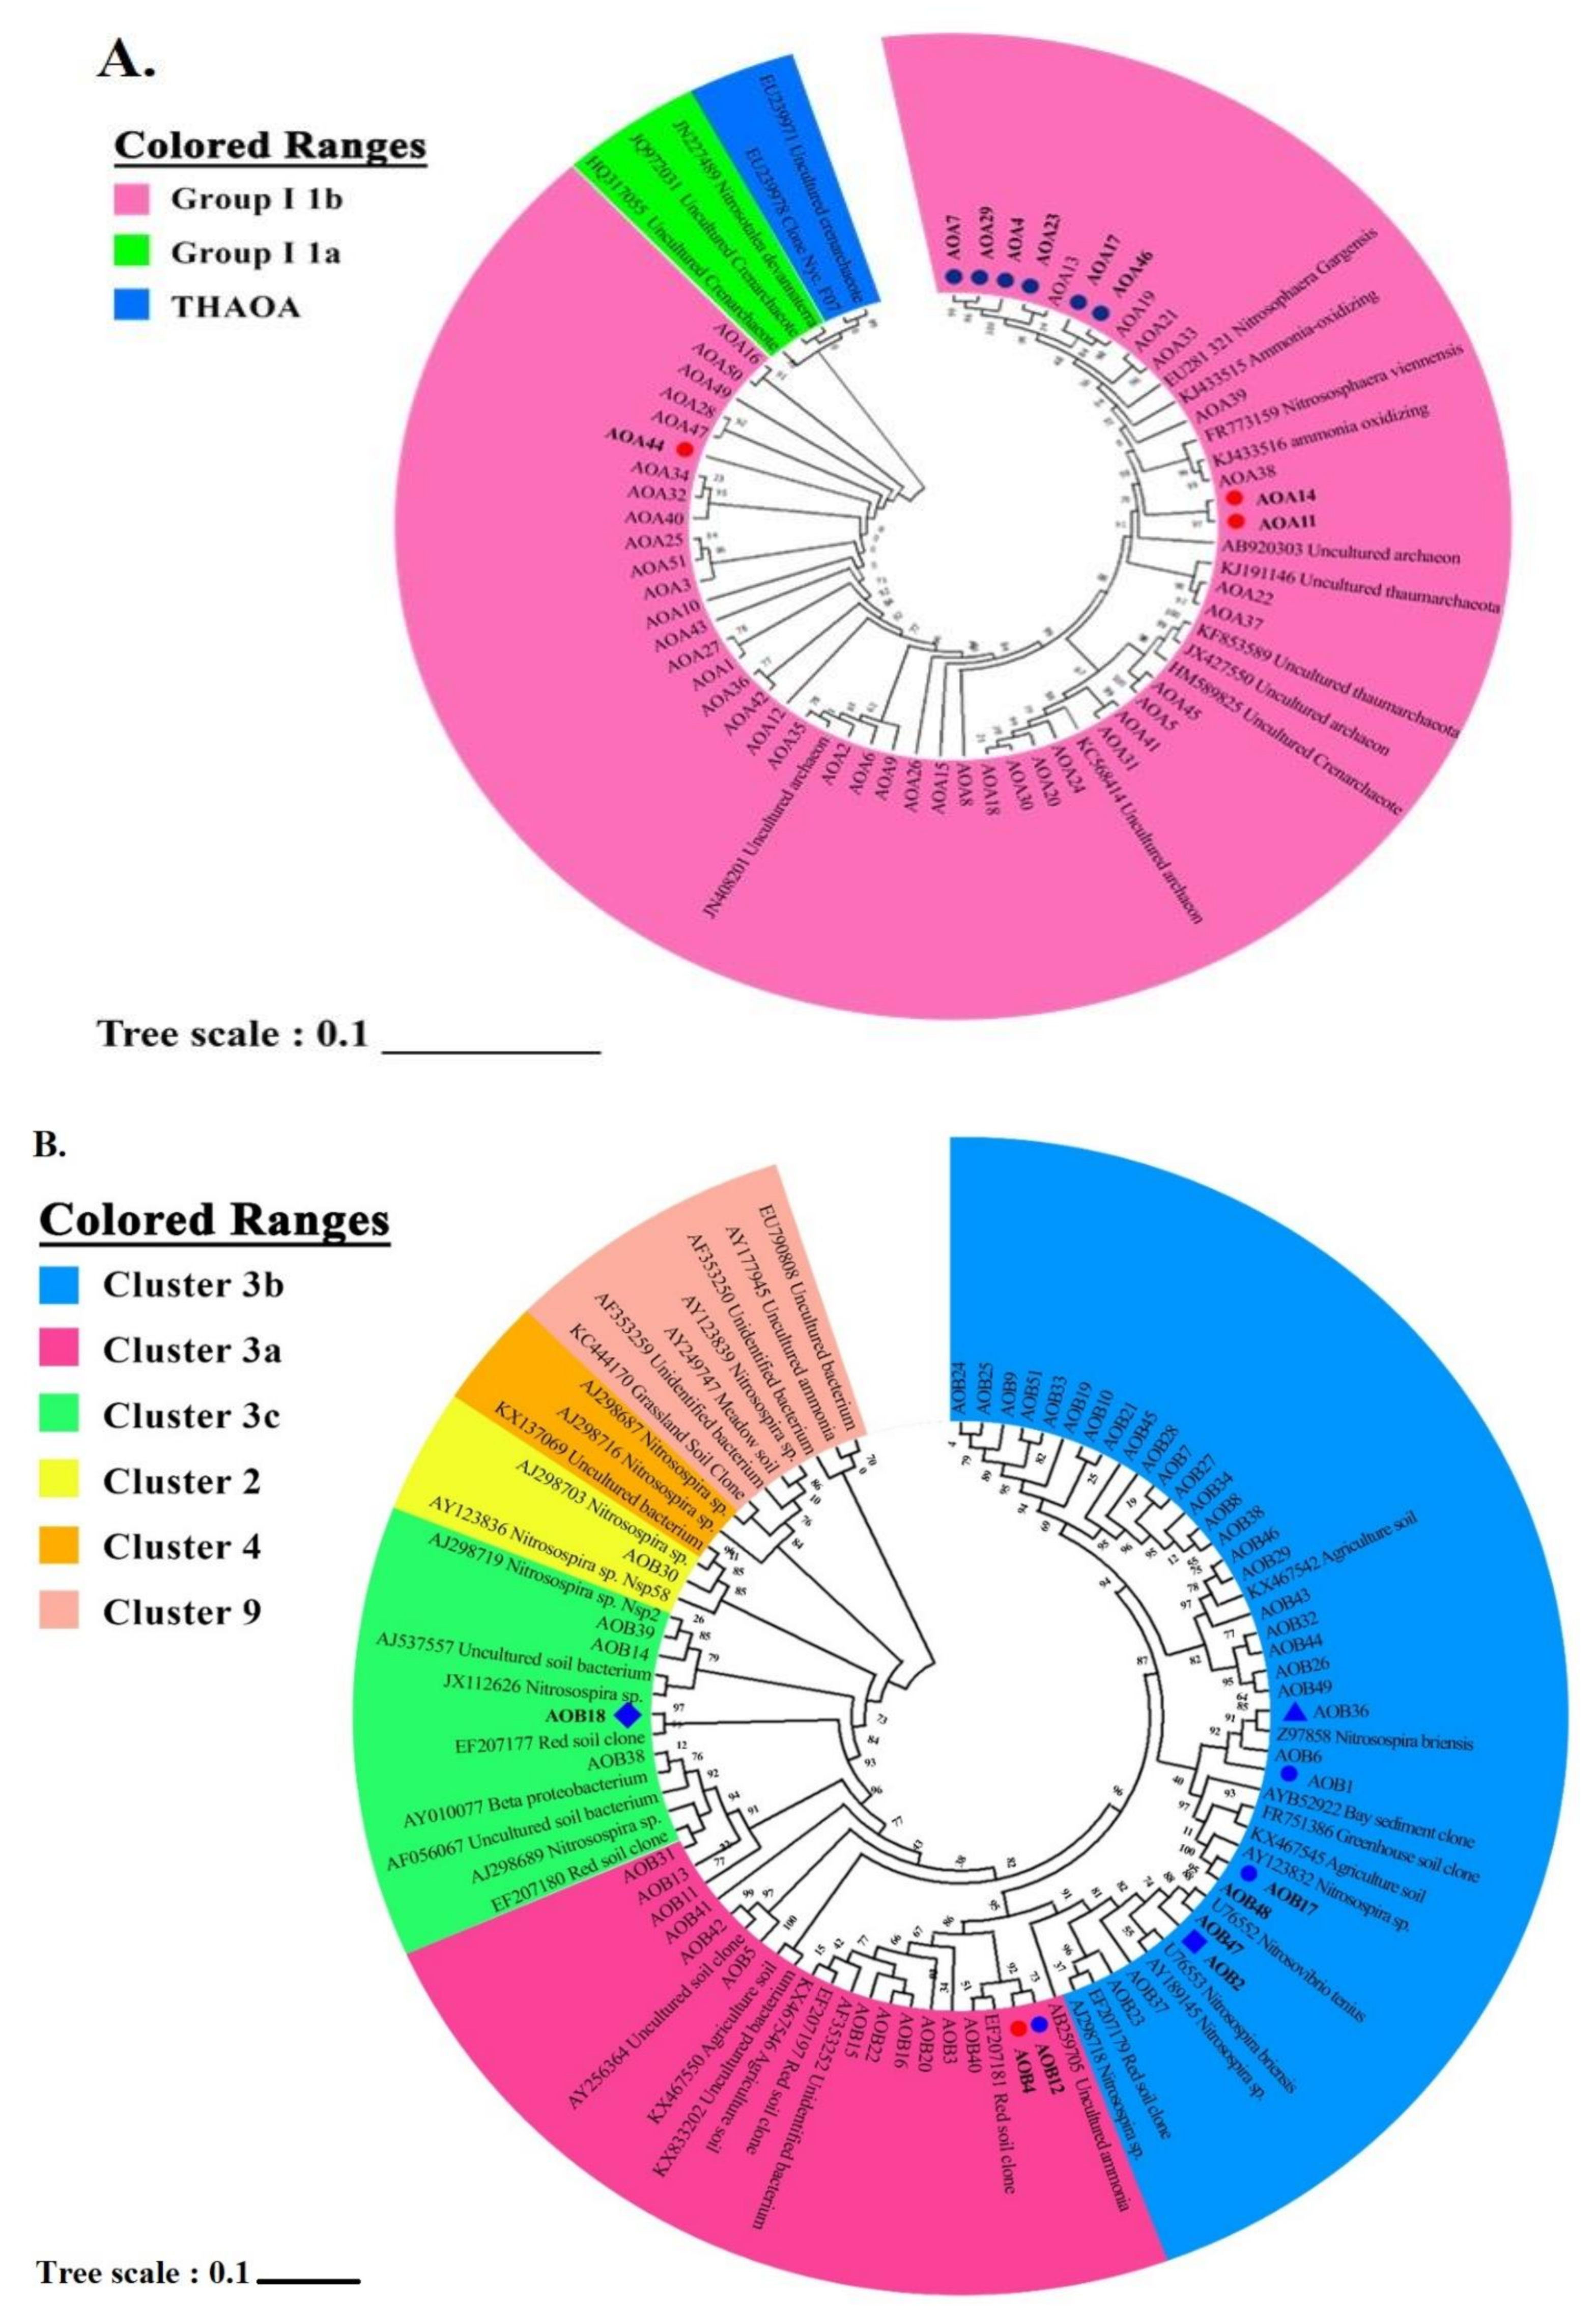
3.3. The Compositions of Ammonia Oxidizers

Within the structure of the amoA-AOA and amoA-AOB communities, a phylogenetic tree was constructed with the 50 dominant OTUs for each community (Figure 5A,B). The N-fertilization procedure had a major effect on nine of the most abundant OTUs in amoA-AOA (ANOVA, p < 0.05). The major representative sequences of amoA-AOA OTU were affiliated to the Nitrososphaera cluster’s group I.1b lineage (Figure 5A). The inorganic fertilizer content (CF) of AOA29, AOA4, AOA7, AOA23, AOA46, and AOA17 (which were related to Nitrososphaera gargensis) was significantly higher than that of NA amendment (Figure S3A). AOA11 and AOA14 were closely related to Nitrososphaera viennensis, and their contents were significantly higher in NA than in the N fertilizer amendments. AOA44 was also higher in the NA group than in the N fertilizer amendments (Figure S3A). As shown in Figure 5B, among the 50 dominant OTUs, amoA-AOB was identified in four clustered lineages of Nitrosospira: 3b, 3a, 2, and 3c (Figure 5B). N amendments significantly altered seven of the abundant OTUs (ANOVA, p < 0.05; Figure S3B). AOB1 and AOB17 were significantly higher in inorganic fertilizer (CF) than in the control amendments (NA), and AOB2 and AOB36 were significantly higher in MS and SC than in NA (Figure S3B). AOB4 was significantly higher in NA than in N fertilization amendments, and AOB12 was also significantly distinguishable in CF than in NA (Figure S3B). In Nitrosospira 3a, both AOB4 and AOB12 were found (Figure 5B). Within cluster 3c (Figure 5B), AOB18, associated with Nitrosospira sp., was significantly higher in MS than in NA (Figure S3B).
Among fertilization changes, a principal component analysis (PCA) showed no community effects on the population dynamics of the AOA amoA gene (Figure S2A). The addition of treatments resulted in apparent overlap with MS, NA, SM, and CF along the PCA1axis, with a significant dissimilarity (p < 0.01). Only SC appeared to be alone. The overall variability detected in the AOA amoA gene and AOB amoA in the microbial population under the influence of the treatments was 73.24 and 88.85%, respectively, as shown in the first two PCs (Figure S2A,B). However, the population compositions of AOB amoA in the CF and SC treatments were relatively similar to each other. The NA, MS, and SM treatments showed much variability and clustering. This indicates that the composition of microorganisms varied greatly between fertilizer additions. Accordingly, the fertilizer treated plots had a stronger influence on AOB population dynamics than those of AOA (Figure S2B).

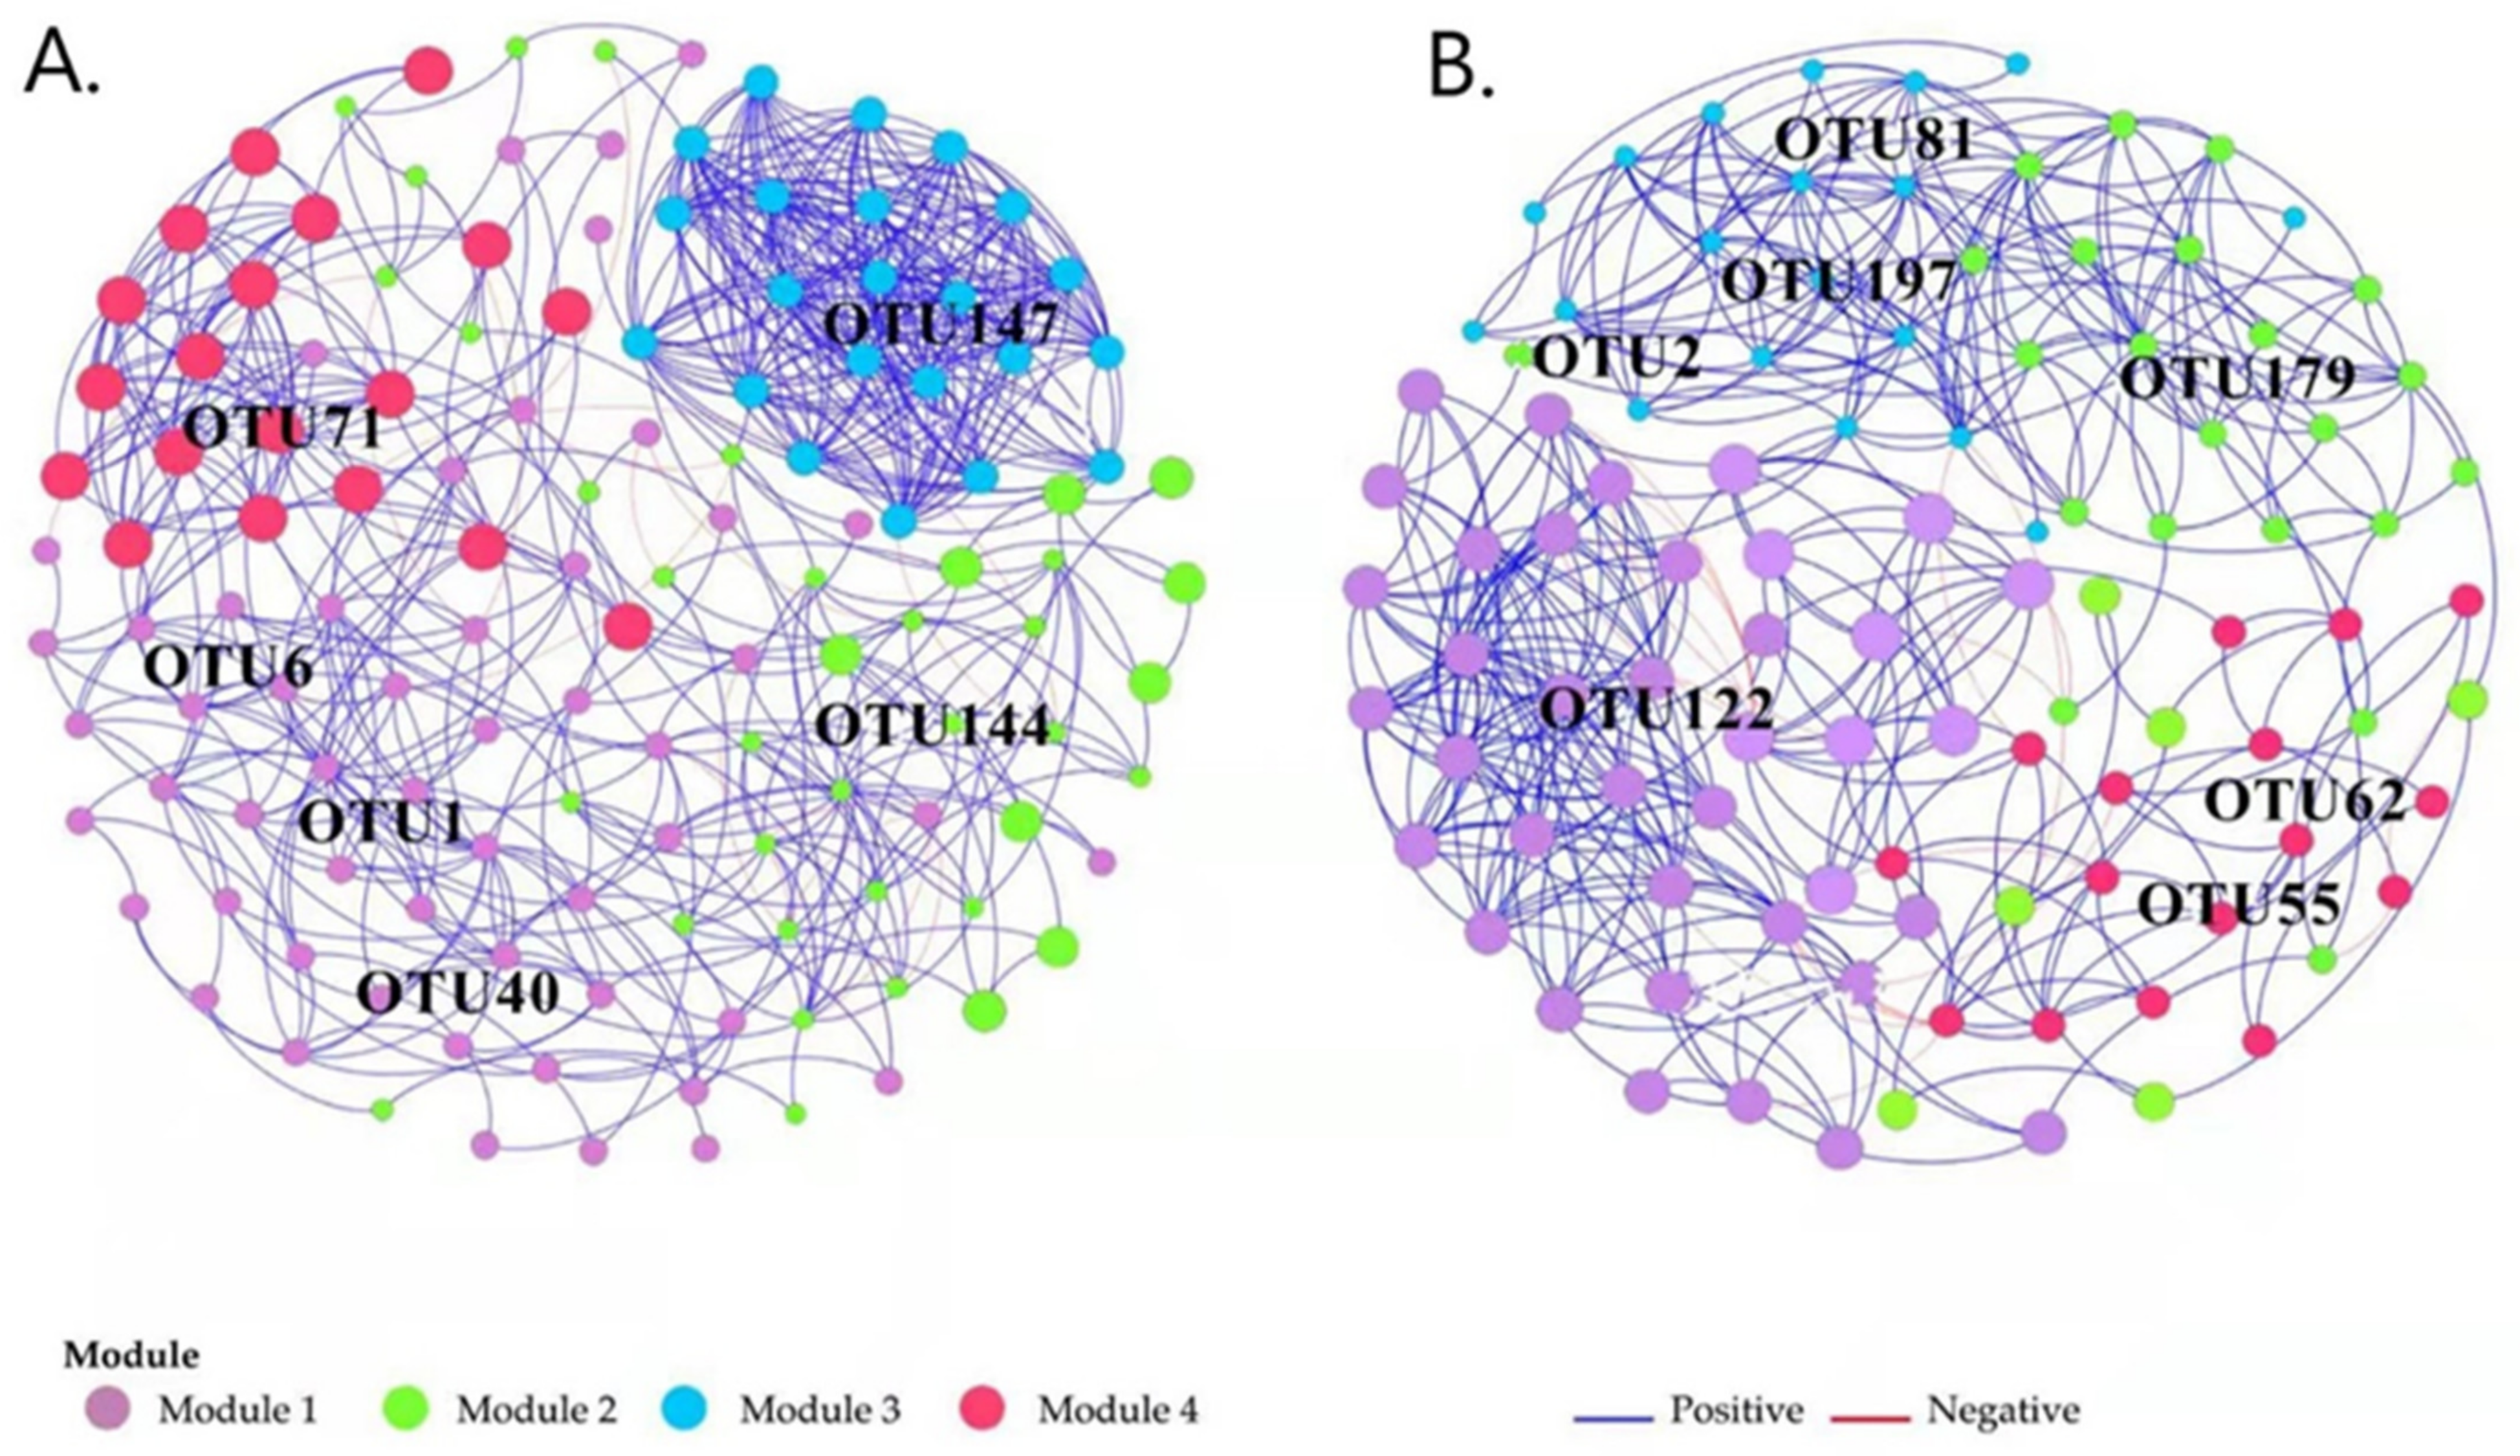
3.4. The Co-Occurrence Network of Ammonia Oxidizers and Its Association of Major Modules with Environmental Variables

Variations between the microbial populations of the AOA amoA genes and the AOB amoA genes were analyzed based on their network structure. Dominant OTU was based on treatments that had a relative abundance of OTU > 0.01. In co-occurrence networks, the treatments were grouped into four distinct modules, which we analyzed to decode module-trait relationships (Figure 6A,B). There were Modules 1 (53 nodes with 143 edges), Module 2 (37 nodes with 84 edges), Module 3 (22 nodes with 227 edges), and Module 4 (19 nodes with 84 edges) in the AOA community. The positive correlation to negative correlation proportion between AOA module 1 was higher than the Module 2, 3, 4 (120 and 23 edges, 80 and 4 edges, 227 and 0 edges, and 81 and 3 edges, respectively) (Figure 6A). However, the AOB community comprised 4 modules: Module 1 (38 nodes, 206 edges), Module 2 (28 nodes, 70 edges), Module 3 (19 nodes, 84 edges), and Module 4 (16 nodes, 84 edges). However, the AOB Module 1 (187 and 19 edges) had a more positive and negative representation than Module 2, 3, and 4 (65 and 5 edges, 69 and 0 edges, and 29 and 4 edges, respectively) (Figure 6B). Within the AOA community, the OTUs among Module 3 showed a high level of significant relationship with modules 1, 2, and 4. Within the AOB community Modules 1, 2, and 3 exhibited close relationships among themselves.
Within the AOA network, five keystone taxonomies were noticed based on the high betweenness of centrality and closeness centrality within the following modules: OTU 1, 6, 40, 144, 147, and 71 (Figure 6A). Meanwhile, within the AOB network, OTU 122, 179, 2, 81, 97, 62, and 55 across the various modules were noticed (Figure 6B). Two keystone taxonomies (OTU 144 and 147) OTUs within the AOA community and four keystone taxonomies (OUT 122, 2, 62, and 55) were affected by treatments in the AOB community at various levels within the relative abundance being significant among the OTUs within the soil (Figure 5A,B and Figure S3A,B).
Within the Pearson correlation coefficient, a relationship between the modules and biotic/abiotic variables was established (Figure 7A,B). Only Module 3 had a significant relationship with soil pH, N03-N, biomass, and nitrification (r = −0.69–0.71, p < 0.01) among the AOA community (Figure 7A). However, within the AOB community, Modules 1, 2 and 3 were significantly associated with soil pH, N03-N, SOC, biomass, AOB abundance (r = −0.56–0.57, p < 0.05), and PNA (r = −0.71, p < 0.01), respectively (Figure 7B).

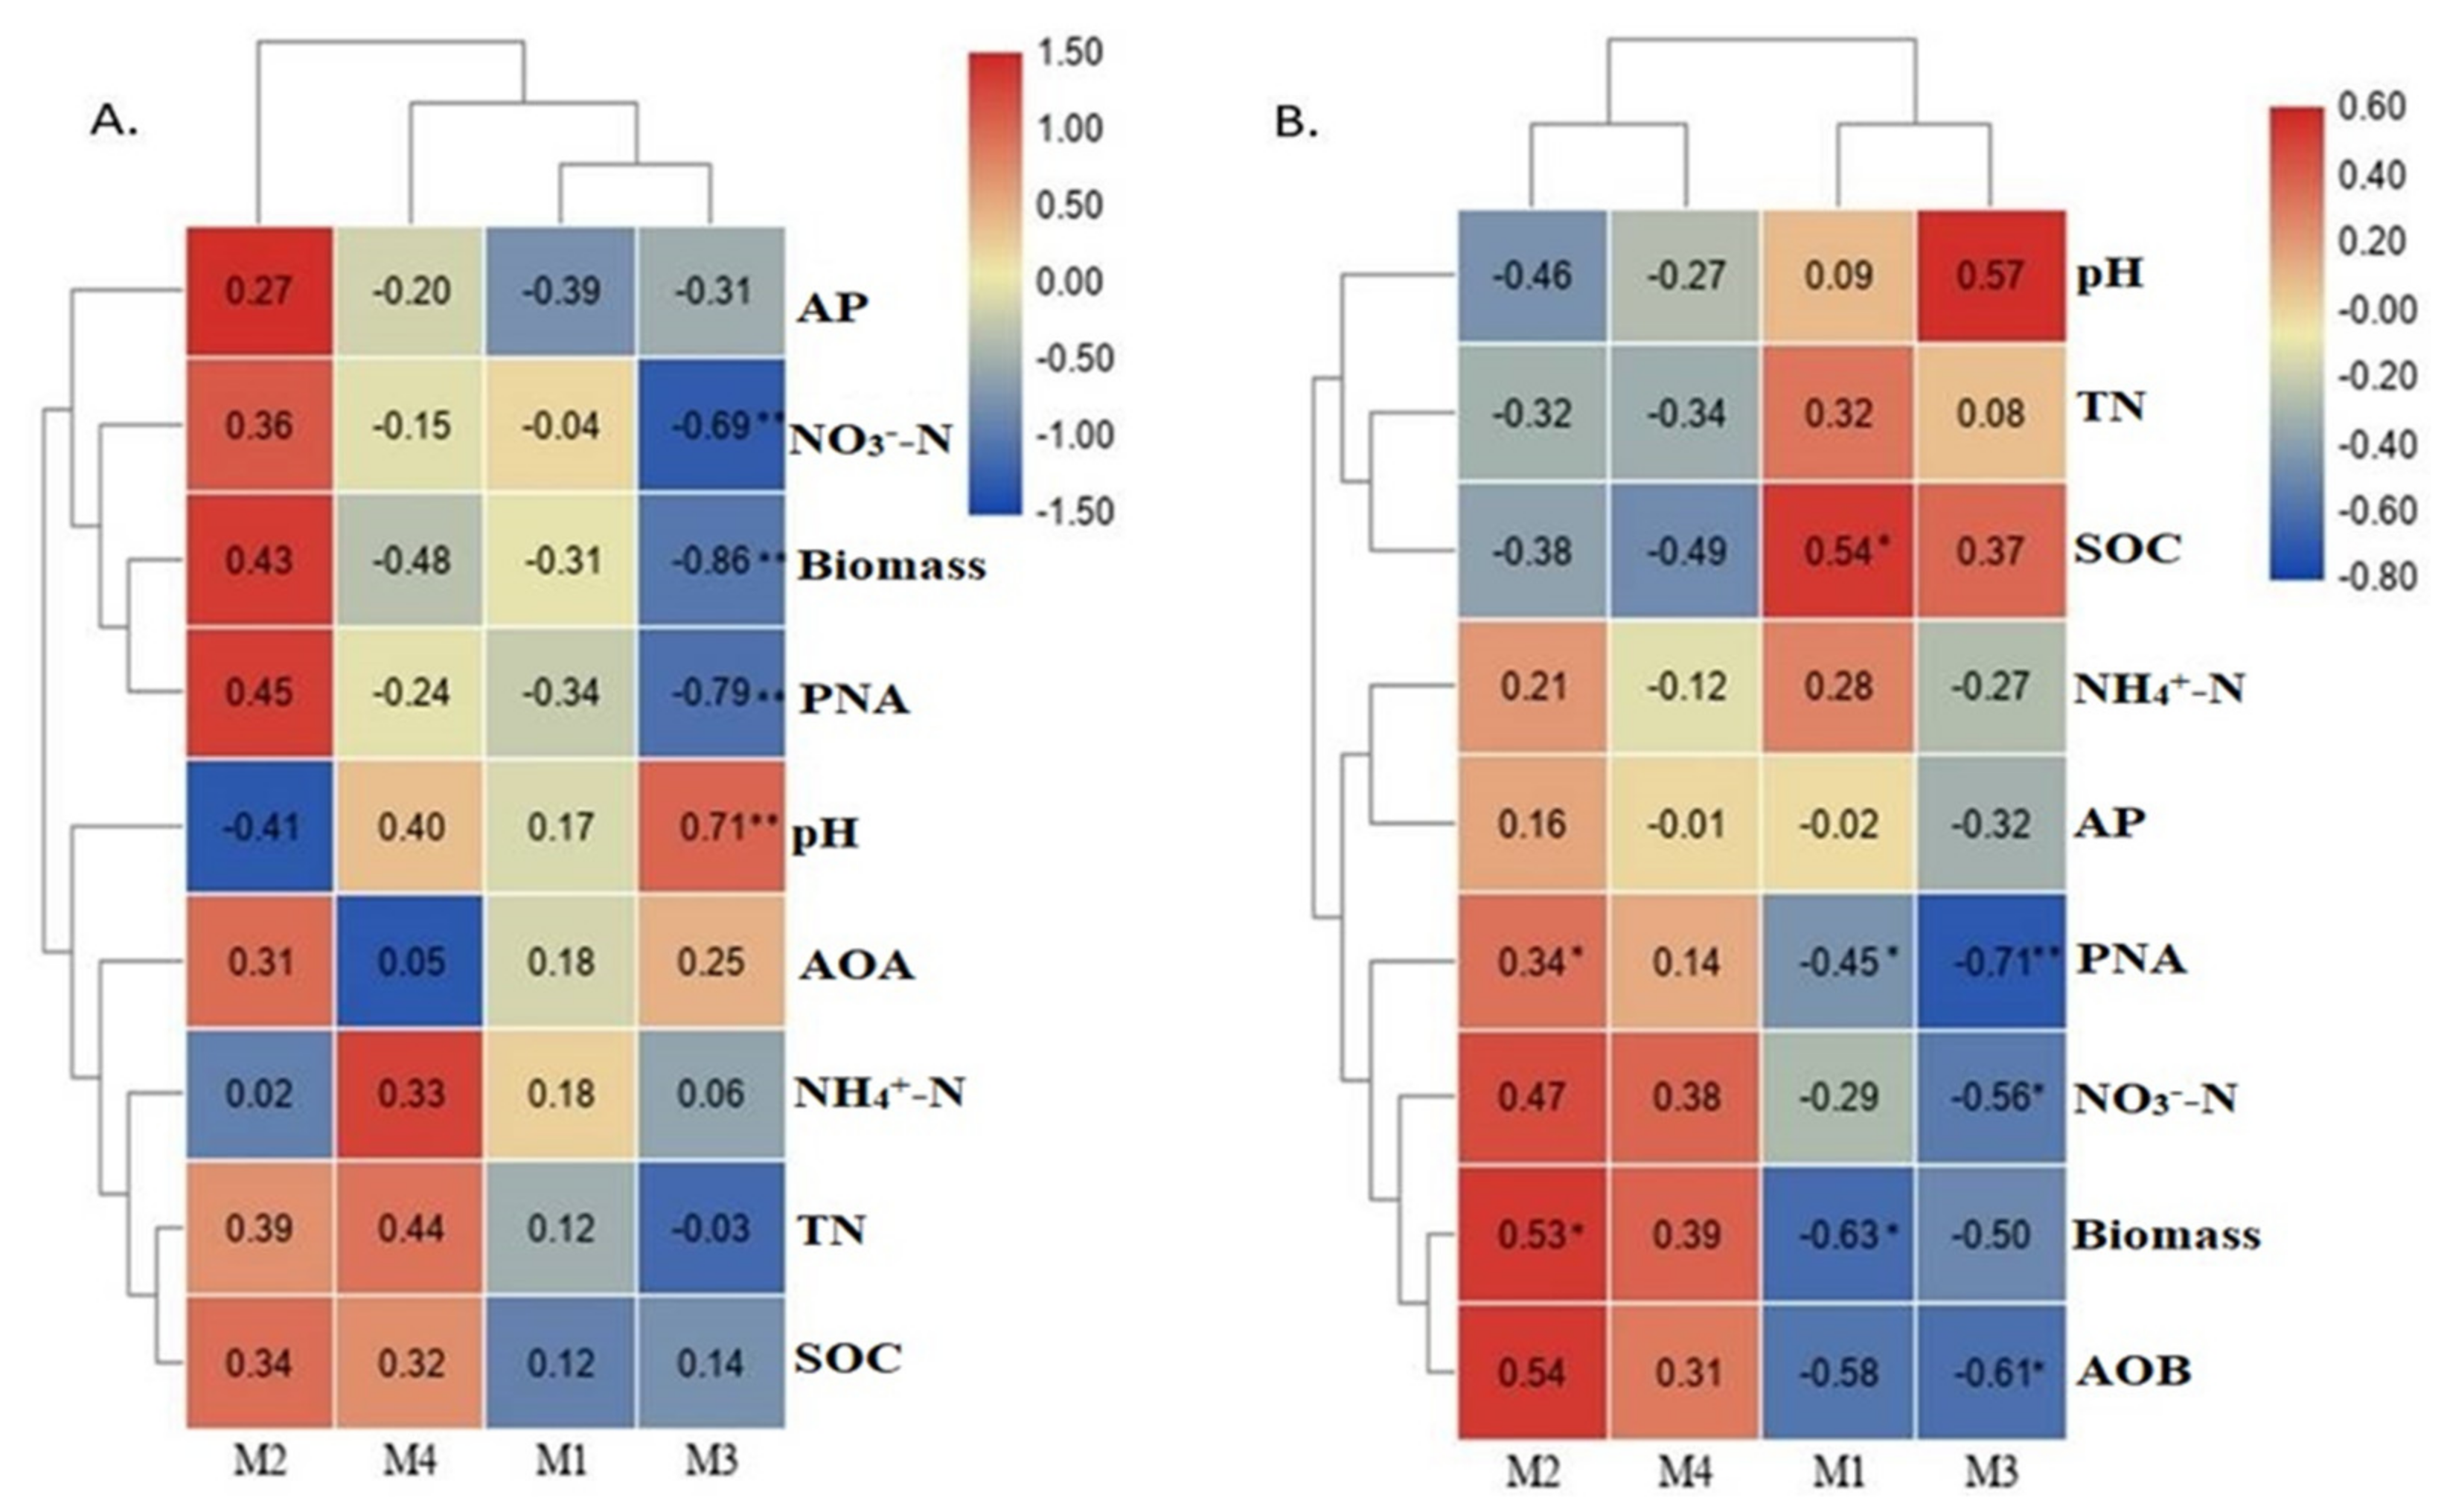
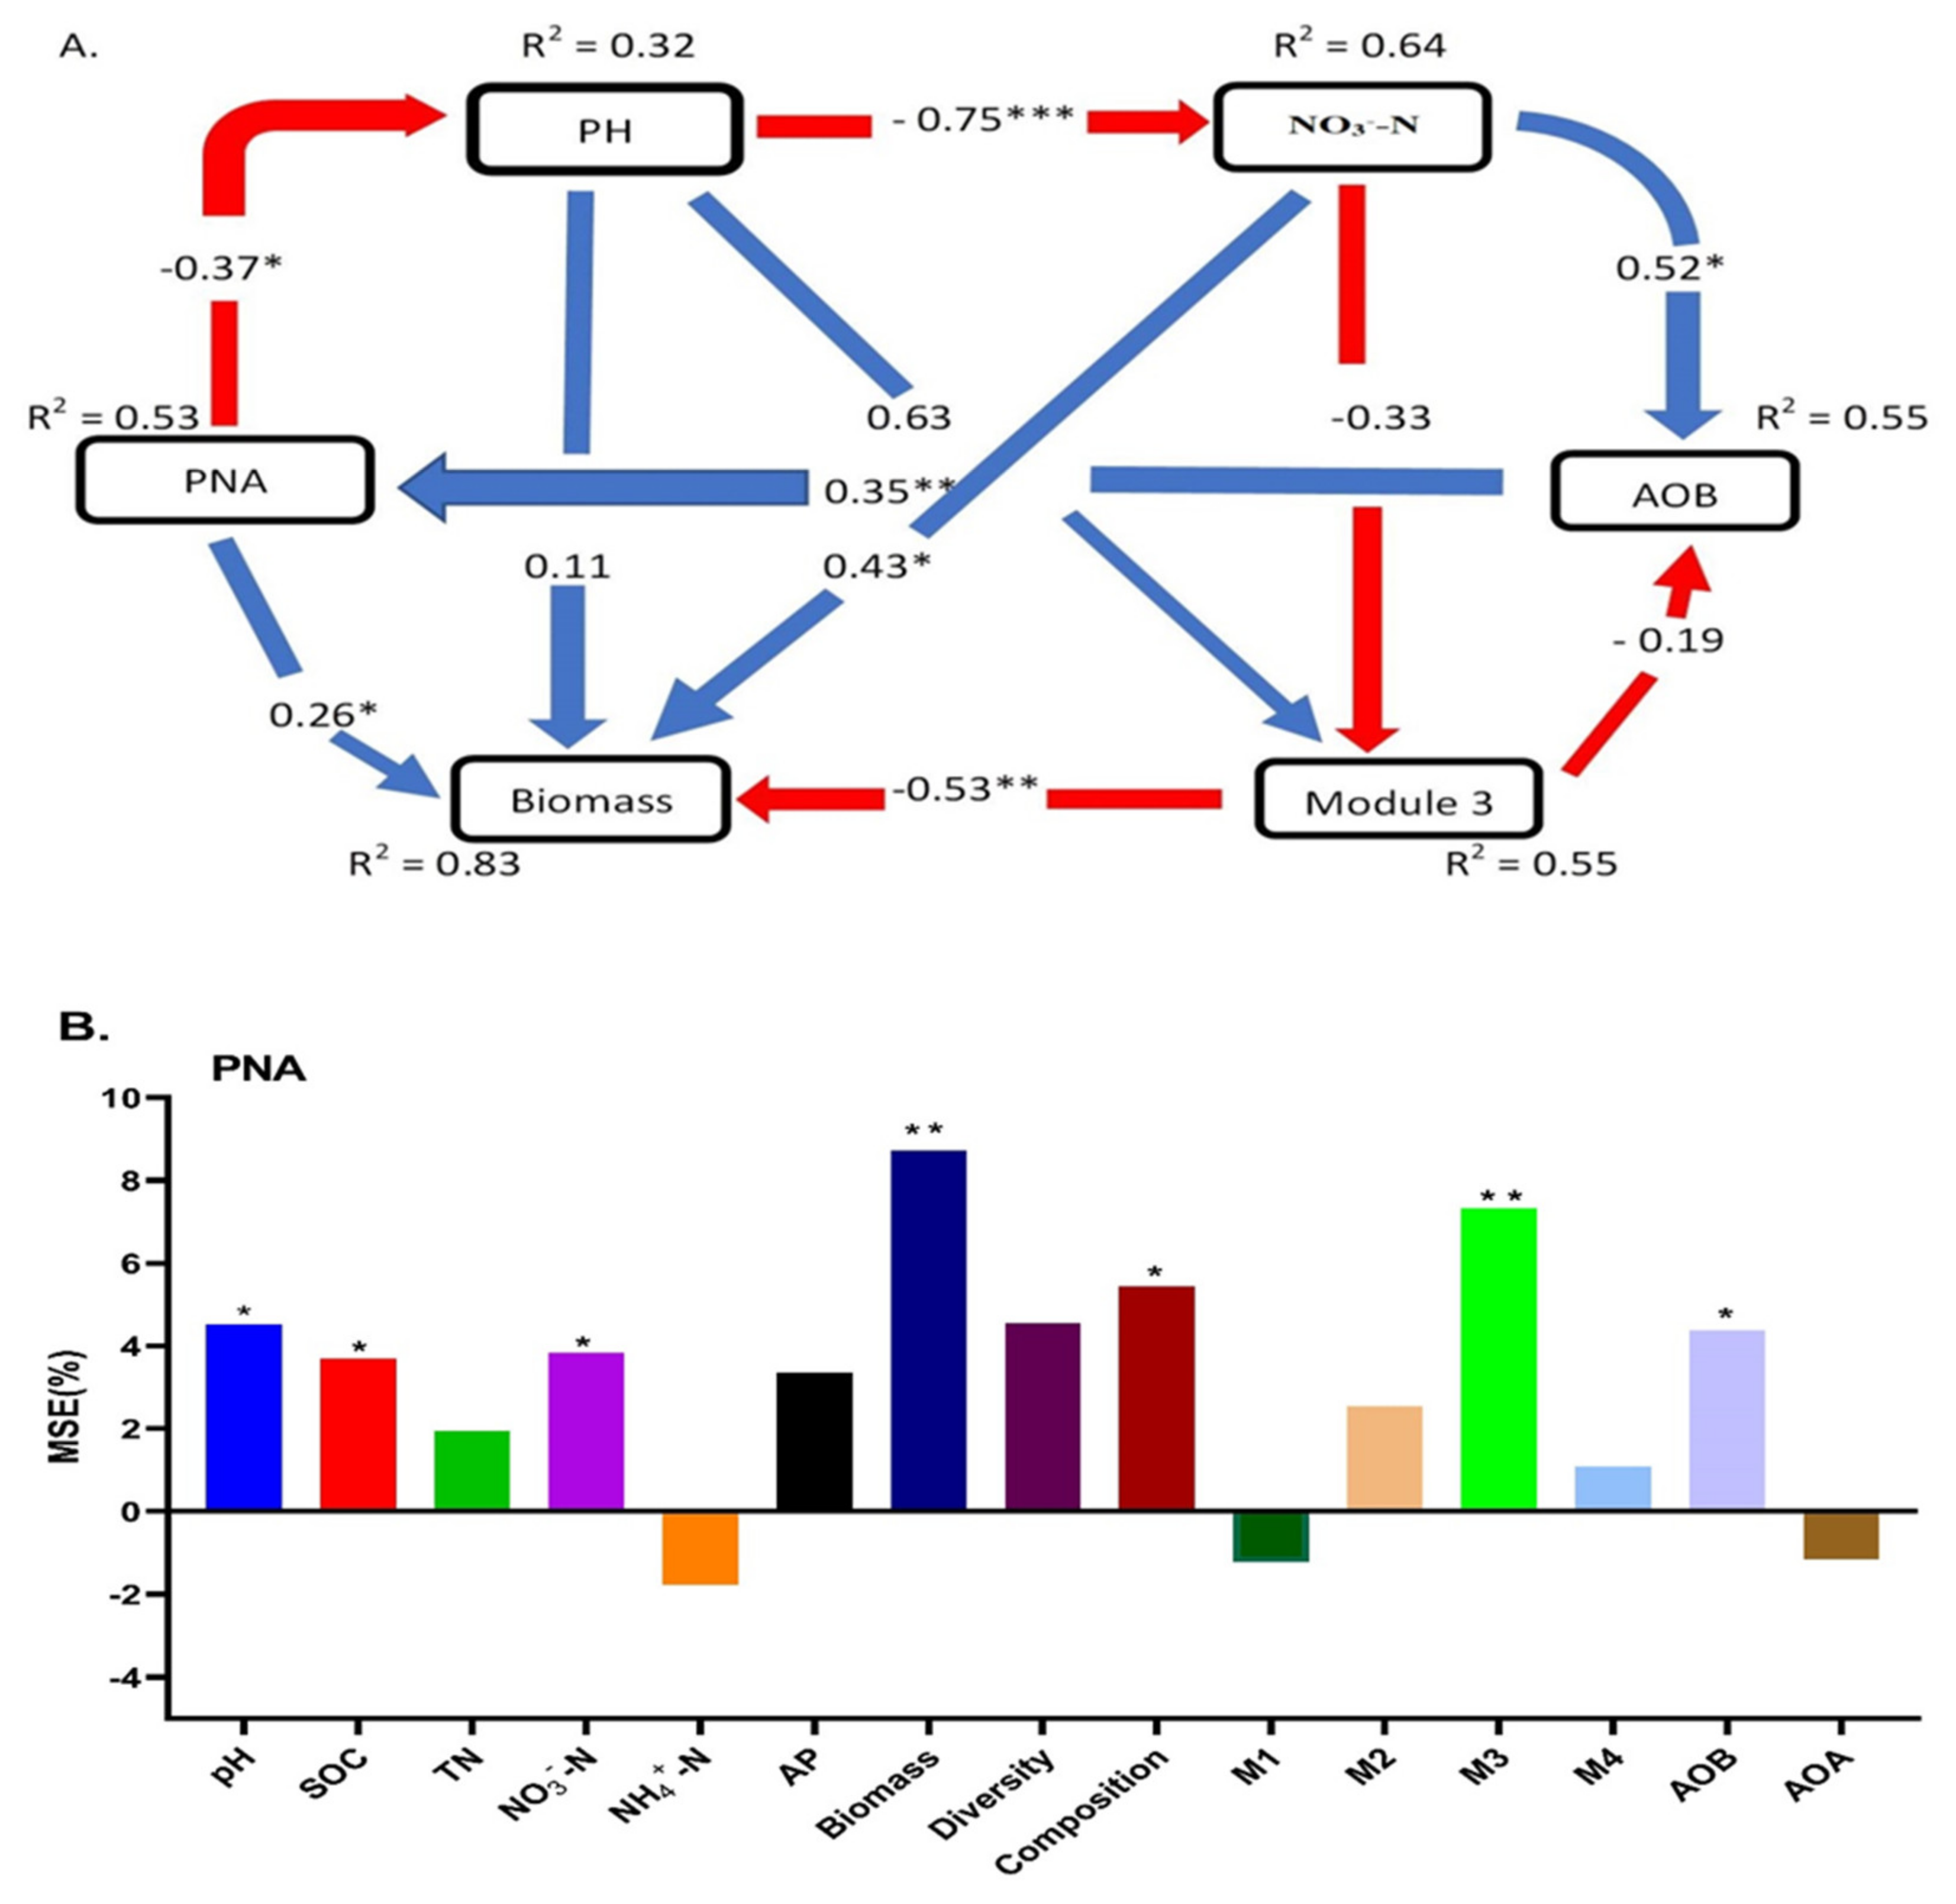
3.5. Soil Properties and Ammonia Oxidizers Regulated the PNA and Crop Productivity (Yield)

To investigate the relationship between the N fertilization changes (NA, CF, SC, SM, and MS) between the AOB abundance and the main biotic/abiotic drivers expressed in our study, a structural equation model analysis was then predicted. Fifty-five percent of the variation in AOB Abundance was expressed in our SEM model (χ2 = 6.6, degree of freedom (df) = 4, p = 0.05; root mean square errors of approximation (RMSEA) = 0.22, comparative fit index (CFI) = 0.86, Akaike information criterion (AIC) = 40.6 were clarified). PNA and NO3-N were directly affected by AOB abundance, and soil pH and biomass were also indirectly affected. PNA was positively directly influenced by soil pH, and biomass was also negatively directly influenced. NO3-N in soil was positively directly affected by biomass, and AOB abundance was positively directly influenced. Soil pH was negatively directly influenced by N03-N, while biomass was also indirectly influenced by it (Figure 8A).
We observed the following within random forest modeling of PNA: biomass, composition, module 3, soil Ph, TN, NO3-N, SOC, AP, diversity, module 2 (M2), and module 4 (M4) were the only variables that showed positive effects, while the rest had negative effects; however, none of them were significant (Figure 8B). The main drivers of abiotic variables were soil pH, SOC, AP, and NO3-N (p < 0.05), while among the biotic variables were the biomass, module 3 (M3) (p < 0.01), composition (p < 0.05), and AOB abundance (p < 0.01) (Figure 8B).

4. Discussion

4.1. The Impact of Fertilizer Treatments in Calcareous Soils on the Abundance and Diversity of AOA and AOB

Compared to the AOA amoA gene, fertilization regimes had a significant effect on AOB amoA gene’s abundance and diversity. These indicate that the AOB is a bacterial composition sensitive to changes in nitrogen input and could be used as an indicator of soil N availability [8,52]. The dominance of AOB over AOA on semi-arid loess plateau could be due to their intrinsic physiological adaptation or greater substrate affinity divergence [1,9]. Compared to AOB, the abundance of AOA in our study did not respond to urea and organic nitrogen fertilizers, and they tend to be indifferent to changes in environmental conditions and fertilization practices [42,53]. The mixotrophic lifestyle of AOA is most likely responsible for these effects. That is, as autotrophs, AOA can not only obtain energy from the oxidation of ammonia to nitrite but can also assimilate carbon and energy from organic substrates as heterotrophs [6]. In contrast to previous research in agricultural soils, the abundance of AOA improved when urea was provided as mineralized organic nitrogen from soil organic matter, as reported by Wang et al. [54]. Different fertilizers affected soil quality by changing the amount and type of nutrients, which altered AOB communities in the soil. When NO3-N is washed out with cations, protons remain in the soil and affect the abundance and population composition of AOB [6]. Compared to slow rate of decomposition of organic matter, inorganic N stimulates microbial abundance, which increases total biomass over plant nutrients [53,55].
Shannon population AOB has the potential to alter soil pH, which influences variations generated by N inputs within AOB diversity [42,56,57]. Zhang et al. [15] also discovered that pH was an important determinant of AOB abundance. The narrow pH gradient of the study area (8.3 to 8.7) altered the abundance and diversity of the AOB community by showing that moderately alkaline soil conditions were preferable to moderately acidic soil conditions [42,53]. In contrast, the addition of TN to soil was an important determinant of out AOA community composition (Figure 4). Nitrogen contained in urea was rapidly degraded, and AOA’s diversity composition could be influenced by the degradation of cow manure and corn stalks [9,54,58].

4.2. The Changes in the Co-Occurrence Network of AOA and AOB Communities among Soil Amendments

External factors can strongly influence the dynamics of microbial networks and ecosystem processes as a result of various environmental changes [22]. Based on the microbial diversity results, the network analysis in Figure 6A,B showed the highest number of edges within the AOA community, which could be attributed to the dominant OTUs with a relative abundance of 0.01 or more (Figure 6A) [21]. Nevertheless, the AOB modules were more strongly associated with abiotic and biotic variables than the AOA community. This could be because microbial taxonomy depends on environmental factors such as soil treatment, which in turn affects microbial diversity. These results are consistent with a previous study by Zhang et al. [15], who found that the fertilization of upland soils reduces the size of the bacterial population network while increasing the complexity of the bacterial network. Nitrososphaera exhibits non-thermophilic properties in calcareous soils [8]. The major genera of AOB bacteria identified in previous studies included Nitrosospira and Nitrosovibrio [5]. Nitrosospira was the most important genus within the study of AOB (99.5%), and this may be due to the strong homology values. The genera Nitrosospira and Nitrosovibrio were indistinguishable from each other; they facilitate the process of nitrate oxidation in soil due to the high affinity for their substrate [5,42]. Soil pH is a primary driver for regulating the abundance and diversity of AOB [1,15]. AOB abundance directly affects soil properties such as pH and NO3-N, as well as PNA in most arid regions (Figure 8A). N is one of the major nutrients that improve the productivity and decomposition of organic matter in calcareous soils [3,8]. Furthermore, we discovered that NO3-N is a suitable soil nutrient for maintaining metabolic activities in the link between the AOB amoA gene, module 3, PNA, and biomass [53,54,56]. Our study results showed a strong association between SOC, biomass, and AOB abundance across module 1 of the AOB co-occurrence network. Organic C is a critical nutrient assimilated through the stem as it acts indirectly through the plant and microbial N utilization for microbial growth in calcareous soils [14,52]. SC and SM treatment play a key role in supplying carbon to the soil, which promotes an increase in biomass yield and carbon stability in the soil [55].

4.3. Relative Contributions of AOA and AOB Community to Soil Nitrification

Synergistic effects among microbial communities involved in N cycling predominate in upland soils, which could be one of the explanations for these mechanisms associated with AOB nitrification rates in drylands [13,17]. Since the abundance and diversity of AOA are driven by low N concentration, low SOC content, and low pH within the N cycle, it has little influence in our studies [5,58]. AOB is more significant than AOA in the oxidation of ammonia. The addition of urea-based N significantly increased soil NO3-N concentration (Table S1), which is a direct substrate indicator for ammonia oxidizers and has the potential to stimulate ammonia oxidizer growth. This implies that AOB rapidly oxidizes NH4+-N, leading to NO3-N nitrification [8,54], which generates protons and NO3. This trend may be due to different sensitivities that better reflect nitrification shifts in calcareous soils under long-term fertilization [1,7,59]. In agricultural soils with high N content, AOB is often functionally more important for nitrification than the AOA community [5,9]. The exclusion of a significant association between AOA amoA gene copies and nitrification potential in our study does not rule out the possibility that AOA is involved in ammonia oxidation in this soil. According to previous studies, the AOA community might play a consistent role that differs with fertilizer treatment applications and soil type [5]. We also found that AOB was responsible for 80–90 percent of nitrification, with AOA accounting for the difference. AOA has been shown to drive the conversion of NH4+ to NO3 in N-limited environments [10,58]. According to Prosser and Nicol et al. [60], the high specific cell activity of AOB helps in ammonia oxidation. Wang et al. [61] found that N-rich soils have P-releasing enzymes that increase P and N cycling, which is consistent with our results; we discovered a significant relationship between PNA and AP. We also found that the Shannon index of AOB contributed more to nitrification, resulting in high NO3-N. This may be attributed to increased soil fertility, and ammonia oxidation concentrations in alkaline soils [1,8].
Phylogenetic analyses provide the hierarchical architecture of nature by clustering microbes based on lineages, evolutionarily conserved, as well as ecological niches, and they provide a tool for predicting specific ecosystem functions [19]. The Nitrososphaera cluster group.I.1b within the archaeal amoA OTUs (Figure 5A) was the best-known lineage commonly found in agricultural soils [5,8]. The dominant AOA OTUs were associated with Nitrososphaera gargensis and Nitrososphaera viennensis, both belonging to the group.I.1. b (Nitrososphaera cluster) and are normally found in soils [62]. In slightly neutral and calcareous soils, the dominant active AOA is mineral N, which is functionally degraded after long-term fertilization [12]. The high proportion of mineral N fertilizer (CF) and control amendments (NA) found in our study area may have influenced Nitrososphaera group I.1. b OTUs (Figure S3A), which is consistent with previous studies [9,42,59]. The AOB populations were abundant within Nitrosospira (Figure 5B). This could be due to the high N requirement, which is consistent with other results showing that cluster 3b dominates in neutral and calcareous soils due to high N content [8,9,54]. The predominance of Nitrosospira Cluster 3 in arable soils with efficient nitrification may be due to the long-term application of inorganic and organic fertilizers. However, the application of both CF and SC treatments (Figure S3B) had a great influence on Nitrosospira cluster 3b in soil [5,12,54]. These results suggest that soil amendment significantly affects the composition of microbial diversity in calcareous soils.

5. Conclusions

The results of this study show that AOB contributes more to nitrification in agricultural calcareous soils than AOA. The application of mineral fertilizer plus cow manure (SC) and inorganic fertilizer (CF) significantly increased the abundance and diversity of AOB in the population and also changed the ecosystem composition, according to the results of high pyrosequencing (amoA-OTU). The higher Urea-N inputs within the N treatment significantly affected the abundance and population composition of AOB and increased the biomass but had little effect on AOA. We found that AOB significantly contributed to potential nitrification, while AOA did not. The relative abundance of Nitrosospira Cluster 3b was increased by the CF and SC treatments, but the relative abundance of Nitrosospira cluster 3a was decreased in AOB. Although chemical fertilizers altered soil nutrients in AOB abundance, they may have long-term negative effects, such as minimal interaction of the bacterial microbiome, which may lead to soil ecosystem instability and development sustainability. The integrated use of organic and inorganic fertilizers is recommended to increase soil fertility and productivity while enhancing the soil microbial community. However, further studies in the future should include stable-isotope probing to improve the understanding of metabolic processes in microorganisms.

Supplementary Materials

The following are available online at https://www.mdpi.com/article/10.3390/land10101039/s1, Figure S1. The potential nitrification rate (PNR) and the correlation between PNR and AOA (A) and AOB (B) gene copy numbers. Figure S2A,B: Principal component analysis as impacted by the fertilizer regime. (A). Ammonia-oxidizing archaea (amoA AOA gene) and (B). Ammonia-oxidizing bacteria (amoA AOB gene). NA = no fertilization; SM = cow manure; CF = chemical fertilizer; SC= chemical fertilizer + cow manure; MS = corn stalk. Figure S3A,B: Relative abundances of selected Genus cluster of AOA (A) and AOB (B) among dominant 200 OTUs, which were significantly changed by N fertilization amendments. Table S1. Pearson’s correlation between gene copies of the bacterial (AOB) and archaeal (AOA) amoA abundance, PNA, and soil properties.

Author Contributions

Conceptualization, S.K.F. and L.L.; methodology, L.L. and S.K.F.; validation, S.K.F.; resources, J.X. and L.W.; data curation, S.K.F. and J.W.; writing—original draft preparation, S.K.F.; writing—review and editing, Y.J., B.K., S.A. and L.L.; visualization, S.K.F.; supervision, L.L. and Y.J.; project administration, J.X. All authors have read and agreed to the published version of the manuscript.

Funding

The research was supported by the Education science and technology innovation project of Gansu Province (GSSYLXM-02) and the National Natural Science Foundation of China (31761143004). The Young Instructor Fund Project of Gansu Agricultural University (GAU-QDFC-2020-03).

Institutional Review Board Statement

Not applicable.

Informed Consent Statement

Not applicable.

Data Availability Statement

Not applicable.

Acknowledgments

We appreciate the excellent technical assistance for field sampling and laboratory tests provided by undergraduate and graduate students at the Gansu Agricultural University Rainfed Agricultural Experimental Station.

Conflicts of Interest

The authors declare no conflict of interest.

References

  1. Tao, R.; Wakelin, S.; Liang, Y.; Chu, G. Response of ammonia-oxidizing archaea and bacteria in calcareous soil to mineral and organic fertilizer application and their relative contribution to nitrification. Soil Biol. Biochem. 2017, 114, 20–30. [Google Scholar] [CrossRef]
  2. Zhang, F.; Zhang, W.; Qi, J.; Li, F.-M. A regional evaluation of plastic film mulching for improving crop yields on the Loess Plateau of China. Agric. For. Meteorol. 2018, 248, 458–468. [Google Scholar] [CrossRef]
  3. Bu, L.-D.; Liu, J.-L.; Zhu, L.; Luo, S.-S.; Chen, X.-P.; Li, S.-Q. Attainable yield achieved for plastic film-mulched maize in response to nitrogen deficit. Eur. J. Agron. 2014, 55, 53–62. [Google Scholar] [CrossRef]
  4. Wessén, E.; Nyberg, K.; Jansson, J.; Hallin, S. Responses of bacterial and archaeal ammonia oxidizers to soil organic and fertilizer amendments under long-term management. Appl. Soil Ecol. 2010, 45, 193–200. [Google Scholar] [CrossRef] [Green Version]
  5. Ouyang, Y.; Norton, J.M.; Stark, J.M.; Reeve, J.R.; Habteselassie, M.Y. Ammonia-oxidizing bacteria are more responsive than archaea to nitrogen source in an agricultural soil. Soil Biol. Biochem. 2016, 96, 4–15. [Google Scholar] [CrossRef] [Green Version]
  6. Levičnik-Höfferle, Š.; Nicol, G.W.; Ausec, L.; Mandić-Mulec, I.; Prosser, J.I. Stimulation of thaumarchaeal ammonia oxidation by ammonia derived from organic nitrogen but not added inorganic nitrogen. FEMS Microbiol. Ecol. 2012, 80, 114–123. [Google Scholar] [CrossRef]
  7. Jia, Z.; Conrad, R. Bacteriarather than Archaeadominate microbial ammonia oxidation in an agricultural soil. Environ. Microbiol. 2009, 11, 1658–1671. [Google Scholar] [CrossRef]
  8. Li, X.; Wang, Y.; Zhang, Y.; Lang, M.; Christie, P.; Bei, S.; Zhang, J. Dynamics of ammonia oxidizers in response to different fertilization inputs in intensively managed agricultural soils. Appl. Soil Ecol. 2021, 157, 103729. [Google Scholar] [CrossRef]
  9. Eshen, J.-P.; Ezhang, L.-M.; Di, H.J.; He, J.-Z. A review of ammonia-oxidizing bacteria and archaea in Chinese soils. Front. Microbiol. 2012, 3, 296. [Google Scholar] [CrossRef] [Green Version]
  10. Erguder, T.H.; Boon, N.; Wittebolle, L.; Marzorati, M.; Verstraete, W. Environmental factors shaping the ecological niches of ammonia-oxidizing archaea. FEMS Microbiol. Rev. 2009, 33, 855–869. [Google Scholar] [CrossRef] [Green Version]
  11. Hink, L.; Gubry-Rangin, C.; Nicol, G.; Prosser, J.I. The consequences of niche and physiological differentiation of archaeal and bacterial ammonia oxidisers for nitrous oxide emissions. ISME J. 2018, 12, 1084–1093. [Google Scholar] [CrossRef]
  12. Kong, Y.; Ling, N.; Xue, C.; Chen, H.; Ruan, Y.; Guo, J.; Zhu, C.; Wang, M.; Shen, Q.; Guo, S. Long-term fertilization regimes change soil nitrification potential by impacting active autotrophic ammonia oxidizers and nitrite oxidizers as assessed by DNA stable isotope probing. Environ. Microbiol. 2019, 21, 1224–1240. [Google Scholar] [CrossRef] [PubMed]
  13. Bei, S.; Zhang, Y.; Li, T.; Christie, P.; Li, X.; Zhang, J. Response of the soil microbial community to different fertilizer inputs in a wheat-maize rotation on a calcareous soil. Agric. Ecosyst. Environ. 2018, 260, 58–69. [Google Scholar] [CrossRef]
  14. He, Y.; Zhang, W.; Xu, M.; Tong, X.; Sun, F.; Wang, J.; Huang, S.; Zhu, P.; He, X. Long-term combined chemical and manure fertilizations increase soil organic carbon and total nitrogen in aggregate fractions at three typical cropland soils in China. Sci. Total Environ. 2015, 532, 635–644. [Google Scholar] [CrossRef] [PubMed]
  15. Zhang, M.; Zhang, X.; Zhang, L.; Zeng, L.; Liu, Y.; Wang, X.; He, P.; Li, S.; Liang, G.; Zhou, W.; et al. The stronger impact of inorganic nitrogen fertilization on soil bacterial community than organic fertilization in short-term condition. Geoderma 2021, 382, 114752. [Google Scholar] [CrossRef]
  16. Pan, Y.; Cassman, N.; de Hollander, M.; Mendes, L.W.; Korevaar, H.; Geerts, R.H.; van Veen, J.A.; Kuramae, E.E. Impact of long-term N, P, K, and NPK fertilization on the composition and potential functions of the bacterial community in grassland soil. FEMS Microbiol. Ecol. 2014, 90, 195–205. [Google Scholar] [CrossRef]
  17. Muema, E.; Cadisch, G.; Röhl, C.; Vanlauwe, B.; Rasche, F. Response of ammonia-oxidizing bacteria and archaea to biochemical quality of organic inputs combined with mineral nitrogen fertilizer in an arable soil. Appl. Soil Ecol. 2015, 95, 128–139. [Google Scholar] [CrossRef]
  18. Fierer, N.; Leff, J.W.; Adams, B.J.; Nielsen, U.N.; Bates, S.T.; Lauber, C.L.; Owens, S.; Gilbert, J.A.; Wall, D.H.; Caporaso, J.G. Cross-biome metagenomic analyses of soil microbial communities and their functional attributes. Proc. Natl. Acad. Sci. USA 2012, 109, 21390–21395. [Google Scholar] [CrossRef] [Green Version]
  19. Goberna, M.; Verdú, M. Phylogenetic-scale disparities in the soil microbial diversity–ecosystem functioning relationship. ISME J. 2018, 12, 2152–2162. [Google Scholar] [CrossRef] [Green Version]
  20. Xue, C.; Zhang, X.; Zhu, C.; Zhao, J.; Zhu, P.; Peng, C.; Ling, N.; Shen, Q. Quantitative and compositional responses of ammonia-oxidizing archaea and bacteria to long-term field fertilization. Sci. Rep. 2016, 6, 28981. [Google Scholar] [CrossRef] [Green Version]
  21. He, H.; Miao, Y.; Zhang, L.; Chen, Y.; Gan, Y.; Liu, N.; Dong, L.; Dai, J.; Chen, W. The Structure and Diversity of Nitrogen Functional Groups from Different Cropping Systems in Yellow River Delta. Microorganisms 2020, 8, 424. [Google Scholar] [CrossRef] [Green Version]
  22. Mamet, S.D.; Redlick, E.; Brabant, M.; Lamb, E.G.; Helgason, B.L.; Stanley, K.; Siciliano, S. Structural equation modeling of a winnowed soil microbiome identifies how invasive plants re-structure microbial networks. ISME J. 2019, 13, 1988–1996. [Google Scholar] [CrossRef] [PubMed]
  23. Yang, Z.; Guan, Y.; Bello, A.; Wu, Y.; Ding, J.; Wang, L.; Ren, Y.; Chen, G.; Yang, W. Dynamics of ammonia oxidizers and denitrifiers in response to compost addition in black soil, Northeast China. PeerJ 2020, 8, e8844. [Google Scholar] [CrossRef] [PubMed] [Green Version]
  24. Ouyang, Y.; Evans, S.E.; Friesen, M.; Tiemann, L.K. Effect of nitrogen fertilization on the abundance of nitrogen cycling genes in agricultural soils: A meta-analysis of field studies. Soil Biol. Biochem. 2018, 127, 71–78. [Google Scholar] [CrossRef]
  25. Wang, F.; Li, Z.; Wei, Y.; Su, F.; Guo, H.; Guo, J.; Wang, Y.; Zhang, Y.; Hu, S. Responses of soil ammonia-oxidizing bacteria and archaea to short-term warming and nitrogen input in a semi-arid grassland on the Loess Plateau. Eur. J. Soil Biol. 2021, 102, 103267. [Google Scholar] [CrossRef]
  26. Gong, Z.; Zhang, X.; Chen, J.; Zhang, G. Origin and development of soil science in ancient China. Geoderma 2003, 115, 3–13. [Google Scholar] [CrossRef]
  27. FAO. Soil Map of the World: Revised Legend; World Soil Resources Report 60; Food and Agriculture Organization of the United Nations: Rome, Italy, 1990. [Google Scholar]
  28. Lamptey, S.; Xie, J.; Li, L.; Coulter, J.A.; Jagadabhi, P.S.; Li, X. Influence of Organic Amendment on Soil Respiration and Maize Productivity in a Semi-Arid Environment. Agronomy 2019, 9, 611. [Google Scholar] [CrossRef] [Green Version]
  29. McLean, E.O. Soil pH and lime requirement. In Methods of Soil Analysis: Part 2—Chemical and Microbiological Properties; Agronomy Monograph 9; Page, A.L., Miller, R.H., Keeney, D.R., Eds.; American Society of Agronomy and Soil Science Society of America: Madison, WI, USA, 1982; pp. 199–224. [Google Scholar]
  30. Nelson, D.W.; Sommers, L.W. Total carbon, organic carbon and organic matter. In Methods of Soil Analysis. Part 2, Chemical and Microbiological Properties, 2nd ed.; Page, A.L., Miller, R.H., Keeney, D.R., Eds.; American Society of Agronomy and Soil Science: Madison, WI, USA, 1982; pp. 301–312. [Google Scholar]
  31. Bremner, J.M.; Shaw, K. Denitrification in soil. I. Methods of investigation. J. Agric. Sci. 1958, 51, 22–39. [Google Scholar] [CrossRef]
  32. Olsen, S.R.; Cole, C.V.; Watanabe, F.S.; Dean, L.A. Estimation of Available Phosphorus in Soils by Extraction with Sodium Bicarbonate; Circular 939; US Department of Agriculture: Washington, DC, USA, 1954. [Google Scholar]
  33. Bremner, J.M. Nitrogen-total. In Methods of Soil Analysis Part 3—Chemical Methods; Sparks, D.L., Page, A.L., Eds.; America Society of Agronomy, Inc.: Madison, WI, USA, 1996; pp. 1085–1121. [Google Scholar]
  34. Kurola, J.; Salkinoja-Salonen, M.; Aarnio, T.; Hultman, J.; Romantschuk, M. Activity, diversity and population size of ammonia-oxidising bacteria in oil-contaminated landfarming soil. FEMS Microbiol. Lett. 2005, 250, 33–38. [Google Scholar] [CrossRef] [Green Version]
  35. Francis, C.A.; Roberts, K.J.; Beman, J.M.; Santoro, A.; Oakley, B.B. Ubiquity and diversity of ammonia-oxidizing archaea in water columns and sediments of the ocean. Proc. Natl. Acad. Sci. USA 2005, 102, 14683–14688. [Google Scholar] [CrossRef] [Green Version]
  36. Rotthauwe, J.; Witzel, K. The Ammonia Monooxygenase Structural Gene amoA as a Functional Marker: Molecular Fine-Scale Analysis of Natural Ammonia-Oxidizing Populations. Appl. Environ. Microbiol. 1997, 63, 4704–4712. [Google Scholar] [CrossRef] [Green Version]
  37. Caporaso, J.G.; Kuczynski, J.; Stombaugh, J.; Bittinger, K.; Bushman, F.D.; Costello, E.K.; Fierer, N.; Peña, A.G.; Goodrich, J.K.; Gordon, J.I.; et al. QIIME allows analysis of high- throughput community sequencing data Intensity normalization improves color calling in SOLiD sequencing. Nat. Methods 2010, 7, 335–336. [Google Scholar] [CrossRef] [Green Version]
  38. Edgar, R.C. UPARSE: Highly accurate OTU sequences from microbial amplicon reads. Nat. Methods 2013, 10, 996–998. [Google Scholar] [CrossRef] [PubMed]
  39. Schloss, P.D.; Westcott, S.L.; Ryabin, T.; Hall, J.R.; Hartmann, M.; Hollister, E.B.; Lesniewski, R.A.; Oakley, B.B.; Parks, D.H.; Robinson, C.J.; et al. Introducing mothur: Open-Source, Platform-Independent, Community-Supported Software for Describing and Comparing Microbial Communities. Appl. Environ. Microbiol. 2009, 75, 7537–7541. [Google Scholar] [CrossRef] [PubMed] [Green Version]
  40. Fish, J.A.; Chai, B.; Wang, Q.; Sun, Y.; Brown, C.T.; Tiedje, J.M.; Cole, J.R. FunGene: The functional gene pipeline and repository. Front. Microbiol. 2013, 4, 291. [Google Scholar] [CrossRef] [PubMed] [Green Version]
  41. Tamura, K.; Stecher, G.; Peterson, D.; Filipski, A.; Kumar, S. MEGA6: Molecular Evolutionary Genetics Analysis Version 6.0. Mol. Biol. Evol. 2013, 30, 2725–2729. [Google Scholar] [CrossRef] [Green Version]
  42. Guo, J.; Ling, N.; Chen, H.; Zhu, C.; Kong, Y.; Wang, M.; Shen, Q.; Guo, S. Distinct drivers of activity, abundance, diversity and composition of ammonia-oxidizers: Evidence from a long-term field experiment. Soil Biol. Biochem. 2017, 115, 403–414. [Google Scholar] [CrossRef]
  43. Zhang, B.; Zhang, J.; Liu, Y.; Shi, P.; Wei, G. Co-occurrence patterns of soybean rhizosphere microbiome at a continental scale. Soil Biol. Biochem. 2018, 118, 178–186. [Google Scholar] [CrossRef]
  44. Benjamani, Y. Controlling the False Discovery Rate: A Practical and Powerful Approach to Multiple Testing. J. R. Stat. Soc. 1995, 57, 289–300. [Google Scholar] [CrossRef]
  45. Newman, M.E.J. Modularity and community structure in networks. Proc. Natl. Acad. Sci. USA 2006, 103, 8577–8582. [Google Scholar] [CrossRef] [Green Version]
  46. Bastian, M.; Heymann, S.; Jacomy, M. Gephi: An Open Source Software for Exploring and Manipulating Networks. In Proceedings of the Third International AAAI Conference on Weblogs and Social Media, San Jose, CA, USA, 17–20 May 2009; pp. 361–362. [Google Scholar]
  47. Langfelder, P.; Horvath, S. Eigengene networks for studying the relationships between co-expression modules. BMC Syst. Biol. 2007, 1, 54. [Google Scholar] [CrossRef] [Green Version]
  48. Liaw, A.; Wiener, M. Classification and Regression by RandomForest. R News 2002, 3, 18–22. [Google Scholar]
  49. Fortmannroe, S. A3: Accurate, Adaptable, and Accessible Error Metrics for Predictive Models; R Package Version 1.0.0; R Foundation for Statistical Computing: Vienna, Austria, 2015. [Google Scholar]
  50. Archer, E. Rfpermute: Estimate Permutation p-Values for Importance Metrics; R package Version 2.1.5; R Foundation for Statistical Computing: Vienna, Austria, 2015. [Google Scholar]
  51. Coughlan, J.; Mullen, M. Structural Equation Modelling: Guidelines for Determining Model Structural Equation Modeling: Guidelines for Determining Model Fit. Electron. J. Bus. Res. Methods 2008, 6, 53–60. [Google Scholar]
  52. Xiang, X.; He, D.; He, J.-S.; Myrold, D.D.; Chu, H. Ammonia-oxidizing bacteria rather than archaea respond to short-term urea amendment in an alpine grassland. Soil Biol. Biochem. 2017, 107, 218–225. [Google Scholar] [CrossRef]
  53. Norman, J.; Barrett, J. Substrate availability drives spatial patterns in richness of ammonia-oxidizing bacteria and archaea in temperate forest soils. Soil Biol. Biochem. 2016, 94, 169–172. [Google Scholar] [CrossRef] [Green Version]
  54. Wang, J.; Ni, L.; Song, Y.; Rhodes, G.; Li, J.; Huang, Q.; Shen, Q. Dynamic Response of Ammonia-Oxidizers to Four Fertilization Regimes across a Wheat-Rice Rotation System. Front. Microbiol. 2017, 8, 630. [Google Scholar] [CrossRef] [PubMed] [Green Version]
  55. Dong, J.; Cui, X.; Wang, S.; Wang, F.; Pang, Z.; Xu, N.; Zhao, G.; Wang, S. Changes in Biomass and Quality of Alpine Steppe in Response to N & P Fertilization in the Tibetan Plateau. PLoS ONE 2016, 11, e0156146. [Google Scholar] [CrossRef] [Green Version]
  56. Jalilian, J.; Modarres-Sanavy, S.A.M.; Saberali, S.F.; Sadat-Asilan, K. Effects of the combination of beneficial microbes and nitrogen on sunflower seed yields and seed quality traits under different irrigation regimes. Field Crop. Res. 2012, 127, 26–34. [Google Scholar] [CrossRef]
  57. Chu, H.; Fujii, T.; Morimoto, S.; Lin, X.; Yagi, K.; Hu, J.; Zhang, J. Community Structure of Ammonia-Oxidizing Bacteria under Long-Term Application of Mineral Fertilizer and Organic Manure in a Sandy Loam Soil. Appl. Environ. Microbiol. 2007, 73, 485–491. [Google Scholar] [CrossRef] [Green Version]
  58. Schauss, K.; Focks, A.; Leininger, S.; Kotzerke, A.; Heuer, H.; Thiele-Bruhn, S.; Sharma, S.; Wilke, B.-M.; Matthies, M.; Smalla, K.; et al. Dynamics and functional relevance of ammonia-oxidizing archaea in two agricultural soils. Environ. Microbiol. 2008, 11, 446–456. [Google Scholar] [CrossRef]
  59. He, J.-Z.; Shen, J.-P.; Zhang, L.; Zhu, Y.-G.; Zheng, Y.-M.; Xu, M.-G.; Di, H. Quantitative analyses of the abundance and composition of ammonia-oxidizing bacteria and ammonia-oxidizing archaea of a Chinese upland red soil under long-term fertilization practices. Environ. Microbiol. 2007, 9, 2364–2374. [Google Scholar] [CrossRef] [PubMed]
  60. Prosser, J.I.; Nicol, G.W. Archaeal and bacterial ammonia-oxidisers in soil: The quest for niche specialisation and differentiation. Trends Microbiol. 2012, 20, 523–531. [Google Scholar] [CrossRef] [PubMed] [Green Version]
  61. Wang, Y.-P.; Houlton, B.Z.; Field, C.B. A model of biogeochemical cycles of carbon, nitrogen, and phosphorus including symbiotic nitrogen fixation and phosphatase production. Glob. Biogeochem. Cycles 2007, 21, 1–15. [Google Scholar] [CrossRef]
  62. Tourna, M.; Stieglmeier, M.; Spang, A.; Könneke, M.; Schintlmeister, A.; Urich, T.; Engel, M.; Schloter, M.; Wagner, M.; Richter, A.; et al. Nitrososphaera viennensis, an ammonia oxidizing archaeon from soil. Proc. Natl. Acad. Sci. USA 2011, 108, 8420–8425. [Google Scholar] [CrossRef] [Green Version]
Figure 1. An overview of the plot showing ridges.
Land 10 01039 g001
Figure 2. (A) Soil potential nitrification activity (PNA), and (B) Aboveground biomass under diverse fertilization amendments. Bars with different alphabets (a, b, ab, b and c) show significant difference at p < 0.05, while those with a common alphabet show no significant difference (i.e., p > 0.05). NA = no fertilizer, CF = Chemical fertilizer, SC = inorganic fertilizer plus cow manure, SM = cow manure, and MS = corn stalk. The means separation was done with the Duncan Multiple Range Test at p < 0.05. The error bars represent the standard error of means of the triplicate samples.
Land 10 01039 g002
Figure 3. (A) amoA gene copy numbers of AOA and (B) AOB in calcareous soil under various fertilization practices. The different alphabets (c, a, bc and a) show significant difference at p < 0.05, while those with a common alphabet (a) show no significant difference (i.e., p > 0.05). NA = no fertilizer, CF = Chemical fertilizer, SC = inorganic fertilizer plus cow manure, SM = cow manure, and MS = corn stalk.
Land 10 01039 g003
Figure 4. Correlation coefficients between dominant functional diversity of AOA, AOB, and physio-chemical soil properties. Abbreviations: Soil pH; TN, Total Nitrogen; SOC, Soil organic carbon; NO3-N, Nitrate; NH4+-N, Ammonium N; AP, Available Phosphorous. OTUs: observed number of OTUs; Chao1: Chao1 richness index; Reads; Shannon: Shannon functional indices; Simpson: Simpson index; and Coverage. Within the cells, p values (r) between variables are plotted. Only the strongest associations are displayed. * Significant correlations are indicated at p < 0.05.
Land 10 01039 g004
Figure 5. Neighbor-joining tree of (A) amoA AOA and (B) AOB amoA genes of the 50 most abundant samples and their nearest neighbors in the custom FunGene amoA sequence database. The NCBI taxonomic classification of the database entries is included. The percentage of clone trees in which the related taxa clustered together in the bootstrap test (1000 replicates) are shown next to the branches (bootstrap value > 50 percent). The significant difference between inorganic amendment (CF) and control (NA) is represented by circle and triangle represents a significant difference between cow manure plus inorganic amendment (SC) than control (NA), the rectangle represents a significant difference between maize stove amendment (MS) than control (NA), and a diamond represents a significant difference between cow manure only (MS) than control (NA). The color blue indicates a significantly higher abundance than the control amendment, while the color red indicates a significantly lower abundance than the control.
Land 10 01039 g005
Figure 6. Network analysis of (A) amoA-AOA and (B) amoA-AOB OTUs modules. Modules consist of four clusters which are closely interconnected nodes. The node’s size is relative to the degree and the thickness is proportional to the value of correlation coefficients. Keystone taxa OTUs are labeled in the networks based on betweenness of centrality. Only OTUs with a relative abundance greater than 0.01 percent are used in the network.
Land 10 01039 g006
Figure 7. Modules association to soil physiochemical properties, PNA, and biomass; (A) AOA and (B) AOB abundance. Red color signifies positive correlation, while blue also represents negative correlations. * Stands for p < 0.05 and ** for p < 0.01. It includes the following soil properties: soil pH; SOC = soil organic carbon; total nitrogen (TN); ammonia nitrogen (NH4+-N); nitrate-nitrogen (NO3-N); and available phosphorus (AP). Biotic variables also include PNA = Potential nitrification activity and Biomass.
Land 10 01039 g007
Figure 8. (A) Influence of the direct and indirect effects on abiotic/biotic variables on ammonia-oxidizing archaea bacteria (AOB) abundance using structural equation modeling (SEM). (B) The individual significant AOB variables were selected via random forest analysis. Among the abiotic variables were soil pH and N03N, while within the biotic variables were biomass, nitrification, and Module 3. Numbers on arrows are standardized path coefficients. R2 indicates the proportion of variance explained. Results of model fitting: chi-square = 6.6, d.f = 4, p < 0.05, root mean square errors of approximation (RMSEA) = 0.22, Akaike information criterion (AIC) = 40.55. Blue and red arrows specify positive and negative respectively. *** p < 0.001; ** p < 0.01; * p < 0.05. (B) Random forest modeling was performed using our 15 soil amendments (5 treatments × 3 replications). MSE (%) = mean squared error (MSE). The total effects on AOB abundance by abiotic variables include the following soil properties: soil pH; SOC = soil organic carbon; total nitrogen (TN); ammonia nitrogen (NH4+-N); nitrate-nitrogen (N03-N); available phosphorus (AP). Biotic variables also included PNA = Potential nitrification activity, Biomass, diversity = (PCoA), composition = Shannon, and Modules 1, 2, 3, and 4, respectively.
Land 10 01039 g008
Table 1. Initial physiochemical properties in the soil before experimental setup (2019).
Soil Depth (cm)Bulk Density (mg/m3)pHTotal Nitrogen (g/kg)Total Phosphorus (g/kg)Organic C (g/kg)
0–51.198.331.050.829.91
5–101.228.321.050.748.96
10–301.288.370.940.78.89
Values are means (n = 3).
Table 2. Chemical properties of corn stalk and cow manure applied in 2019.
AmendmentOrganic CarbonNPKCaMg
Corn stalk47.50.740.380.450.550.74
Cow manure39.92.201.701.902.700.50
Values are means (n = 3). N = Nitrogen. P = Phosphorus. K = Potassium. Ca = Calcium. Mg = Magnesium.
Table 3. Soil physiochemical properties as influenced by soil amendments at flowering stage of corn.
SoilpHTNSOCNO3-NNH4+-NAP
Amendment(g/kg)(g/kg)(mg/kg)(mg/kg)(mg/kg)
NA8.66 ± 0.03 ab0.85 ± 0.01 b7.48 ± 0.18 c17.84 ± 1.04 c15.33 ± 1.63 a9.73 ± 1.41 c
CF8.32 ± 0.07 c0.93 ± 0.03 a7.93 ± 0.07 c30.81 ± 2.78 a16.07 ± 1.48 a16.70 ± 1.57 ab
SC8.44 ± 0.08 bc0.93 ± 0.02 a8.84 ± 0.20 b28.40 ± 3.57 ab14.87 ± 2.22 a18.32 ± 1.69 ab
SM8.45 ± 0.05 bc0.98 ± 0.03 a8.81 ± 0.33 b25.40 ± 3.41 abc15.81 ± 1.36 a19.81 ± 0.72 a
MS8.54 ± 0.06 b0.99 ± 0.002 a9.82 ± 0.19 a21.93 ± 1.81 bc16.53 ± 2.80 a15.14 ± 0.97 b
p-value0.0130.0010.0360.0240.1070.002
Means ± standard error (n = 3) are the values. The different alphabets (a, abc, ab and c) show significant difference at p < 0.05, while those with a common alphabet (a) show no significant difference (i.e., p > 0.05). NA, no fertilization; SM, cow manure; CF, chemical fertilizer, chemical fertilizer + cow manure (SC) and MS, maize straw.; TN, Total Nitrogen; SOC, Soil organic carbon; NO3-N, Soil nitrate-N; NH4+-N, Ammonium-N; and AP, Available Phosphorous.
Table 4. Diversity indices of ammonia-oxidizing archaea (AOA) at the similarity level of 97% under the influence of soil amendments.
TreatmentObserved SpeciesOTUsChao1ShannonSimpsonGoods Coverage
NA4865.1 ± 49.6 a518.1 ± 10.1 a629 ± 36.8 a0.9 ± 0.0 a2.9 ± 0.04 a0.21 ± 0.01 a
CF4297.9 ± 74.6 a524.3 ± 50.4 a641 ± 74.3 a0.9 ± 0.0 a3.2 ± 0.12 a0.17 ± 0.02 a
SC5331.2 ± 20.1 a557.2 ± 22.5 a643 ± 43.1 a0.9 ± 0.0 a2.98 ± 0.11 a0.12 ± 0.02 a
SM4434.3 ± 10.5 a551 ± 13.51 a631 ± 49.7 a0.9 ± 0.0 a3.04 ± 0.16 a0.19 ± 0.02 a
MS4329.4 ± 10.9 a521 ± 50.4 a618 a ± 38.2 a0.9 ± 0.1 a3.07 ± 0.33 a0.18 ± 0.01 a
p-value<0.4820.6570.9690.2960.7160.331
Table 5. Diversity indices of ammonia-oxidizing bacteria (AOB) at the similarity level of 97% under the influence of soil amendments.
TreatmentObserved SpeciesOTUsChao1ShannonSimpsonGoods Coverage
NA4111.7 ± 83.2 a1296.3 ± 147.6 a1843 ± 27.3 a4.1 ± 0.25 a0.03 ± 0.01 ab0.98 ± 0.01 a
CF3980.7 ± 56.7 a1989.6 ± 81.5 b2691 ± 23.1 b5.0 ± 0.11 b0.02 ± 0.01 a0.99 ± 0.02 a
SC4405.5 ± 77.7 a2104 ± 33.6 b3141.7 ± 51.6 b4.8 ± 0.21 b0.02 ± 0.01 a0.98 ± 0.04 a
SM5039.5 ± 57.8 a1560 ± 30.7 ab2129.3 ± 35.6 a4.5 ± 0.56 ab0.03 ± 0.01 ab0.97 ± 0.01 a
MS2153.9 ± 30.3 a1359 ± 96.2 a1877 ± 17.1 b4.4 ± 0.01 ab0.04 ± 0.01 b0.98 ± 0.02 a
p-value<0.4710.0030.0010.0490.130.205
Means ± standard error (n = 3) are the values. Means in a column with a common alphabet (a) as superscript indicate no significant difference at p < 0.05 while the different alphabets (c, a, bc and a) show significant difference at p < 0.05. NA, no fertilization; SM, cow manure; CF, chemical fertilizer, chemical fertilizer + cow manure (SC); and MS, corn stalk. Observed species = total reads.
Publisher’s Note: MDPI stays neutral with regard to jurisdictional claims in published maps and institutional affiliations.

