
Shoreline Evolution and Environmental Changes at the NW Area of the Gulf of Gela (Sicily, Italy)

 ,
,  ,
,  ,
,  ,
,  and
and 
Abstract
1. Introduction
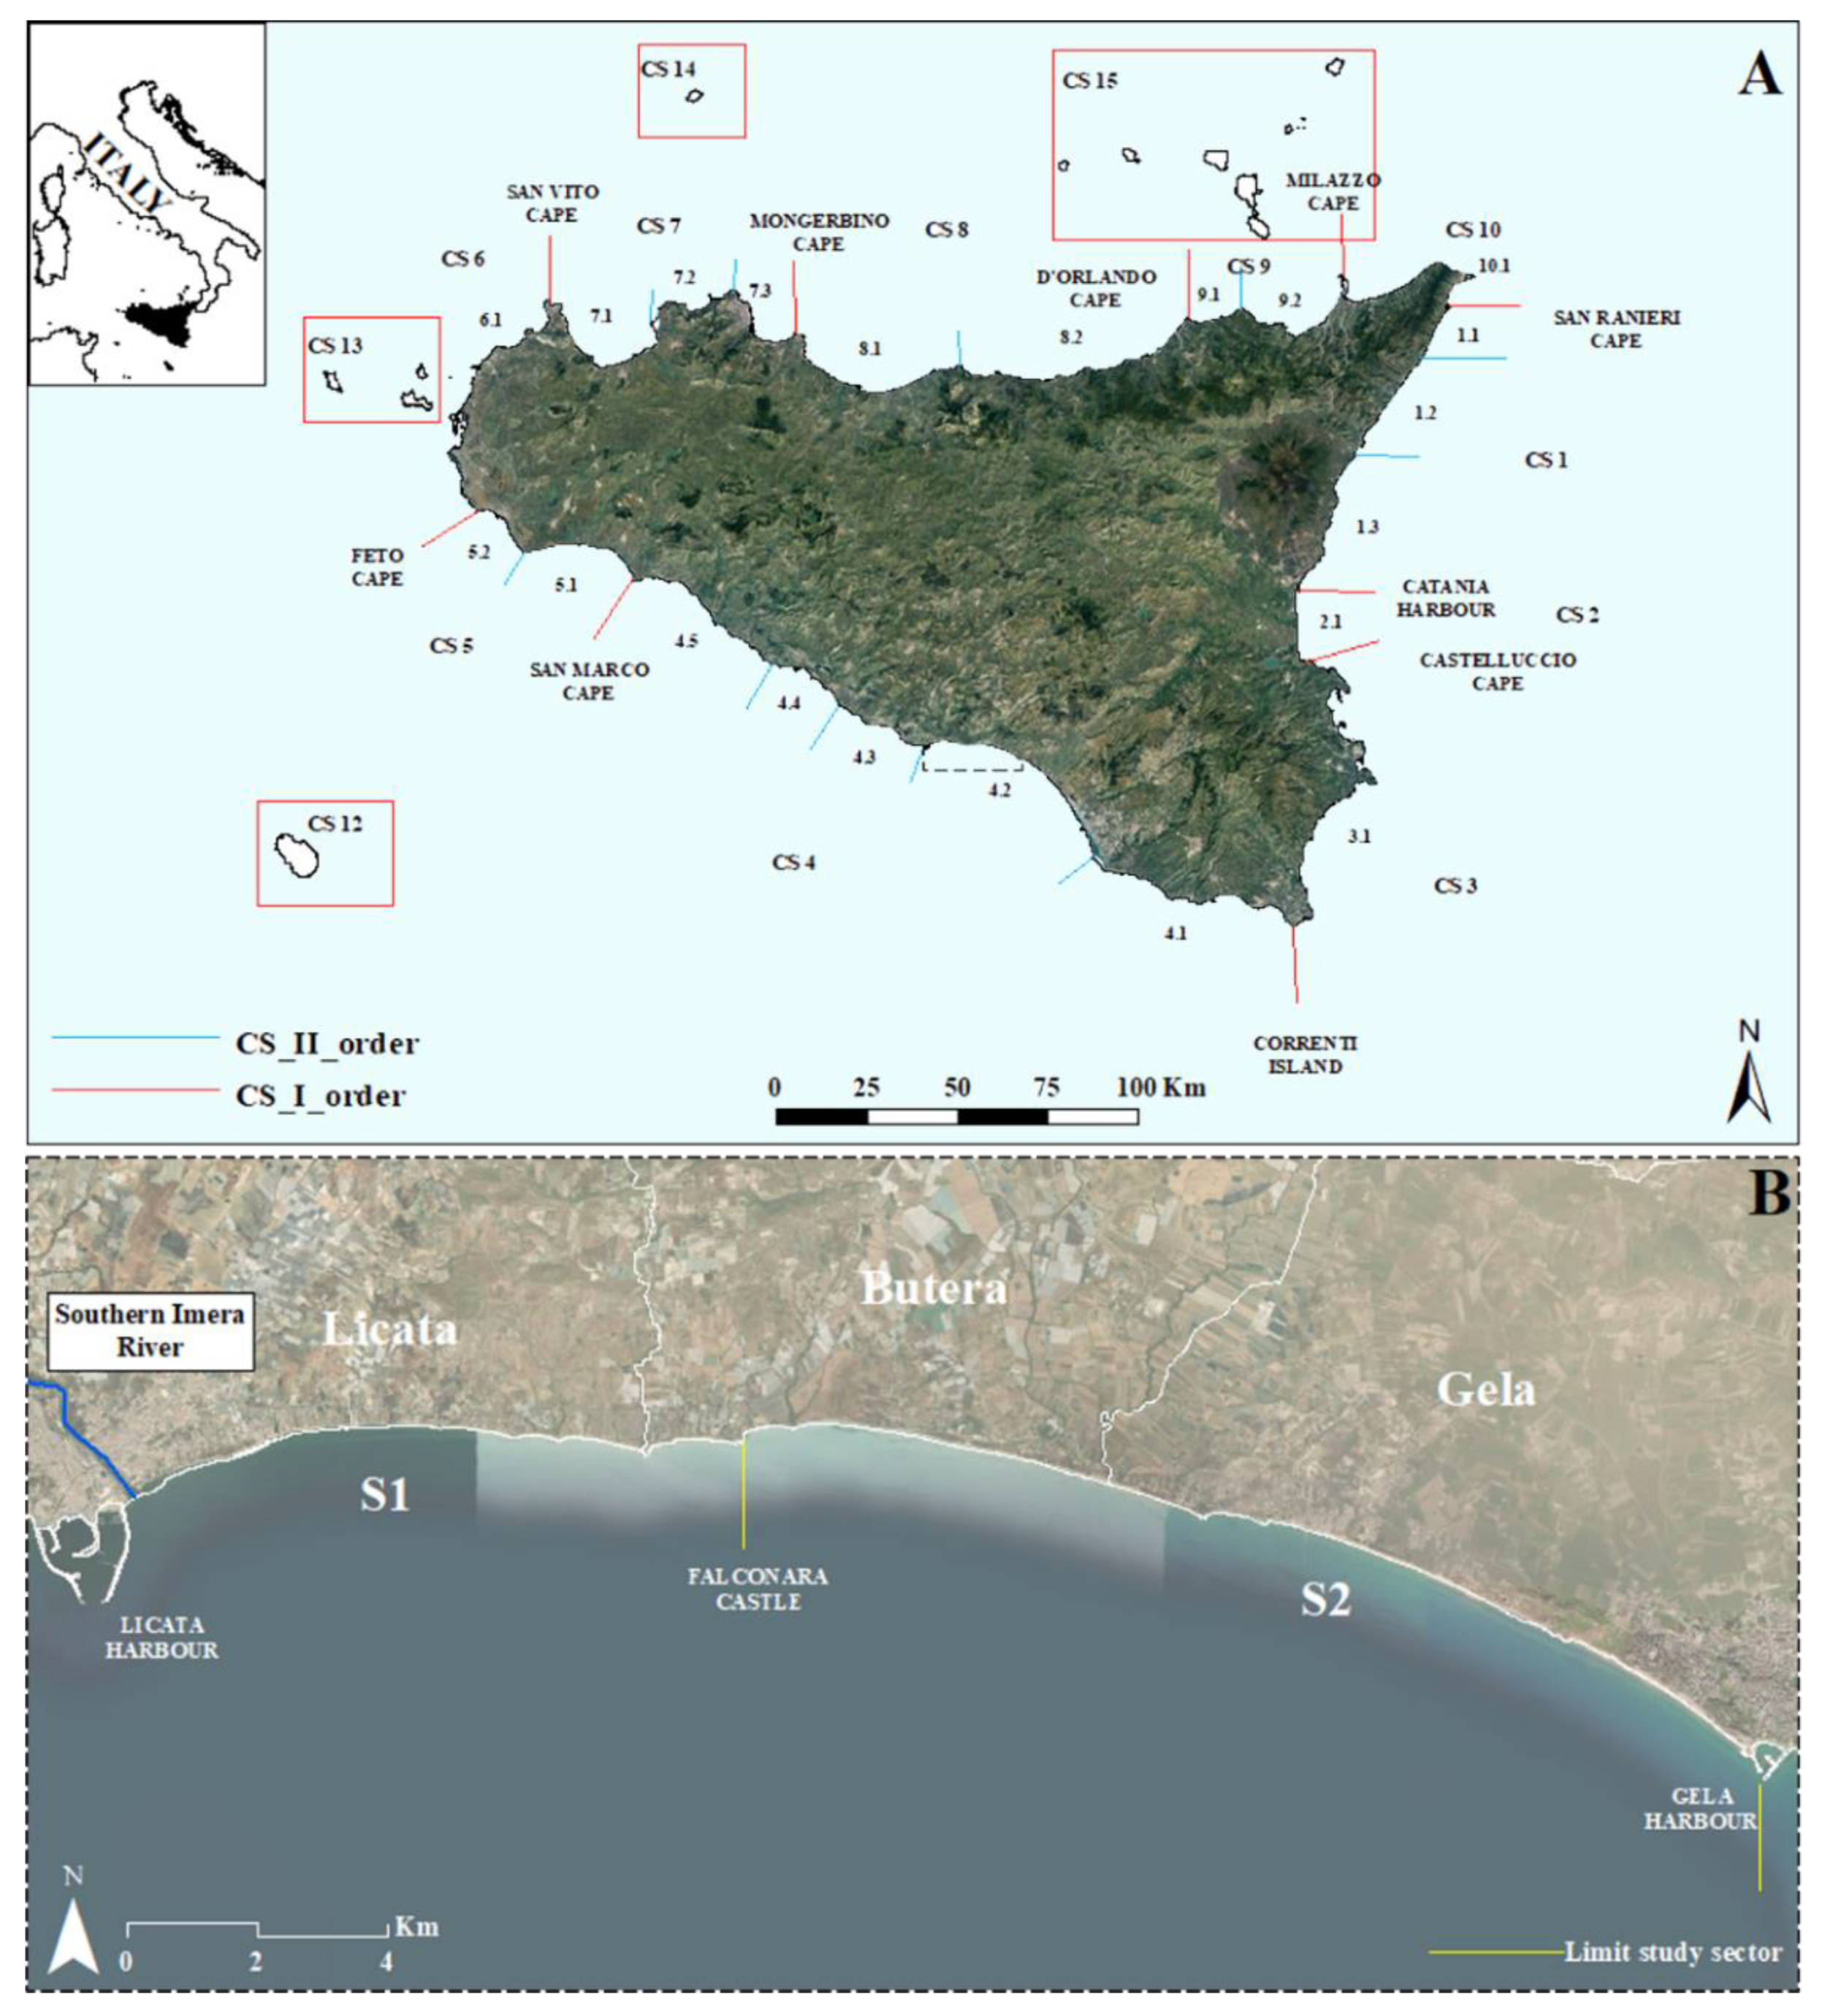
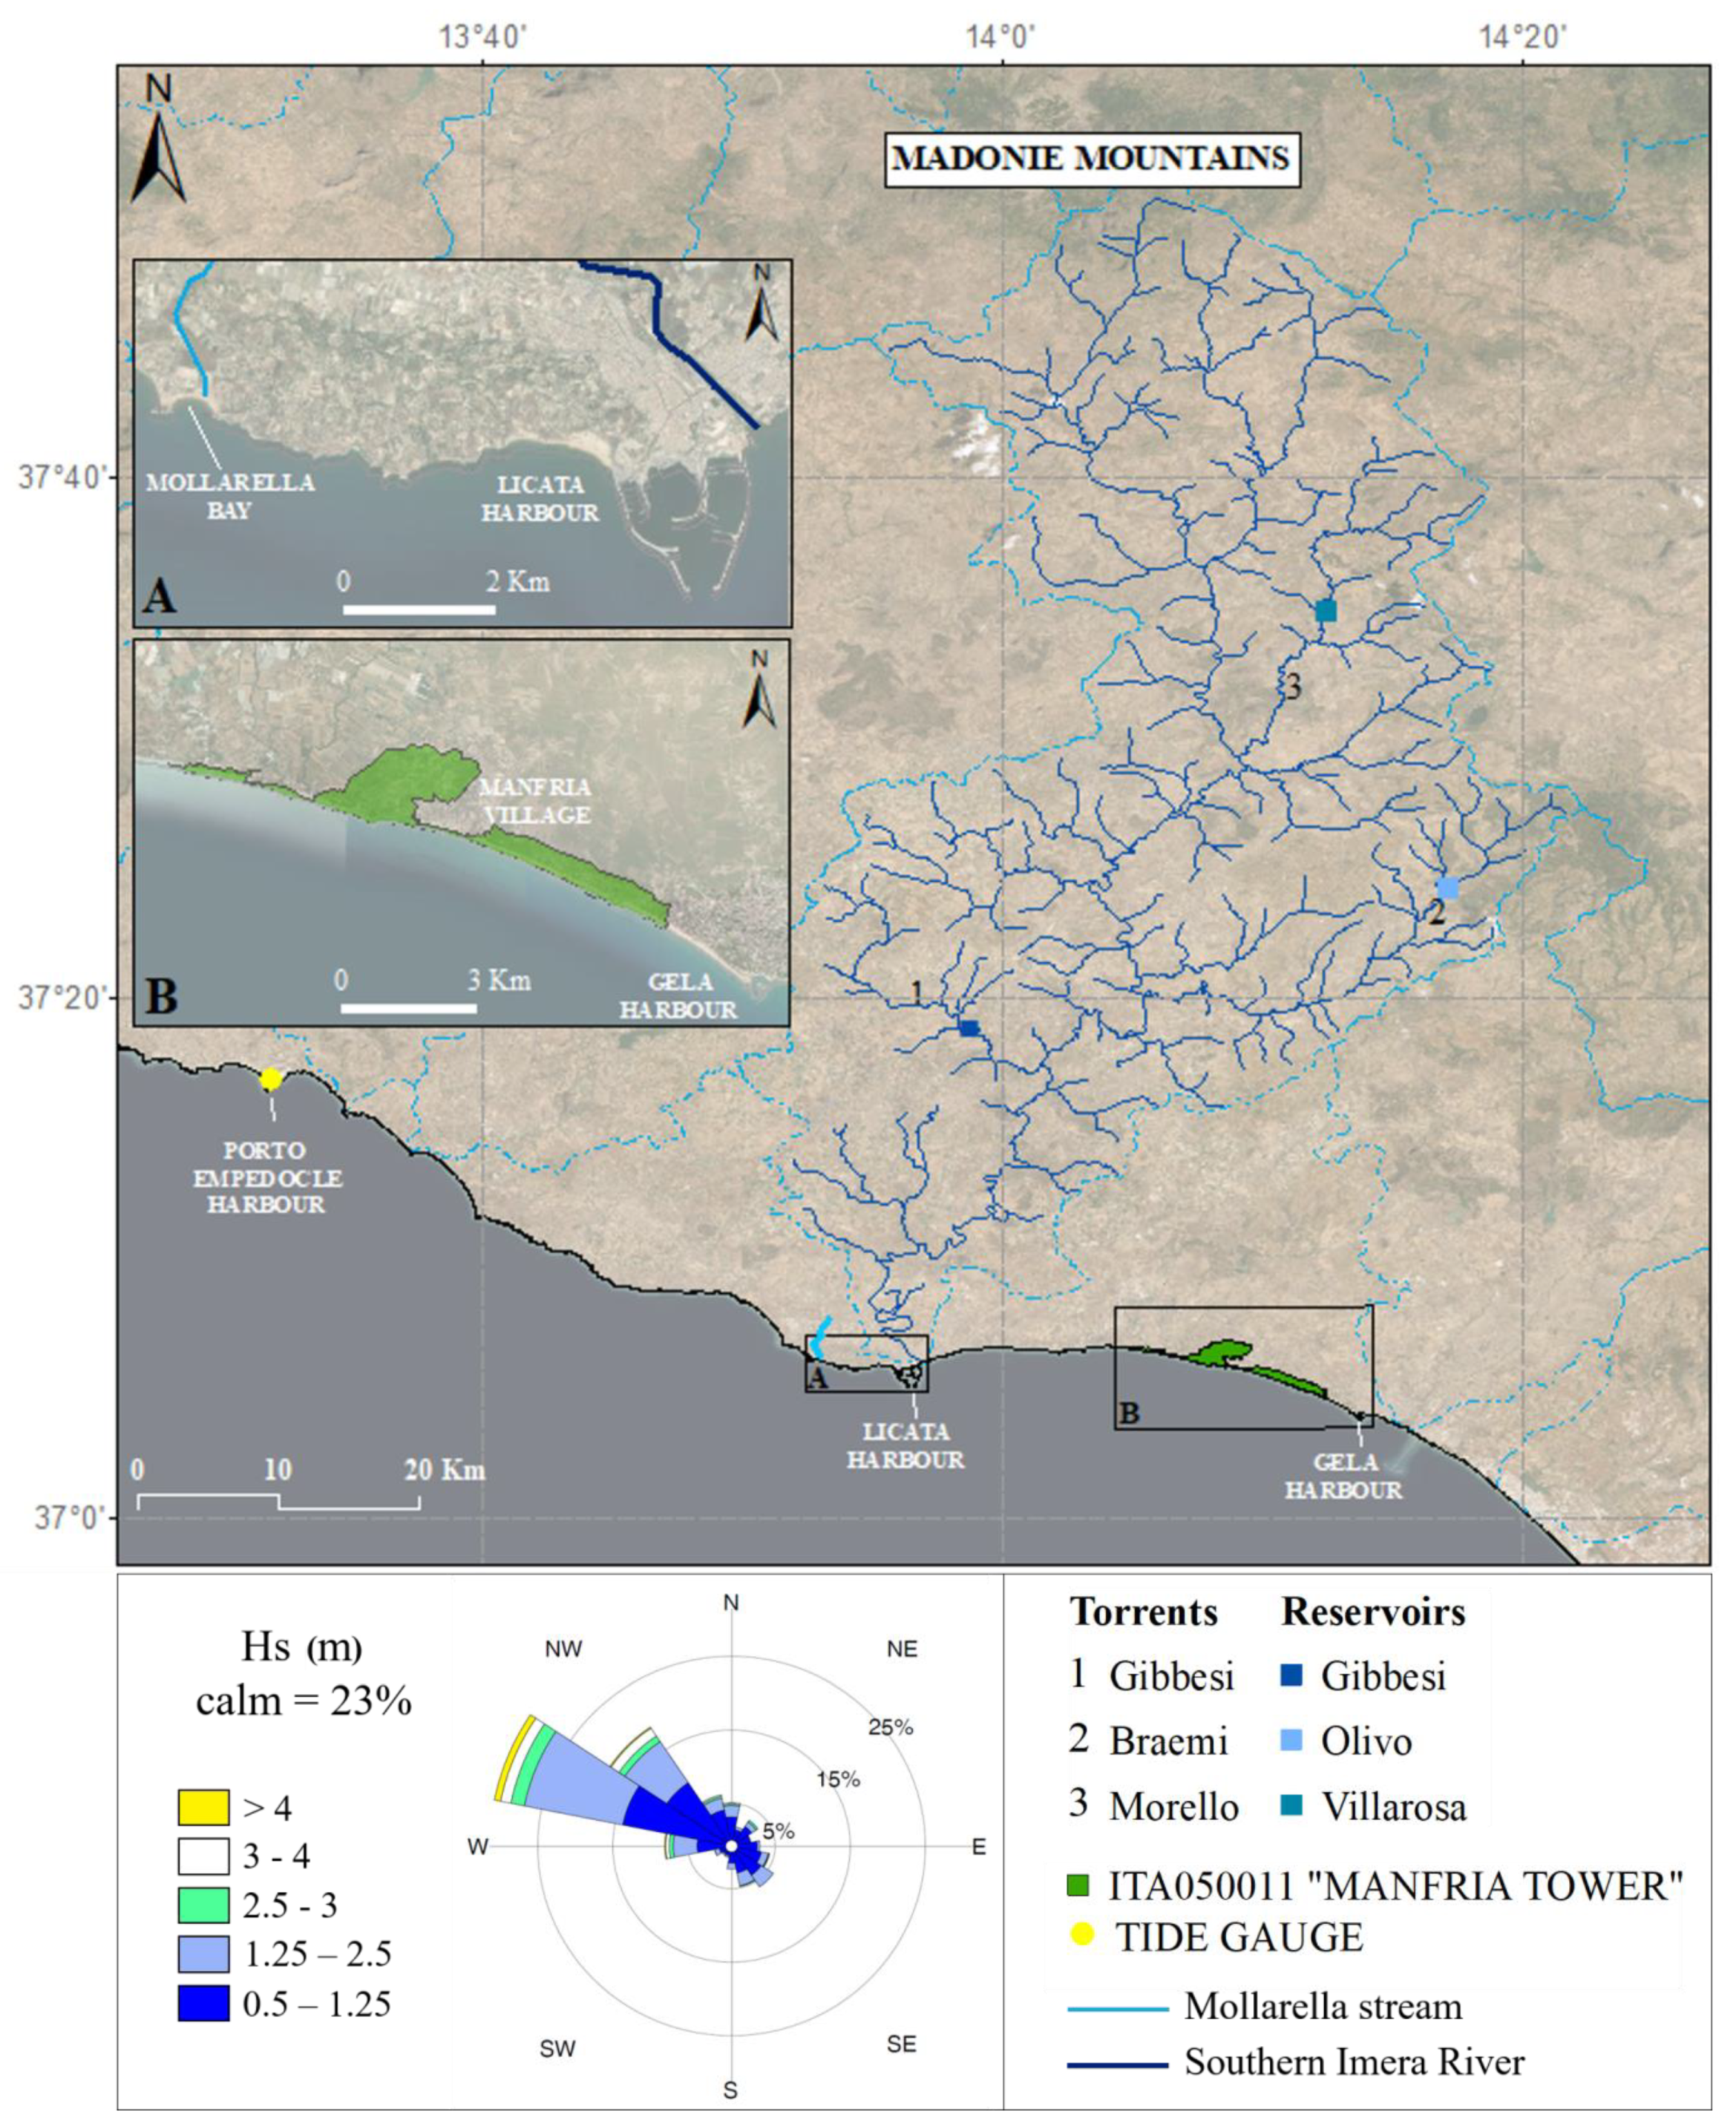
2. Study Area
3. Materials and Methods
4. Results
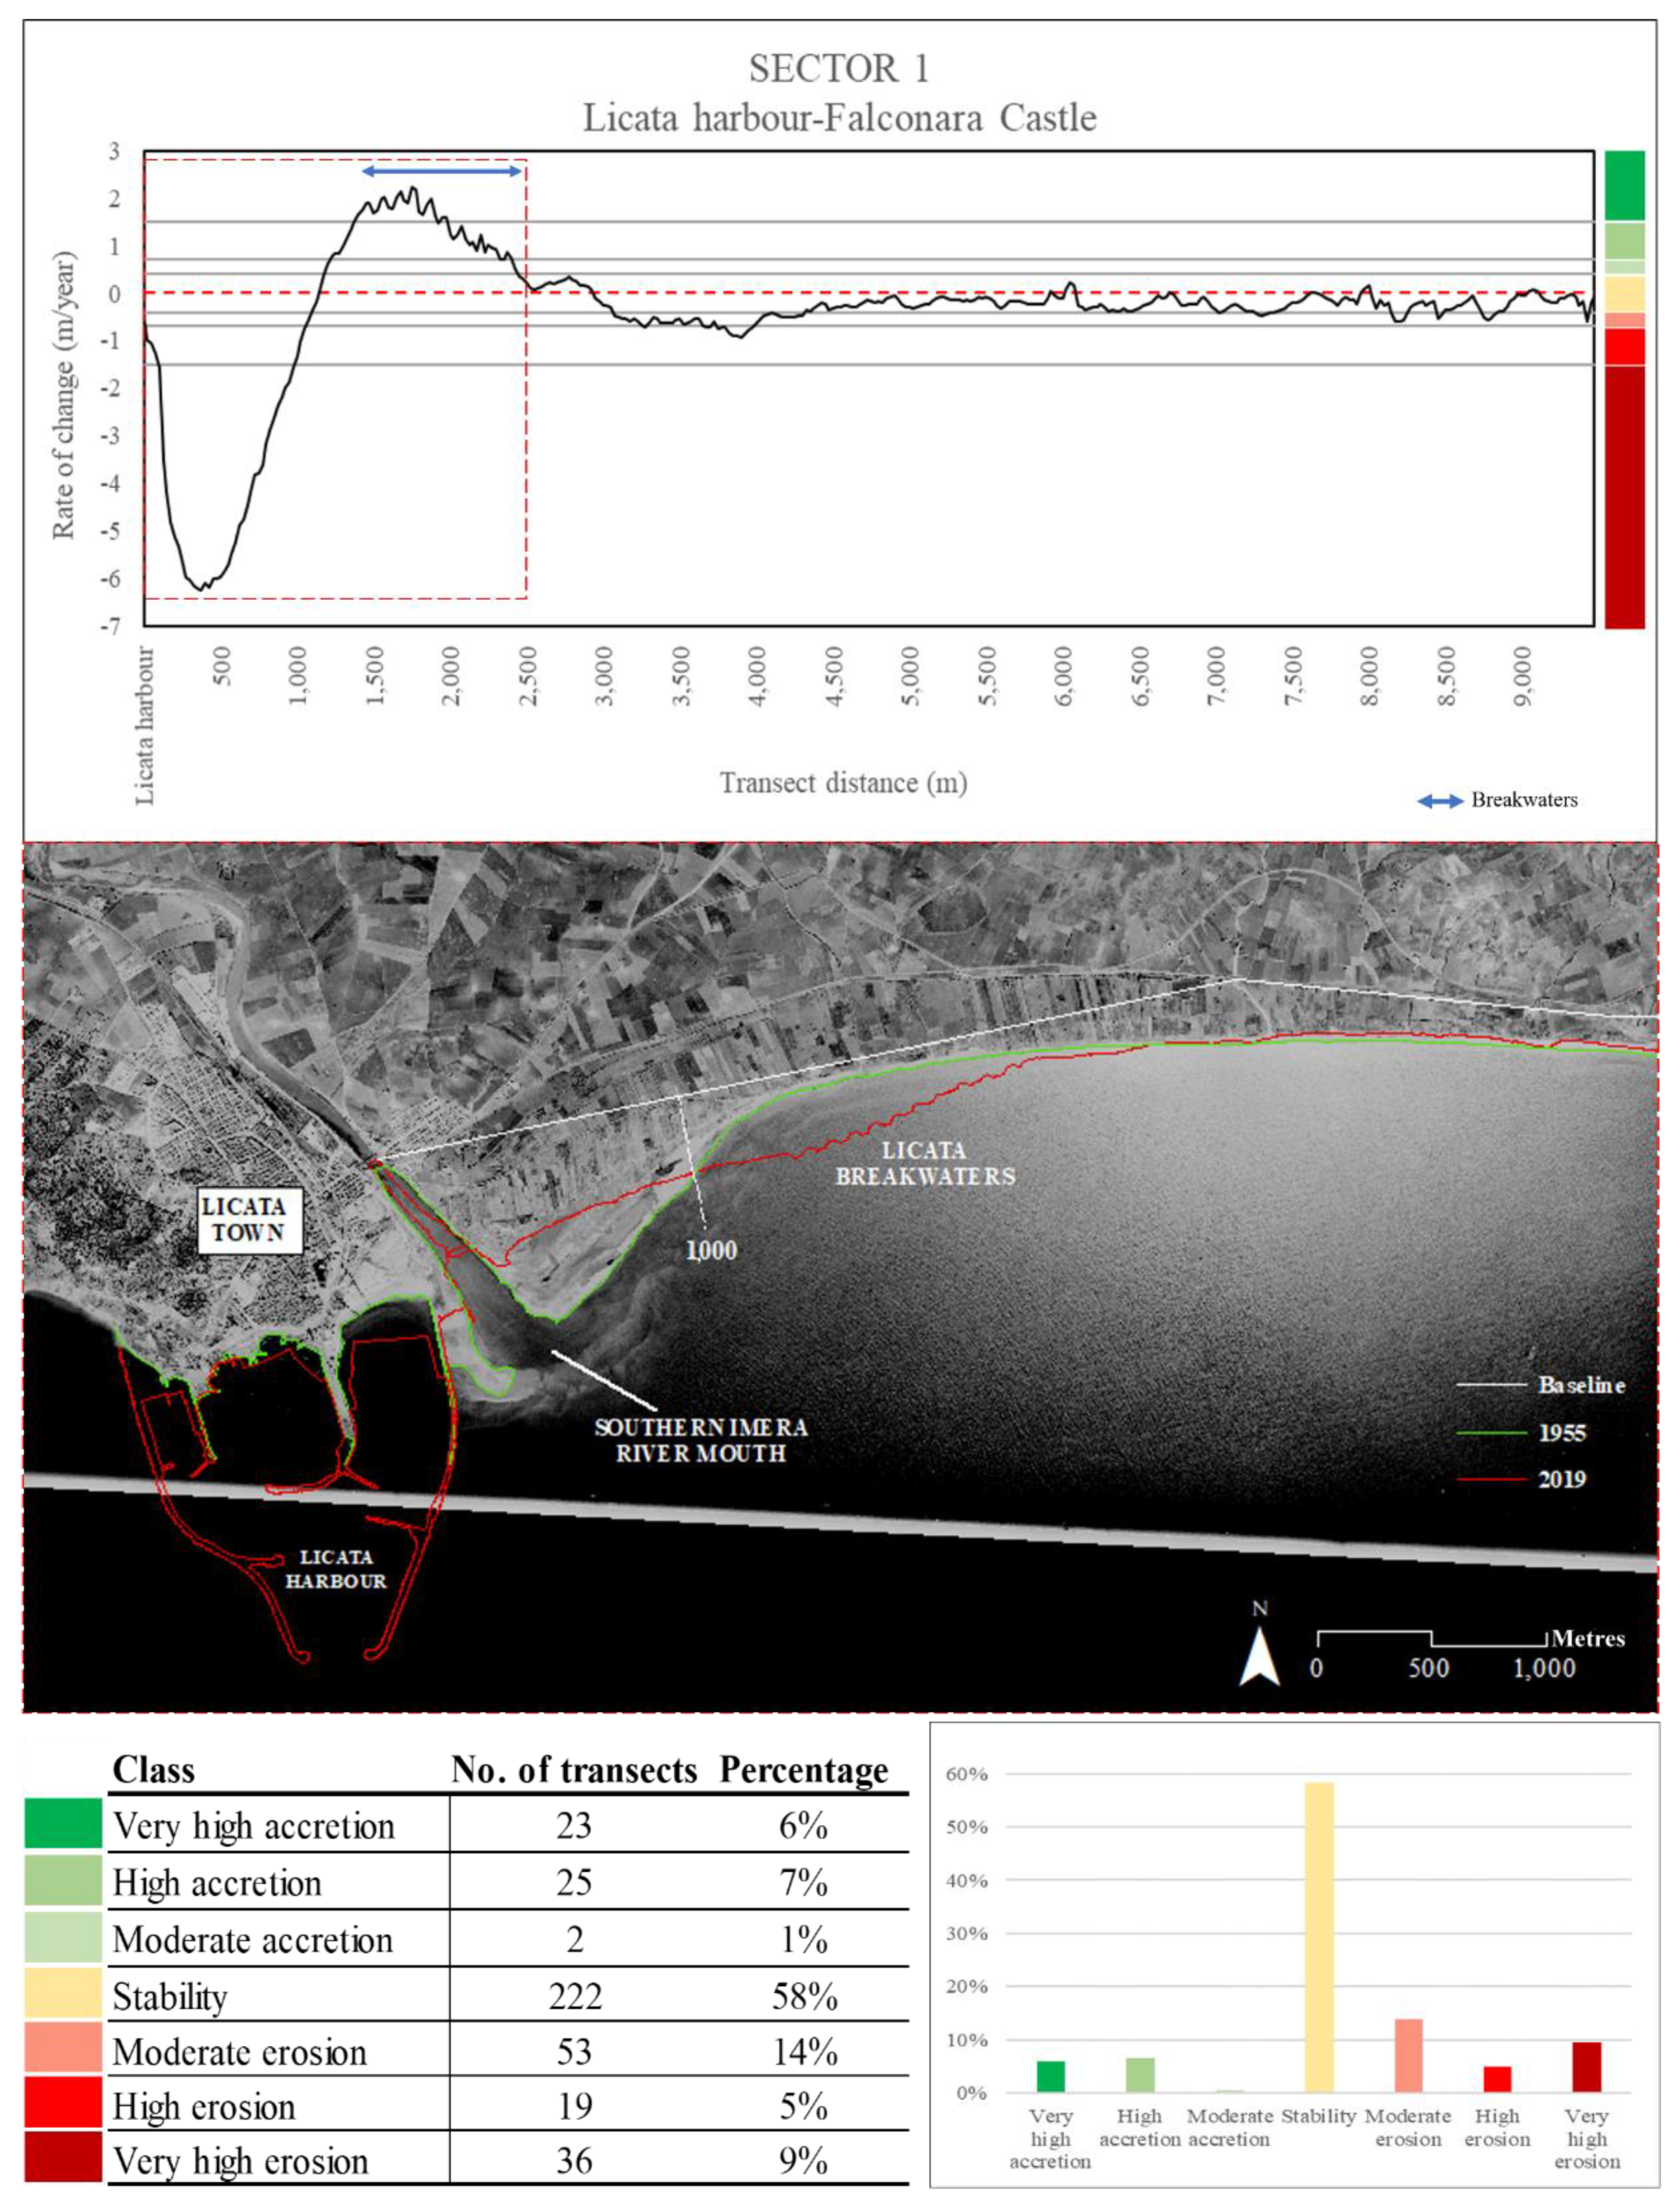
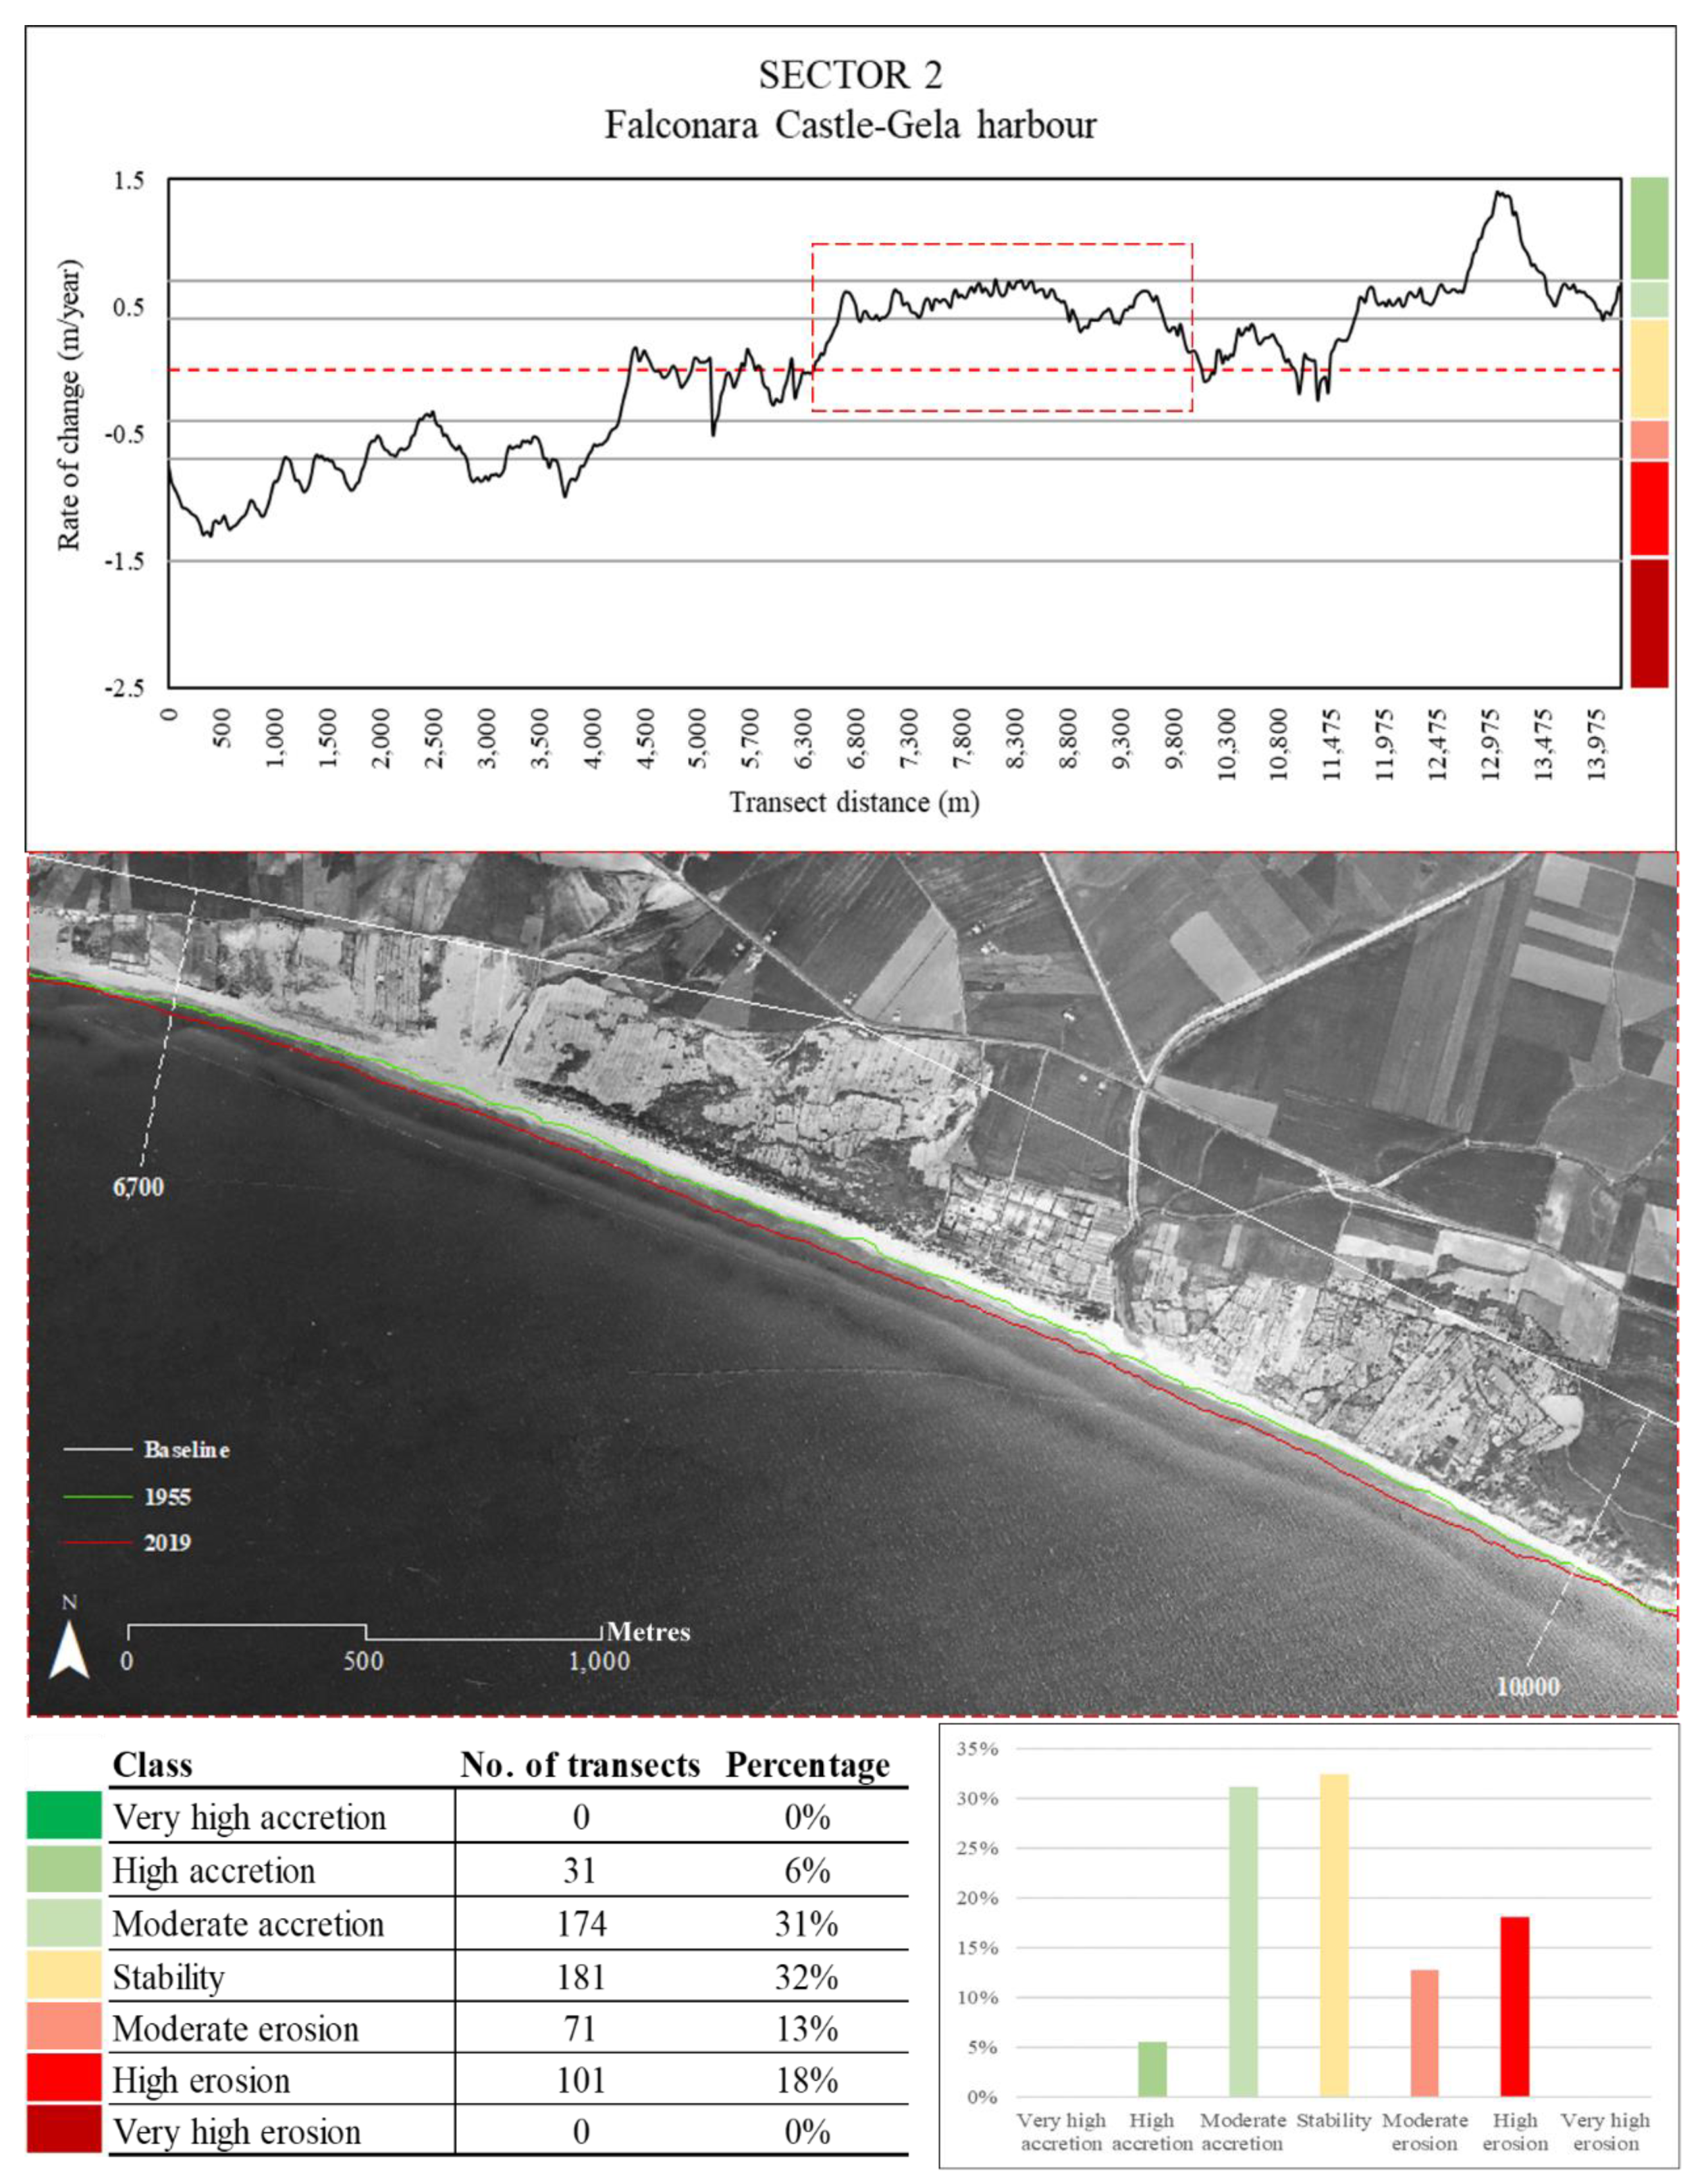
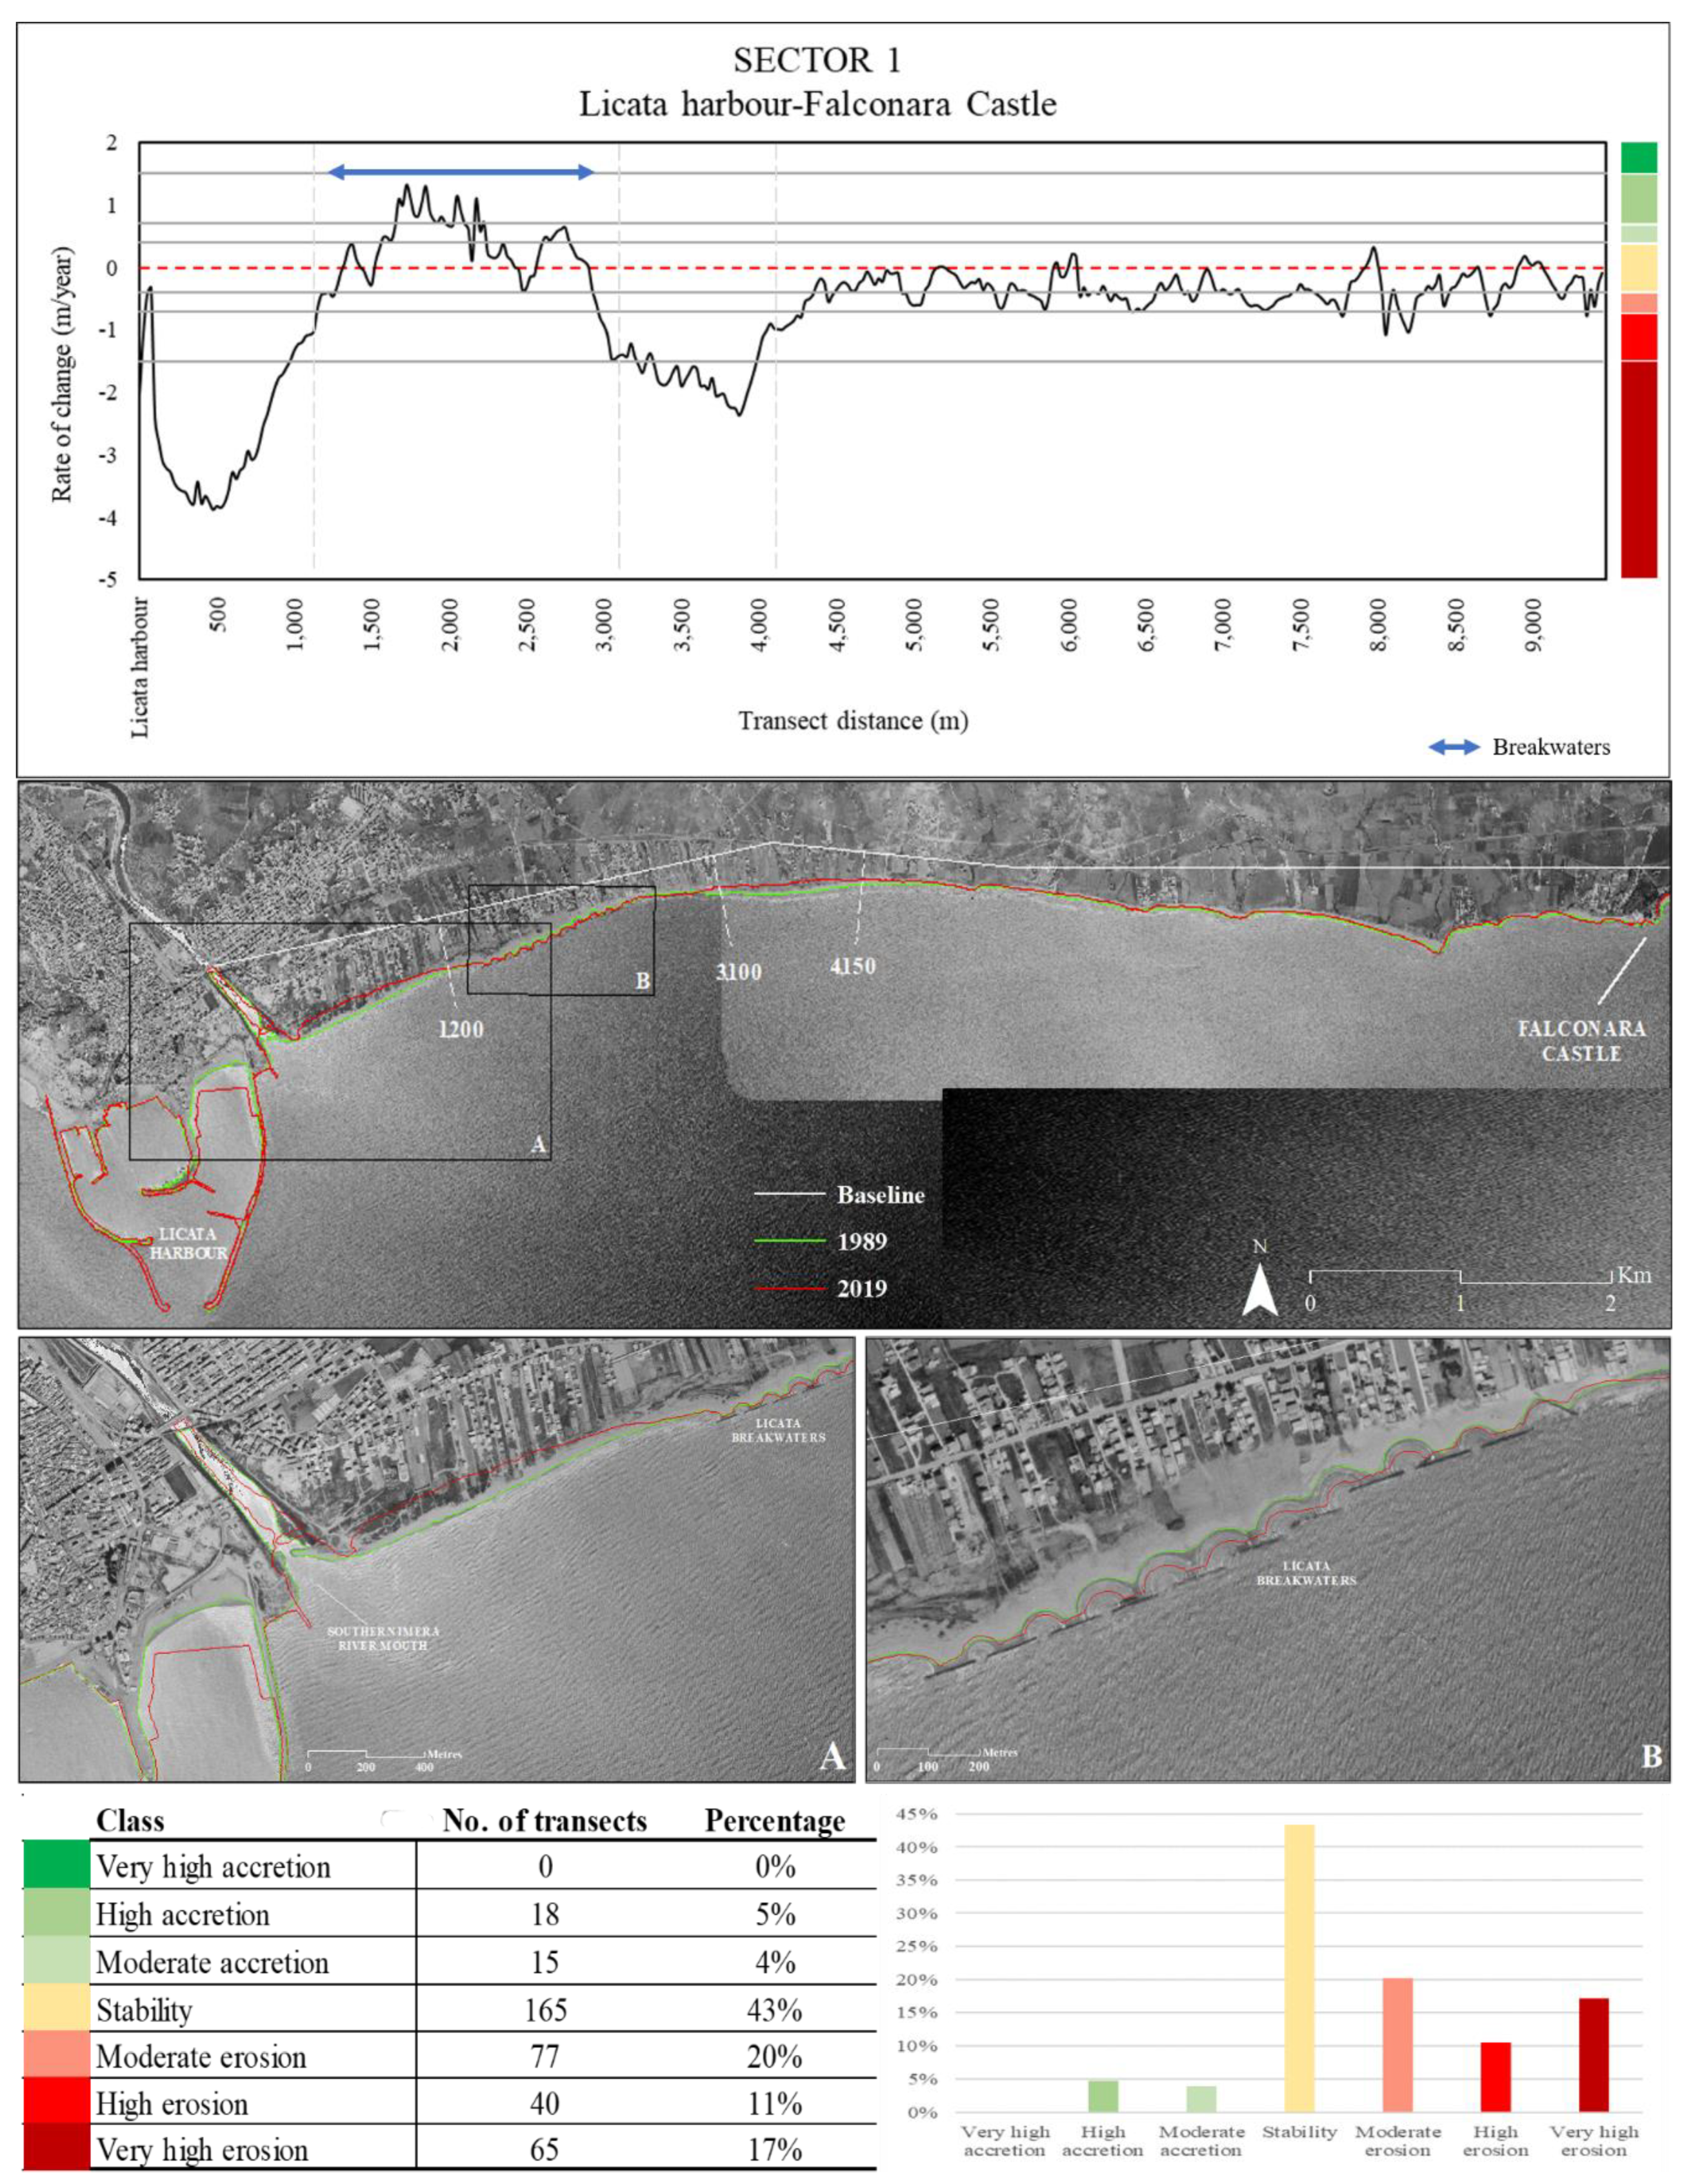
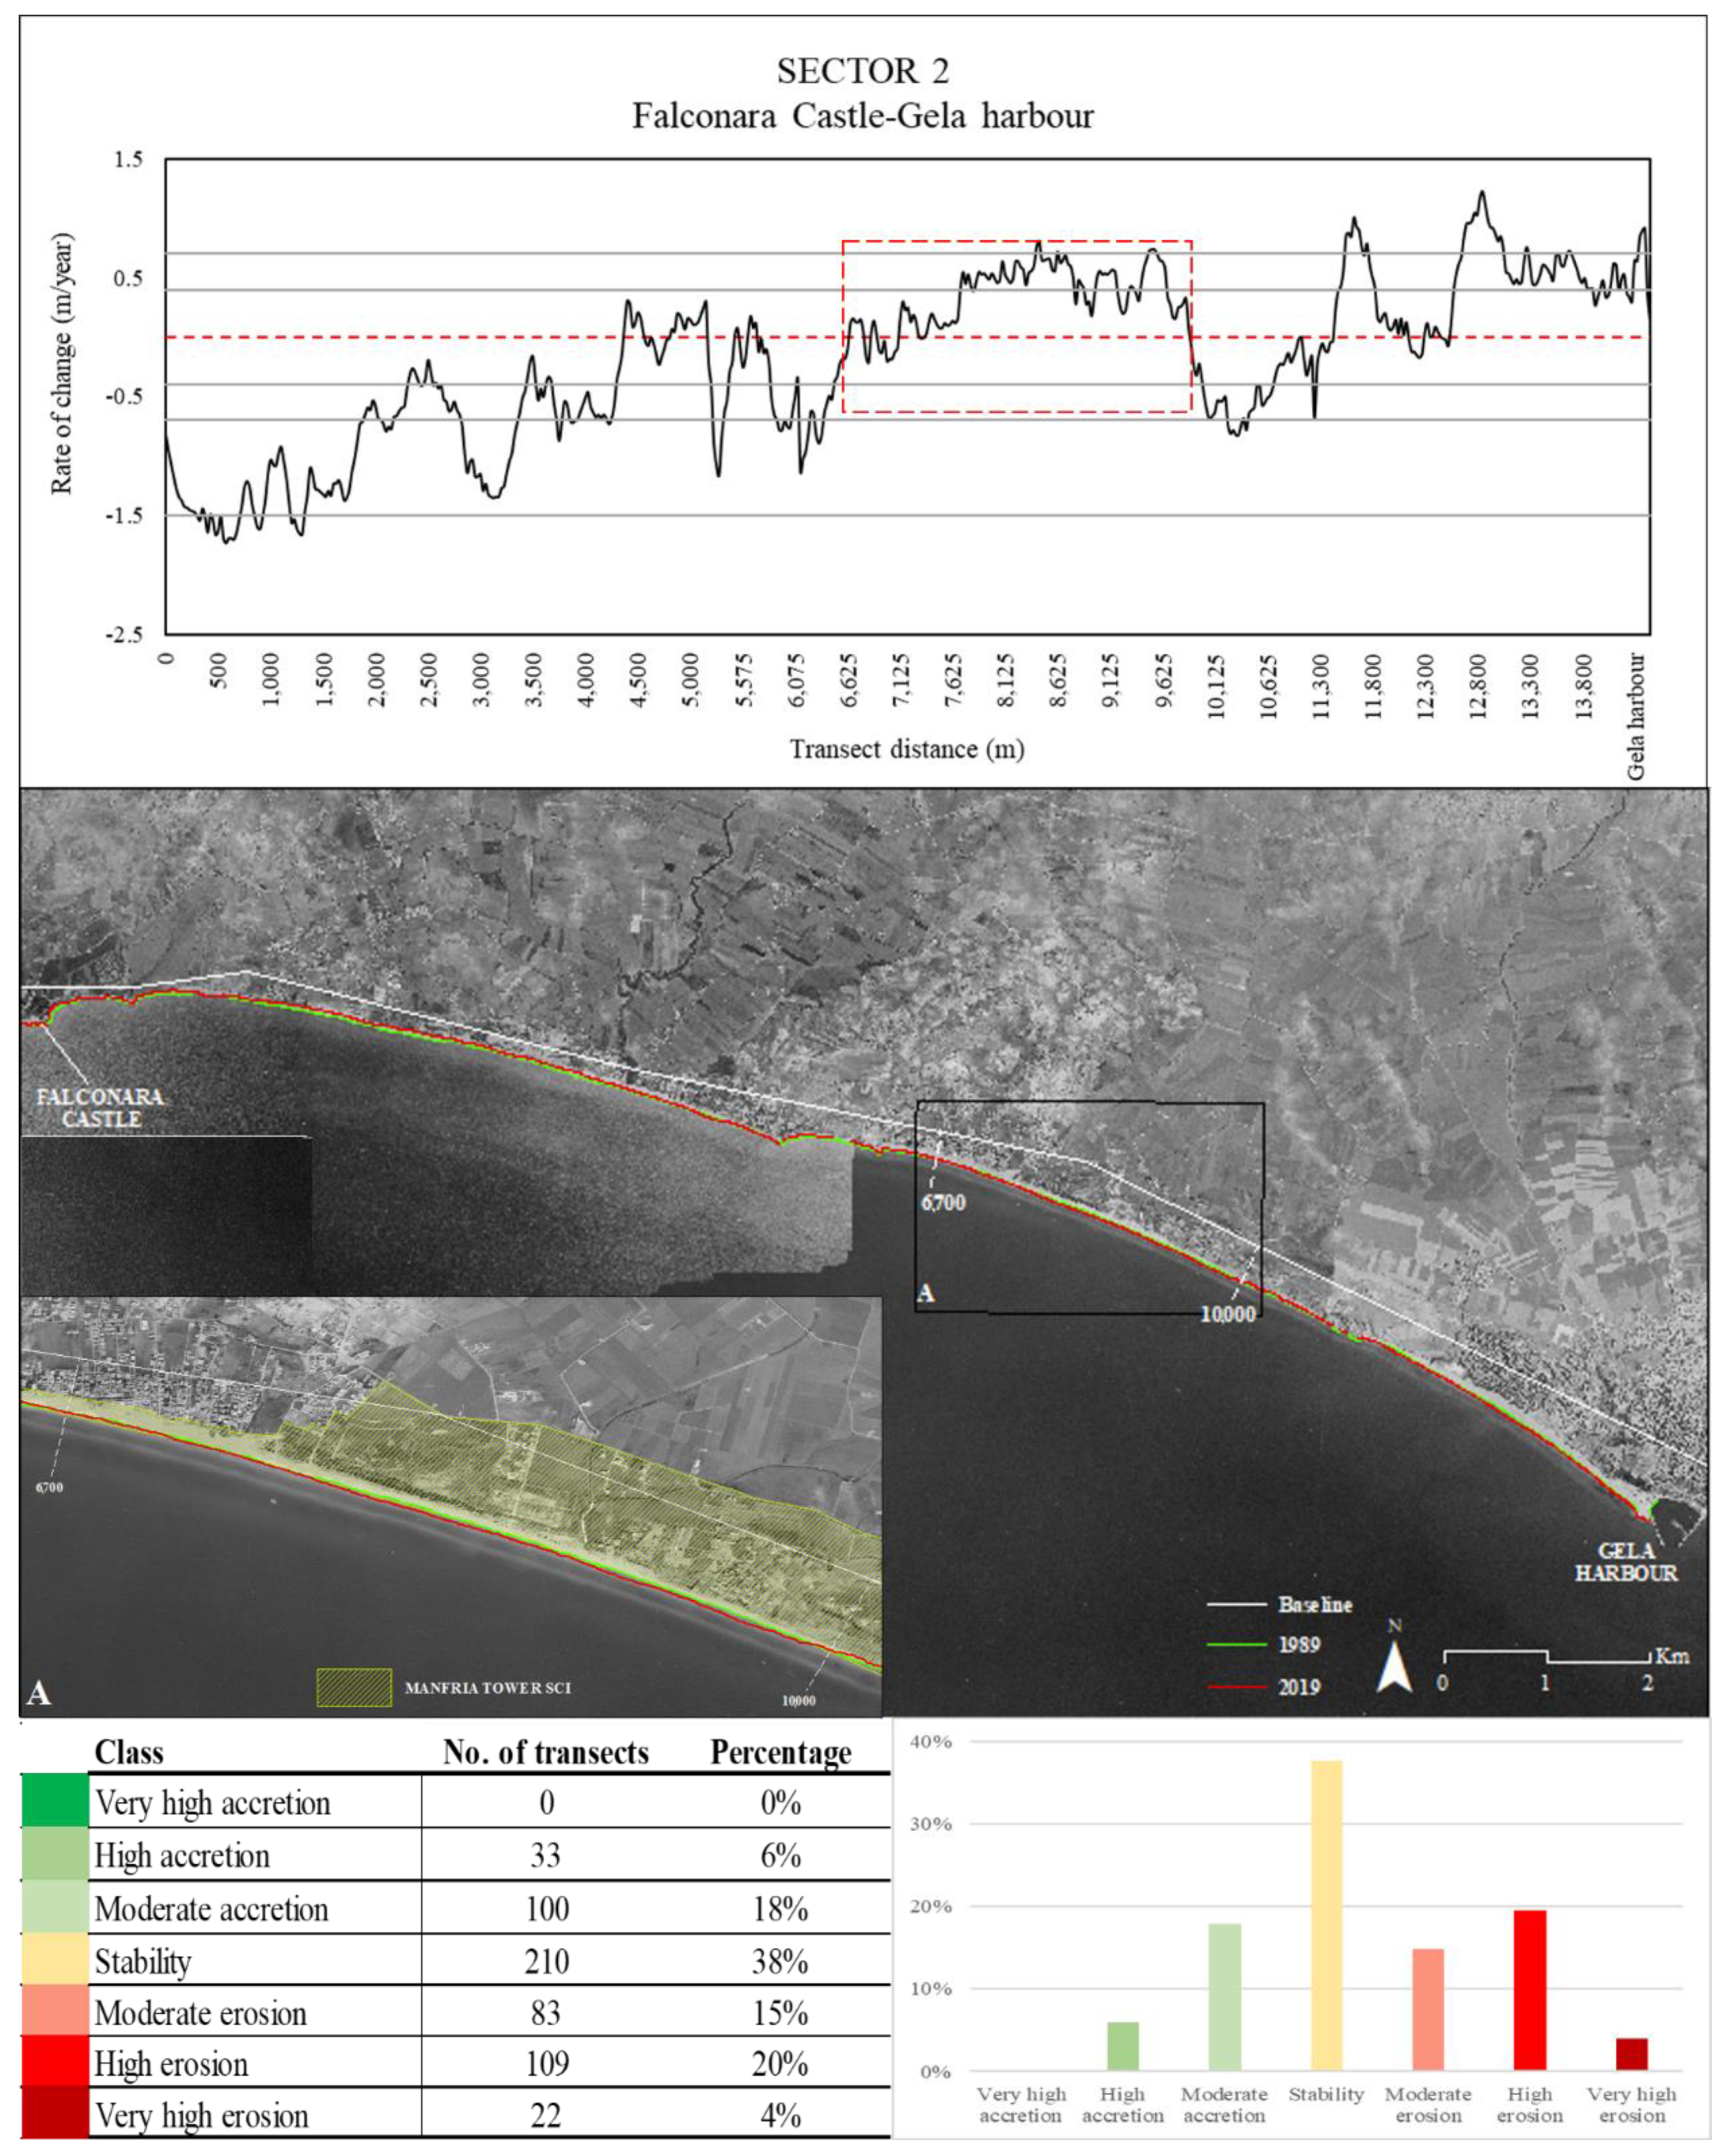
4.1. Shoreline Change Analysis
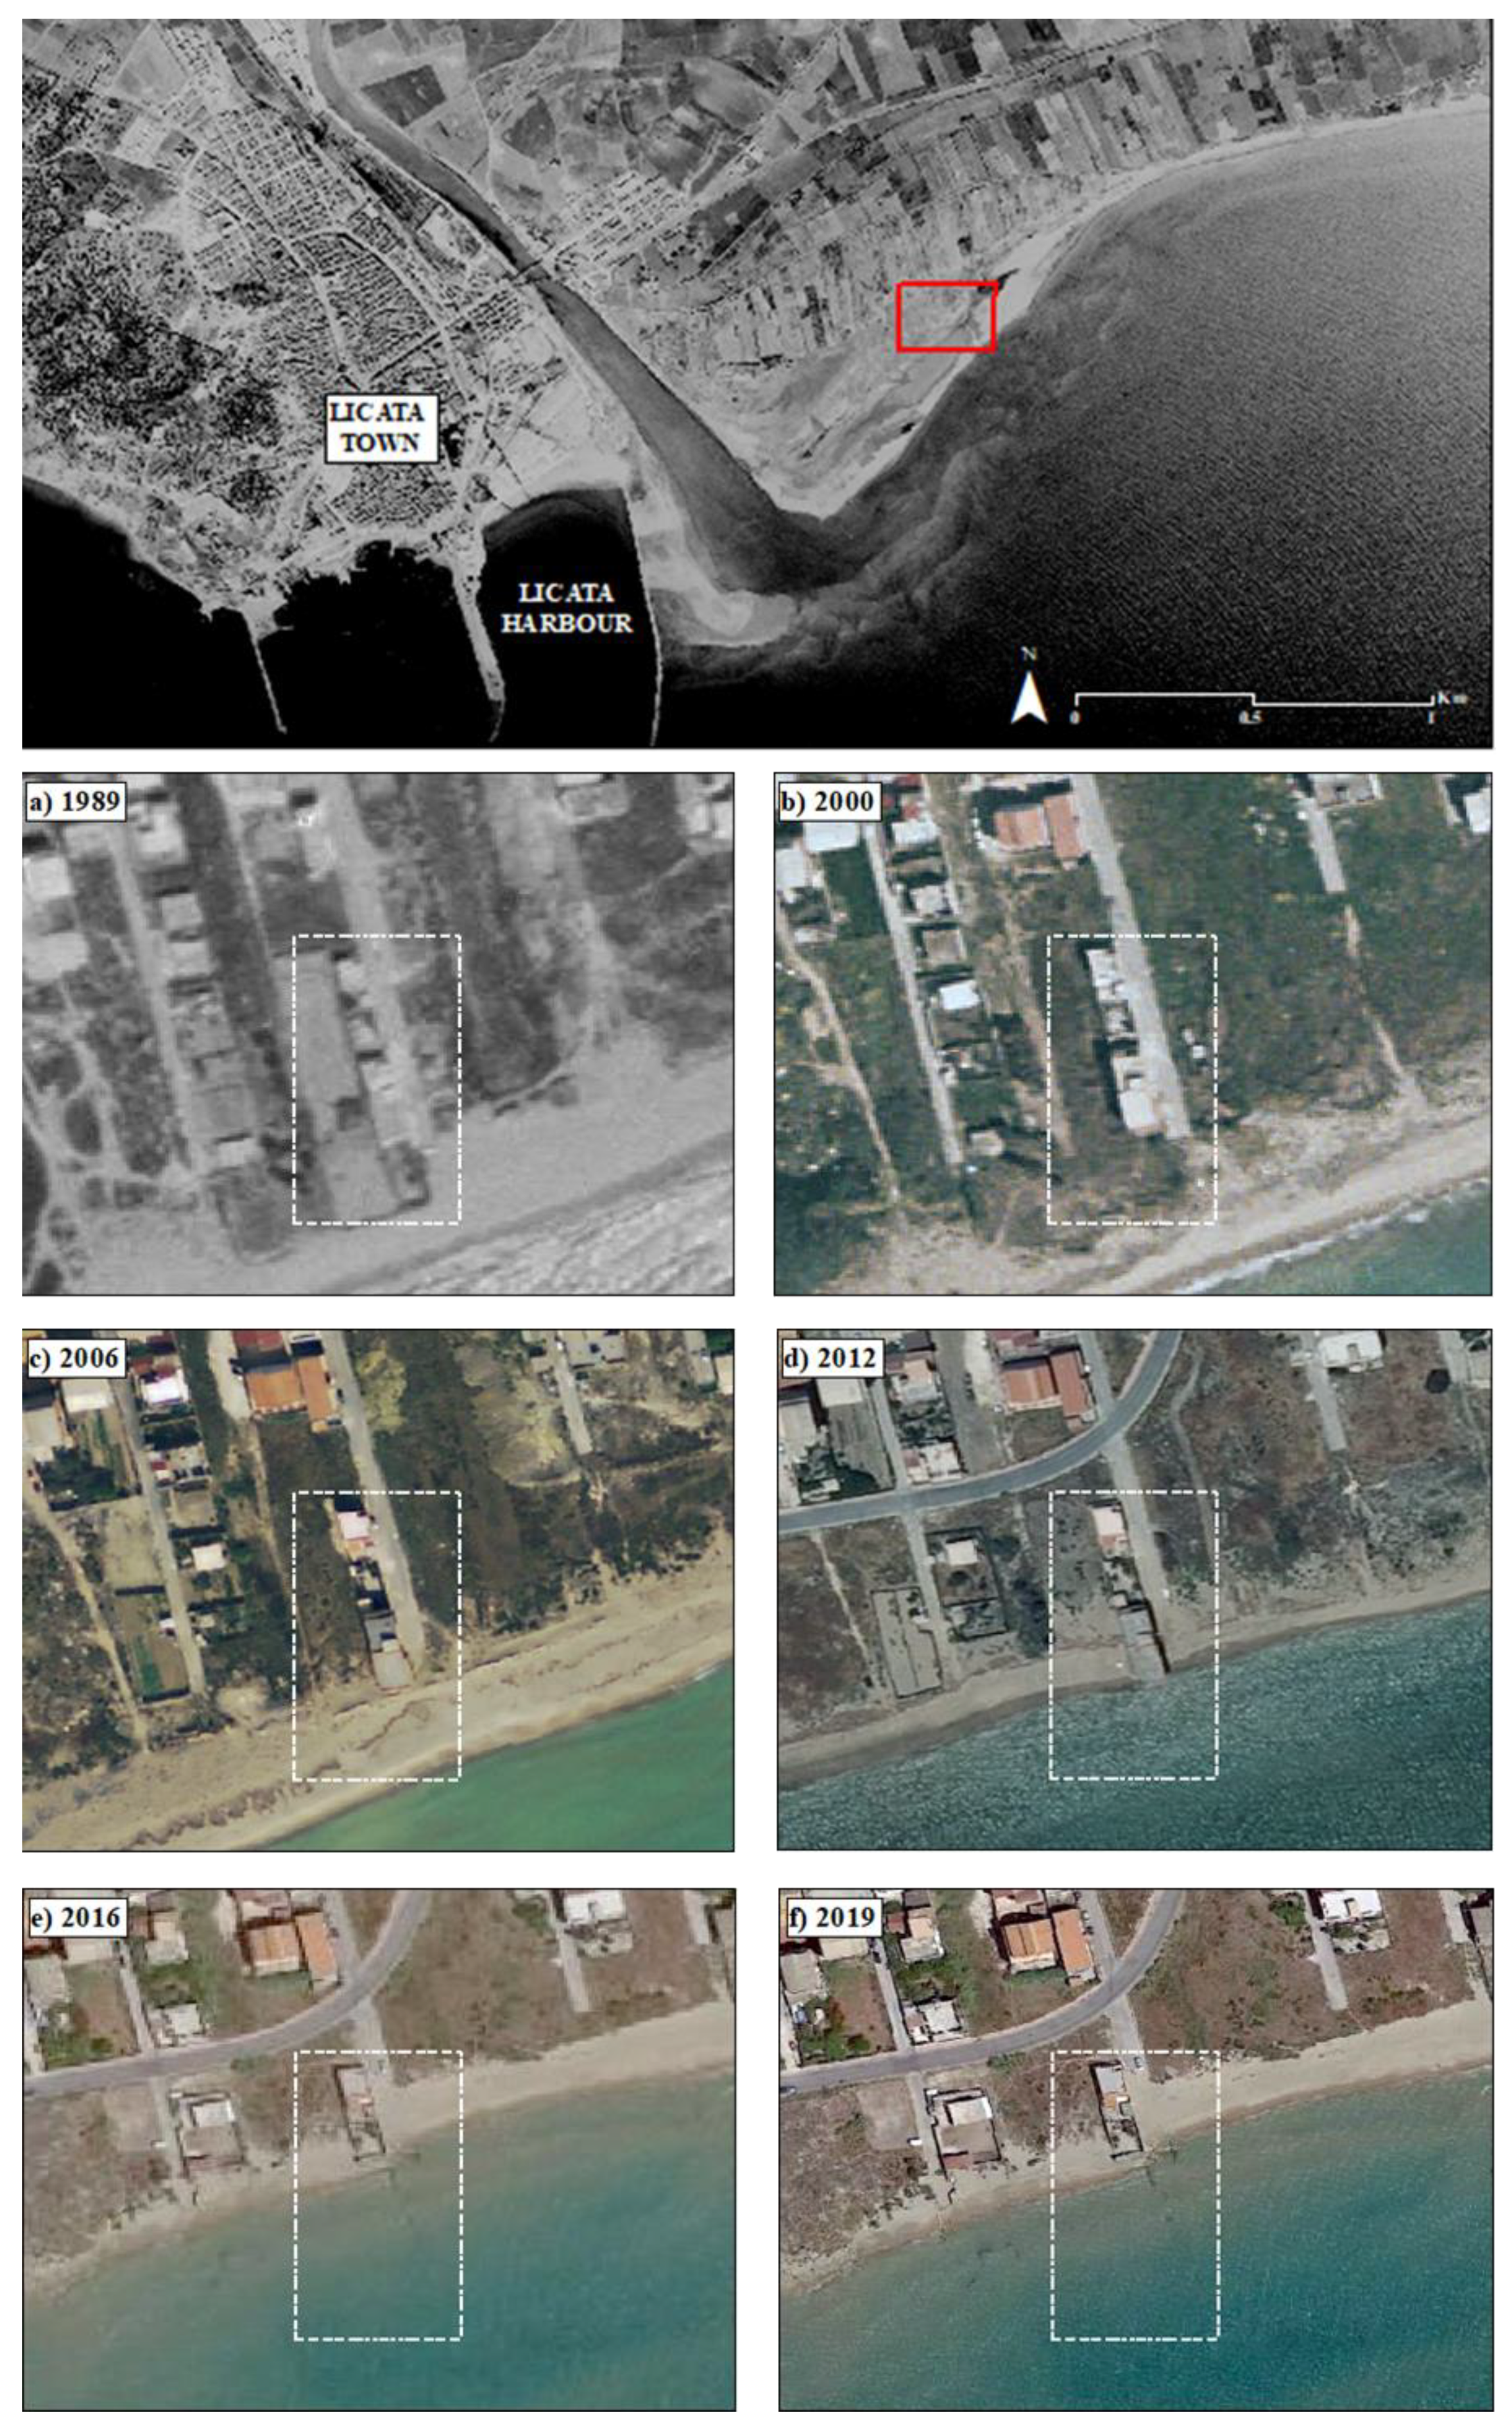
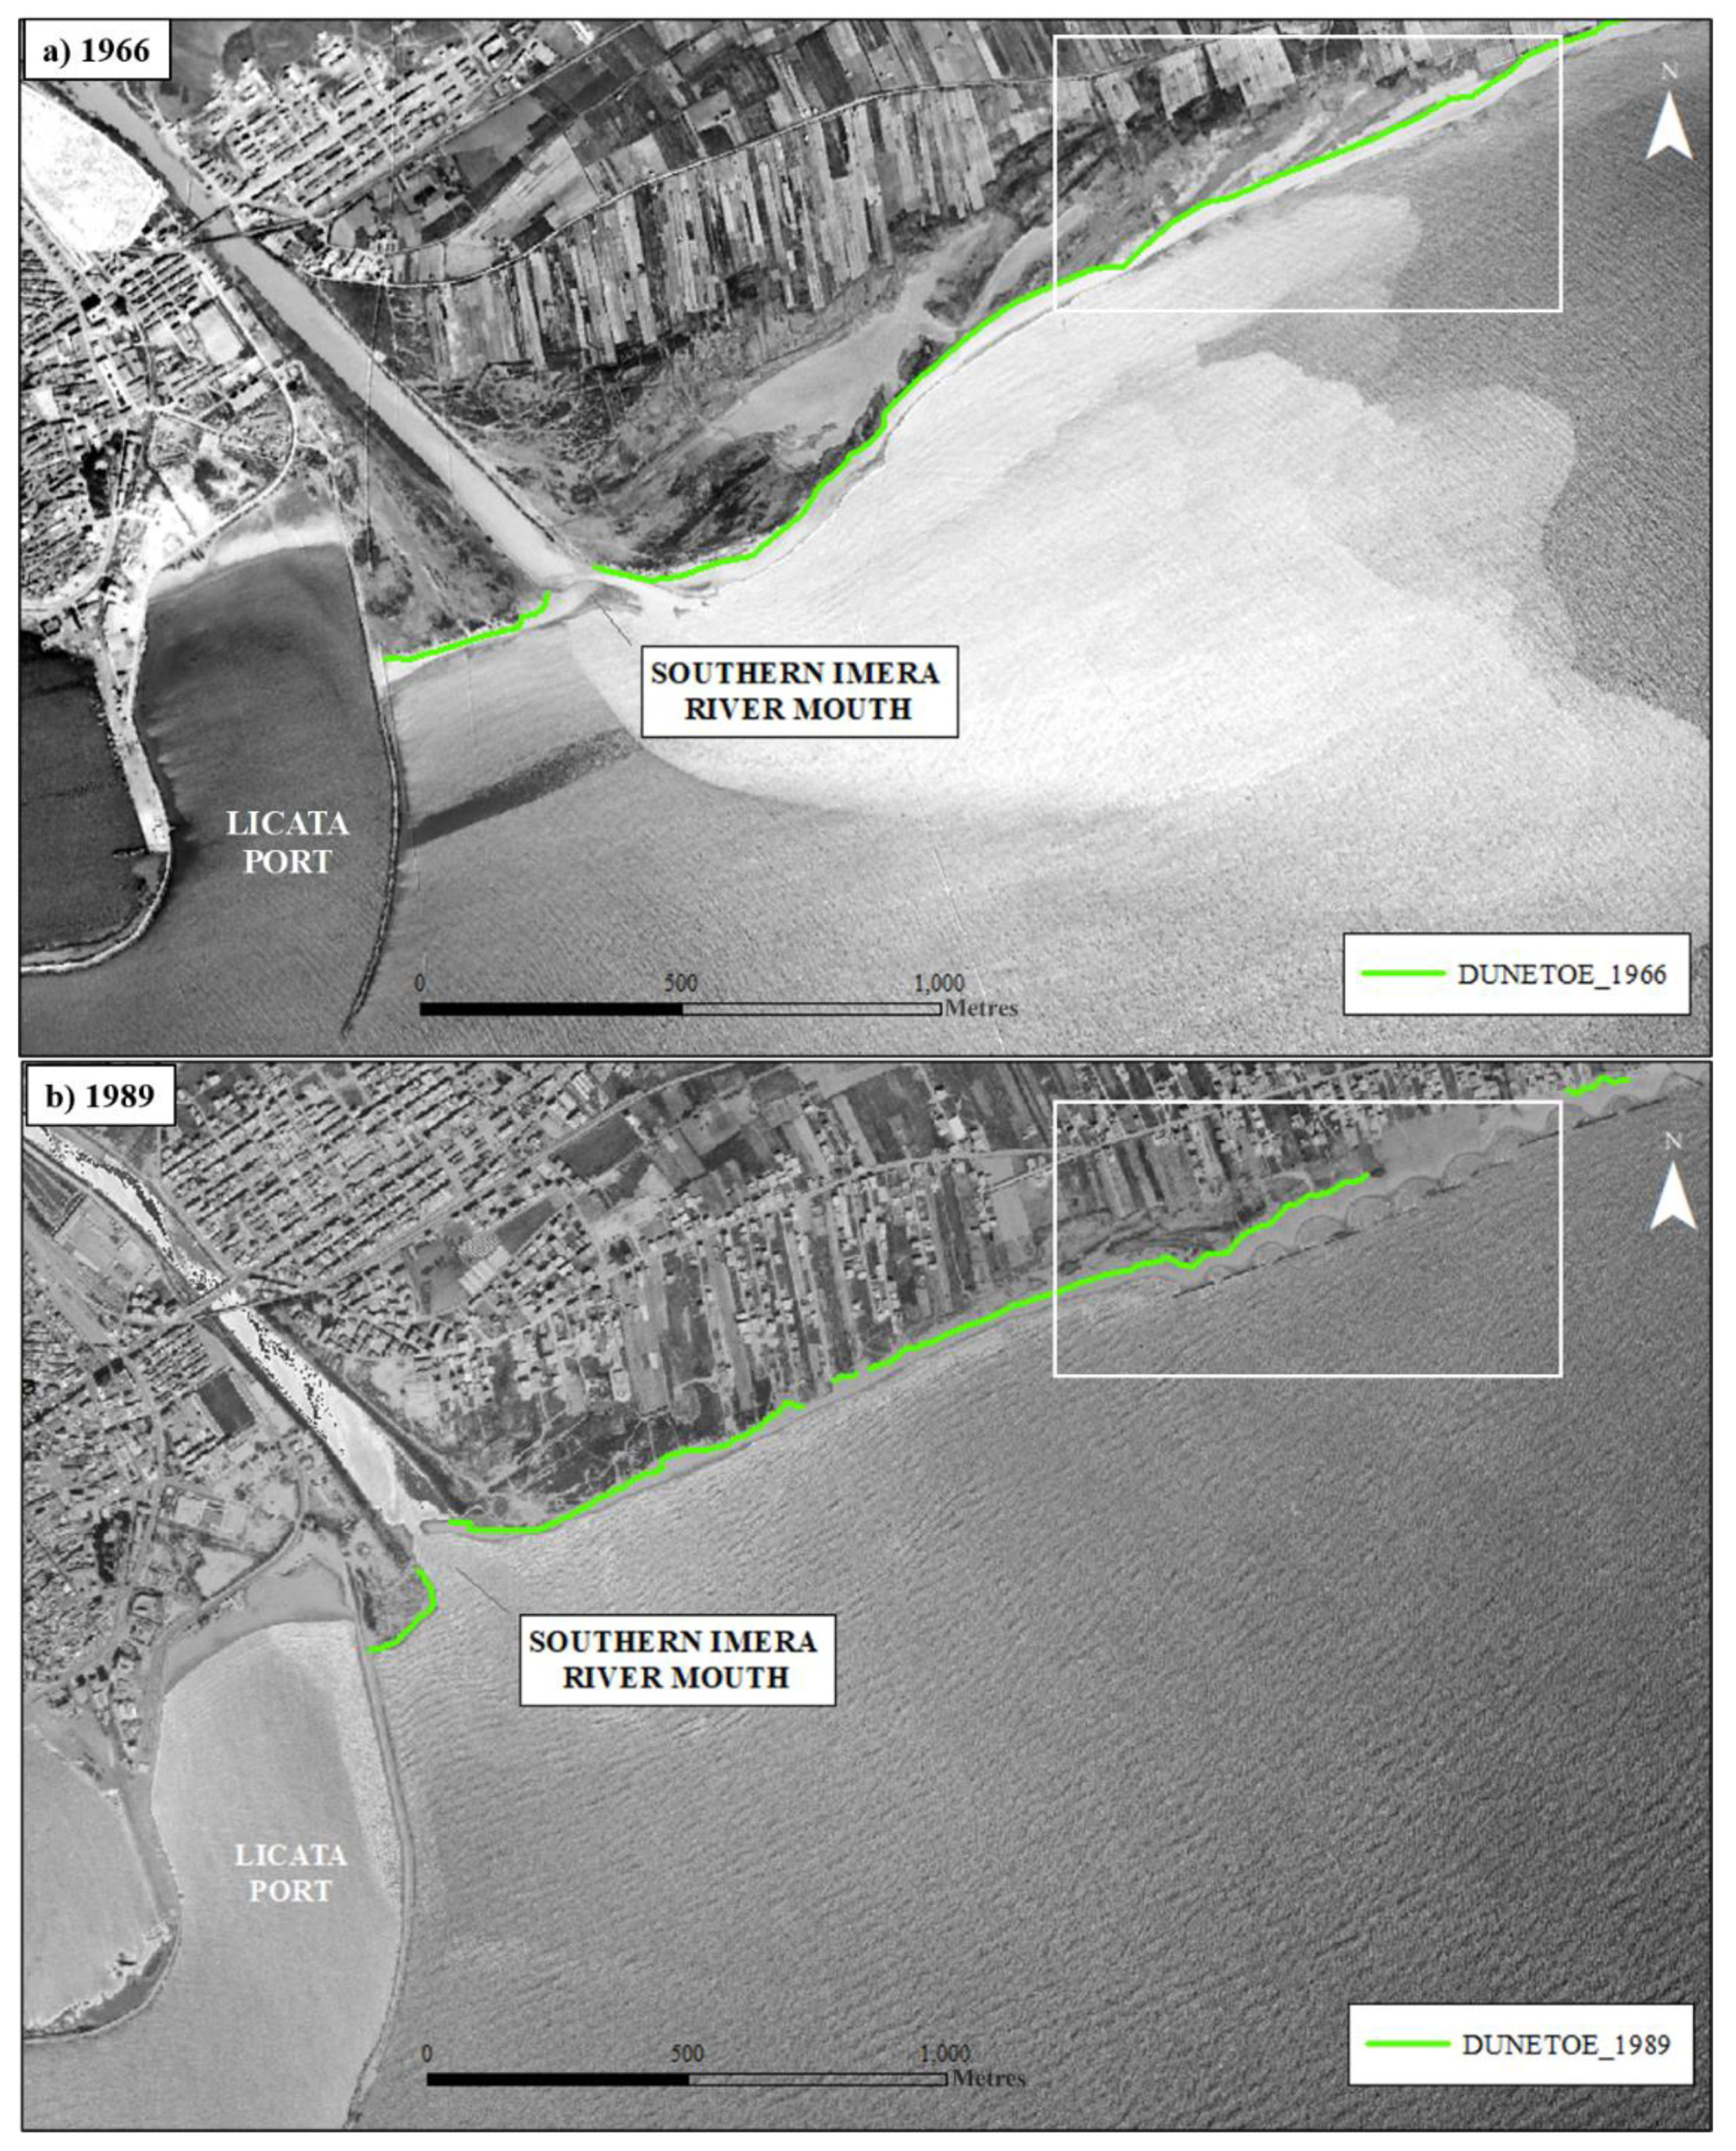
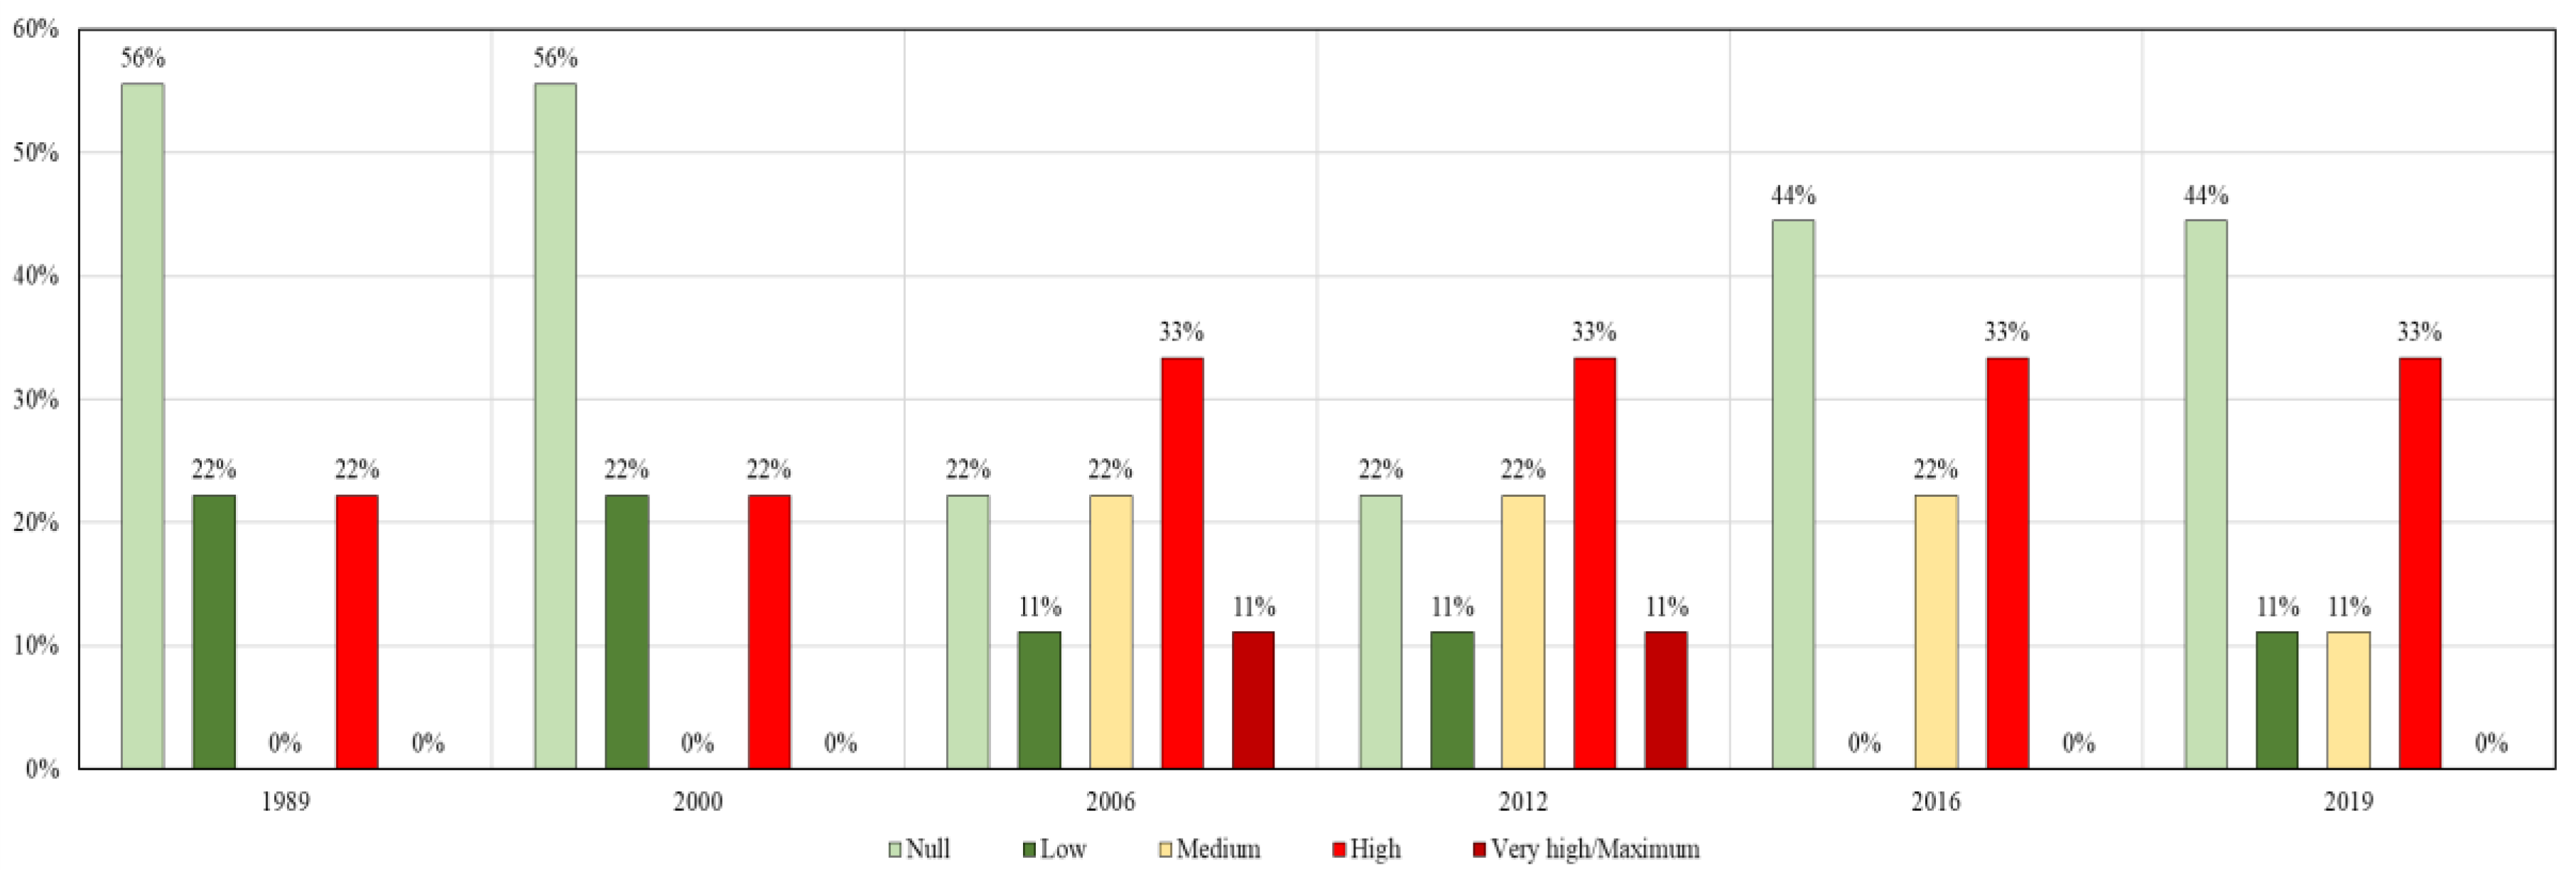
4.2. Dune Fragmentation Analysis
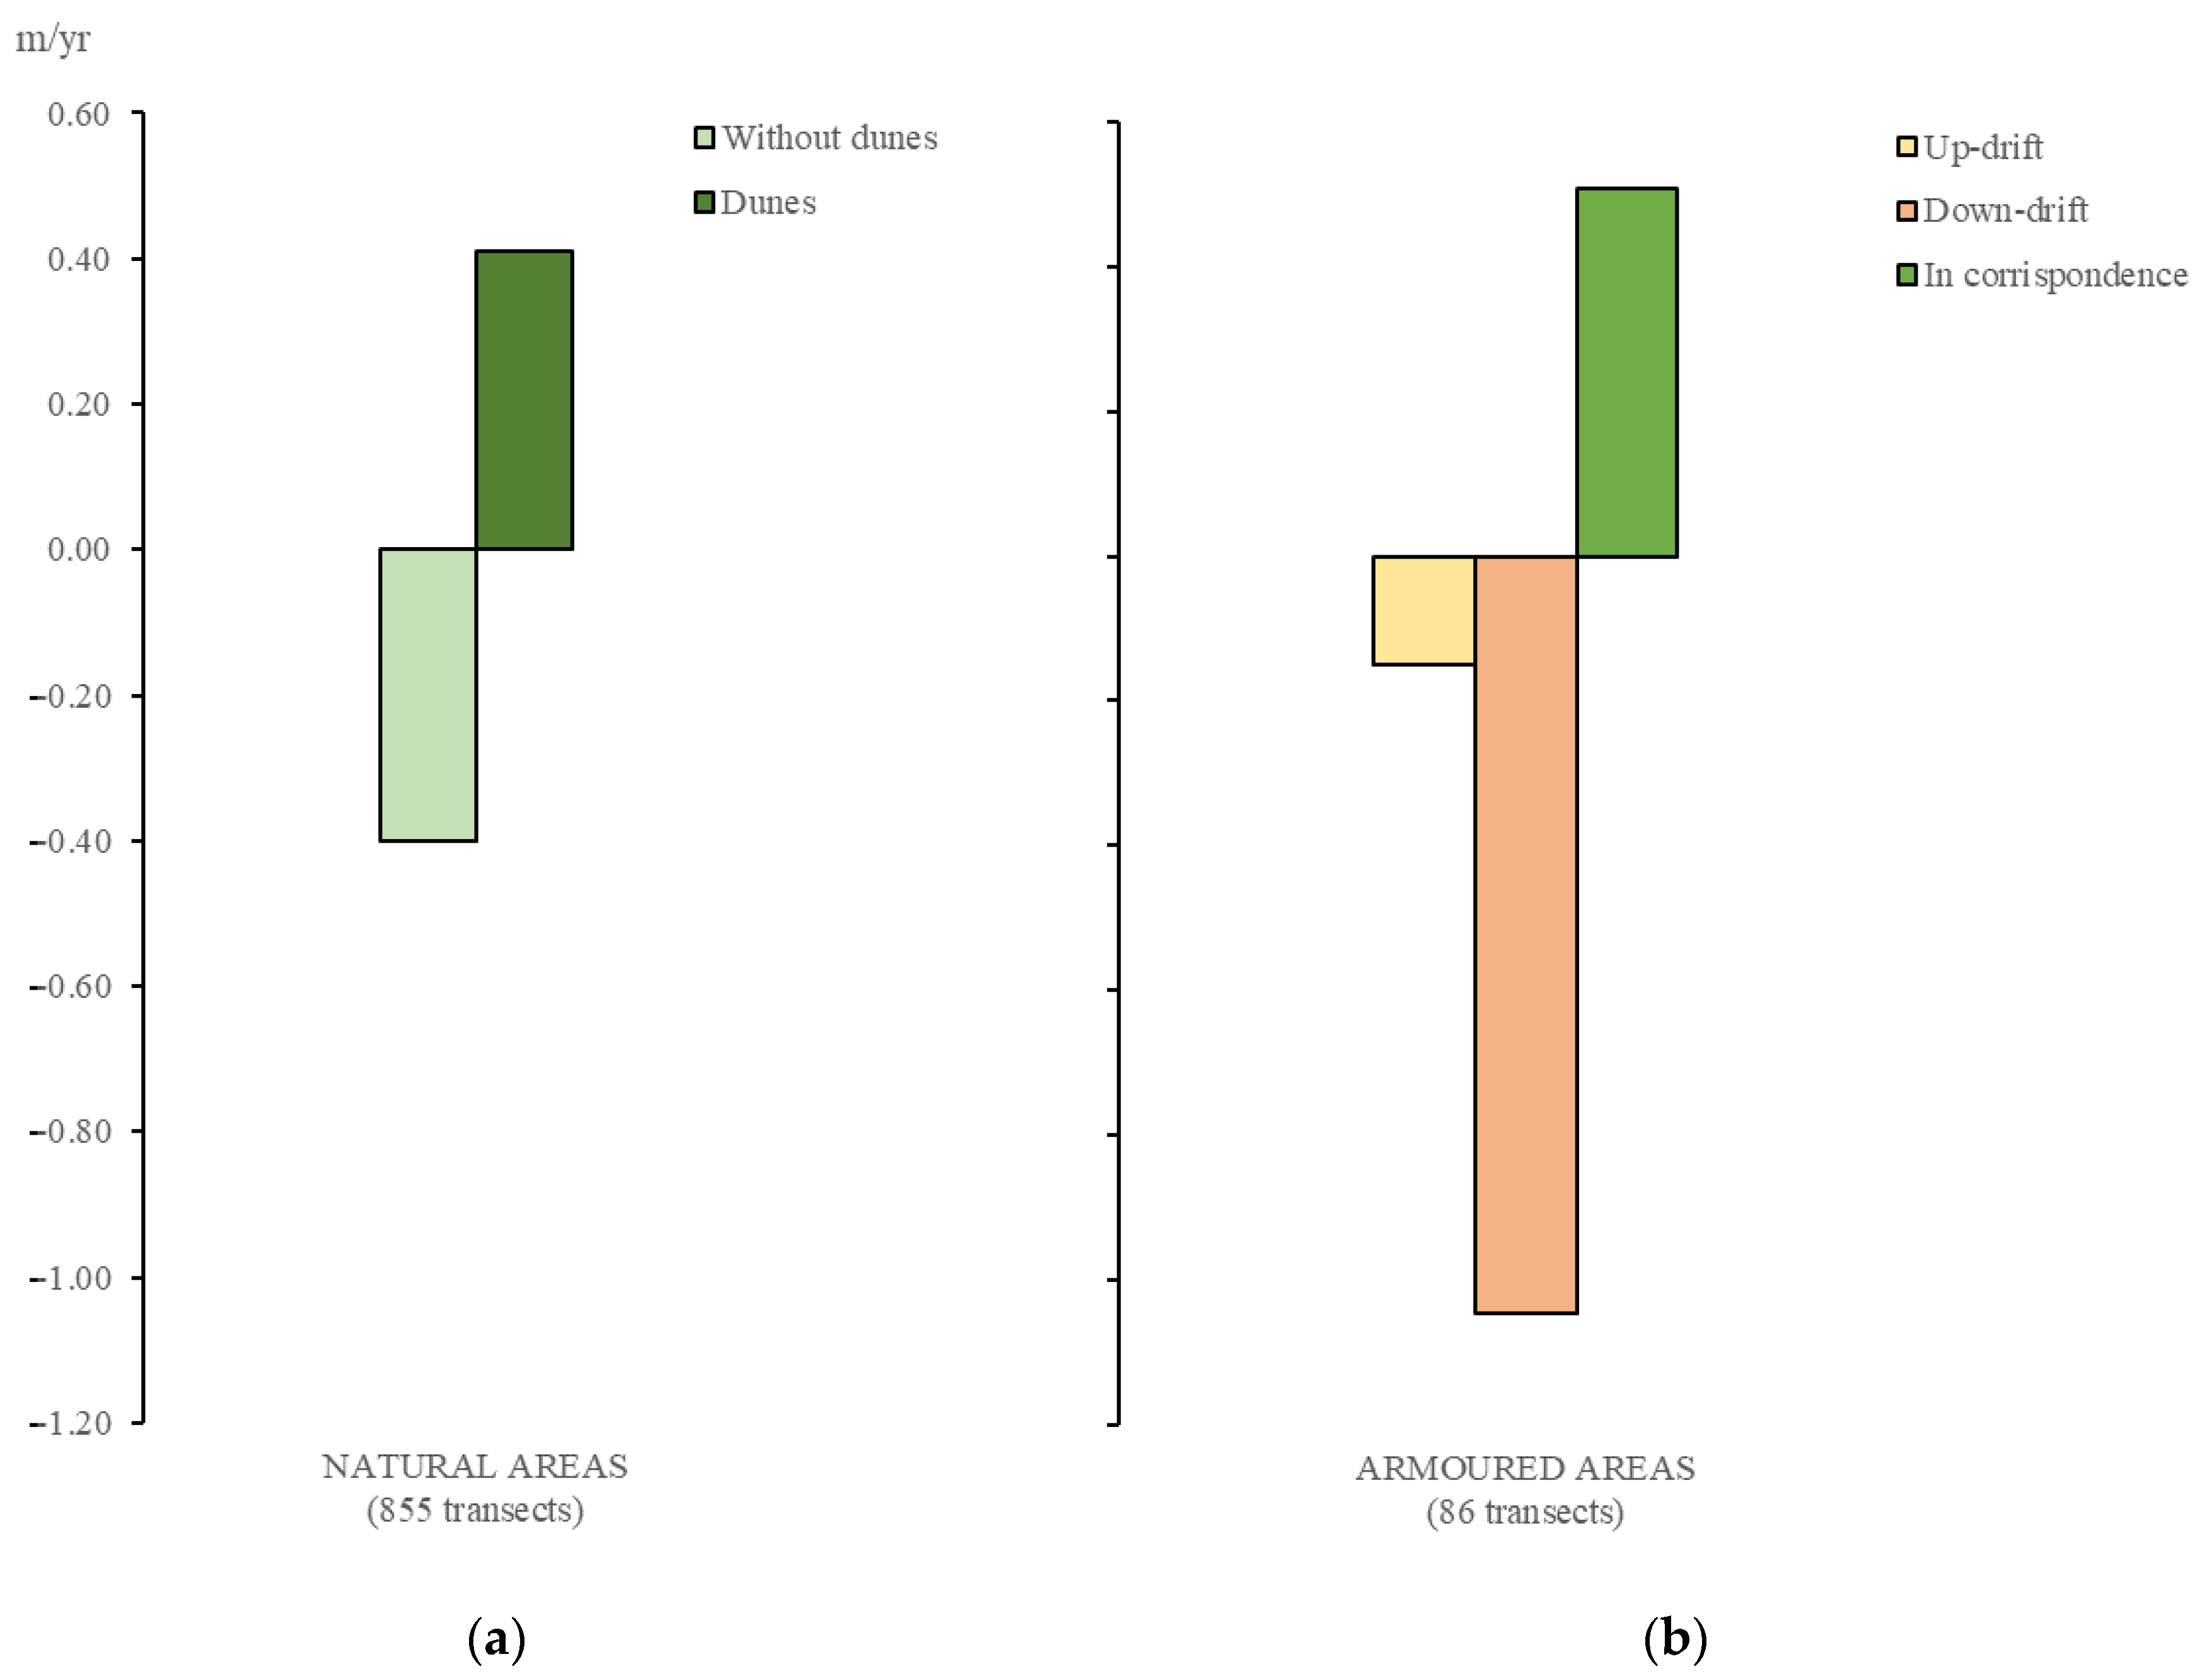
4.3. Coastal Armouring Analysis
5. Discussion
6. Conclusions
Author Contributions
Funding
Informed Consent Statement
Data Availability Statement
Acknowledgments
Conflicts of Interest
References
- Bird, E.C.F. Submerging Coasts: The Effects of a Rising Sea Level on Coastal Environments; Wiley and Sons: New York, NY, USA, 1993; p. 184. [Google Scholar]
- Pethick, J. Coastal management and sea-level rise. Catena 2001, 42, 307–322. [Google Scholar] [CrossRef]
- Todd, P.A.; Heery, E.C.; Loke, L.H.; Thurstan, R.H.; Kotze, D.J.; Swan, C. Towards an urban marine ecology: Characterizing the drivers, patterns and processes of marine ecosystems in coastal cities. Oikos 2019, 128, 1215–1242. [Google Scholar] [CrossRef]
- Komar, P.D. Beach Processes and Sedimentation, 2nd ed.; Prentice Hall: Upper Saddle River, NJ, USA, 1998; p. 544. [Google Scholar]
- Molina, R.; Manno, G.; Re, C.L.; Anfuso, G. Dune systems’ characterization and evolution in the Andalusia Mediterranean Coast (Spain). Water 2020, 12, 2094. [Google Scholar] [CrossRef]
- Di Stefano, A.; De Pietro, R.; Monaco, C.; Zanini, A. Anthropogenic influence on coastal evolution: A case history from the Catania Gulf shoreline (eastern Sicily, Italy). Ocean. Coast. Manag. 2013, 80, 133–148. [Google Scholar] [CrossRef]
- Wong, P.P.; Losada, I.J.; Gattuso, J.-P.; Hinkel, J.; Khattabi, A.; McInnes, K.L.; Saito, Y.; Sallenger, A.; Cheong, S.-M.; Dow, K.; et al. Coastal systems and low-lying areas. In Climate Change 2007: Impacts, Adaptation and Vulnerability. Contribution of Working Group II to the Fourth Assessment Report of the Intergovernmental Panel on Climate Change; Nicholls, R.J., Santos, F., Eds.; Cambridge University Press: Cambridge, UK, 2007; pp. 315–356. [Google Scholar]
- European Environmental Agency. The Changing Faces of Europe’s Coastal Areas; Office for Official Publications of the European Communities: Bruxelles, Belgium, 2006. [Google Scholar]
- Romine, B.M.; Fletcher, C.H. Armoring on eroding coasts leads to beach narrowing and loss on Oahu, Hawaii. In Pitfalls of Shoreline Stabilization; Springer: Dordrecht, The Netherlands, 2012; pp. 141–164. [Google Scholar]
- Crowell, M.; Leatherman, S.P.; Buckley, M.K. Historical shoreline change: Error analysis and mapping accuracy. J. Coast. Res. 1991, 7, 839–852. [Google Scholar]
- Galgano, F.A.; Douglas, B.C.; Leatherman, S.P. Trends and variability of shoreline position. J. Coast. Res. 1998, 26, 282–291. [Google Scholar]
- Molina, R.; Anfuso, G.; Manno, G.; Gracia Prieto, F.J. The Mediterranean coast of Andalusia (Spain): Medium-term evolution and impacts of coastal structures. Sustainability 2019, 11, 3539. [Google Scholar] [CrossRef]
- Amrouni, O.; Sánchez, A.; Khélifi, N.; Benmoussa, T.; Chiarella, D.; Mahé, G.; Abdeljaouad, S.; & McLare, P. Sensitivity assessment of the deltaic coast of Medjerda based on fine-grained sediment dynamics, Gulf of Tunis, Western Mediterranean. J. Coast. Conserv. 2019, 23, 571–587. [Google Scholar] [CrossRef]
- Coelho, C.; Silva, R.; Veloso-Gomes, F.; Taveira Pinto, F. A vulnerability analysis approach for the Portuguese west coast. In Risk Analysis V: Simulation and Hazard Mitigation; Popov, V., Brebbia, C.A., Eds.; WIT Press: Southampton, UK, 2006; pp. 251–262. [Google Scholar]
- Anfuso, G.; Martínez Del Pozo, J.Á. Assessment of coastal vulnerability through the use of GIS tools in South Sicily (Italy). Environ. Manag. 2009, 43, 533–545. [Google Scholar] [CrossRef] [PubMed][Green Version]
- Dolan, R.; Fenster, M.S.; Holme, S.J. Temporal analysis of shoreline recession and accretion. J. Coast. Res. 1991, 7, 723–744. [Google Scholar]
- Crowell, M.; Leatherman, S.P.; Buckley, M.K. Shoreline change rate analysis: Long term versus short term data. Shore Beach 1993, 61, 13–20. [Google Scholar]
- Molina, R.; Manno, G.; Re, C.L.; Anfuso, G.; Ciraolo, G. A Methodological approach to determine sound response modalities to coastal erosion processes in mediterranean andalusia (Spain). JMSE 2020, 8, 154. [Google Scholar] [CrossRef]
- Salman, A.; Lombardo, S.; Doody, P. Living with Coastal Erosion in Europe: Sediment and Space for Sustainability; Hydraulic Engineering Reports; Eurosion project; EUCC: Porto, Portugal, 2004; p. 21. [Google Scholar]
- Sicilian Region—Office of the Commissioner of Government against the Hydrogeological Instability in the Sicilian Region. In Regional Plan against Coastal Erosion 2020; v. 1.0; Sicilian Region—Office of the Commissioner of Government: Sicily, Italy, 2020; p. 1527.
- Aybulatov, N.A.; Artyukhin, Y.V. Geo-Ecology of the World Ocean’s Shelf and Coasts; Hydrometeo Publishing: Saint Petersburg, Russia, 1993; p. 304. [Google Scholar]
- Brambati, A.; Amore, C.; Giuffrida, E.; Randazzo, G. Relationship between the port structures and coastal dynamics in the Gulf of Gela (Sicily-Italy). In Proceedings of the International Coastal Congress ICC, Kiel, Germany, 6–13 September 1992; pp. 773–793. [Google Scholar]
- Amore, C.; Geremia, F.; Randazzo, G. Historical evolution of the Salso River mouth with respect to the Licata harbour system (Southern Sicily, Italy). In Littoral The Changing Coast; EUROCOAST/EUCC: Porto, Portugal, 2002; pp. 253–260. [Google Scholar]
- Martino, C.; Curcuruto, E.; Di Stefano, A.; Monaco, C.; Zanini, A. Fenomeni erosivi lungo il litorale di Marina di Butera (CL), Sicilia centro-meridionale. Geol. Di Sicil. 2011, 3, 4–15. [Google Scholar]
- Regione Siciliana—Assessorato Territorio e Ambiente—Dipartimento Territorio e Ambiente. Servizio III Assetto del Territorio e Difesa del Suolo. Piano Stralcio di Bacino per l’Assetto Idrogeologico della Regione Siciliana; (P.A.I.). Bacino Idrografico del F. Imera Meridionale (072) Area territoriale tra il Bacino Idrografico del F. Palma e il Bacino Idrografico del F. Imera Meridionale (071). 2008. Available online: https://www.sitr.regione.sicilia.it/pai/bacini.htm (accessed on 27 September 2021).
- Anfuso, G.; Martínez del Pozo, J.Á.; Rangel-Buitrago, N. Bad practice in erosion management: The southern Sicily case study. In Pitfalls of Shoreline Stabilization: Selected Case Studies; Cooper, J.A.G., Pilkey, O.H., Eds.; Springer: Berlin/Heidelberg, Germany, 2012; Volume 3, pp. 215–233. [Google Scholar]
- Regione Siciliana—Assessorato Territorio e Ambiente, Dipartimento Territorio e Ambiente. Servizio 4, Assetto del territorio e difesa del suolo. Piano Stralcio di Bacino per l’Assetto Idrogeologico; (P.A.I.). UNITA’ FISIOGRAFICA N° 8—PUNTA BRACCETTO—PORTO DI LICATA. 2007. Available online: https://www.sitr.regione.sicilia.it/pai/unitafisiografiche.htm (accessed on 30 September 2021).
- Foti, E.; Musumeci, R.E.; Leanza, S.; Cavallaro, L. Feasibility of an offshore wind farm in the gulf of Gela: Marine and structural issues. Wind. Eng. 2010, 34, 65–84. [Google Scholar] [CrossRef]
- European Commission. Available online: http://ec.europa.eu/environment/nature/legislation/habitatsdirective/index_en.htm (accessed on 24 March 2020).
- Brullo, S.; Minissale, P.; Spampinato, G. Considerazioni fitogeografiche sulla flora della Sicilia. Ecol. Mediterr. 1995, 21, 99–117. [Google Scholar] [CrossRef]
- Giusso Del Galdo, G.; Sciandrello, S. Contributo alla flora dei dintorni di Gela (Sicilia meridionale). In 98° Congresso della Società Botanica Italiana, Riassunti; Università di Catania: Catania, Italy, 2003; p. 235. [Google Scholar]
- Boak, E.H.; Turner, I.L. Shoreline definition and detection: A review. J. Coast. Res. 2005, 21, 688–703. [Google Scholar] [CrossRef]
- Geoportale Nazionale. Available online: http://www.pcn.minambiente.it/mattm (accessed on 16 July 2021).
- Google Earth. Available online: https://earth.google.com/web (accessed on 16 July 2021).
- Thieler, E.R.; Himmelstoss, E.A.; Zichichi, J.L.; Ergul, A. Digital Shoreline Analysis System (DSAS) version 4.0—An ArcGIS Extension for Calculating Shoreline Change; U.S.G.S. Open-File Report; U.S. Geological Survey: Reston, VA, USA, 2008; Volume 1278. [Google Scholar]
- Manno, G.; Lo Re, C.; Ciraolo, G. Uncertainties in shoreline position analysis: The role of run-up and tide in a gentle slope beach. Ocean Sci. 2017, 13, 661–671. [Google Scholar] [CrossRef]
- Fletcher, C.; Rooney, J.; Barbee, M.; Lim, S.C.; Richmond, B. Mapping shoreline change using digital orthophotogrammetry on Maui, Hawaii. J. Coast. Res. 2003, 38, 106–124. [Google Scholar]
- Genz, A.S.; Fletcher, C.H.; Dunn, R.A.; Frazer, L.N.; Rooney, J.J. The predictive accuracy of shoreline change rate methods and alongshore beach variation on Maui, Hawaii. J. Coast. Res. 2007, 23, 87–105. [Google Scholar] [CrossRef]
- Romine, B.M.; Fletcher, C.H.; Frazer, L.N.; Genz, A.S.; Barbee, M.M.; Lim, S.C. Historical shoreline change, southeast Oahu, Hawaii; applying polynomial models to calculate shoreline change rates. J. Coast. Res. 2009, 25, 1236–1253. [Google Scholar] [CrossRef]
- Virdis, S.G.; Oggiano, G.; Disperati, L. A geomatics approach to multitemporal shoreline analysis in Western Mediterranean: The case of Platamona-Maritza beach (northwest Sardinia, Italy). J. Coast. Res. 2012, 28, 624–640. [Google Scholar]
- Amore, C.; Randazzo, G. First data on the coastal dynamics and the sedimentary characteristics of the area influenced by the River Irminio basin (SE Sicily). Catena 1997, 30, 357–368. [Google Scholar] [CrossRef]
- Pranzini, E. Pandemics and coastal erosion in Tuscany (Italy). Ocean Coast. Manag. 2021, 208, 105614. [Google Scholar] [CrossRef]
- Zengcui, H.; Zeheng, D. Reclamation and river training in the Qiantang estuary. In Engineered Coasts; Chen, J., Eisma, D., Hotta, H.J., Walker, H.J., Eds.; Kluwer Academic Press: Dordrecht, The Netherlands, 2002; pp. 121–138. [Google Scholar]
- Rosskopf, C.M.; Di Paola, G.; Atkinson, D.E. Recent shoreline evolution and beach erosion along the central Adriatic coast of Italy: The case of Molise region. J. Coast. Conserv. 2018, 22, 879–895. [Google Scholar] [CrossRef]
- Syvitski, J.P.; Vörösmarty, C.J.; Kettner, A.J.; Green, P. Impact of humans on the flux of terrestrial sediment to the global coastal ocean. Science 2005, 308, 376–380. [Google Scholar] [CrossRef]
- Griggs, G.B. The impacts of coastal armoring. Shore Beach 2005, 73, 13–22. [Google Scholar]
- Dugan, J.; Airoldi, L.; Chapman, M.; Walker, S.; Schlacher, T.; Wolanski, E.; McLusky, D. Estuarine and coastal structures: Environmental effects, a focus on shore and nearshore structures. In Treatise on Estuarine and Coastal Sciencem; Wolanski, E., McLusky, D.S., Eds.; Academic Press: Waltham, MA, USA, 2011; Volume 8, pp. 17–41. [Google Scholar]
- Hesp, P. Foredunes and blowouts: Initiation, geomorphology and dynamics. Geomorphology 2002, 48, 245–268. [Google Scholar] [CrossRef]
- Scarelli, F.M.; Sistilli, F.; Fabbri, S.; Cantelli, L.; Barboza, E.G.; Gabbianelli, G. Seasonal Dune and beach monitoring using photogrammetry from UAV surveys to apply in the ICZM on the Ravenna coast (Emilia-Romagna, Italy). Remote. Sens. Appl. 2017, 7, 27–39. [Google Scholar] [CrossRef]
- Díez-Garretas, B.; Comino, O.; Pereña, J.; Asensi, A. Spatio-temporal changes (1956–2013) of coastal ecosystems in Southern Iberian Peninsula (Spain). Mediterr. Bot. 2019, 40, 111–119. [Google Scholar] [CrossRef]
- Carrasco, A.R.; Ferreira, O.; Matias, A.; Freire, P. Natural and human-induced coastal dynamics at back-back barrier beach. Geomorphology 2012, 159–160, 30–36. [Google Scholar] [CrossRef]
- Psuty, N.P. Sediment budget and beach/dune interaction. J. Coast. Res. 1988, 3, 1–4. [Google Scholar]
- Sherman, D.J.; Bauer, B.O. Dynamics of beach-dune interaction Progress. Phys. Geogr. 1993, 17, 413–447. [Google Scholar] [CrossRef]
- Manno, G.; Ciraolo, G. Diachronic analysis of the shoreline in San Leone beach (Agrigento-Sicily). In Establishment of an Integrated Italy-Malta Cross-Border System of Civil Protection—Geological Aspects; Aracne: Catania, Italy, 2015. [Google Scholar]
- Anfuso, G.; del Pozo, J.Á.M. Towards management of coastal erosion problems and human structure impacts using GIS tools: Case study in Ragusa Province, Southern Sicily, Italy. Environ. Geol. 2005, 48, 646–659. [Google Scholar] [CrossRef]
- Charlier, R.H.; Chaineux, M.C.P.; Morcos, S. Panorama of the history of coastal protection. J. Coast. Res. 2005, 21, 79–111. [Google Scholar] [CrossRef]
- Stancheva, M.; Marinski, J. Coastal defense activities along the Bulgarian Black Sea coast-methods for protection or degradation? In Coastal Structures, Proceedings of the 5th International Conference, Venice, Italy, 2–4 July 2007; Franco, L., Tomasicchio, G., Lamberti, A., Eds.; World Scientific Publishing Company: Singapore, 2007; pp. 480–489. [Google Scholar]
- Stancheva, M. Human-induced impacts along the Coastal Zone of Bulgaria. A pressure boom versus environment. Compt. Rend. Acad. Bulg. Sci. 2007, 63, 137–146. [Google Scholar]
- Manno, G.; Anfuso, G.; Messina, E.; Williams, A.T.; Suffo, M.; Liguori, V. Decadal evolution of coastline armouring along the Mediterranean Andalusia littoral (South of Spain). Ocean Coast. Manag. 2016, 124, 84–99. [Google Scholar] [CrossRef]
- Anfuso, G.; Dominguez, L.; Gracia, F. Short and medium-term evolution of a coastal sector in Cadiz, SW Spain. Catena 2007, 70, 229–242. [Google Scholar] [CrossRef]
- Sousa, P.; Siegle, E.; Tessler, M. Vulnerability assessment of Massaguaçú Beach (SE Brazil). Ocean. Coast. Manag. 2013, 77, 24–30. [Google Scholar] [CrossRef]
- Sousa, P.; Siegle, E.; Tessler, M. Environmental and anthropogenic indicators for coastal risk assessment at Massaguaçú Beach (SP) Brazil. J. Coast. Res. 2011, 64, 319–323. [Google Scholar]
- Oliver, T.; Tamura, T.; Short, A.; Woodroffe, C. Rapid shoreline progradation followed by vertical foredune building at Pedro Beach, southeastern Australia. Earth Surf. Process. Landf. 2018, 44, 655–666. [Google Scholar] [CrossRef]
- Manca, E.; Pascucci, V.; Deluca, M.; Cossu, A.; Andreucci, S. Shoreline evolution related to coastal development of a managed beach in Alghero, Sardinia, Italy. Ocean. Coast. Manag. 2013, 85, 65–76. [Google Scholar] [CrossRef]
- Saye, S.E.; Van der Wal, D.; Pye, K.; Blott, S.J. Beach—Dune morphological relationships and erosion/accretion: An investigation at five sites in England and Wales using LIDAR data. Geomorphology 2005, 72, 128–155. [Google Scholar] [CrossRef]


| Class | m/yr |
|---|---|
| Very high erosion | <−1.5 |
| High erosion | ≥−1.5; <−0.7 |
| Moderate erosion | ≥−0.7; <−0.4 |
| Stability | ≥−0.4; ≤+0.4 |
| Moderate accretion | >+0.4; ≤+0.7 |
| High accretion | >+0.7; ≤+1.5 |
| Very high accretion | +1.5 |
| Year | Sector | Total Coastal Length (L) | Total Structure Length (l) | K |
|---|---|---|---|---|
| 1955 | 1 | 9826 | 7706 | 0.8 |
| 1966 | 1 | 10,134 | 8443 | 0.8 |
| 1989 | 1 | 10,216 | 11,969 | 1.2 |
| 2000 | 1 | 10,198 | 13,640 | 1.3 |
| 2006 | 1 | 9727 | 13,918 | 1.4 |
| 2012 | 1 | 9732 | 15,014 | 1.5 |
| 2019 | 1 | 9719 | 15,456 | 1.6 |
Publisher’s Note: MDPI stays neutral with regard to jurisdictional claims in published maps and institutional affiliations. |
© 2021 by the authors. Licensee MDPI, Basel, Switzerland. This article is an open access article distributed under the terms and conditions of the Creative Commons Attribution (CC BY) license (https://creativecommons.org/licenses/by/4.0/).
Share and Cite
Borzì, L.; Anfuso, G.; Manno, G.; Distefano, S.; Urso, S.; Chiarella, D.; Di Stefano, A. Shoreline Evolution and Environmental Changes at the NW Area of the Gulf of Gela (Sicily, Italy). Land 2021, 10, 1034. https://doi.org/10.3390/land10101034
Borzì L, Anfuso G, Manno G, Distefano S, Urso S, Chiarella D, Di Stefano A. Shoreline Evolution and Environmental Changes at the NW Area of the Gulf of Gela (Sicily, Italy). Land. 2021; 10(10):1034. https://doi.org/10.3390/land10101034
Chicago/Turabian StyleBorzì, Laura, Giorgio Anfuso, Giorgio Manno, Salvatore Distefano, Salvatore Urso, Domenico Chiarella, and Agata Di Stefano. 2021. "Shoreline Evolution and Environmental Changes at the NW Area of the Gulf of Gela (Sicily, Italy)" Land 10, no. 10: 1034. https://doi.org/10.3390/land10101034
APA StyleBorzì, L., Anfuso, G., Manno, G., Distefano, S., Urso, S., Chiarella, D., & Di Stefano, A. (2021). Shoreline Evolution and Environmental Changes at the NW Area of the Gulf of Gela (Sicily, Italy). Land, 10(10), 1034. https://doi.org/10.3390/land10101034