Article

Toward Cleaner Production: Can Mobile Phone Technology Help Reduce Inorganic Fertilizer Application? Evidence Using a National Level Dataset

1
College of Management, Sichuan Agricultural University, Chengdu 611100, China
2
College of Agriculture and Human Sciences, Prairie View A&M University, Prairie View, TX 77446, USA
3
Department of Agricultural Extension and Rural Society, College of Food and Agriculture Sciences, King Saud University, Riyadh 11451, Saudi Arabia
4
College of Horticulture and Forestry, Huazhong Agricultural University, Wuhan 430070, China
5
College of Landscape Architecture, Sichuan Agricultural University, Chengdu 611130, China
6
Department of Economics and Agricultural Economics, PMAS-Arid Agriculture University, Rawalpindi 46000, Pakistan
7
School of Economics, University of Johannesburg, Johannesburg 2006, South Africa
*
Author to whom correspondence should be addressed.
Land 2021, 10(10), 1023; https://doi.org/10.3390/land10101023
Submission received: 20 June 2021 / Revised: 13 September 2021 / Accepted: 27 September 2021 / Published: 29 September 2021

Abstract

:
Increasing agricultural production and optimizing inorganic fertilizer (IF) use are imperative for agricultural and environmental sustainability. Mobile phone usage (MPU) has the potential to reduce IF application while ensuring environmental and agricultural sustainability goals. The main objectives of this study were to assess MPU, mobile phone promotion policy, and whether the mediation role of human capital can help reduce IF use. This study used baseline regression analysis and propensity score matching, difference-in-differences (PSM-DID) to assess the impact of MPU on IF usage. However, the two-stage instrumental variables method (IVM) was used to study the effects of mobile phone promotion policy on IF usage. This study used a national dataset from 7987 rural households in Afghanistan to investigate the impacts of MPU and associated promotion policies on IF application. The baseline regression outcomes showed that the MPU significantly reduced IF usage. The evaluation mechanism revealed that mobile phones help reduce IF application by improving the human capital of farmers. Besides, evidence from the DID technique showed that mobile phone promotion policies lowered IF application. These results remained robust after applying the PSM-DID method and two-stage IVM to control endogenous decisions of rural households. This study results imply that enhancing the accessibility of wideband in remote areas, promoting MPU, and increasing investment in information communication technologies (ICTs) infrastructure can help decrease the IF application in agriculture. Thus, the government should invest in remote areas to facilitate access to ICTs, such as having a telephone and access to a cellular and internet network to provide an environment and facility to apply IF effectively. Further, particular policy support must focus on how vulnerable populations access the internet and mobile phone technologies.

1. Introduction

Food security is one of the main challenges for developing countries to feed a rapidly growing population [1,2]. The current world population of 7.8 billion is expected to reach 9.8 billion by 2050, increasing more than 25% from the current population [3,4,5,6,7,8,9]. Therefore, many developing economies widely adopted several methods, particularly, using more chemical or inorganic fertilizers (IF), to enhance food production and supply to face growing demand [10,11,12,13,14]. Growers and farmers apply chemical fertilizers, including nitrogen, phosphorous, and potassium, to increase crop production. However, when the fertilizer is not used effectively, or excessive fertilizer is not fully utilized by growing plants, it causes environmental degradation, including soil, air, and water pollution [15]. Environmental degradation associated with soil, air, and water significantly impacts human health, ecology, agricultural production, and climate [16]. For example, environmental degradation enhances greenhouse gas emissions that cause global warming, which negatively impacts climate change [17]. Also, polluted soil, air, and water affect food security and agricultural production [18,19].
According to Savci [20], to meet the growing demand for food, the per unit area of agricultural land needs to achieve the highest efficiency and highest quality products. Plant nutrition is one of the most important factors to control agricultural productivity and food quality. For example, India has the world’s largest arable land area, followed by the United States and China, according to Huang et al. [21]. To meet increasing food demand, India and China widely use chemical fertilizers [22]. If the IF is not used efficiently, which costs money, first, it could be a waste of money. Secondly, it could negatively impact the environment and human health because of the possibilities inhalation of ammonia and dust from the manure [6,23,24,25,26,27,28,29]. Around the world, groundwater made an important contribution to the gradual realization of water rights. Groundwater is the main source of drinking water and irrigation water in many countries. Overuse fertilization leads to excessive groundwater pollution. Disproportionate use of IF damages groundwater quality and causes serious public health problems such as hemoglobin disorders, Alzheimer’s disease, and diabetes mellitus [30,31,32,33,34,35,36]. Overall, the environmental sustainability of emerging countries is under threat due to the extensive use of IF [11,37,38].
Consequently, it is essential to identify the best relationship between IF usage and agricultural production. The fundamental solution to this challenge is to advocate reducing IF use while promoting the usage of organic fertilizer, which requires awareness, tools, and essential knowledge about the precise use of fertilizers and crop nutrients requirements [11,39]. Farmers and growers must understand the importance of new technology such as information and communication technologies (ICTs) to advance their essential knowledge about the appropriate use of fertilizers and crop nutrients requirements [40]. One of the most suitable and proper communication technologies is the mobile phone. Since most small growers cannot obtain advanced science-based agricultural equipment, mobile phone technology provides opportunities to shift from traditional agriculture to modern agriculture by providing information about advanced agricultural equipment as well as market trends and prices. The latest information on weather conditions and mobile phones can benefit farmers in developing countries and improve farmers’ access to agricultural information in Asian, African, and Latin American countries [41,42,43,44]. According to Fabregas et al. [45], Nie et al. [46], and Zhao et al. [47], mobile phone and Internet technology (IT), especially smartphones, can bring advanced science-based agricultural advice to small growers to reduce IF and increase productivity, particularly in the context of rapid variations in economic and ecological conditions.
Mobile phone services allow users to use a variety of ICTs, reduce transaction prices, and increase market access effectively. The main financial services provided through value chain ICT solutions are transfer and payment, credit, savings, insurance, and financial derivatives. ICT can help improve the conditions of rural communities, mainly by persuading financial institutions to enter potential rural markets in unconventional ways [7,48,49]. Mobile phone usage (MPU) helps increase productivity and profitability [50,51], alleviates losses affected by environmental disasters [52,53], and mitigates environmental pollution [54]. Compared to that of developed nations, the agricultural sector of emerging countries is dominated by small-scale farming, which can get optimum benefits from ICTs [7,55]. Several researchers assessed the significance of ICTs, such as the impact of MPU on farmers’ lives and socioeconomic benefits in emerging nations. For instance, researchers conducted studies in remote areas of Iran, Pakistan, India, and China and observed that ICTs positively influence growers’ welfare and profits [46,55,56,57]. Besides, several assessments examined the association between the adoption of ICTs and smart farming systems. For example, Kaila and Tarp [58] indicated that mobile phones and internet network access contributed 6.8% to the growth of Vietnam’s agricultural output. Several researchers assessed that the use of computers in many countries improved agricultural land, reduced labor input, and increased farmers’ trading capabilities. Farmers rely on computers to help them evaluate and use data from satellite imagery and various other electronic monitoring systems on the farm. Using computers and related information through the internet can help control the application of certain fertilizers, herbicides, and pesticides through an automatic delivery system. The computer also allows the precise application of water through the irrigation system. The computer system can be used to apply irrigation according to the needs of the crop [59]. Additionally, researchers found that access to the correct information at the right time would accelerate growers’ market contribution and sales decisions in local markets in Peru [7,60]. However, little empirical evidence exists on the impact of MPU on IF application in developing countries. Hence, it is essential to know whether MPU can reduce the IF application in an emerging nation.
This study examined the influence of MPU on IF use in Afghanistan, where the use of IF was the usual practice in the agricultural sector for the past few decades [61,62]. Farming practices in Afghanistan lack crop rotation, are limited in their use of organic residues and involve extensive tillage, which causes a decrease in crop yield and an increase in environmental degradation [63]. The Afghan government realized the importance of controlling IF usage and regards it as a crucial part of green farming evolution when climate change is already deteriorating the environment [63,64,65,66]. Meanwhile, mobile phone technology is becoming more popular in rural communities of Afghanistan. Since 2001, millions of residents, including farmers and growers are using mobile phones [67,68]. This increasing use of mobile phones provides an opportunity for empirical research on the influence of mobile phone technology usage on IF application in the context of an emerging economic system.
The current study aimed to address the following research questions: (1) can MPU help reduce IF use by decreasing the intensity of fertilizer application? (2) how can human capital mediate the effects of MPU on the intensity of IF application? and (3) can mobile phone promotion policy decrease the intensity of IF usage? To answer these questions, this study conducted a baseline regression analysis to observe mobile phones’ direct impact on IF usage. Afterward, it needed to reveal the mediation role of human capital between mobile phones and IF usage by growers. Propensity score matching, difference-in-differences (PSM-DID), and two-stage instrumental variables methods (IVM) were used to study mobile phone promotion policy impacts on IF usage.
This research contributes to agricultural science and farming communities in the following ways. Firstly, empirically studied mobile phones’ effect on IF usage in the context of an emerging economy. Though many studies explored the impact of mobile phones on agricultural advancement [69,70,71], few researchers observed the influence of mobile phones and IT on fertilizer application in the farming sector in developing countries [64,72]. Secondly, it explored the potential mediating role of human capital between mobile phones and IF usage. The existing studies aim to directly influence human capital, such as training, health, and education, on IF usage [25,73,74]. Thirdly, we used the DID method to study the impacts of mobile phone promotion strategy on household IF usage. Fourthly, we employed the PSM-DID and the two-stage IVM to solve the endogeneity problem related to MPU.
The remainder of the article is organized as follows. Section 2 provides the conceptual framework of the study. Section 3 introduces the study area, sampling and data, and data modeling. Section 4 describes the results and discussion of the study. The last section includes the conclusion and recommendations.

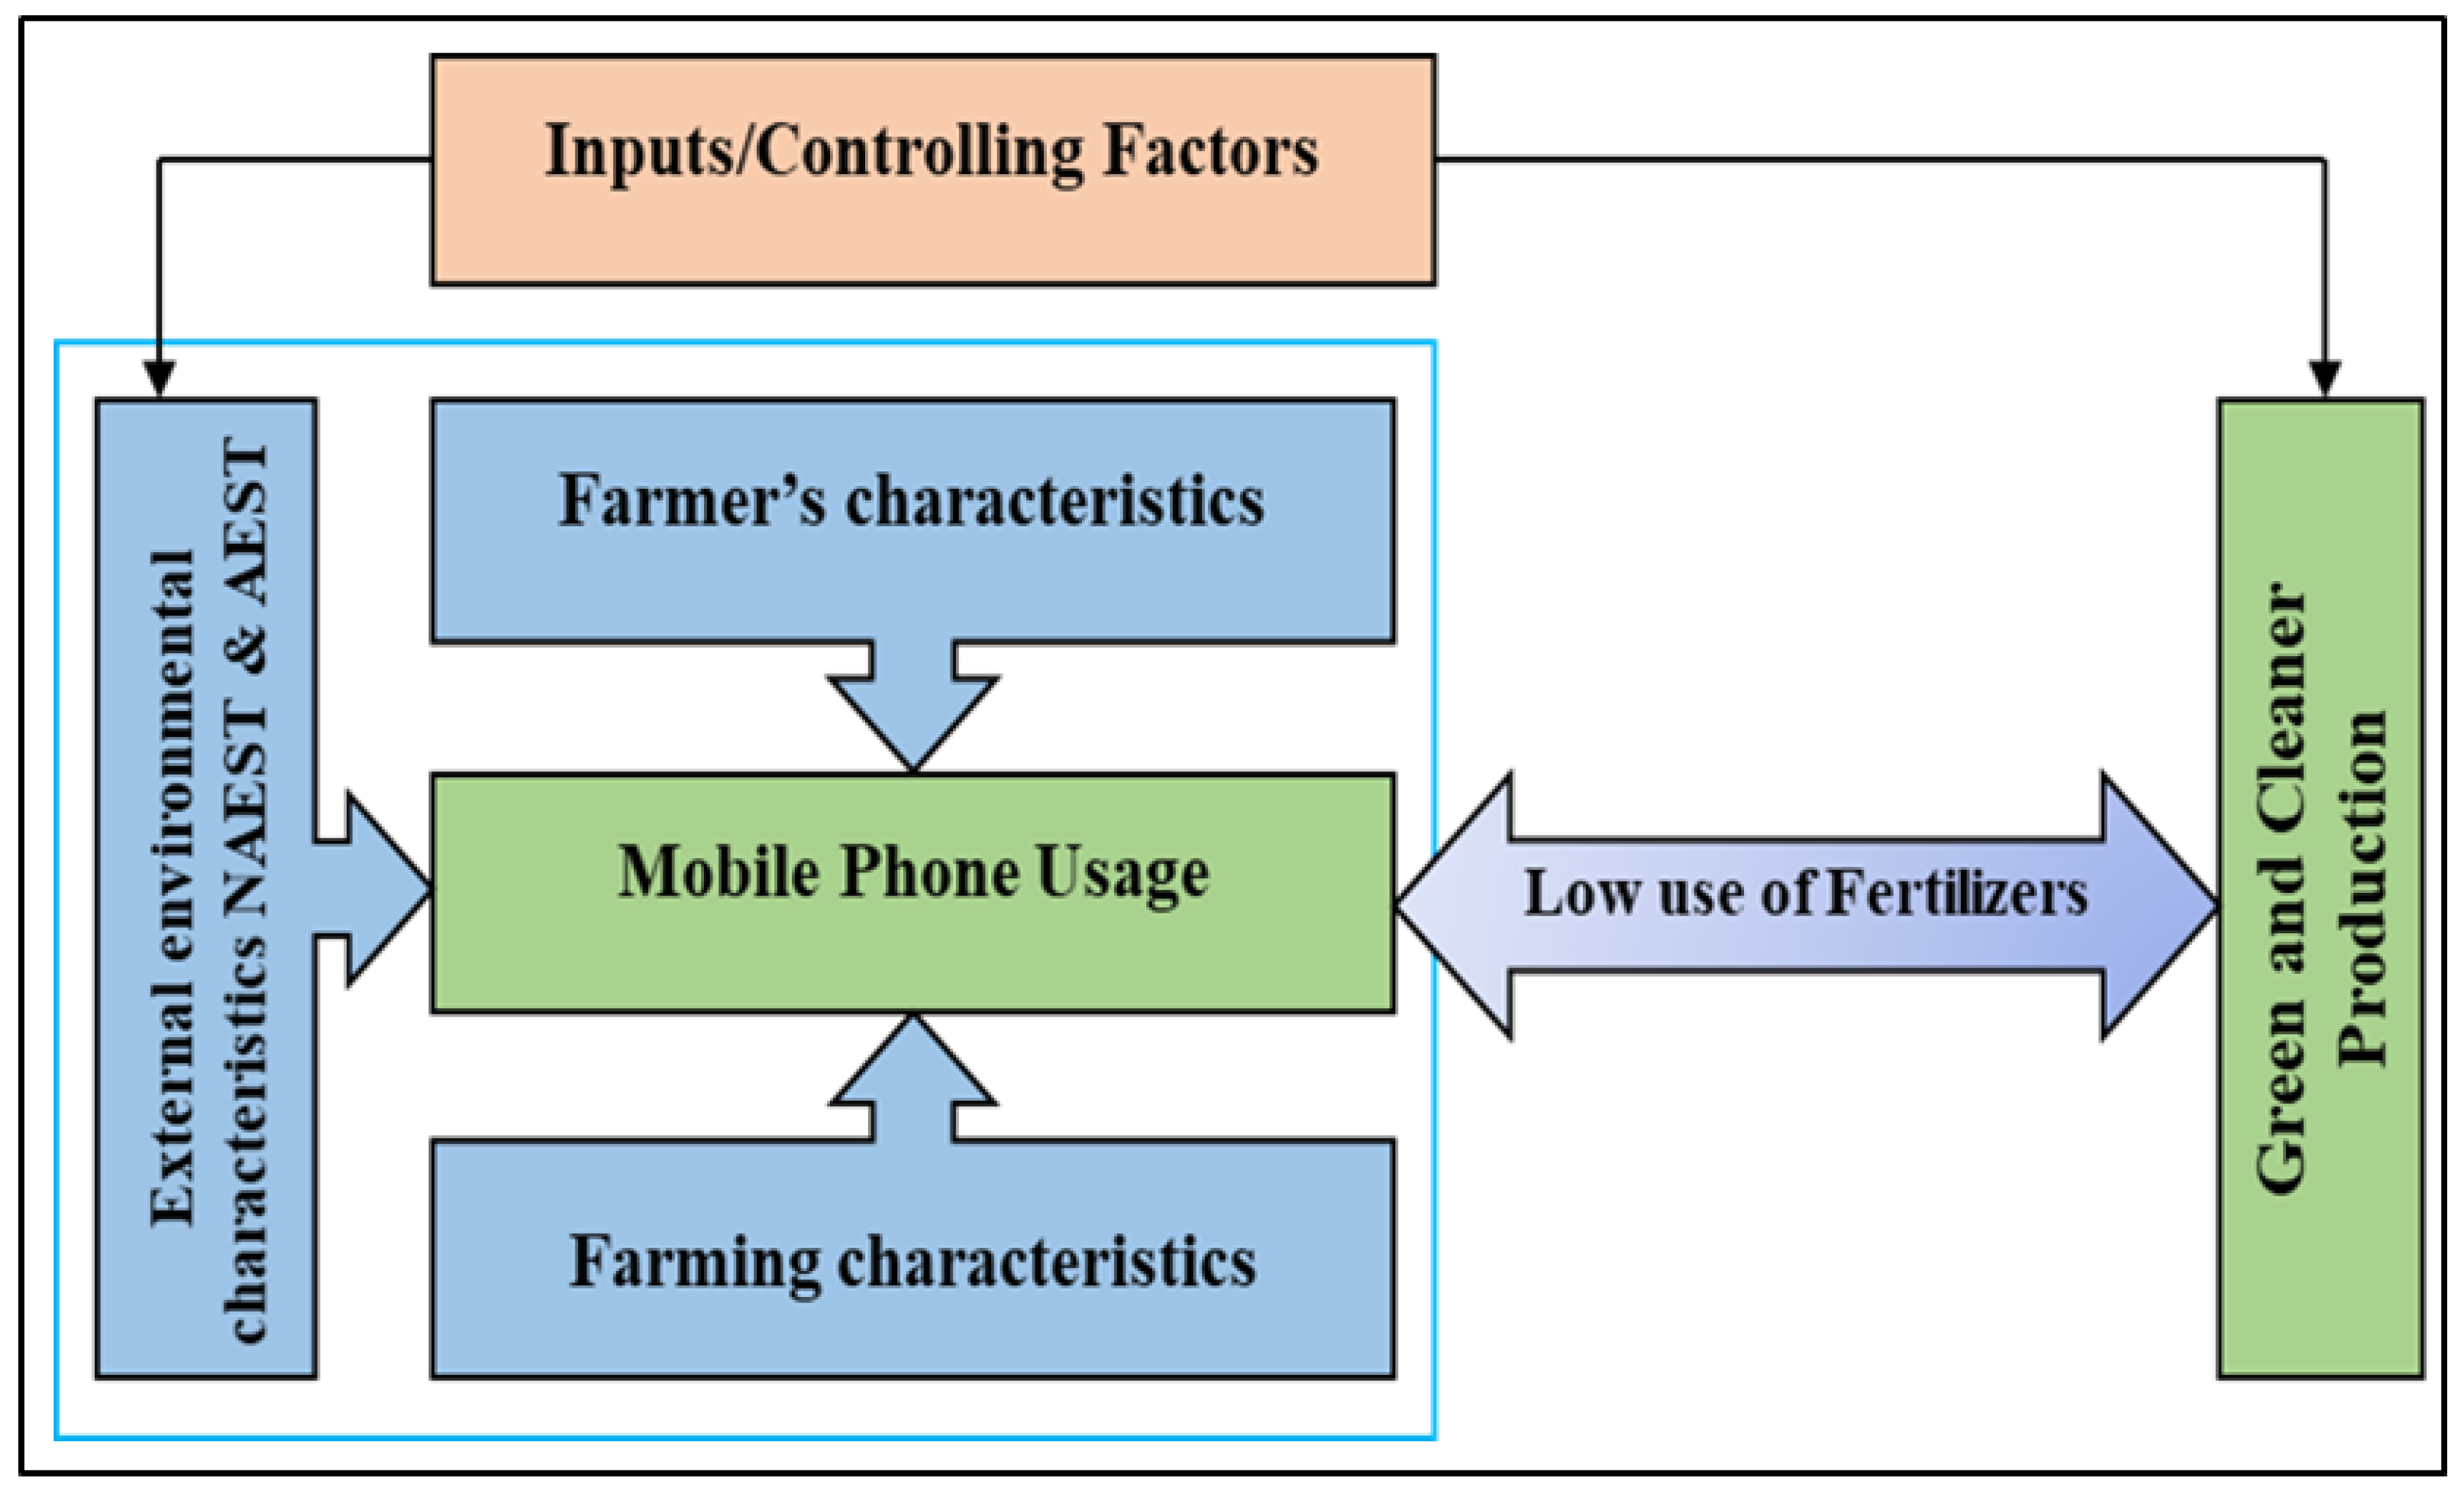
2. Conceptual Framework of the Study

The majority of Afghan farmers still live in remote areas with limited or no internet and computer facilities. However, the recent advancement in technologies for increased agricultural production demands the availability and use of mobile phones. Mobile phones would help advance communication, further raising awareness and understanding about the efficient use of IF on their farms. The conceptual framework shown in Figure 1 explains the impact of inputs/controlling factors with and without MPU on reducing IF use, which helps to achieve green and cleaner production in the long run. The inputs/controlling factors include external environments (e.g., NAEST, AEST, and governmental incentives), farmer’s characteristics (e.g., age, education, training, and health), and farming characteristics (e.g., crop and cropping system, farm management, and farming practices). All three major controlling factors directly affect green and cleaner production. However, MPU helps change the behavior, awareness, and knowledge of local farmers, which reduces the application of inorganic/chemical fertilizers.

3. Materials and Methods
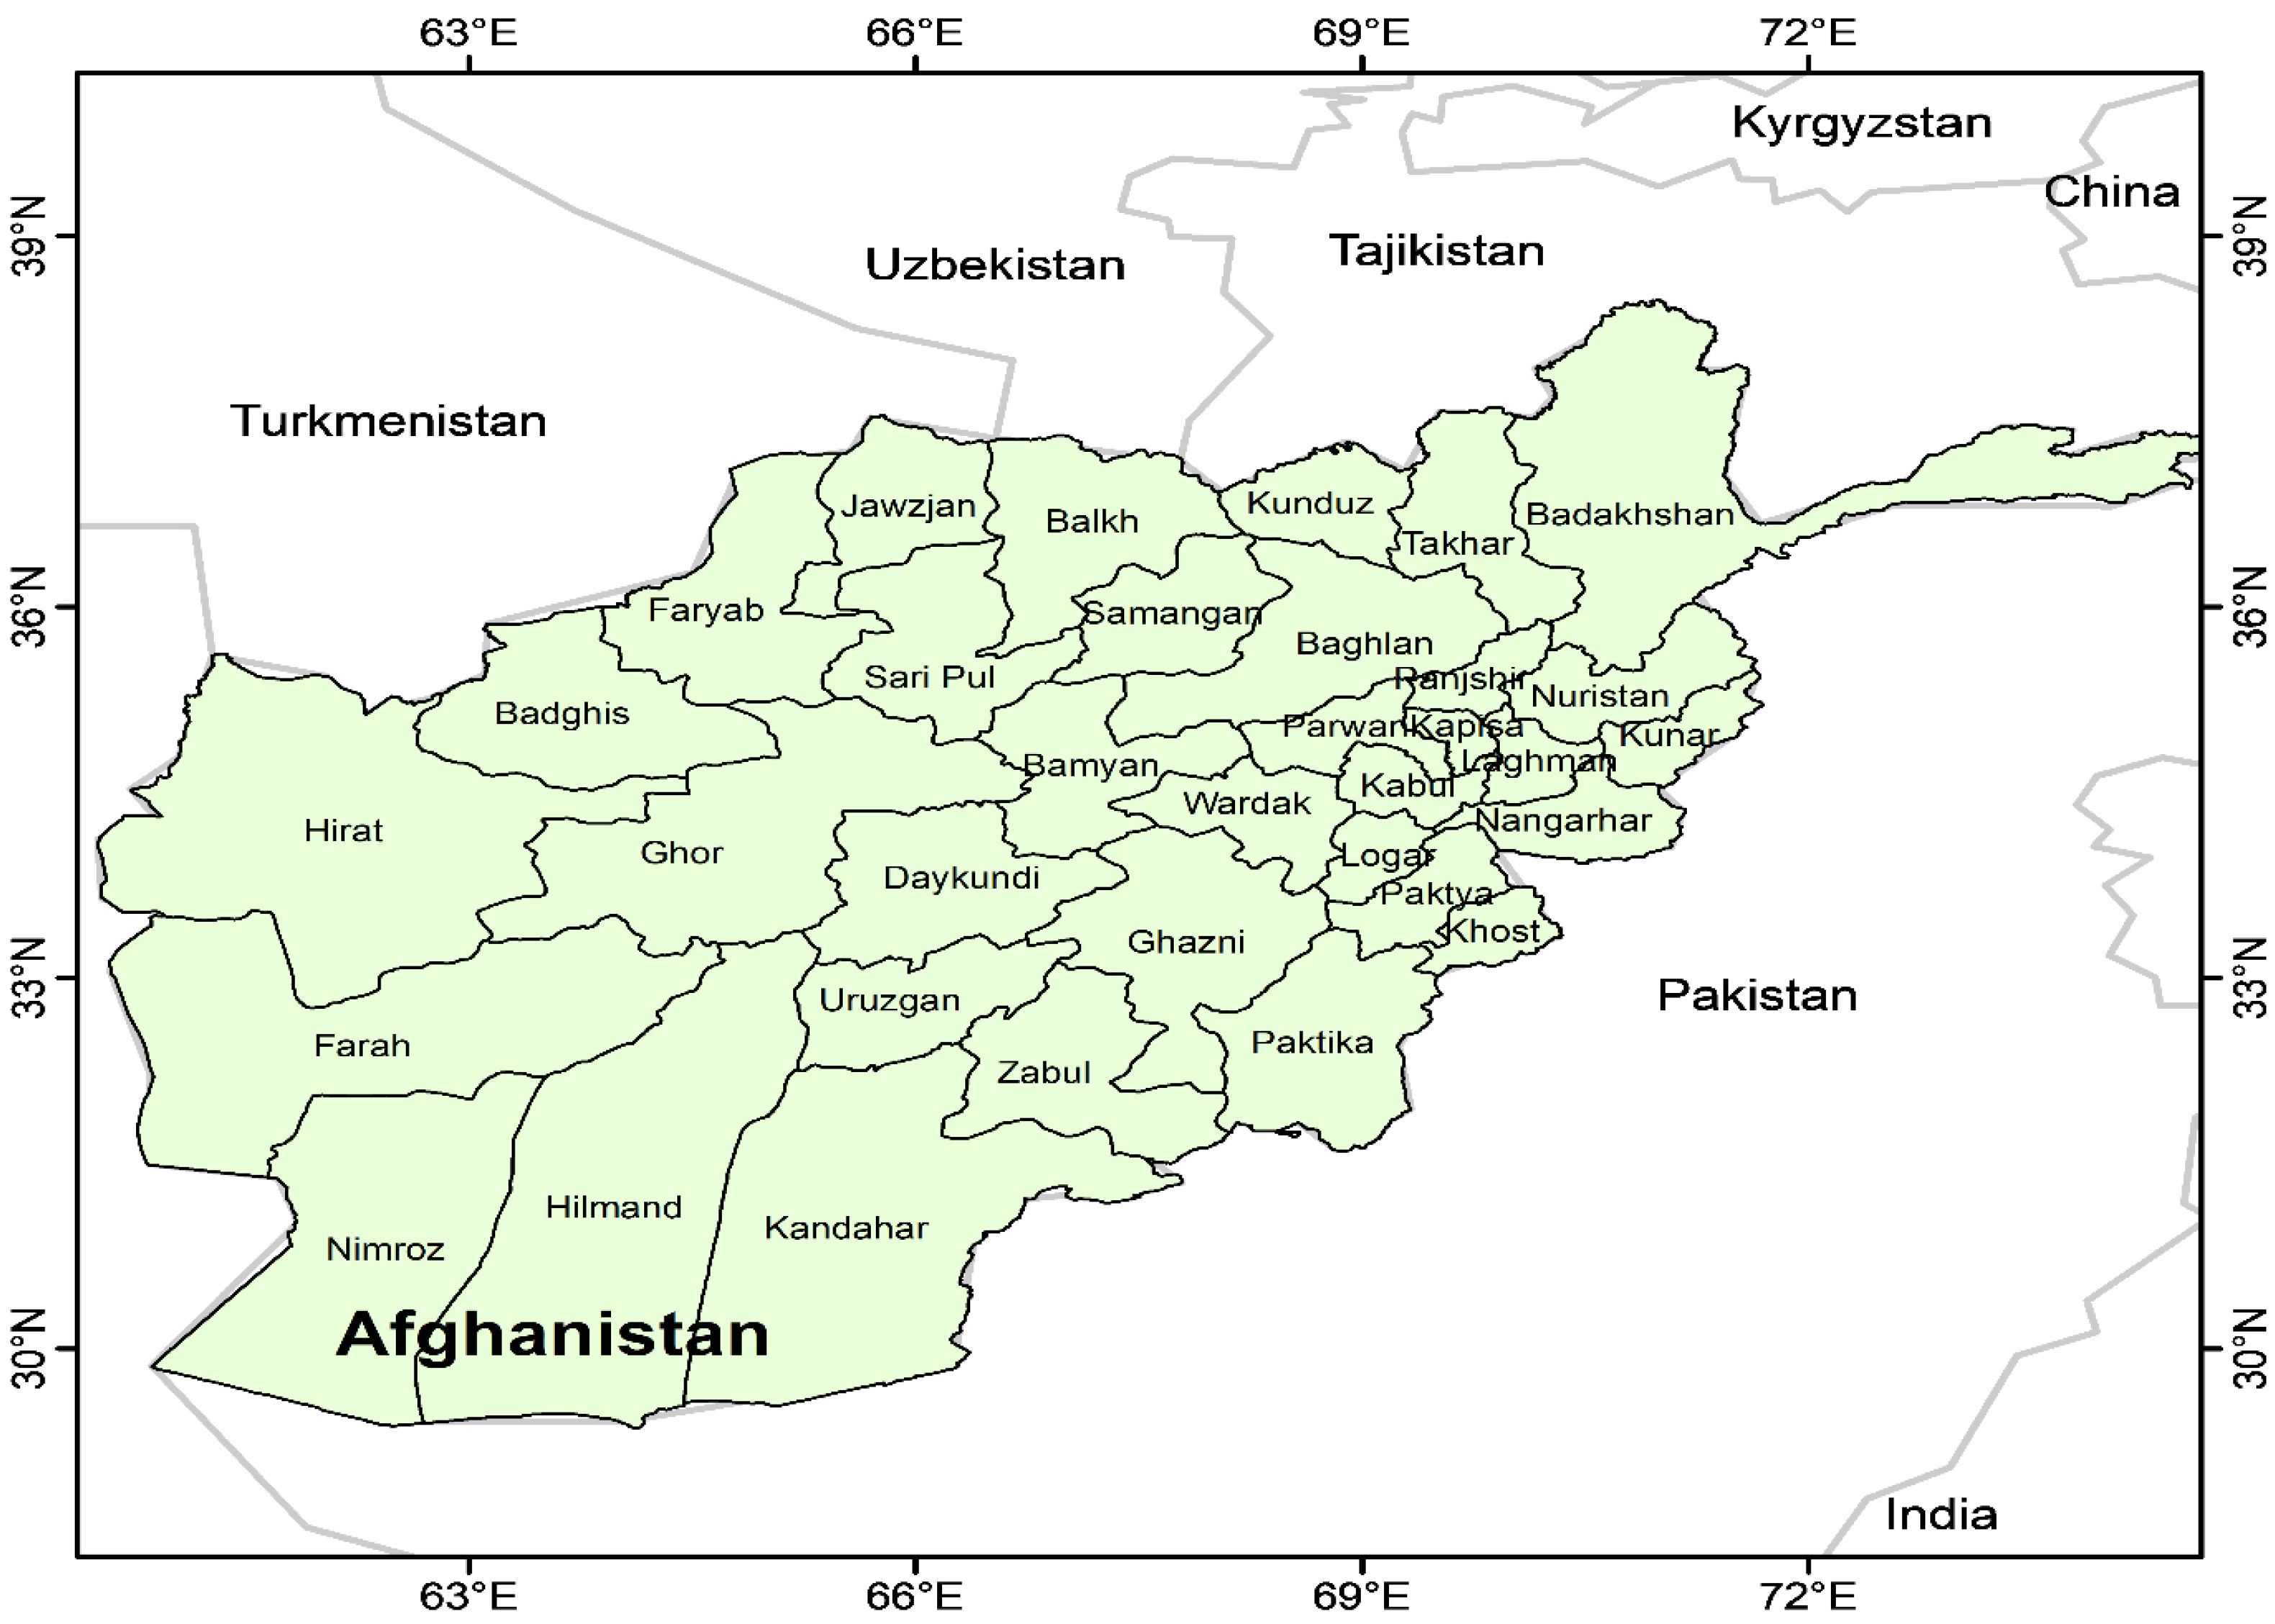
3.1. Study Area

The study area included all 34 provinces of Afghanistan (Figure 2). With a geographic area of 652,860 km2, Afghanistan has a vast territory comprising mountains, hills, plains, and deserts [61]. The Republic of Afghanistan comprises thirty-four provinces, divided into 398 districts, and subdivided into cities and villages. Approximately 63% of Afghanistan’s terrain is mountainous, while most southwestern areas are flat [75]. The total agricultural land in Afghanistan is 379,100 km2, which is 58.07% of the country’s total area [76]. Among all agricultural land, only 11.84% is cultivated. Approximately half of the cultivated area is used for farming, of which 0.27% is permanent cultivated land. The country’s farm size is considered small, such as 69% of the land under 5 ha, 16% over 10 ha, and 6.5% over 20 ha. The average area of irrigated farms is 1.4 ha, and the rain-fed is 6–7 ha. In Afghanistan, agriculture relies heavily on irrigation, and snowmelt is the primary source of water used for irrigation [61,77]. Smallholder farming in Afghanistan is based on nonmechanized skills and techniques, leading to subsistence agriculture with low productivity, low farm incomes, low marketed surplus, and all other concomitant features of traditional agriculture [78]. The role of the agricultural sector is critical for ensuring food security, improving livelihoods, and alleviating poverty in the country [61].

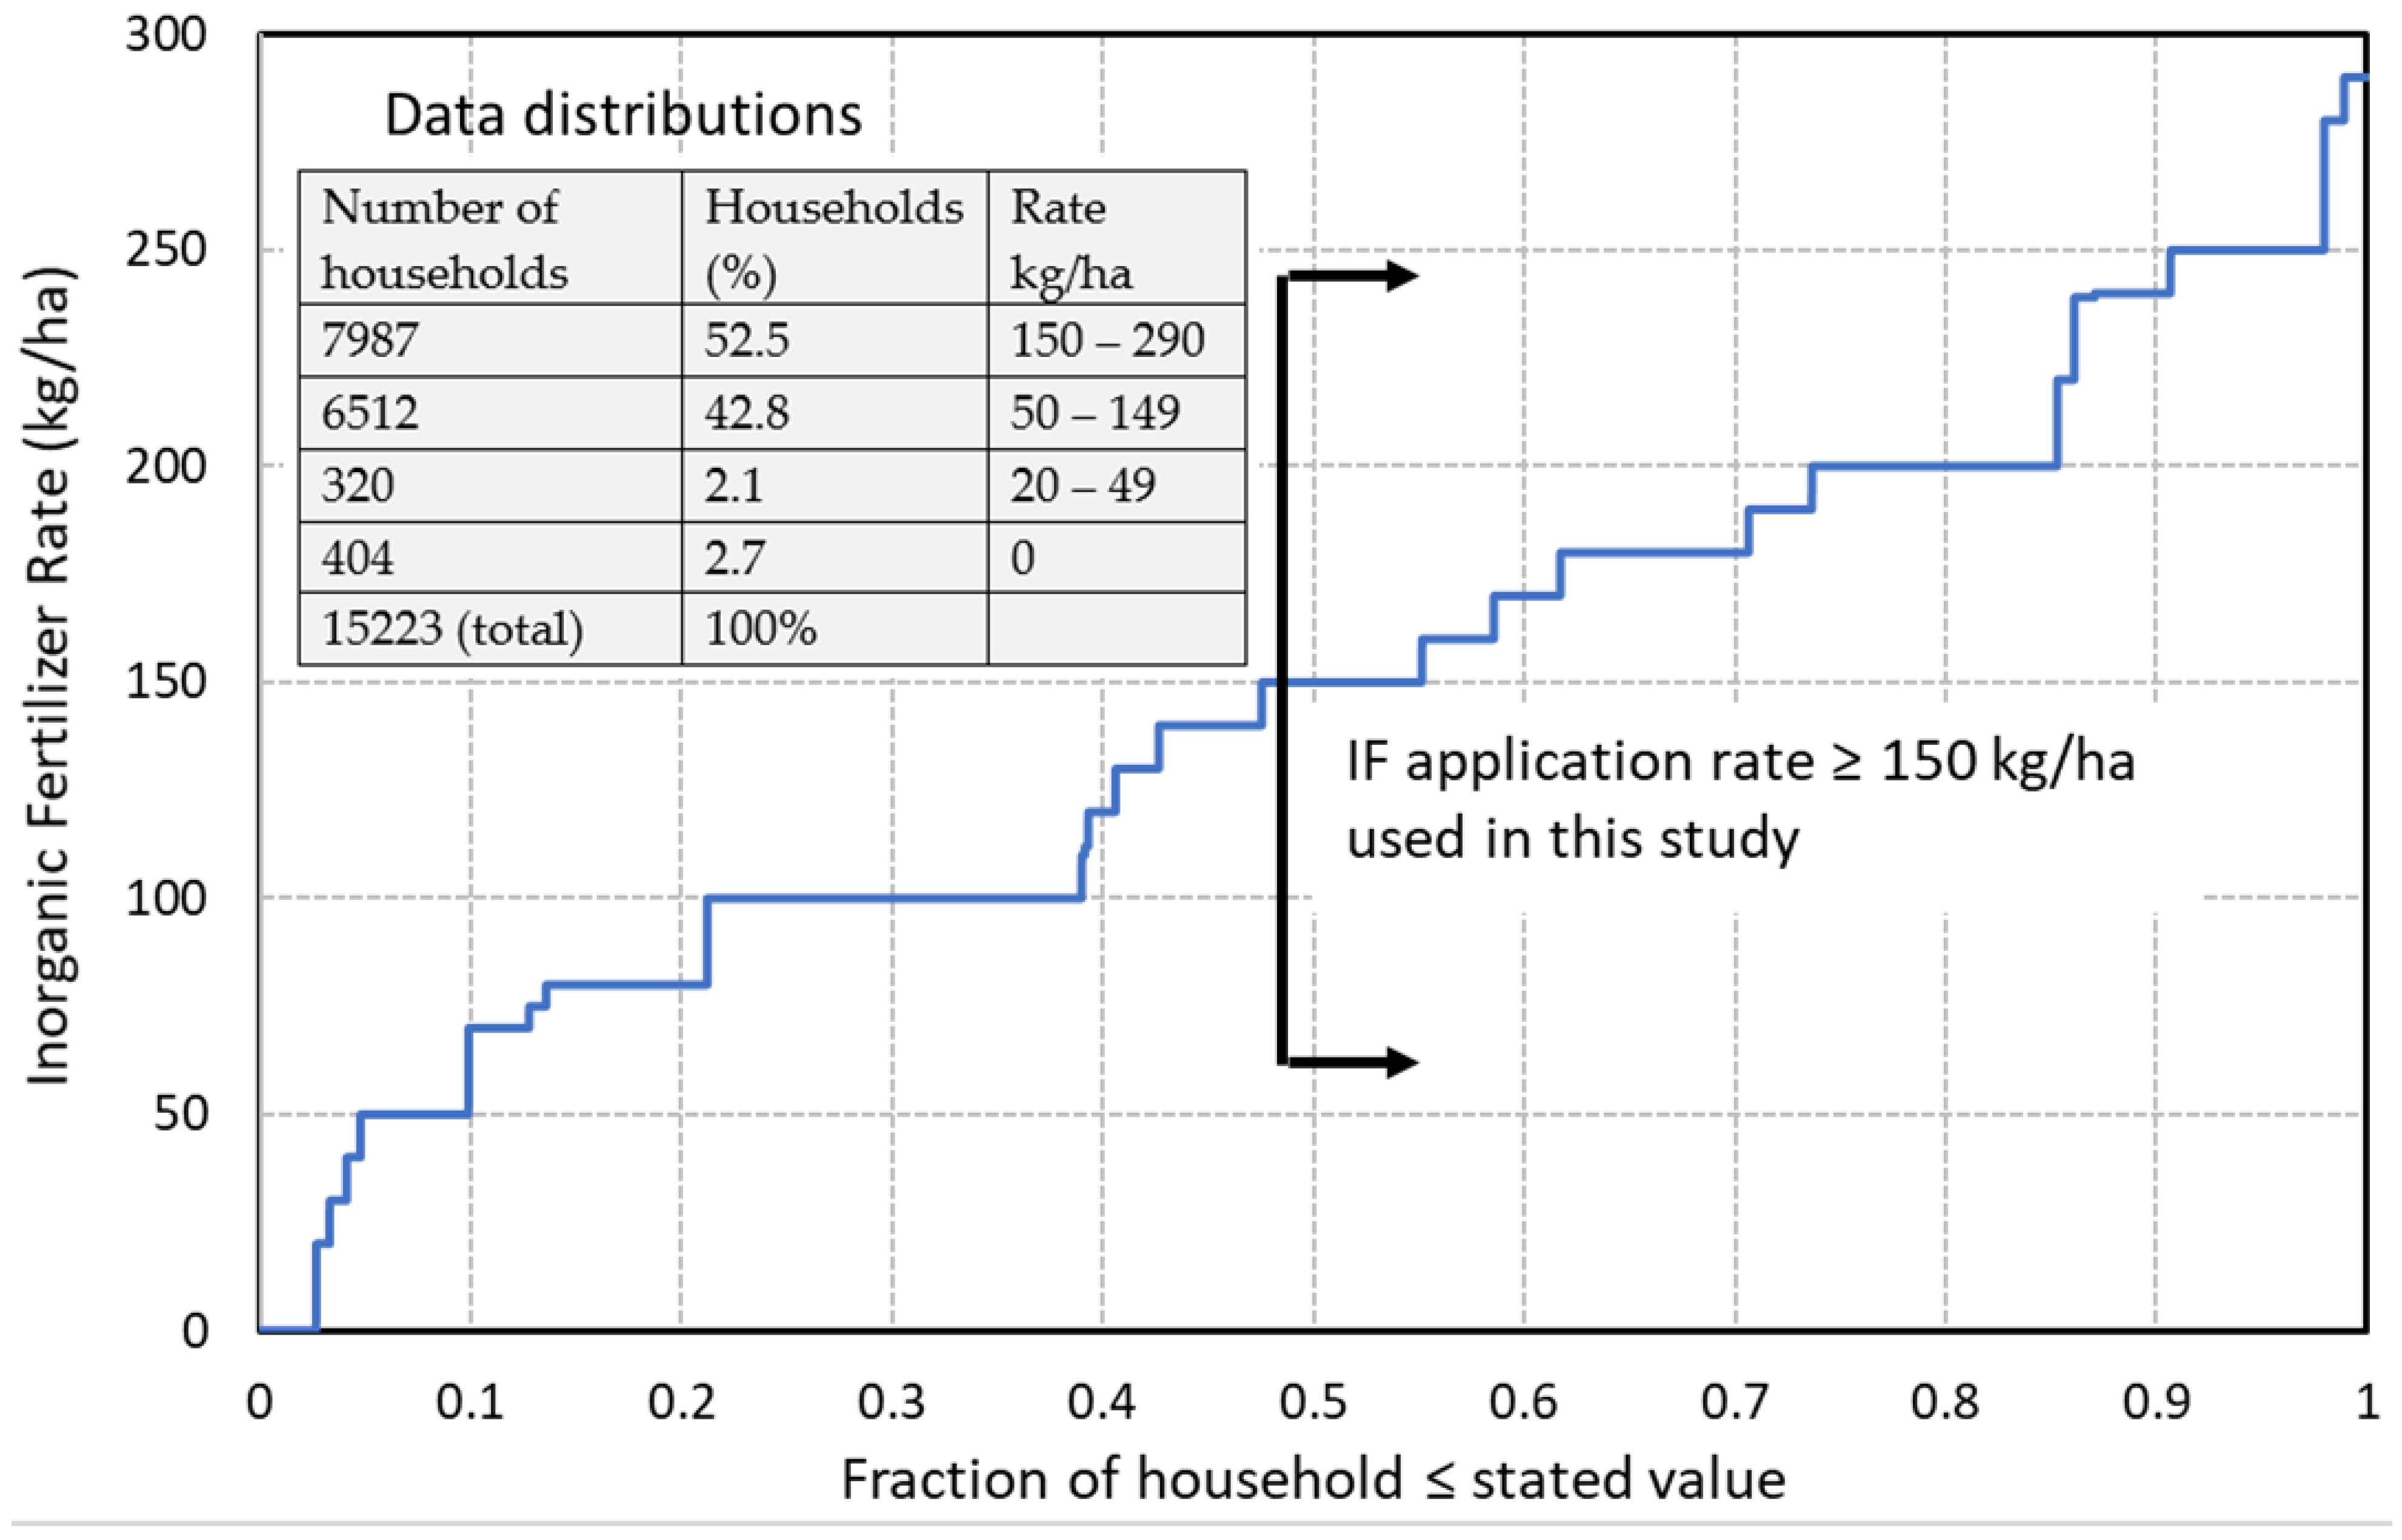
3.2. Sampling and Data

The data utilized in this research was acquired from the Current Living Conditions Survey of Afghanistan, organized by the Central Statistical Organization (CSO) [79]. In the first sampling stage, 10 villages from each province in mainland Afghanistan were selected using a multistage random sampling technique. Then, 65–85 households were selected from each village. The interviewer conducted annual follow-up interviews with the family unless the family died or permanently migrated to the city or elsewhere. The household survey questionnaire used contains information about families, MPU, and agricultural production. This study used data from 34 provinces of Afghanistan between 2010 and 2014. The asset balance panel data used from 2010 to 2014 includes 15,223 households annually. However, we excluded the 7223 households using IF less than 150 kg/ha. We considered 7987 households/farmers in this study which is 52.5% of the total surveyed households (Figure 3). Analysis showed that only 2.7% of farmers were not applying IF on their farms 42.8% were applying IF at 50 to 149 kg/ha (Figure 3).
We defined the independent variable as IF per unit area, which aligns with the previous studies [11,74,80,81]. Besides, we included control variables based on existing literature. Farmer’s characteristics/behaviors may affect the use of IF. For instance, some studies indicated that the grower’s age is one of the controlling factors of fertilizer usage [25,82]. Huang et al. [73] observed that the education level of the head of the household negatively influences fertilizer application practice. Ahmed and Shafique [81] found a very strong association between human health status and fertilizer use in farming. Therefore, keeping the facts in mind, the respondent’s age, education level, and household head health status were added as control variables. Besides, the characteristics of the household also have a potential impact on IF use. For example, investigations found that household size, land ownership, profits, and agricultural products significantly impact IF use [11,82]. Furthermore, using ICTs could bring more nonagricultural employment opportunities to farmers/growers [46,83,84,85], which may change farmers’ behavior concerning IF use. Therefore, we added household size, asset, land, income, IT, and cereal crop as control variables. Besides, this research considered mobile phones a dummy variable: where 1 indicates that the household uses mobile phones, while 0 indicates otherwise. Monetary variables are modified through the authorized Consumer Price Index (CPI) and calculated in 2010 constant Afghanistan’s Afghani rupees.

3.3. Data Modeling

To observe the influence of MPU on IF, we used the two-way fixed effects panel method (2FE). The 2FE model became the default method for estimating causal effects from panel data. Many researchers use the 2FE estimator to adjust for unobserved unit-specific and time-specific confounders at the same time. Model specifications are as follows:
IFit = βMobilephoneit + ∑kyk Controlit,k + λi + τt + εit
where IFit is the IF utilize per unit area of the family, i in year t, Mobile phoneit is a dummy variable, which indicates whether or not a household uses the mobile phone. A set of control variables were added to the model, containing household size, age, health status, education, land, IT, asset, income, and cereal crop. Assuming that the data were balanced panel, λi is the household fixed effect, τt is added to control for undetected heterogeneous variations over time, εit represents an error term.
Besides, we added an interaction term to examine the impact of cereal crop production on the association between ICTs and IF usage. The intuition is that cereal crop production is more fertilizer-intensive than other crops such as legumes, roots, and tubers. The model equation is presented as follows:
IFit = aICTsit + βCereal cropit + ηICTsit × Cereal cropit + kyk Controlit,k + λi + τt + υit
where ICTsit is the use of a mobile phone or IT. υit is the disturbance phrase. Later, we used human capital to study the feasible potential interactions between the usage of mobile phones and IF. The rationale is that MPU will build the capacity of households towards green and clean production. Also, well-trained and educated farmers would make better MPU and can make more environmentally friendly decisions. The model is specified as follows:
Human Capitalit = βMobilephoneit + ∑kyk Controlit,k + λi + τt + µit
IFit = aHumanCapitalit = βMobilephoneit + ∑kyk Controlit,k + λi + τt + ωit
We applied two dummy variables to assess human capital: Non-agricultural education or skills training and agricultural education or skills training, shown in Table 1. The µit & ωit are disturbance terms.
In addition, we analyzed the effect of the government’s MPU promotion policy on IF usage. An empirical analysis was carried out using the DID model to estimate this impact. A similar empirical analysis, which includes the DID model, was conducted by various researchers [26,35,86,87]. We used the ICTs Construction Initiative Plan in Paktya Province of Afghanistan as an example. The plan was launched in 2012 and was initiated by the Afghan Ministry of Communications and Information Technology (MCIT). The program’s main goal was to increase the construction of ICTs infrastructure to provide agricultural-related telecommunication services to the growers [43,88]. The program’s main objective was to increase the availability of mobile phones and the internet network. The specifications of the DID model is as follows:
IFit + β0 + β1Treatit × Tit + β2Treatit + β3Tit + kβk Controlit,k + ψit
The treatment set “Treat” is a dummy variable. The value 1 indicates that rural households live in Paktya Province, and the 0 value indicates that rural households live in other provinces. Also, T is a dummy variable denoting the period. T = 1 represents the rural ICTs construction plan from 2012 to 2014, and the T = 0 means that there is no rural ICTs construction plan from 2010 to 2011. The interaction coefficient term between the treatment dummy variable and the year dummy variable β1 displays the influence of the MPU promotion strategy. The ψit represents the error term. Based on the outcomes of DID technique, it could have a sample selection bias issue. To solve this problem, we applied the widely used PSM-DID model [89,90,91,92,93].
Compared with the simple PSM method, a key benefit of this PSM-DID method is not only solving the selection bias caused by observable values but also eliminates any selection bias related to time-invariant unobservable values. For two time periods, as in the case of this article, the PSM-DID estimator is formally defined as:
δ ATT PSM DID = 1 n 1 i Treat   1 S p { ( IF i 1 t 1 IF i 1 t 0 ) i T r e a t   0 S p   W ( i , j ) ( IF i 0 t 1 IF i 0 t 0 ) }          
where, Sp is the common assist shared through the treatment set “Treat1”, control set “Treat0”, and n1 denotes the figure of matched samples in the connection between Treat1 and Sp.

4. Results and Discussion

4.1. Baseline Outcomes: Effect on IF Usage

Table 1 indicates that the average IF consumption was 198.40 kg/ha, and only 17% of remote families utilized mobile phones. Regarding household characteristics, each household had an average of 6.45 members and an average age of 43.16 years, while health status and education averaged 6.45 and 5.63. The per capita land size was 2.85 ha, and the per capita fixed assets were 2572 Afghani (AFN), whereas the annual average household profits were 27,984 Afghani (AFN). Moreover, 55% of households used cereal crops as their primary production crop, and 2.09% of them used IT. On average 0.42, and 0.20 household members received Non-Agricultural Education or Skills Training (NAEST) and Agricultural Education or Skills Training (AEST), respectively. This result aligns with the finding of Khan et al. [94], which is that farmers’ education level and modern media play a significant role in reducing the excessive use of pesticides because it broadens their horizons and exposes them to potentially unknown aspects of agriculture related to the environment and agricultural sustainability.
Table 2 presents the impact of MPU on applying IF based on the 2FE panel method. The data showed that MPU has a significant negative impact on growers’ IF usage (β = −0.126, p < 0.01), which means that the household using mobile phones has a 17.4% lower intensity of fertilizer use compared with that of a household without the mobile phone. Moreover, health status is positively associated with IF use.
Two interaction items, one between cereal crops and mobile phones and the other between cereal crops and IT were added, which were estimated using Equation (2). The Akaike Information Criteria (AIC) value in column 4 is the smallest of columns 2–4, which means that the outcomes in column 4 are more suitable for the data. Both interaction items have obvious positive indications. This shows that cereals as the major crops can increase the impact of MPU on IF application. It also shows that more households are involved in cereal crop production. They use more IF for cereal farming. Growers who are primarily engaged in noncereal crops mainly grow fruits, vegetables, and cash crops. They understand the significant role of mobile phones or IT to increase the production of non-cereal crops and reduce the application of IF. In emerging nations, consumer demand for organic noncereal crops is usually greater than for cereal crops. Moreover, noncereal crops are highly competitive in developing countries, and the government covers the cereal crop marketplace under the cereal purchasing and storage policy [95]. Thus, growers who are primarily involved in cereal crops are less susceptible to market variations and demands, and their IF consumption is less affected by the MPU and internet technologies.

4.2. The Mediating Role of Human Capital

Human capital recognizes the intangible assets and qualities that improve worker performance and benefit the economy [96]. We performed a mediation evaluation to examine the role of human capital on the relationship between mobile phones and IF applications using Equations (3) and (4) (Table 3). The MPU led to more NAEST (β = 0.479, p < 0.01) but had no significant influence on AEST (β = −0.085, p > 0.1). This outcome explains that MPU can accelerate growers’ human capital with nonagricultural information rather than farming information. Using mobile phone technology, farmers will receive low-cost customized recommendations to improve farm practices, input utilization, pest management, environmental sustainability, and market access. This result is consistent with current research findings that ICTs adoption provides rural growers more opportunities to participate in nonagricultural activities [46,55], which ultimately enhances the benefits of growers. In column 2, the NAEST has a negative influence on the IF usage (β = −0.117, p < 0.05). This result aligns with the finding of Huang et al. [73], which shows strengthening informational education could help growers reduce IF use. Hence, mediation assessment shows that MPU enhances growers’ human capital, especially NAEST, which ultimately decreases the use of IF. The explanation for this outcome is that NAEST could help increase the diversity of income resources, reduce the high reliance on crop production and lower impetus to consume IF.

4.3. Policy Assessment: DID Method

Paktya is one of the 34 provinces of Afghanistan, situated in the eastern part of the country. It has an underdeveloped economic system, rich biodiversity, and superior environmental conditions. Unlike other provinces, Paktya’s economic growth is mainly due to the significant karst landforms and less environmental pollution [97,98,99,100]. In many rural areas, people have practiced organic farming, which reduces the IF used. For financial and technological reasons, the price of mobile phone network development and infrastructure construction in rural and hilly areas are higher than in urban areas, limiting the availability of wideband connections in remote areas [97,101]. This is particularly true for remote communities of Paktya province, where 59.8% of the land areas are mountainous [41,102,103]. Therefore, the Afghan government issued the “Rural ICTs Network Construction Plan” which focuses on improving the mobile phone and IT networks construction for remote areas in 2012 [41,42,43]. The two core goals of this strategy include a wireless network, mobile phone, and IT within reach to rural communities and provide farming-linked telecommunication facilities. In general, Paktya needs to reduce IF usage. It has a relatively underdeveloped internet network infrastructure, which makes it an ideal region for investigating the effect of mobile phone promotion policy on IF application intensity.
The DID method was used to study the impact of implementing a mobile phone promotion policy on reducing IF usage. Paktya Province of Afghanistan as used as a treatment group. Considering the similar climate and farming structure, five provinces of Afghanistan were chosen as the control group (Kabul, Herat, Mazar-i-Sharif, Kandahar, and Jalalabad). Table 4 shows the outcomes of DID technique, assessed using Equation (5). The term interaction coefficient is −0.365, which is very substantial at the level of 10 percent (i.e., in column 2). It explains that the mobile phone advancement policy substantially diminished IF use. However, we added interaction items between the Treat (i.e., treatment before matching) and year dummy variables to assess the effect at a particular time. In column 4, the coefficient of the binary interaction items Treat × 2012 and Treat × 2013 are significant with negative coefficients, showing that the mobile phone advancement policy is efficient for remote areas within two years because it reduced the application of IF over the period. Overall, mobile phone and IT usage has a significant positive effect on economic well-being and upgrade policy and is important for growers in rural areas because it helps them obtain information about reducing the IF, market prices, environment, and other related information. Similar results reported by Zhao et al. [47] showed that with the in-depth application of information technology, more and more farmers had obtained information about seeds, pesticides, fertilizers, and pest control technologies. Use the relevant software and information programs on the mobile phone or directly refer to the online opinions for IF use and clean farmland production.

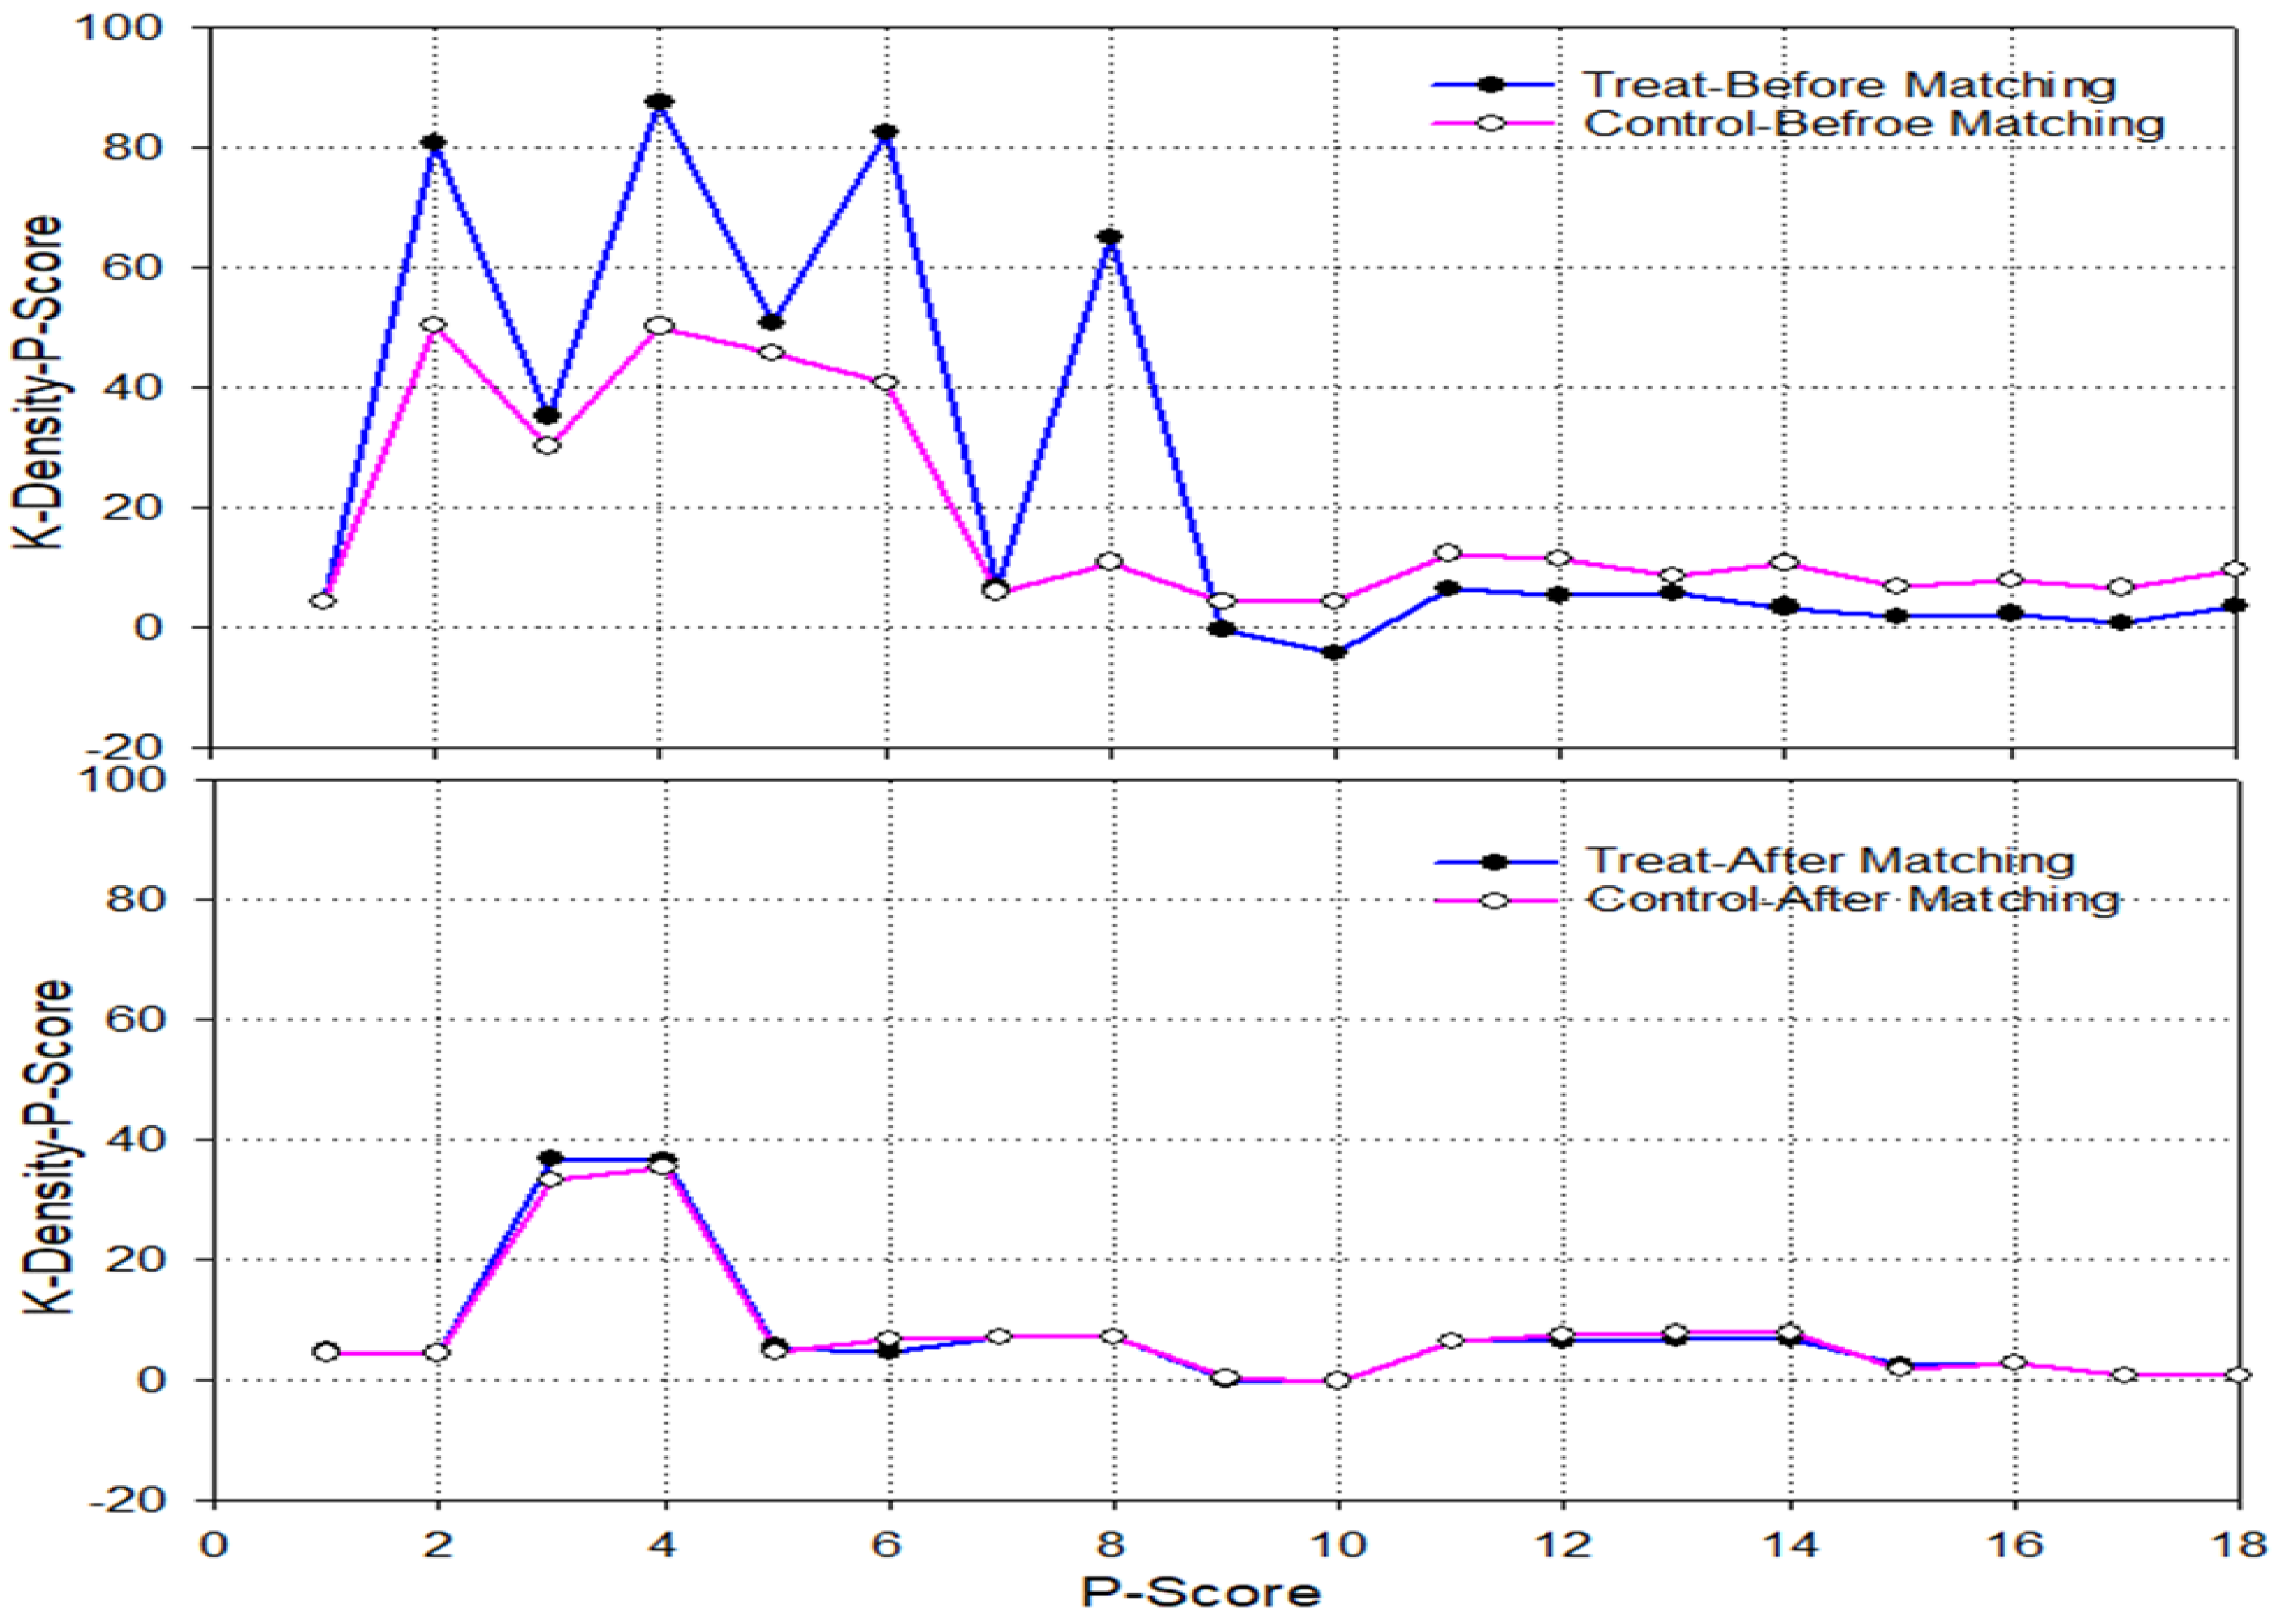
4.4. Robustness Test: PSM-DID Model

Two issues have to be addressed; the first one is associated with the various changes between the treatment group (Paktya) and control group (the added five provinces of Afghanistan) before the implementation of the mobile phone promotion policy [98]. The second one is that Paktya mobile phone advancement policy was not randomly allocated but linked to societal and financial characteristics [90,104]. Therefore, we adopted the PSM technique to resolve possible heterogeneity issues and further consistent observed findings. The primary stage is to assess the PSM based on nine variables (such as the age of the respondent, health status, education level, household size, land area, asset, income, IT, and cereal crops), which are included as covariates in the logistic technique. Afterward, also applied the nearest neighbor algorithm to perform a one-to-one match amid the experimental and control groups.
Table 5 provides the balance test outcomes. They showed that most of the covariates become more correlated after matching, and the variation between the treatment and the control groups was not statistically significant. Figure 4 also depicts the balance test outcomes before and after matching. The study outcome showed that the propensity score distribution of the control was consistent with that of the treatment group, which indicated that the covariate variations between the binary groups were greatly reduced while employing the PSM technique.
The empirical findings of PSM-DID methods are presented in Table 6, assessed using Equation (6). The terms interaction coefficients Treat × T, Treat × year2012, and Treat × year2013 are still significant and with negative coefficients, consistent with the outcomes presented in Table 4, which indicates that the mobile phone promotion policy reduced the IF usage. This result is consistent with the findings of Zhao et al. [47] which indicates that farmers who can effectively use IT resources have stronger production safety capabilities and are more likely to reduce the IF used. Therefore, in addition to the shallow IT use, the in-depth use of this modern technology may also be an important factor affecting farmers to reduce pesticides.

4.5. Robustness Test-Two: Instrumental Variables Method (IVM)

Due to unobservable factors and reverse causality, the PSM-DID model could not solve the endogeneity problem. Considering that MPU is measured as a possible endogenous variable [46,105], we adopted more techniques to resolve the endogeneity issues. We reviewed the existing literature [42,46] and adopted a two-stage IVM to solve the endogeneity problems related to MPU.
For this aspect, the MPU ratio as an instrumental variable was measured as the proportion of growers from the same village that used a mobile phone. The rationale for using the IVM is that the relatives and fellow growers may influence growers’ decisions on MPU. On the other hand, growers’ decision to use IF would not be directly affected by other farmers’ MPU. Table 7 presents outcomes of the two-stage IVM where the F-value in the first stage is 444.90, which is greater than 10, indicating no weak IVM issues. In column 2, the independent variable (MPU) has a significant negative symbol, persistent with the baseline regression results.

5. Conclusions and Recommendations

This research investigated the impact of MPU on IF in Afghanistan. Based on the actual national household data set, we examined the direct influence of MPU on the intensity of fertilizer usage and studied the potential mediating role of human capital. Besides, DID, PSM-DID, and two stages IVM were applied to assess the influences of MPU promotion policies on IF application intensity.
This research contributes to agricultural science and farming communities in the following ways. Firstly, we empirically study mobile phones’ effect on IF usage in the context of an emerging economy. Though many studies explored the impact of mobile phones on agricultural advancement, few researchers observed the influence of mobile phones and IT on fertilizer application in the farming sector in developing countries. Secondly, we explore the potential mediating role of human capital between mobile phones and IF usage. The existing studies aim to directly influence IF usage by human capital, such as training, health, and education. Thirdly, we use the DID method to study the impacts of mobile phone promotion strategy on household IF usage. Fourthly, we employ the PSM-DID and the two-stage IVM to solve the endogeneity problem related to MPU.
The empirical results showed that the MPU substantially reduced the use of IF. The household that uses mobile phones has a 17.4% reduction in IF use intensity than the household that does not. When the primary income of growers does not come from cereal crops, the effect of MPU in reducing IF use becomes weaker. Mechanism investigation shows the mediation role of human capital in mobile phone and IF usage nexus. The outcomes reveal that the mobile phone promotion program in remote regions can help reducing IF usage. The finding is that mobile phone upgrade policy is important to growers in rural areas, which helps them obtain information about lowering IF, market prices, the environment, and other relevant information.
We can derive some essential policy implications from these findings. Firstly, considering that MPU would have an environmentally friendly influence on IF usage in Afghanistan and other developing economies, therefore, authorities need to eliminate restrictions that prevent growers from using mobile phones and IT. For instance, mobile phone equipment subsidies help reduce the cost of growers. Secondly, human capital (skill training/technical education, etc.) has a mediating role in mobile phones and IF usage. Improving the technical education on MPU and access to internet facilities can increase the efficiency of agricultural production, reducing the IF usage and environmental pollution. Studies found that human capital’s significance in promoting IF usage decrease should also be considered, particularly instructions, education, and training related to MPU. In addition, other strategies, such as ICTs literacy guidance skills (for example, email, MMS, SMS, call, etc.), should help reduce IF application. Thirdly, mobile phone technology infrastructure is critical in promoting MPU among farmers and reducing IF usage. Fourthly, particular policy support and attention should be focused on how vulnerable households use the internet and mobile phone technologies. Such focus and support can entail, inter alia, farmers’ education and training employing online programs, hence providing incentives for these farmers to leverage digital technology, benefit from digital dividend externalities, address concerns surrounding their specific capital disadvantages, and mitigate their use of chemical pesticides. Therefore, the government should carry out long-term investments and increase the investment to facilitate access to ICTs in remote areas, as having a telephone and access to a cellular and internet network would provide enabling conditions for environmentally friendly IF usage.
However, this study has a few limitations. This study only had the total quantity of overall IF sources utilized by farmers/growers due to limited information, but not the total amount of particular types of fertilizers (such as compound fertilizer or phosphorus, nitrogen, potassium). This empirical study was only focused on farmers growing cereal crops.
Also, this study does not recommend the rate of application of IF on a particular province or farm for optimum crop production. This study only focused on the importance of mobile phones and IT, which can help reducing IF use or use IF efficiently for optimum crop production. Total nitrogen inputs to the cropland can be in the form of manure, IF, symbiotic fixation, and atmospheric deposition. The IF optimization depends on several factors, such as local environments (e.g., soil temperature, amount and frequency of rainfall), soil characteristics (e.g., texture, organic matter, porosity, density), and management practices.
In the future, more comprehensive research on various types of fertilizers can be considered. Besides, this study is based on data collected from Afghanistan alone. Therefore, it is necessary to conduct comparative studies with data from multiple developing countries to understand better the relationship among new technologies such as smartphones, mobile phones, the internet, and IF usage in various socioeconomic contexts.

Author Contributions

N.K., R.L.R., H.S.K., S.Z., M.I., A., S.A.A. and S.A. developed and outlined the concept, including method and approach to be used; N.K., M.I. and R.L.R. developed and outlined the manuscript; N.K., H.S.K., S.Z., R.L.R., A., S.A.A. and S.A. contributed to methodology and revision of this manuscript; N.K. and R.L.R. wrote the article. All authors have read and agreed to the published version of the manuscript.

Funding

The authors extend their appreciation to the researchers supporting the project of (No: RSP−2021/403) King Saud University, Riyadh, Saudi Arabia.

Institutional Review Board Statement

Not applicable.

Informed Consent Statement

Not applicable.

Data Availability Statement

The data that support our research findings are available from the corresponding author on request.

Acknowledgments

We are very grateful to the anonymous reviewers for their constructive comments and thoughtful suggestions.

Conflicts of Interest

The authors declare that they have no conflict of interest.

References

  1. Navarro, E.; Costa, N.; Pereira, A. A systematic review of IoT solutions for smart farming. Sensors 2020, 20, 4231. [Google Scholar] [CrossRef]
  2. Fróna, D.; Szenderák, J.; Harangi-Rákos, M. The challenge of feeding the world. Sustainability 2019, 11, 5816. [Google Scholar] [CrossRef] [Green Version]
  3. Reganold, J.P.; Wachter, J.M. Organic agriculture in the twenty-first century. Nat. Plants 2016, 2, 1–8. [Google Scholar] [CrossRef] [PubMed]
  4. Tang, K.; Hailu, A.; Kragt, M.E.; Ma, C. The response of broadacre mixed crop-livestock farmers to agricultural greenhouse gas abatement incentives. Agric. Syst. 2018, 160, 11–20. [Google Scholar] [CrossRef]
  5. Wu, J.; Ma, C.; Tang, K. The static and dynamic heterogeneity and determinants of marginal abatement cost of CO2 emissions in Chinese cities. Energy 2019, 178, 685–694. [Google Scholar] [CrossRef]
  6. Tang, K.; Hailu, A.; Yang, Y. Agricultural chemical oxygen demand mitigation under various policies in China: A scenario analysis. J. Clean. Prod. 2020, 250, 119513. [Google Scholar] [CrossRef]
  7. Khan, N.; Siddiqui, B.N.; Khan, N.; Khan, F.; Ullah, N.; Ihtisham, M.; Ullah, R.; Ismail, S.; Muhammad, S. Analyzing mobile phone usage in agricultural modernization and rural development. Int. J. Agric. Ext. 2020, 8, 139–147. [Google Scholar] [CrossRef]
  8. United Nations. World Population Projected to Reach 9.8 Billion in 2050, and 11.2 Billion in 2100; United Nations: New York, NY, USA, 2017.
  9. Xydis, G.A.; Liaros, S.; Avgoustaki, D.-D. Small scale Plant factories with artificial lighting and wind energy microgeneration: A multiple revenue stream approach. J. Clean. Prod. 2020, 255, 120227. [Google Scholar] [CrossRef]
  10. Tang, K.; He, C.; Ma, C.; Wang, D. Does carbon farming provide a cost-effective option to mitigate GHG emissions? Evidence from China. Aust. J. Agric. Resour. Econ. 2019, 63, 575–592. [Google Scholar] [CrossRef]
  11. Xiang, T.; Malik, T.H.; Nielsen, K. The impact of population pressure on global fertiliser use intensity, 1970–2011: An analysis of policy-induced mediation. Technol. Forecast. Soc. Chang. 2020, 152, 119895. [Google Scholar] [CrossRef]
  12. Notarnicola, B.; Sala, S.; Anton, A.; McLaren, S.J.; Saouter, E.; Sonesson, U. The role of life cycle assessment in supporting sustainable agri-food systems: A review of the challenges. J. Clean. Prod. 2017, 140, 399–409. [Google Scholar] [CrossRef]
  13. Scarpare, F.V.; Hernandes, T.A.D.; Ruiz-Corrêa, S.T.; Kolln, O.T.; de Castro Gava, G.J.; dos Santos, L.N.S.; Victoria, R.L. Sugarcane water footprint under different management practices in Brazil: Tietê/Jacaré watershed assessment. J. Clean. Prod. 2016, 112, 4576–4584. [Google Scholar] [CrossRef]
  14. Huang, J.; Xu, C.-C.; Ridoutt, B.G.; Wang, X.-C.; Ren, P.-A. Nitrogen and phosphorus losses and eutrophication potential associated with fertilizer application to cropland in China. J. Clean. Prod. 2017, 159, 171–179. [Google Scholar] [CrossRef]
  15. Savci, S. An agricultural pollutant: Chemical fertilizer. Int. J. Environ. Sci. Dev. 2012, 3, 73. [Google Scholar] [CrossRef] [Green Version]
  16. Kelishadi, R. Environmental Pollution: Health Effects and Operational Implications for Pollutants Removal; Hindawi: London, UK, 2012. [Google Scholar]
  17. Smith, P.; Ashmore, M.R.; Black, H.I.; Burgess, P.J.; Evans, C.D.; Quine, T.A.; Thomson, A.M.; Hicks, K.; Orr, H.G. The role of ecosystems and their management in regulating climate, and soil, water and air quality. J. Appl. Ecol. 2013, 50, 812–829. [Google Scholar] [CrossRef]
  18. Lu, Y.; Song, S.; Wang, R.; Liu, Z.; Meng, J.; Sweetman, A.J.; Jenkins, A.; Ferrier, R.C.; Li, H.; Luo, W. Impacts of soil and water pollution on food safety and health risks in China. Environ. Int. 2015, 77, 5–15. [Google Scholar] [CrossRef] [Green Version]
  19. Hakami, B.A. Impacts of soil and water pollution on food safety and health risks. Technology 2015, 6, 32–38. [Google Scholar]
  20. Savci, S. Investigation of effect of chemical fertilizers on environment. Apcbee Procedia 2012, 1, 287–292. [Google Scholar] [CrossRef] [Green Version]
  21. Huang, Q.; Liu, Z.; He, C.; Gou, S.; Bai, Y.; Wang, Y.; Shen, M. The occupation of cropland by global urban expansion from 1992 to 2016 and its implications. Environ. Res. Lett. 2020, 15, 084037. [Google Scholar] [CrossRef] [Green Version]
  22. Rahman, K.; Zhang, D. Effects of fertilizer broadcasting on the excessive use of inorganic fertilizers and environmental sustainability. Sustainability 2018, 10, 759. [Google Scholar] [CrossRef] [Green Version]
  23. Tang, K.; Hailu, A. Smallholder farms’ adaptation to the impacts of climate change: Evidence from China’s Loess Plateau. Land Use Policy 2020, 91, 104353. [Google Scholar] [CrossRef]
  24. Tang, K.; Kragt, M.E.; Hailu, A.; Ma, C. Carbon farming economics: What have we learned? J. Environ. Manag. 2016, 172, 49–57. [Google Scholar] [CrossRef]
  25. Poole, N.; Echavez, C.; Rowland, D. Are agriculture and nutrition policies and practice coherent? Stakeholder evidence from Afghanistan. Food Secur. 2018, 10, 1577–1601. [Google Scholar] [CrossRef] [Green Version]
  26. Faiz, A.; Gangadharappa, N.; Malang, N. Information communication technologies (ICTS) effect in improving of sustainable pistachio forest management in Aibak District of Smamangan Province, Afghanistan. J. Glob. Commun. 2016, 9, 205–214. [Google Scholar]
  27. Saba, D.S. Afghanistan: Environmental degradation in a fragile ecological setting. Int. J. Sustain. Dev. World Ecol. 2001, 8, 279–289. [Google Scholar] [CrossRef]
  28. FAO. Current World Fertilizer Trends and Outlook to 2015; Agriculture Organization of the United Nations: Rome, Italy, 2011. [Google Scholar]
  29. Liu, T.; Wu, G. Does agricultural cooperative membership help reduce the overuse of chemical fertilizers and pesticides? Evidence from rural China. Environ. Sci. Pollut. Res. 2021, 1–12. [Google Scholar] [CrossRef]
  30. Ostad-Ali-Askari, K.; Shayannejad, M.; Ghorbanizadeh-Kharazi, H. Artificial neural network for modeling nitrate pollution of groundwater in marginal area of Zayandeh-rood River, Isfahan, Iran. KSCE J. Civ. Eng. 2017, 21, 134–140. [Google Scholar] [CrossRef]
  31. Savari, M.; Gharechaee, H. Utilizing the theory of planned behavior to predict Iranian farmers’ intention for safe use of chemical fertilizers. J. Clean. Prod. 2020, 263, 121512. [Google Scholar] [CrossRef]
  32. Gao, Y.; Qian, H.; Ren, W.; Wang, H.; Liu, F.; Yang, F. Hydrogeochemical characterization and quality assessment of groundwater based on integrated-weight water quality index in a concentrated urban area. J. Clean. Prod. 2020, 260, 121006. [Google Scholar] [CrossRef]
  33. Asadi, E.; Isazadeh, M.; Samadianfard, S.; Ramli, M.F.; Mosavi, A.; Nabipour, N.; Shamshirband, S.; Hajnal, E.; Chau, K.-W. Groundwater quality assessment for sustainable drinking and irrigation. Sustainability 2020, 12, 177. [Google Scholar] [CrossRef] [Green Version]
  34. Huq, M.E.; Fahad, S.; Shao, Z.; Sarven, M.S.; Al-Huqail, A.A.; Siddiqui, M.H.; ur Rahman, M.H.; Khan, I.A.; Alam, M.; Saeed, M. High arsenic contamination and presence of other trace metals in drinking water of Kushtia district, Bangladesh. J. Environ. Manag. 2019, 242, 199–209. [Google Scholar] [CrossRef]
  35. Khan, N.; Siddiqui, B.N.; Khan, N.; Ullah, N.; Ismail, S.; Ali, S.; Hussain, S.; Abbas, K.; Javed, H.H.; Ahmad, Z. Impact of newspaper and radio in promoting agricultural information among farmers. A case study of Pakistan. Int. J. Adv. Res. Biol. Sci. 2020, 7, 192–198. [Google Scholar]
  36. Bai, X.; Wang, Y.; Huo, X.; Salim, R.; Bloch, H.; Zhang, H. Assessing fertilizer use efficiency and its determinants for apple production in China. Ecol. Indic. 2019, 104, 268–278. [Google Scholar] [CrossRef]
  37. Yang, L.; Tang, K.; Wang, Z.; An, H.; Fang, W. Regional eco-efficiency and pollutants’ marginal abatement costs in China: A parametric approach. J. Clean. Prod. 2017, 167, 619–629. [Google Scholar] [CrossRef]
  38. Fan, L.; Yuan, Y.; Ying, Z.; Lam, S.K.; Liu, L.; Zhang, X.; Liu, H.; Gu, B. Decreasing farm number benefits the mitigation of agricultural non-point source pollution in China. Environ. Sci. Pollut. Res. 2019, 26, 464–472. [Google Scholar] [CrossRef] [PubMed]
  39. Liu, Y.; Sun, D.; Wang, H.; Wang, X.; Yu, G.; Zhao, X. An evaluation of China’s agricultural green production: 1978–2017. J. Clean. Prod. 2020, 243, 118483. [Google Scholar] [CrossRef]
  40. Mendes, J.; Pinho, T.M.; Neves dos Santos, F.; Sousa, J.J.; Peres, E.; Boaventura-Cunha, J.; Cunha, M.; Morais, R. Smartphone applications targeting precision agriculture practices—A systematic review. Agronomy 2020, 10, 855. [Google Scholar] [CrossRef]
  41. Perito, R.M. U.S. Experience with Provincial Reconstruction Teams in Afghanistan: Lessons Identified; DIANE Publishing: Collingdale, PA, USA, 2009. [Google Scholar]
  42. Mayzelle, M.; Santibañez, M.-P.; Schweiger, J.; Jallo, C. Assessment of Information and Communication Technologies in Afghan Agricultural Extension. 2015. Available online: https://pdf.usaid.gov/pdf_docs/PA00XT8R.pdf (accessed on 28 September 2021).
  43. Wentz, L.K.; Karen, E. Analysis of an Intervention: Lessons from US Advisory Work in Afghanistan’s Information and Communications Technology Sector; National Defense University: Washington, DC, USA, 2017. [Google Scholar]
  44. Razaque, A.; Sallah, M. The use of mobile phone among farmers for agriculture development. Int. J. Sci. Res 2013, 2, 95–98. [Google Scholar]
  45. Fabregas, R.; Kremer, M.; Schilbach, F. Realizing the potential of digital development: The case of agricultural advice. Science 2019, 366, 6471. [Google Scholar] [CrossRef] [Green Version]
  46. Nie, P.; Ma, W.; Sousa-Poza, A. The relationship between smartphone use and subjective well-being in rural China. Electron. Commer. Res. 2020, 1–27. [Google Scholar] [CrossRef]
  47. Zhao, Q.; Pan, Y.; Xia, X. Internet can do help in the reduction of pesticide use by farmers: Evidence from rural China. Environ. Sci. Pollut. Res. 2021, 28, 2063–2073. [Google Scholar] [CrossRef]
  48. Haile, M.G.; Wossen, T.; Kalkuhl, M. Access to information, price expectations and welfare: The role of mobile phone adoption in Ethiopia. Technol. Forecast. Soc. Chang. 2019, 145, 82–92. [Google Scholar] [CrossRef]
  49. Singh, R.K.; Luthra, S.; Mangla, S.K.; Uniyal, S. Applications of information and communication technology for sustainable growth of SMEs in India food industry. Resour. Conserv. Recycl. 2019, 147, 10–18. [Google Scholar] [CrossRef]
  50. Sekabira, H.; Qaim, M. Mobile money, agricultural marketing, and off-farm income in Uganda. Agric. Econ. 2017, 48, 597–611. [Google Scholar] [CrossRef]
  51. Rehman, A.; Jingdong, L.; Khatoon, R.; Hussain, I.; Iqbal, M.S. Modern agricultural technology adoption its importance, role and usage for the improvement of agriculture. Life Sci. J. 2016, 14, 70–74. [Google Scholar]
  52. Yuan, F.; Tang, K.; Shi, Q. Does Internet use reduce chemical fertilizer use? Evidence from rural households in China. Environ. Sci. Pollut. Res. 2020, 28, 6005–6017. [Google Scholar] [CrossRef] [PubMed]
  53. Tesfaye, A.; Hansen, J.; Kassie, G.T.; Radeny, M.; Solomon, D. Estimating the economic value of climate services for strengthening resilience of smallholder farmers to climate risks in Ethiopia: A choice experiment approach. Ecol. Econ. 2019, 162, 157–168. [Google Scholar] [CrossRef] [Green Version]
  54. Salahuddin, M.; Alam, K.; Ozturk, I. The effects of Internet usage and economic growth on CO2 emissions in OECD countries: A panel investigation. Renew. Sustain. Energy Rev. 2016, 62, 1226–1235. [Google Scholar] [CrossRef]
  55. Ma, W.; Nie, P.; Zhang, P.; Renwick, A. Impact of Internet use on economic well-being of rural households: Evidence from China. Rev. Dev. Econ. 2020, 24, 503–523. [Google Scholar] [CrossRef]
  56. Matassa, S.; Batstone, D.J.; Hülsen, T.; Schnoor, J.; Verstraete, W. Can Direct Conversion of Used Nitrogen to New Feed and Protein Help Feed the World? ACS Publications: Washington, DC, USA, 2015. [Google Scholar]
  57. Khan, N.; Siddiqui, B.N.; Khan, N.; Ismail, S. The Internet of thing in sustainable agriculture. Artech J. Res. Stud. Agric. Sci 2020, 2, 12–15. [Google Scholar]
  58. Kaila, H.; Tarp, F. Can the internet improve agricultural production? Evidence from Viet Nam. Agric. Econ. 2019, 50, 675–691. [Google Scholar] [CrossRef] [Green Version]
  59. Hou, J.; Huo, X.; Yin, R. Does computer usage change farmers’ production and consumption? Evidence from China. China Agric. Econ. Rev. 2019, 11, 387–410. [Google Scholar] [CrossRef] [Green Version]
  60. Fan, Q.; Salas Garcia, V.B. Information access and smallholder farmers’ market participation in Peru. J. Agric. Econ. 2018, 69, 476–494. [Google Scholar] [CrossRef]
  61. Omerkhil, N.; Chand, T.; Valente, D.; Alatalo, J.M.; Pandey, R. Climate change vulnerability and adaptation strategies for smallholder farmers in Yangi Qala District, Takhar, Afghanistan. Ecol. Indic. 2020, 110, 105863. [Google Scholar] [CrossRef]
  62. Ahmed, S. Agriculture-Fertilizer Interface in Asian and Pacific Region: Issue of Growth, Sustainability, and Vulnerability; Food and Fertilizer Technology Center: Taipei, Taiwan, 1994. [Google Scholar]
  63. Hashimi, R.; Matsuura, E.; Komatsuzaki, M. Effects of cultivating rice and wheat with and without organic fertilizer application on greenhouse gas emissions and soil quality in Khost, Afghanistan. Sustainability 2020, 12, 6508. [Google Scholar] [CrossRef]
  64. Shuqin, J.; Fang, Z. Zero growth of chemical fertilizer and pesticide use: China’s objectives, progress and challenges. J. Resour. Ecol. 2018, 9, 50–58. [Google Scholar] [CrossRef]
  65. Iqbal, K.; Hassan, S.T.; Peng, H. Analyzing the role of information and telecommunication technology in human development: Panel data analysis. Environ. Sci. Pollut. Res. 2019, 26, 15153–15161. [Google Scholar] [CrossRef] [PubMed]
  66. Ihtisham, M.; Fahad, S.; Luo, T.; Larkin, R.M.; Yin, S.; Chen, L. Optimization of nitrogen, phosphorus, and potassium fertilization rates for overseeded perennial ryegrass turf on dormant bermudagrass in a transitional climate. Front. Plant Sci. 2018, 9, 487. [Google Scholar] [CrossRef] [PubMed] [Green Version]
  67. Mohmand, A.M.; Marjan, A.; Sangin, A. Developing e-government in Afghanistan. In Proceedings of the 4th International Conference on Theory and Practice of Electronic Governance, Beijing, China, 25–28 October 2010; pp. 43–48. [Google Scholar]
  68. Salamzada, K.; Shukur, Z.; Bakar, M.A. A framework for cybersecurity strategy for developing countries: Case study of Afghanistan. Asia Pac. J. Inf. Technol. Multimed. 2015, 4, 1–10. [Google Scholar] [CrossRef] [Green Version]
  69. Fong, M.W. Digital divide between urban and rural regions in China. Electron. J. Inf. Syst. Dev. Ctries. 2009, 36, 1–12. [Google Scholar] [CrossRef]
  70. Pant, L.P.; Odame, H.H. Broadband for a sustainable digital future of rural communities: A reflexive interactive assessment. J. Rural Stud. 2017, 54, 435–450. [Google Scholar] [CrossRef]
  71. Adapa, S. Indian smart cities and cleaner production initiatives—Integrated framework and recommendations. J. Clean. Prod. 2018, 172, 3351–3366. [Google Scholar] [CrossRef]
  72. Braungart, M.; McDonough, W.; Bollinger, A. Cradle-to-cradle design: Creating healthy emissions—A strategy for eco-effective product and system design. J. Clean. Prod. 2007, 15, 1337–1348. [Google Scholar] [CrossRef]
  73. Huang, J.; Huang, Z.; Jia, X.; Hu, R.; Xiang, C. Long-term reduction of nitrogen fertilizer use through knowledge training in rice production in China. Agric. Syst. 2015, 135, 105–111. [Google Scholar] [CrossRef]
  74. Sun, Y.; Hu, R.; Zhang, C. Does the adoption of complex fertilizers contribute to fertilizer overuse? Evidence from rice production in China. J. Clean. Prod. 2019, 219, 677–685. [Google Scholar] [CrossRef]
  75. WHO. WHO Country Cooperation Strategy at a Glance: Afghanistan; World Health Organization: Geneva, Switzerland, 2018. [Google Scholar]
  76. Omerkhil, N.; Kumar, P.; Mallick, M.; Meru, L.B.; Chand, T.; Rawat, P.; Pandey, R. Micro-level adaptation strategies by smallholders to adapt climate change in the least developed countries (LDCs): Insights from Afghanistan. Ecol. Indic. 2020, 118, 106781. [Google Scholar] [CrossRef]
  77. Reich, D.; Pearson, C. Irrigation outreach in Afghanistan: Exposure to Afghan water security challenges. J. Contemp. Water Res. Educ. 2012, 149, 33–40. [Google Scholar] [CrossRef]
  78. Hassanzoy, N. Panorama Report of Afghanistan: A Review of Afghanistan’s Food and Agricultural Statistics System; TCP/INT/3401 Panorama Report I, Technical Report; FAO: Kabul, Afghanistan, 2013. [Google Scholar]
  79. CSO. Afghanistan Living Conditions Survey 2016–17; CSO: Kabul, Afghanistan, 2018. [Google Scholar]
  80. Abdul, M.; Anowar, M. Nutrition promotion and collective vegetable gardening by adolescent girls: Feasibility assessment from a pilot in Afghanistan. Asian J. Agric. Rural Dev. 2018, 8, 40–49. [Google Scholar]
  81. Ahmed, A.; Shafique, I. Perception of household in regards to water pollution: An empirical evidence from Pakistan. Environ. Sci. Pollut. Res. 2019, 26, 8543–8551. [Google Scholar] [CrossRef] [PubMed]
  82. Kehinde, A.; Adeyemo, R.; Amujoyegbe, B.; Bamire, A.; Idrissou, L. Gender differentials and fertilizer adoption among small holder farmers in cocoa based farming system of Southwestern, Nigeria. Int. J. Agric. Policy Res. 2016, 4, 276–281. [Google Scholar]
  83. Huang, W.; Ghimire, R.; Poudel, M. Adoption intensity of agricultural technology: Empirical evidence from smallholder maize farmers in Nepal. Int. J. Agric. Innov. Res. 2015, 4, 139–146. [Google Scholar]
  84. Narula, S.A. Revolutionizing food supply chains of Asia through ICTs. Sustain. Chall. Agrofood Sect. 2017, 212. [Google Scholar]
  85. Bellon-Maurel, V.; Peters, G.M.; Clermidy, S.; Frizarin, G.; Sinfort, C.; Ojeda, H.; Roux, P.; Short, M.D. Streamlining life cycle inventory data generation in agriculture using traceability data and information and communication technologies—Part II: Application to viticulture. J. Clean. Prod. 2015, 87, 119–129. [Google Scholar] [CrossRef] [Green Version]
  86. Zhou, D.; Liang, X.; Zhou, Y.; Tang, K. Does emission trading boost carbon productivity? Evidence from China’s pilot emission trading scheme. Int. J. Environ. Res. Public Health 2020, 17, 5522. [Google Scholar] [CrossRef] [PubMed]
  87. Shi, B.; Feng, C.; Qiu, M.; Ekeland, A. Innovation suppression and migration effect: The unintentional consequences of environmental regulation. China Econ. Rev. 2018, 49, 1–23. [Google Scholar] [CrossRef]
  88. Hamdard, J. The State of Telecommunications and Internet in Afghanistan. Six Years Later (2006–2012); Assistant Report; MICT of Afghanistan: Kabul, Afghanistan, 2012. [Google Scholar]
  89. Yang, Y.; Wu, F.; Zhang, Q.; Hong, J.; Dong, C. Is it sustainable to implement a regional payment for ecosystem service programme for 10 Years? An empirical analysis from the perspective of household livelihoods. Ecol. Econ. 2020, 176, 106746. [Google Scholar] [CrossRef]
  90. Michalek, J.; Ciaian, P.; Pokrivcak, J. The impact of producer organizations on farm performance: The case study of large farms from Slovakia☆. Food Policy 2018, 75, 80–92. [Google Scholar] [CrossRef]
  91. Smith, J.A.; Todd, P.E. Does matching overcome LaLonde’s critique of nonexperimental estimators? J. Econom. 2005, 125, 305–353. [Google Scholar] [CrossRef] [Green Version]
  92. Zhang, H.; Duan, M.; Deng, Z. Have China’s pilot emissions trading schemes promoted carbon emission reductions?—The evidence from industrial sub-sectors at the provincial level. J. Clean. Prod. 2019, 234, 912–924. [Google Scholar] [CrossRef]
  93. Ren, S.; Wei, W.; Sun, H.; Xu, Q.; Hu, Y.; Chen, X. Can mandatory environmental information disclosure achieve a win-win for a firm’s environmental and economic performance? J. Clean. Prod. 2020, 250, 119530. [Google Scholar] [CrossRef]
  94. Khan, M.; Mahmood, H.Z.; Damalas, C.A. Pesticide use and risk perceptions among farmers in the cotton belt of Punjab, Pakistan. Crop. Prot. 2015, 67, 184–190. [Google Scholar] [CrossRef]
  95. Zhang, J.; Mishra, A.K.; Hirsch, S.; Li, X. Factors affecting farmland rental in rural China: Evidence of capitalization of grain subsidy payments. Land Use Policy 2020, 90, 104275. [Google Scholar] [CrossRef]
  96. Corrado, C.; Haltiwanger, J.; Sichel, D. Introduction to ”Measuring capital in the new economy”. In Measuring Capital in the New Economy; University of Chicago Press: Chicago, IL, USA, 2005; pp. 1–10. [Google Scholar]
  97. Case, S.; Oelofse, M.; Hou, Y.; Oenema, O.; Jensen, L.S. Farmer perceptions and use of organic waste products as fertilisers—A survey study of potential benefits and barriers. Agric. Syst. 2017, 151, 84–95. [Google Scholar] [CrossRef]
  98. Aziz, M. Implementing ICT For Governance in Fragile States—A Case Study of Afghanistan. In e-Governance: A Global Journey; IOS Press: Amsterdam, The Netherlands, 2012; pp. 93–106. [Google Scholar]
  99. Mikheev, A.; Aleksandrova, A.; Khabib, M. The Impact of Information Technology on the GDP Growth Rate of Developing Countries. Talent Dev. Excell. 2020, 12, 1303–1313. [Google Scholar]
  100. Guo, X.; Xiao, B.; Song, L. Emission reduction and energy-intensity enhancement: The expected and unexpected consequences of China’s coal consumption constraint policy. J. Clean. Prod. 2020, 271, 122691. [Google Scholar] [CrossRef]
  101. Nimruzi, A.; Ganapathy, J.; Nyborg, I.L. Can technology build trust? Community-oriented policing and ICT in Afghanistan. In Community-Oriented Policing and Technological Innovations; Springer: Cham, Switzerland, 2018; pp. 11–18. [Google Scholar]
  102. Jenish, N. ICT-Driven Technological and Industrial Upgrading in Afghanistan, Kyrgyzstan and Tajikistan: Current Realities and Opportunities; University of Central Asia—Institute of Public Policy and Administration: Bishkek, Kyrgyzstan, 2018. [Google Scholar]
  103. Khan, N.; Ismail, S.; Wali, A.; Kazim, R.; Azam, T. The influence of information communication technology development on income inequality. Artech J. Curr. Bus. Financ. Aff. 2020, 2, 11–18. [Google Scholar]
  104. Zhang, C.; Zhou, B.; Wang, Q. Effect of China’s western development strategy on carbon intensity. J. Clean. Prod. 2019, 215, 1170–1179. [Google Scholar] [CrossRef]
  105. Deng, X.; Xu, D.; Zeng, M.; Qi, Y. Does internet use help reduce rural cropland abandonment? Evidence from China. Land Use Policy 2019, 89, 104243. [Google Scholar] [CrossRef]
Figure 1. Conceptual framework of the study.
Land 10 01023 g001
Figure 2. Map of the study area.
Land 10 01023 g002
Figure 3. IF application rates of 15,223 farmers/households in the study area. Threshold of 150 kg/ha is the average IF rate for 15,223 farmers’ application rates.
Land 10 01023 g003
Figure 4. PSM distribution of treatment and control groups.
Land 10 01023 g004
Table 1. Variables’ description and descriptive statistics.
Variables NamesDescriptionMean (S.D)
Inorganic fertilizer Use of inorganic fertilizer (kg/ha)198.40 (36.98)
Mobile phoneWhether the household uses mobile phone (1 = yes; 0 = no)0.17 (0.42)
Age Age of the respondent (year)43.16 (14.23)
Health statusHealth status of head 16.45 (2.83)
EducationEducation of head (year)5.63 (3.41)
Household sizeHousehold member (numbers)6.45 (2.83)
Land areaLand area per capita (ha)2.85 (2.14)
IT Number of households using Internet technology2.85 (3.52)
IncomePer capita income (Afghani)27,984.19 (41,846.61)
AssetFixed assets produced per capita (Afghani)2572.16 (16,292.17)
Cereal cropWhether the cereal crops are the major product (1 = cereal income ratio 50%; 0 = ratios of cereals profits to farming profits fewer than 50%)0.55 (0.49)
Agricultural
Education
If the household received AEST (1= yes, 0= no)0.20 (0.41)
Non-Agricultural Education If the household received NAEST (1= yes, 0= no)0.42 (0.50)
Notes: 1 Self-described health status, assessed from one (disabled) to five (good); Standard deviations (S.D) are in parentheses.
Table 2. Influences of mobile phones on inorganic fertilizer usage.
Explanatory
Variables
Column
(1)
S.EColumn
(2)
S.EColumn
(3)
S.EColumn
(4)
S.E
Age −0.0020.082−0.0050.082−0.0020.082−0.0060.082
Health status 0.085 ***0.0280.083 ***0.0280.086 ***0.0280.085 ***0.028
Education 0.0190.0160.0190.0160.0190.0160.0190.016
Household size −0.0150.007−0.0150.007−0.0140.008−0.0140.008
Land area−0.260 ***0.030−0.260 ***0.030−0.260 ***0.030−0.261 ***0.030
IT 0.0000.0020.0000.002−0.062 ***0.013−0.056 ***0.013
Income 0.064 ***0.0090.064 ***0.0090.064 ***0.0090.064 ***0.009
Asset 0.088 ***0.0060.088 ***0.0060.089 ***0.0060.088 ***0.006
Cereal crop2.573 ***0.0412.529 ***0.0422.447 ***0.0492.419 ***0.049
Mobile phone −0.126 **0.053−0.355 ***0.075−0.117 **0.053−0.321 ***0.352
Mobile phone× cereal crop--0.395 ***0.091--0.352 ***0.092
IT× cereal crop----0.063 ***0.0130.058 ***0.013
Constant 0.5043.1810.9434.1710.5614.1710.8724.171
Individual effect Yes -Yes -Yes -Yes -
Year effects Yes -Yes -Yes -Yes -
Area dummiesYes -Yes -Yes -Yes -
Observation numbers 31,036-31,036-31,036-31,036-
Group number7514-7514-7514-7514-
F-stat361.34-344.19-344.24-328.64-
Notes: ***, **, and * indicate that it is statistically significant at 1%, 5%, and 10% levels, respectively; Standard errors (S.E) clustered at the farmer level; IF, land, asset, and income are all in logarithmic form; The area dummies are signified through North, East, Central, and West in the regression method.
Table 3. Mediating impacts of human capital between mobile phone and IF usage.
Described
Variables
NAESTS.EIFS.EAESTS.EIFS.E
Fixed-Effects
Models
LogitLinear LogitLinear
Column (1)Column (2)Column (3)Column (4)
Age 0.3590.2280.0010.0830.0040.236−0.0010.083
Health status 0.0450.0770.085 ***0.028−0.0160.081 0.085 ***0.028
Education −0.0410.0380.0180.015−0.0170.040 0.0180.014
Household size0.104 ***0.0340−0.0120.009−0.0040.029−0.0130.009
Land area −0.261 ***0.030−0.261***0.030−0.260 ***0.030−0.260 ***0.030
IT0.279 ***0.0420.0000.002−0.0550.049 0.0000.002
Income 0.072 ***0.0270.064 ***0.010−0.0230.0260.064 ***0.010
Asset 0.0090.0160.087 ***0.0070.035 *0.0180.087 ***0.007
Cereal crop0.0340.1242.573 ***0.0410.1100.1252.572 ***0.041
Mobile phone0.479 ***0.138−0.123 **0.053−0.085−0.1660.126 **0.053
Agricultural
Education
------0.210 ***0.063
Non-Agricultural Education--−0.117 **0.055----
Constant --0.5104.277--0.5544.277
Individual effect Yes-Yes-Yes-Yes-
Year effect Yes-Yes-Yes-Yes-
Area dummies Yes-Yes-Yes-Yes-
Observation numbers 4957-31,036-3948-31,036-
Group numbers 1047-7514-833-7514-
F-value---444.90----335.45-
Likelihood ratio test170.29----42.64----
Notes: ***, **, and * indicate that it is statistically significant at 1%, 5%, and 10% levels, respectively; Standard errors (S.E) clustered at the farmer level.
Table 4. Influences of mobile phone promotion policy on IF usage DID method.
Described Variables: IF Column
(1)
S.EColumn
(2)
S.EColumn
(3)
S.EColumn
(4)
S.E
Treat × T−0.525 **0.230−0.375 *0.217
Treat × year2012- --−0.690 **0.285−0.515 *0.270
Treat × year2013----−0.657 **0.305−0.572 **0.273
Treat × year2014----−0.2170.295−0.0340.274
Treat−0.2810.170−0.666 ***0.162−0.2780.170−0.065 ***0.170
Constant3.707 ***0.122−1.724 ***0.5713.777 ***0.111−1.725 ***0.560
Year dummy Yes-Yes-Yes-Yes-
Control variables No-Yes-No-Yes-
Observation numbers 6411-6411-6411-6411-
F-value25.00-67.40-27.09-66.71-
Notes: ***, **, and * indicate that it is statistically significant at 1%, 5%, and 10% levels, respectively; Standard errors (S.E) clustered at the farmer level.
Table 5. Propensity score matches balance test outcomes.
Result: IFUnmatched
(Matched)
Matched MeanPercent
Bias
Percent Reduce Biast-Test
ControlTreatmentt-Valuep-Value
AgeU (M) 137.20 (37.20)36.74 (35.38)−19.0 (−2.4)(87.6)−6.05(−0.62)0.00 (0.53)
Health status U (M)4.59 (4.59)4.38 (4.58)43.8 (3.3)(92.4)13.15 (0.88)0.00 (0.38)
EducationU (M)7.99 (7.99)7.01 (6.93)−5.8 (−2.0)(65.1)−1.83 (−0.53)0.07 (0.60)
Household sizeU (M)4.28 (4.28)4.64 (4.20)−19.1 (4.6)(75.7)−6.50 (1.23)0.00 (0.214)
Land areaU (M)−0.32 (−0.32)−0.24 (−0.41)−9.4 (9.8)(−4.4)−2.75 (2.34)0.01 (0.02)
Income U (M)8.72 (8.72)8.67 (8.77)2.3 (−2.2)(3.4)0.70 (−0.58)0.49 (0.56)
Asset U (M)6.30 (6.30)5.20 (6.25)31.4 (1.4)(95.5)9.57 (0.40)0.00 (0.70)
IT U (M)1.73 (1.73)2.30 (2.59)−5.0 (−7.6)(−51.3)−1.29 (−1.13)0.21 (0.25)
Cereal cropU (M)0.59 (0.59)0.53 (0.59)13.1 (1.4)(89.5)5.13 (0.85)0.00 (0.88)
Notes: (M) 1 indicates the matched values in parentheses.
Table 6. Outcomes of PSM-DID method.
Described
Variables
Column (1)S.EColumn (2)S.EColumn (3)S.EColumn (4)S.E
Treat × T−1.237 ***0.198−0.996 ***0.260
Treat × year2012----−1.233 ***0.370−1.068 ***0.345
Treat × year2013-----−1.396 ***0.381−1.002 ***0.356
Treat × year2014----−1.389 ***0.371−0.919 ***0.348
Treat 0.1390.217−0.1100.2030.1390.217−0.1100.203
Constant 3.237 ***0.1931.3430.8353.237 ***0.1931.3600.837
Year dummyYes-Yes-Yes-Yes-
Control variables No-Yes-No-Yes-
Observation numbers 2610-2610-2610-2610-
F-value12.38-31.57-9.43-30.71-
Notes: ***, **, and * indicate that it is statistically significant at 1%, 5%, and 10% level, respectively; Standard errors (S.E) clustered at the farmer level.
Table 7. Outcomes of two-stage IVM.
Described
Variables
Column (1)S.EColumn (2)S.E
First-StageTwo-Stage Least Squares
Mobile PhoneIF
IV 0.727 ***0.446----
Mobile phone ----−0.543 ***0.187
Age −0.0020.010−0.0020.083
Health status 0.0030.0030.076 ***0.021
Education −0.0010.0020.0150.013
Household size 0.004 ***0.001−0.0140.008
Land area −0.0030.003−0.262 ***0.030
IT 0.0000.0000.0000.002
Income 0.003 ***0.0010.053 ***0.009
Asset 0.001 ***0.0010.089 ***0.006
Cereal crop−0.0010.0052.662 ***0.032
Year effectYes -Yes-
Area dummies Yes -Yes -
Individual effectYes -Yes -
Observation numbers 15,223-15,223-
First stage F statistic (P)444.900.000---
Note: ***, **, and * indicate that it is statistically significant at 1%, 5%, and 10% levels, respectively; Standard errors (S.E) clustered at the farmer level.
Publisher’s Note: MDPI stays neutral with regard to jurisdictional claims in published maps and institutional affiliations.

