
Mapping Highland Barley on the Qinghai–Tibet Combing Landsat OLI Data and Object-Oriented Classification Method

Abstract
:1. Introduction
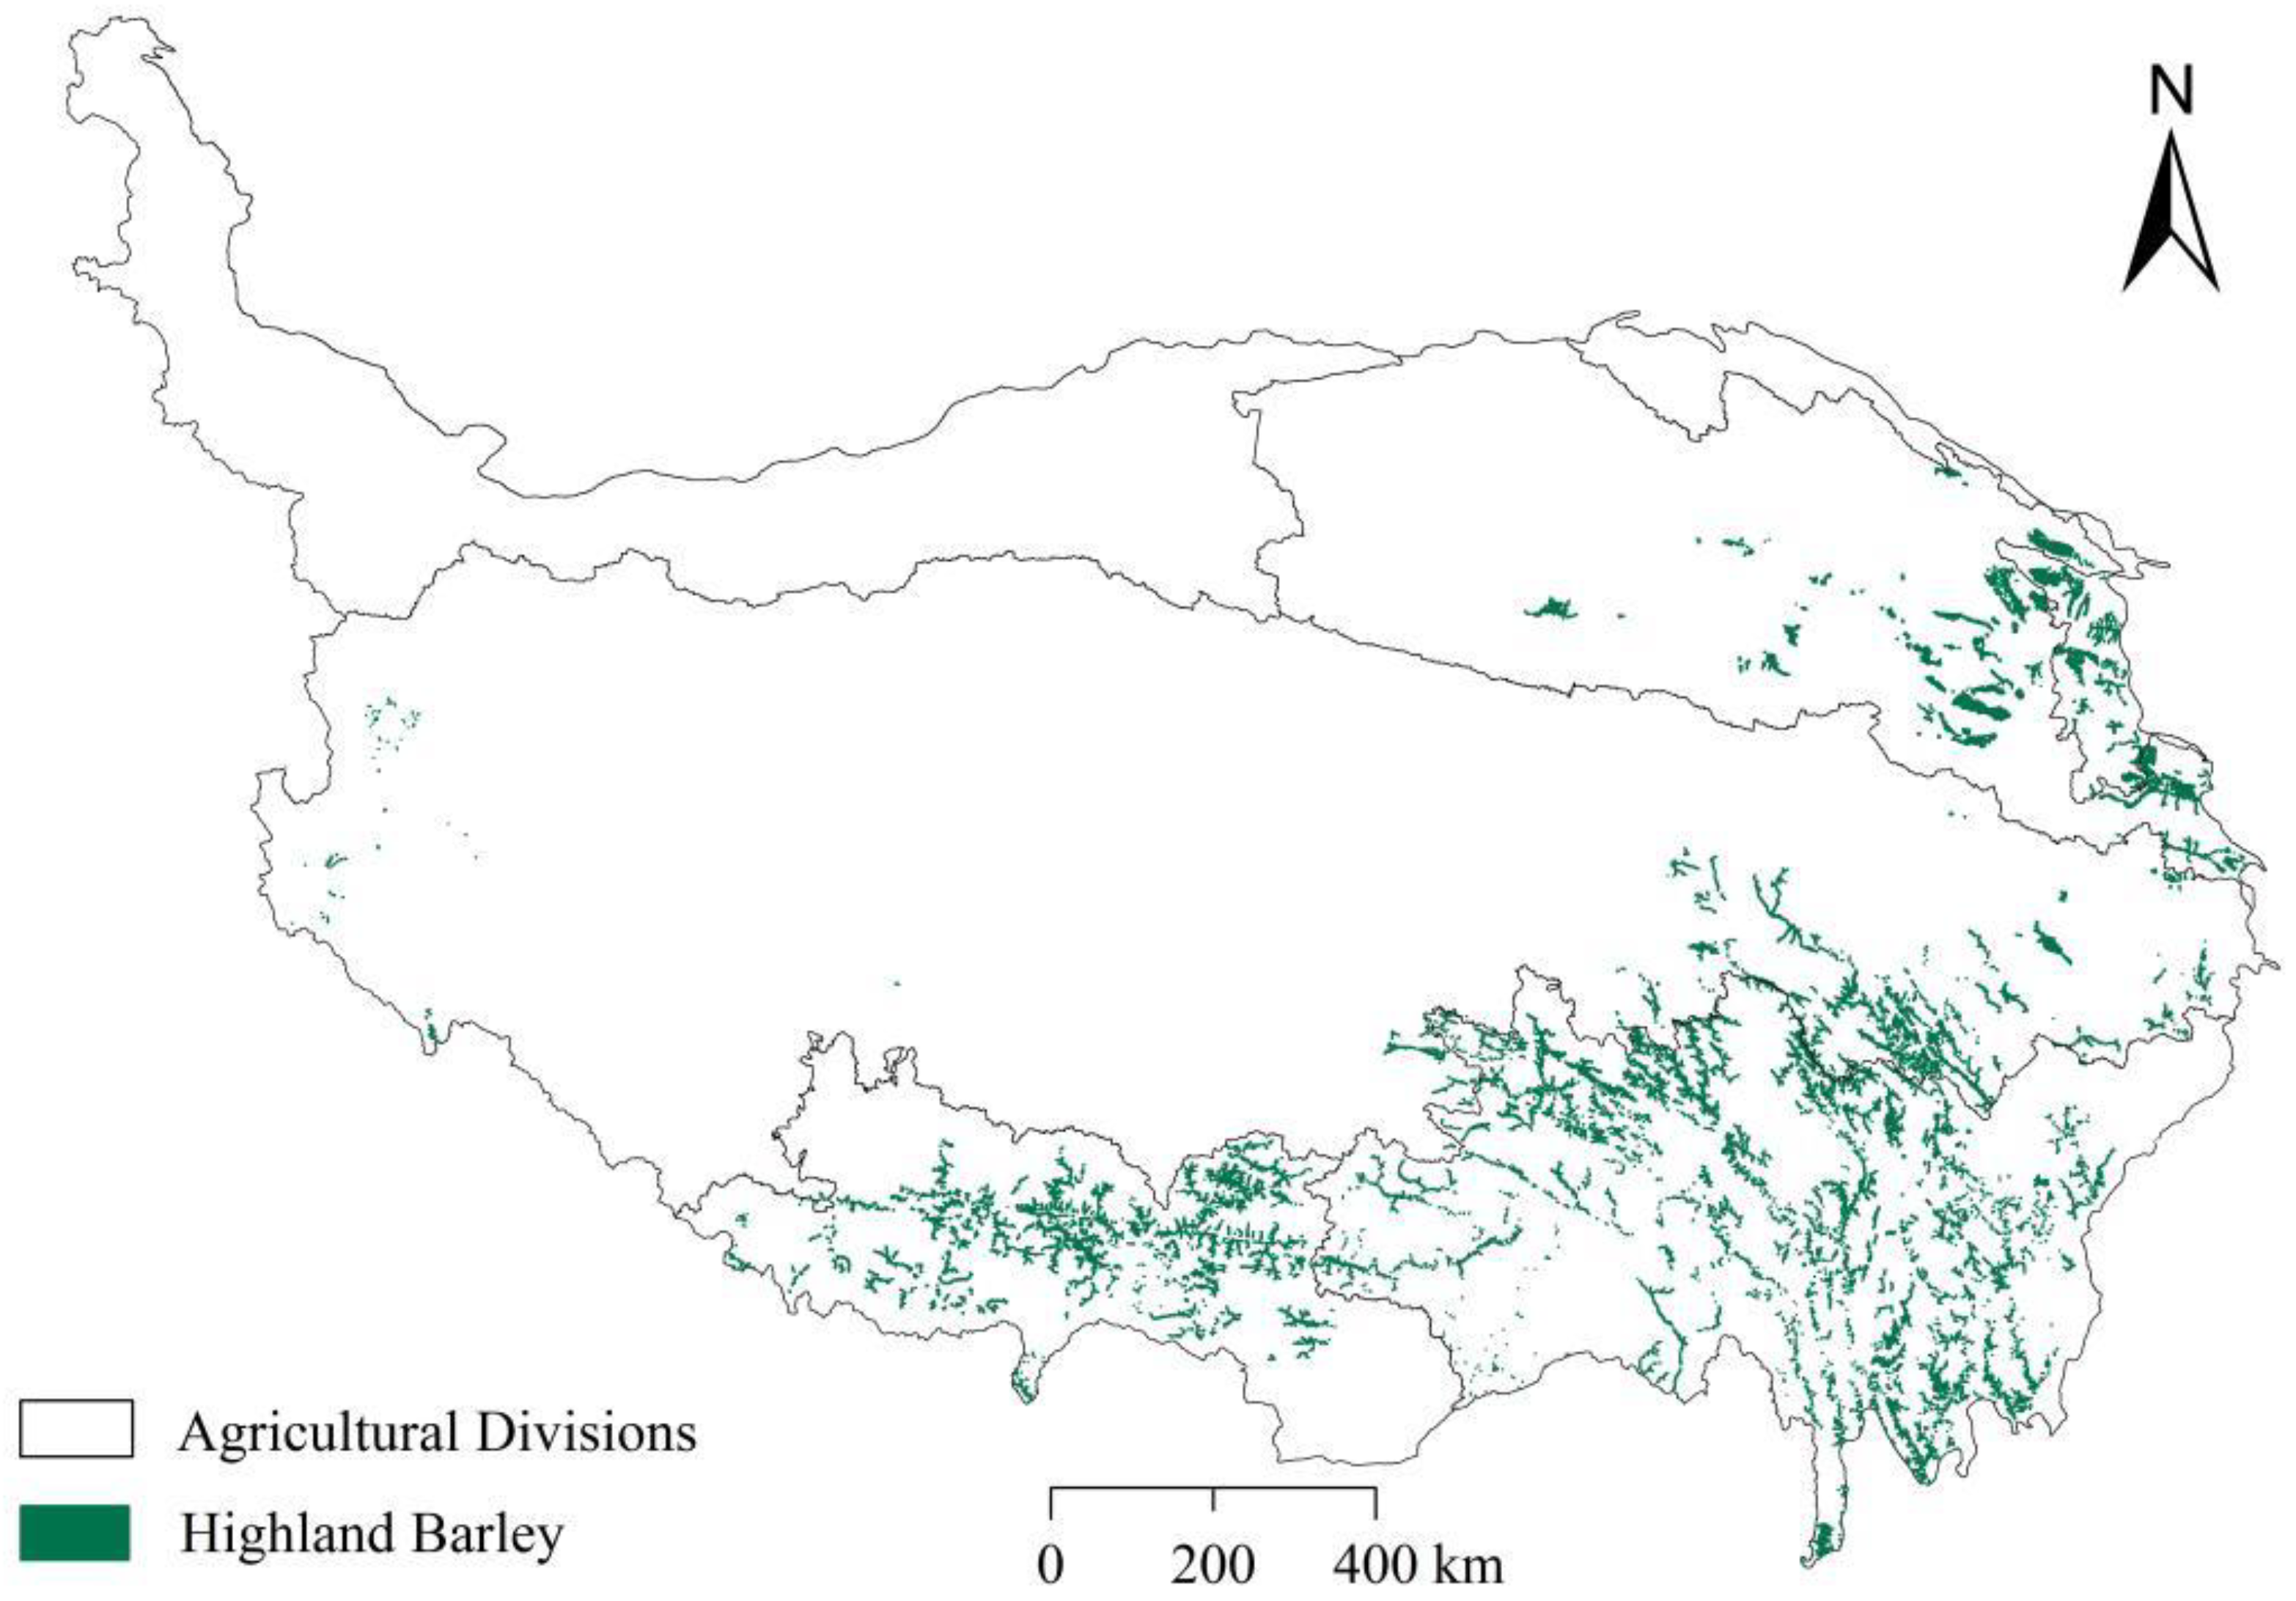
2. Study Area
3. Materials and Methods
3.1. Data Collection
3.2. Remote Sensing Image Preprocessing
3.3. Sample-Based and Object-Oriented Information Extraction Methods
3.4. Band Optimization
3.5. Highland Barley Cultivation Extent Restriction
3.6. Accuracy Verification
3.7. The Extraction Process of Highland Barley
4. Results
4.1. Highland Barley Extraction Based on Sample Information
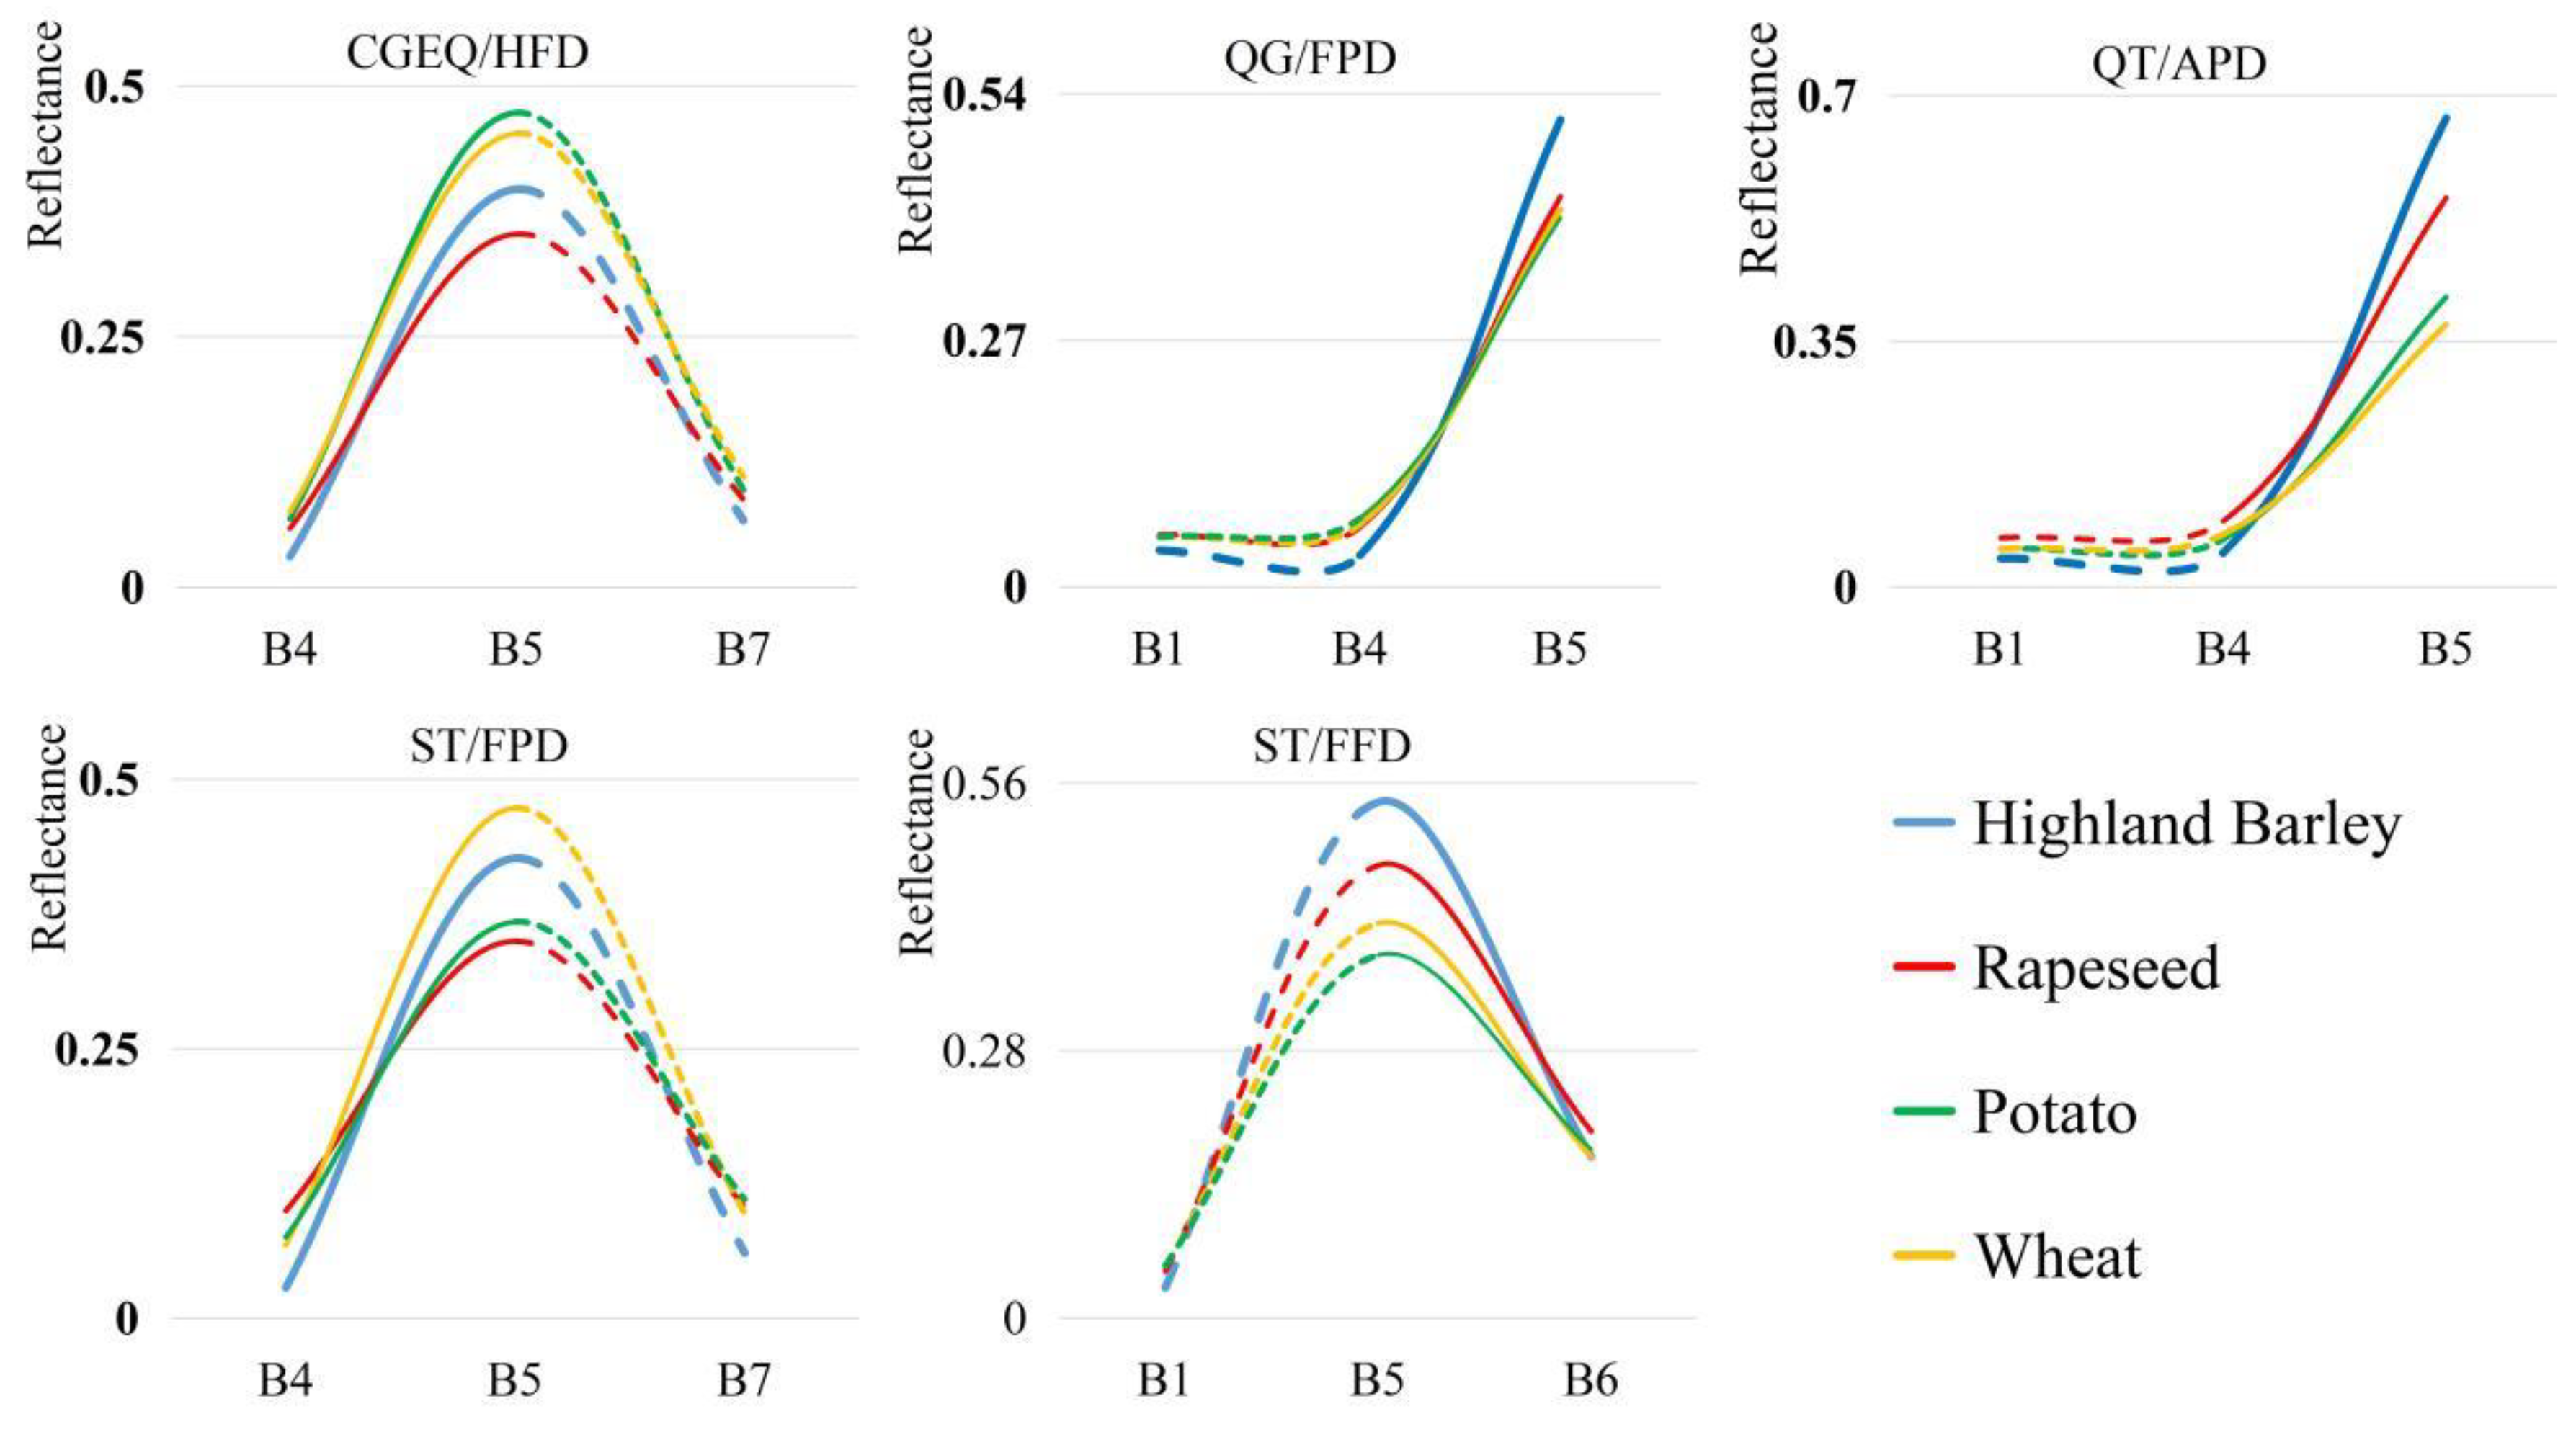
4.2. Optimizing the Bands of Highland Barley Extraction in Each Agriculture Area
4.3. The Extraction Results of Highland Barley
4.4. Results of Accuracy Verification
5. Discussion
5.1. Classification and Statistics of Highland Barley Cultivation Area
5.2. The Relationship between Highland Barley and Elevation
5.3. Ways to Improve the Accuracy of Remote Sensing Extraction of Highland Barley Area
6. Conclusions
Author Contributions
Funding
Data Availability Statement
Acknowledgments
Conflicts of Interest
Appendix A. Highland Barley Extraction Area of Counties in Different Divisions

| County | Area (ha) | County | Area (ha) | County | Area (ha) |
|---|---|---|---|---|---|
| Datong | 1379.34 | Ledu | 812.67 | Huzhu | 3496.05 |
| Hualong | 4564.58 | Tongren | 1200.35 | Xiahe | 1258.40 |
| Jianzha | 380.07 | Xunhua | 389.99 |
| County | Area (ha) | County | Area (ha) | County | Area (ha) |
|---|---|---|---|---|---|
| Aba | 4722.81 | Pulan | 498.01 | Maerkang | 642.17 |
| Baqing | 34.34 | Rangtang | 1079.89 | Nima | 31.72 |
| Biru | 1566.59 | Ritu | 173.12 | Heishui | 609.99 |
| Gaier | 133.97 | Zoige | 762.80 | Jiali | 199.64 |
| Geji | 12.83 | Saga | 225.09 | Zhada | 212.88 |
| Yushu | 2489.11 | Songpan | 583.56 |
| County | Area (ha) | County | Area (ha) | County | Area (ha) |
|---|---|---|---|---|---|
| Delingha | 1143.29 | Huangzhong | 1181.14 | Haiyan | 938.81 |
| Diebu | 1151.98 | Lintan | 1296.00 | Hezuo | 2760.95 |
| Dulan | 8187.53 | Luqu | 1046.70 | Huangyuan | 622.89 |
| Gangcha | 100.00 | Menyuan | 11,297.36 | Zeku | 1084.57 |
| Golmud | 1196.64 | Qilian | 1085.78 | Zhouqu | 1434.17 |
| Gonghe | 14,105.70 | Tongde | 5754.35 | Zhuoni | 861.86 |
| Guide | 626.45 | Wulan | 753.25 | ||
| Guinan | 17,148.20 | Xinghai | 5406.80 |
| County | Area (ha) | County | Area (ha) | County | Area (ha) |
|---|---|---|---|---|---|
| Basu | 1578.10 | Gongbujiangda | 2032.27 | Luolong | 3051.00 |
| Batang | 1340.96 | Gongjue | 2706.73 | Muli | 1161.31 |
| Bayi | 240.93 | Gongshan | 229.10 | Seda | 721.10 |
| Baiyu | 3040.79 | Jiacha | 995.60 | Suo | 1433.10 |
| Bianba | 3088.20 | Jiangda | 4119.39 | Weixi | 1205.71 |
| Bomi | 1445.40 | Jiulong | 143.24 | Xiangcheng | 878.09 |
| Chaya | 2920.20 | Karuo | 4125.24 | Xianggelila | 3660.54 |
| Chayu | 892.10 | Kangding | 2119.79 | Xinlong | 2324.57 |
| Danba | 257.11 | Lanping | 237.42 | Yajiang | 1544.52 |
| Daofu | 2843.57 | Langxia | 594.45 | Mangkang | 2151.20 |
| Daocheng | 1835.31 | Leiwuqi | 2838.30 | Milin | 785.30 |
| Derong | 720.70 | Litang | 2569.01 | Motuo | 94.50 |
| Deqin | 791.55 | Luhuo | 2890.85 | Yulong | 919.35 |
| Dingqing | 6123.15 | Lushui | 532.73 | Zuogong | 1976.40 |
| County | Area (ha) | County | Area (ha) | County | Area (ha) |
|---|---|---|---|---|---|
| Angren | 3988.97 | Jilong | 672.89 | Nimu | 1325.03 |
| Bailang | 5316.98 | Jiangzi | 6008.92 | Nielamu | 1275.54 |
| Banma | 246.60 | Kangma | 2112.89 | Qiongjie | 893.18 |
| Chengguan | 266.38 | Lazi | 4372.94 | Qushui | 1699.76 |
| Cuomei | 662.16 | Langkazi | 1575.53 | Qusong | 800.33 |
| Cuona | 915.95 | Linzhou | 5714.82 | Renbu | 1157.63 |
| Dazi | 1357.72 | Longzi | 1458.27 | Sajia | 4146.10 |
| Dingjie | 2136.42 | Maqin | 435.15 | Sangri | 361.28 |
| Dingri | 6427.01 | Mozhugongka | 2373.86 | Sangzhuzi | 6069.92 |
| Duilongdeqing | 2637.92 | Naidong | 941.37 | Xietongmen | 1641.20 |
| Gangba | 790.47 | Nanmulin | 4322.75 | Yadong | 194.78 |
| Gongga | 2296.08 | Nangqian | 2432.18 | Zhanang | 1868.76 |
References
- Wang, R.; Jiang, Y.; Zhang, A.; Gao, Y.; Wang, J. Review on crop exposure of natural disasters. J. Catastr. 2019, 34, 215–221. [Google Scholar] [CrossRef]
- Xu, M. Study on World Barley Trade Pattern and Its Influence on Chinese Barley Industry. Ph.D. Thesis, Chinese Academy of Agricultural Sciences, Beijing, China, 2013. [Google Scholar]
- Meng, J.; Li, H.; Zhang, Q.; Li, M.; Liu, S. Effect of growth conditions on the Yield and nutrient quality of Hulless Barley. J. Anhui Agric. Sci. 2017, 45, 30–38. [Google Scholar] [CrossRef]
- Yin, Z.; Ouyang, H.; Zhang, X. Study on water consumption of Spring Naked Barley Land and suitable irrigation system in Tibet. J. Nat. Resour. 2010, 25, 1666–1675. [Google Scholar] [CrossRef]
- Fan, Y.Z.; Zhong, Z.M.; Zhang, X.Z. A comparative analysis of photosynthetic characteristics of hulless barley at two altitudes on the Tibetan Plateau. Photosynthetica 2011, 49, 112–118. [Google Scholar] [CrossRef]
- Basang, Y.; Liu, X.; Fu, G.; Li, D. Genetic diversity and population structure analysis of hulless barley with Cold Tolrrance from the Qinghai-Tibetan Pleteau Revealed by SSR Markers. J. Triticeae Crops 2017, 37, 40–47. [Google Scholar] [CrossRef]
- Qi, Y.; Cao, S.; Li, X.; Li, M. Fusarium avenaceum infection: Effects on physiological indexes of leaves and roots of naked barley with different resistance. Chin. Agric. Sci. Bull. 2019, 32, 101–107. [Google Scholar]
- Zhu, F.; Du, B.; Xu, B. Superfine grinding improves functional properties and antioxidant capacities of bran dietary fibre from Qingke (hull-less barley) grown in Qinghai-Tibet Plateau, China. J. Cereal Sci. 2015, 65, 43–47. [Google Scholar] [CrossRef]
- Hu, H.; Liu, P.; Cheng, P.; Wang, W.; Liu, Y. Study on the Auxiliary Hypoglycemic function of small molecule β-Glucan from Hull-less Barley. Food Res. Dev. 2018, 39, 33–37. [Google Scholar] [CrossRef]
- Ma, W.; Su, P.; Jia, W.; Liu, F.; Wang, J. Advances in the research on the exposure of Highland Barley natural disasters on the background of climate change. J. Catastr. 2020, 35, 215–221. [Google Scholar] [CrossRef]
- Mariana, B.; Ovidiu, C. Sentinel-2 cropland mapping using pixel-based and object-based timeweighted dynamic time warping analysis. Remote Sens. Environ. 2018, 204, 509–523. [Google Scholar]
- Boschetti, M.; Busetto, L.; Manfron, G.; Laborte, A.; Asilo, S.; Pazhanivelan, S.; Nelson, A. PhenoRice: A method for automatic extraction of spatio-temporal information on rice crops using satellite data time series. Remote Sens. Environ. 2017, 194, 347–365. [Google Scholar] [CrossRef] [Green Version]
- Hui, Y.; Su, R.; Xi, W. Extraction of rape planting distribution information in Jianghan Plain based on MODIS EVI time series data. Remote Sens. Land Resour. 2018, 30, 173–179. [Google Scholar] [CrossRef]
- Qiu, B.; Lu, D.; Tang, Z.; Chen, C.; Zou, F. Automatic and adaptive paddy rice mapping using Landsat images: Case study in Songnen Plain in Northeast China. Sci. Total Environ. 2017, 598, 581–592. [Google Scholar] [CrossRef]
- Zhou, Q.; Yu, Q.; Liu, J.; Wu, W.; Tang, H. Perspective of Chinese GF-1 high-resolution satellite data in agricultural remote sensing monitoring. J. Integr. Agric. 2017, 16, 242–251. [Google Scholar] [CrossRef]
- Tao, J.; Wu, W.; Zhou, Y.; Wang, Y.; Jiang, Y. Mapping winter wheat using phenological feature of peak before winter on the North China Plain based on time-series MODIS data. J. Integr. Agric. 2017, 16, 348–359. [Google Scholar] [CrossRef] [Green Version]
- Chemin, Y.; Phuphak, S.; Asilo, S. Determining spatial and temporal patterns of submergence in rice with MODIS satellite data. Int. J. Geoinform. 2012, 8, 1–12. [Google Scholar]
- Liu, W.; Zeng, Y.; Zhang, M. Mapping rice paddy distribution by using time series HJ blend data and phenological parameters. J. Remote Sens. 2018, 22, 381–391. [Google Scholar] [CrossRef]
- Gaetano, M.; Jose, M.P.; Marco, V.; Giuseppe, M. A Comparison of UAV and satellites multispectral imagery in monitoring onion crop. An application in the ‘Cipolla Rossa di Tropea’ (Italy). Remote Sens. 2020, 12, 3424. [Google Scholar]
- Luo, H.; Li, W.; Jing, Y.; Xu, X.; Chen, H. Remote Sensing Extraction of Winter Wheat Planting Area Based on SVM. J. Triticeae Crops 2019, 39, 455–462. [Google Scholar] [CrossRef]
- Liu, W.; Tao, J.; Xu, M.; Chen, R.; Guo, Y. A study of winter rape extraction at sub-pixel fusing multi-source data based on Artificial Neural Networks: A case study of Jianghan and Dongting Lake Plain. J. Nat. Resour. 2019, 34, 1079–1092. [Google Scholar] [CrossRef]
- Tan, S.; Wu, B.; Zhang, X. Mapping paddy rice in the Hainan Province using both Google Earth engine and remote sensing images. J. Geo-Inf. Sci. 2019, 21, 937–947. [Google Scholar] [CrossRef]
- Ji, Z.; Zhang, Y.; Li, Q.; Liu, S.; Li, S.; Ren, H. planting information extraction of winter wheat and rape based on GF-1 images. Remote Sens. Tech. Appl. 2017, 32, 760–765. [Google Scholar] [CrossRef]
- Quan, J.; Wang, Y.; Wang, X.; Tang, W.; Wang, Q. Extraction of Rice Planting Area in Dabie Mountain by Remote Sensing Image: Taking Landsat 8 as an example. Chin. Agric. Sci. Bull. 2019, 35, 104–111. [Google Scholar]
- Jia, W.; Gao, X.; Yang, L.; Shi, F.; He, L. Land cover information extraction for complicated terrain regions via an object-oriented classification method. J. Lanzhou Univ. Nat. Sci. 2018, 54, 486–493. [Google Scholar] [CrossRef]
- Aleem, K.; Lorenzo, C.; Biglia, A.; Davide, R.A.; Marcello, C.; Paolo, G. Comparison of Satellite and UAV-based multispectral imagery for vineyard variability assessment. Remote Sens. 2019, 11, 436. [Google Scholar]
- Shi, P.; Chen, Y.; Zhang, A.; He, Y.; Gao, M.; Yang, J.; Mao, R.; Wu, J.; Ye, T.; Xiao, C. Factors contribution to oxygen concentration in Qinghai-Tibetan Plateau. Chin. Sci. Bull. 2018, 64, 715–724. [Google Scholar] [CrossRef] [Green Version]
- Xu, J.; Gao, Y.; Peng, F.; Wang, X. Change characteristics of precipitation and its cause during 1979–2016 over the Qinghai-Tibetan Plateau. Plateau Meteor. 2020, 39, 234–244. [Google Scholar] [CrossRef]
- Zhao, Y.; Wang, Y.; Xu, X.; Dong, L. Effect of the Asian Water Tower over the Qinghai-Tibet Plateau and the characteristics of atmospheric water circulation. Chin. Sci. Bull. 2019, 64, 2830–2841. [Google Scholar] [CrossRef] [Green Version]
- Wei, H.; Lv, C.; Liu, Y.; Yang, K. Spatial distribution and temporal changes of facility agriculture on the Tibetan Plateau. Resour. Sci. 2019, 41, 1093–1101. [Google Scholar] [CrossRef] [Green Version]
- Zhou, L. Chinese Agricultural Geography; Science Press: Beijing, China, 2007. [Google Scholar]
- Zhang, Y.; Li, B.; Zheng, D. Geographic information system data of the scope and boundary of the Qinghai-Tibet Plateau. Glob. Chang. Data Wareh. 2014. [Google Scholar] [CrossRef]
- Institute of Geographic Sciences and Natural Resources Research, CAS. Earth Observation Data Sharing Plan. Available online: http://eds.ceode.ac.cn/nuds/freedataquery (accessed on 30 September 2020).
- Oreti, L.; Giuliarelli, D.; Tomao, A.; Barbati, A. Object oriented classification for mapping mixed and pure forest stands using very-high resolution imagery. Remote Sens. 2021, 13, 2508. [Google Scholar] [CrossRef]
- Benz, U.C.; Hofmann, P.; Willhauck, G.; Lingenfelder, I.; Heynen, M. Multi-resolution, object-oriented fuzzy analysis of remote sensing data for GIS-ready information. ISPRS J. Photogramm. Remote Sens. 2004, 58, 239–258. [Google Scholar] [CrossRef]
- Ma, W. Characteristics of Extreme Precipitation in Qinghai-Tibet Plateau and Estimation of Critical Rainfall for Flood Disasters. Master’s Thesis, Qinghai Normal University, Xining, China, 2019. [Google Scholar]
- Chavez, P.S.; Berlin, G.L.; Sowers, L.B. Statistical-method for selecting Landsat MSS Ratios. J. Appl. Photogr. Eng. 1982, 8, 23–30. [Google Scholar]
- Regulations on Converting Farmland to Forests; State Council of the People’s Republic of China: Beijing, China, 2002.
- Jia, W.; Wang, J.; Shi, P.; Ma, W. The progress and prospect of remote sensing monitoring of rocky desert dynamic changes in the ice and snow melting area of the Qinghai-Tibet Plateau. J. Geo-Inf. Sci. 2021. [Google Scholar] [CrossRef]
- Zhang, C.; Tong, L.; Liu, Z.; Qiao, M. Identification method of seed maize plot based on multi-temporal GF-1 WFV and Kompsat-3 Texture. J. Agric. Mach. 2019, 50, 163–168. [Google Scholar] [CrossRef]
- Zhang, H.; Tian, T.; Zhang, Q.; Lu, Z. Study on Extraction of Paddy Rice planting area in low fragmented regions based on GF-1 WFV images. Remote Sens. Technol. Appl. 2019, 34, 785–792. [Google Scholar] [CrossRef]


| Band | Wavelength Range | Spatial Resolution | General Purpose |
|---|---|---|---|
| 1-COASTAL/AEROSOL | 0.43–0.45 μm | 30 m | Coastal environmental monitoring |
| 2-Blue | 0.45–0.51 μm | 30 m | Visible light three-band True color is used for feature recognition |
| 3-Green | 0.53–0.59 μm | 30 m | |
| 4-Red | 0.64–0.67 μm | 30 m | |
| 5-NIR | 0.85–0.88 μm | 30 m | Vegetation information extraction |
| 6-SWIR1 | 1.57–1.65 μm | 30 m | Vegetation drought monitoring Fire monitoring Mineral information extraction |
| 7-SWIR2 | 2.11–2.29 μm | 30 m | |
| 8-PAN | 0.50–0.68 μm | 15 m | Feature recognition Data fusion |
| 9-Cirrus | 1.36–1.38 μm | 30 m | Cirrus detection Data quality evaluation |
| Data Name | Temporal Resolution | Spatial Resolution | Data Source |
|---|---|---|---|
| Landsat 8 OLI images | 2019 | 30 m × 30 m | Institute of Geographic Sciences and Natural Resources Research, CAS http://ids.ceode.ac.cn (accessed on 30 September 2020) [33] |
| Digital elevation model | 2010 | 30 m × 30 m | United States Geological Survey https://topotools.cr.usgs.gov (accessed on 15 March 2020) |
| Multi-year average precipitation | 1961–2019 | - | China Meteorological Data Network http://data.cma.cn (accessed on 1 January 2020) |
| Map of China | 2019 | - | Ministry of Natural Resources of the People’s Republic of China http://bzdt.ch.mnr.gov.cn (accessed on 25 August 2021) |
| Qinghai–Tibet Plateau range and boundary line | 2014 | - | Global Change Research Data Publishing & Repository http://www.geodoi.ac.cn (accessed on 1 January 2020) |
| Type | Producer’s Accuracy (Pixels) | User’s Accuracy (Pixels) | Producer’s Accuracy (%) | User’s Accuracy (%) | Overall Accuracy (%) | Kappa Coefficient |
|---|---|---|---|---|---|---|
| Highland barley | 99/109 | 99/107 | 90.83 | 92.52 | 91.74 | 0.83 |
| Other crops | 101/109 | 101/111 | 92.66 | 90.99 |
| Agricultural Divisions | CGEQ/HFD | ST/FPD | ST/FFD | QT/APD | IMGN/FPD | |
|---|---|---|---|---|---|---|
| Proportion of Highland barley planting areas | 31.09% | 28.91% | 23.23% | 11.86% | 4.91% | |
| Proportion of Highland barley planting areas in different elevation ranges | <2000 m | 0.29% | 0.00% | 1.72% | 0.08% | 2.20% |
| 2000 to 2500 m | 2.24% | 0.00% | 6.82% | 0.73% | 37.33% | |
| 2500 to 3000 m | 32.05% | 0.14% | 14.42% | 3.86% | 52.84% | |
| 3000 to 3500 m | 65.40% | 0.46% | 20.29% | 22.19% | 7.62% | |
| 3500 to 4000 m | 0.02% | 46.51% | 32.99% | 45.74% | 0.00% | |
| 4000 to 4500 m | 0.00% | 50.68% | 23.45% | 27.13% | 0.00% | |
| 4500 to 5000 m | 0.00% | 2.16% | 0.32% | 0.27% | 0.00% | |
| ≥5000 m | 0.00% | 0.05% | 0.00% | 0.00% | 0.00% | |
| Proportion of Highland barley planting area in different slope ranges | <5° | 87.97% | 76.28% | 18.24% | 40.14% | 66.06% |
| 5 to 10° | 6.69% | 14.53% | 19.70% | 18.94% | 21.95% | |
| 10 to 15° | 2.38% | 5.21% | 16.19% | 13.44% | 8.10% | |
| 15 to 20° | 1.08% | 2.08% | 13.35% | 9.66% | 1.99% | |
| ≥20° | 1.87% | 1.91% | 32.53% | 17.82% | 1.90% | |
Publisher’s Note: MDPI stays neutral with regard to jurisdictional claims in published maps and institutional affiliations. |
© 2021 by the authors. Licensee MDPI, Basel, Switzerland. This article is an open access article distributed under the terms and conditions of the Creative Commons Attribution (CC BY) license (https://creativecommons.org/licenses/by/4.0/).
Share and Cite
Ma, W.; Jia, W.; Su, P.; Feng, X.; Liu, F.; Wang, J. Mapping Highland Barley on the Qinghai–Tibet Combing Landsat OLI Data and Object-Oriented Classification Method. Land 2021, 10, 1022. https://doi.org/10.3390/land10101022
Ma W, Jia W, Su P, Feng X, Liu F, Wang J. Mapping Highland Barley on the Qinghai–Tibet Combing Landsat OLI Data and Object-Oriented Classification Method. Land. 2021; 10(10):1022. https://doi.org/10.3390/land10101022
Chicago/Turabian StyleMa, Weidong, Wei Jia, Peng Su, Xingyun Feng, Fenggui Liu, and Jing’ai Wang. 2021. "Mapping Highland Barley on the Qinghai–Tibet Combing Landsat OLI Data and Object-Oriented Classification Method" Land 10, no. 10: 1022. https://doi.org/10.3390/land10101022
APA StyleMa, W., Jia, W., Su, P., Feng, X., Liu, F., & Wang, J. (2021). Mapping Highland Barley on the Qinghai–Tibet Combing Landsat OLI Data and Object-Oriented Classification Method. Land, 10(10), 1022. https://doi.org/10.3390/land10101022