Article

At the Crossroads of European Landscape Changes: Major Processes of Landscape Change in Czechia since the Middle of the 19th Century and Their Driving Forces

1
Department of Applied Geoinformatics and Cartography, Charles University, Prague, Albertov 6, 128 43 Prague, Czech Republic
2
Department of Social Geography and Regional Development, Charles University, Prague, Albertov 6, 128 43 Prague, Czech Republic
*
Author to whom correspondence should be addressed.
Land 2021, 10(1), 34; https://doi.org/10.3390/land10010034
Submission received: 20 November 2020 / Revised: 28 December 2020 / Accepted: 29 December 2020 / Published: 2 January 2021
(This article belongs to the Special Issue Land Use Transitions)

Abstract

:
Changes in the cultural landscape provide essential evidence about the manner and intensity of the interactions between humans and nature. Czechia has a specific location in Central Europe. It is positioned at the crossroads of European landscape changes. These changes can be documented based on a unique database that shows the development of land use since the middle of the 19th century. In this study, we aimed to address the major processes of landscape change that occurred during four periods over the past 165 years, at the cadastral level on the territory of present-day Czechia. Further we identify and discuss proximate and underlying driving forces of the landscape changes. We used land use data from the year 1845, 1896, 1948, 1990, and 2010 that correspond to key events in Czech history. The major processes and intensity of landscape change were evaluated based on calculations of increases and decreases in land use classes between the first and last year of each examined period. The period 1845–1896 was the only period in which arable land increased, and the most recent period, 1990–2010, was the only period during which a grassing over process was recorded. Afforestation was recorded in all periods. The communist period was characterized by unified changes—urbanization, afforestation, arable land decrease, and landscape devastation. The post-communist period was, in some respects, beneficial to the landscape (e.g., grassing over and afforestation, particularly in mountain areas), but it also led to negative processes, such as strong urbanization and land abandonment. Such changes lead to landscape polarization. The landscape changes in Czechia during the period 1845–2010 reflect many important historical events in Europe. In our analysis, we demonstrate the essential impact of underlying drivers and also identify driving forces specific to the development of the Czech territory.

1. Introduction

Long-term landscape changes at national, regional, or local scales reflect different phases of natural, political, economic, social, technological, and cultural development in the broader international context [1,2,3,4,5,6,7,8,9,10]. Czechia, a country located in Central Europe, represents a unique model area in which the impacts of societal driving forces on land use and landscape change can be studied over a long period of time.
A number of scientific studies have dealt with changing patterns of landscape utilization and its driving forces. Some of these examine long periods of time, usually at local or regional levels, but do not study changes at the national level [10,11,12,13,14,15,16] or deal only with selected land use transformations (for example, of forests and agricultural land [8]). On the contrary, studies concerning all kinds of land use alteration usually analyze only short periods of time because data availability does not allow greater analysis. Remote sensing data [17,18,19,20,21,22] or datasets derived from remote sensing imagery, such as CORINE or the GlobCover dataset [23,24,25,26,27] that have low spatial resolution, are often used to study extensive areas.
The analysis presented in this article shows the changing patterns of land use (eight classes) for the whole national territory based on a long-term historical dataset (since 1845). This is possible due to the existence of reliable data from Land Registry (LULC Czechia Database—https://www.lucccz.cz/databaze). The years for which land use data are available (1845, 1896, 1948, 1990, and 2010) correspond to key events in modern Czech history, which were often milestones that triggered social changes that were later reflected by landscape changes. This allows the observation of relationships between landscape changes and driving forces over a period of 165 years.
The importance of landscape research in relation to a broad array of driving forces has been demonstrated by a number of publications that focus on causes, contexts, and links [4,8,10,28,29,30,31,32,33,34,35,36,37] rather than just on description. Some studies dealing with the drivers [9,38,39,40] distinguish, in accordance with [41], between two basic types of “driving forces” (for an overview and discussion of terminology, refer to [40]). Proximate causes/drivers are usually defined as human activities or immediate actions at the local level with a direct impact on land use change (such as agricultural expansion that directly impacts forest cover); underlying driving forces/indirect causes are fundamental social processes (such as human population dynamics or agricultural policies) that usually have an indirect but often crucial impact at the national, regional, or global levels, and influence/cause the proximate drivers [33,39,40]. Lambin and Geist [6] also sorted driving forces according to time. In addition to long-term (biophysical and socioeconomic) factors that have gradual effects (climate, topography, biota, economic conditions, political system), some factors function as “trigger” events (droughts, tropical cyclones, wars, and economic crises). The classification of driving forces in the land use/land cover community has yet to be unified, publications dealing with driving forces use different—usually unsystematic—structuring of driving forces.
However, some recent publications have made valuable contributions toward improving the clarity in terminology [40], evaluating land use intensity [42] or for the classification of driving forces [9,39,40]. In a systematic review of the driving forces of landscape change in Europe [9], the authors updated the classification scheme of driving forces introduced by Geist and Lambin [41] and addressed six types of proximate and five types of underlying driving forces. They found that most studies consider a medium-term time scale and local spatial scales, and that long-term studies that extend beyond the mapping of land cover change are rare [9].
The main aim of our study is to evaluate the major processes of landscape change at the national level of Czechia over a long period of time (1845–2010). This period is subdivided into four shorter periods (1845–1896, 1896–1948, 1948–1990, and 1990–2010). For each of these shorter periods, we aim to address the major processes of landscape change, identify their driving forces, and sort the driving forces according to the classification scheme used by [9] which was partially adopted under our conditions. Driving forces are summarized in schematic diagrams and discussed in relation to landscape changes (their types, intensity, and regional distribution). We hypothesize that major landscape changes occurred in the period 1948–1990 under the influence of communist regime. We want to answer mainly the questions: (1) How landscape changes differ in individual periods; (2) What socio-economic driving forces contributed the most to landscape changes in the observed periods; (3) In which period the arable land decreased the most; (4) What specifics of landscape changes occurred in the last period 1990–2010.

2. Data and Methods

2.1. Data

Data from the spatial (Geographical Information System—GIS) Database of Long-Term Land Use Changes in Czechia (LUCC Czechia Database—https://www.lucccz.cz/databaze) were used for the evaluation of long-term landscape changes and processes. This unique data source, created at the Faculty of Science, Charles University Prague, contains land registry records (provided by archives and by the Czech Office for Surveying, Mapping and Cadastre) at the cadastral level. The data were originally based on the parcel level (cadastral maps), but they were provided and used in the analyses for the whole cadastre as one number, i.e., the total area for each land use category. Our database stores land use data for the years 1845, 1896, 1948, 1990, 2000, and 2010 for the whole territory of Czechia. While the years of analysis are based on data availability, they also represent, in most cases, historical milestones in Czech and European history. Data for 1845 originate from the “Franciscan Cadastre”, also known as the Stable Cadastre. These data document land use and the landscape characteristics in the middle of the 19th century. This unique data source is available only for the countries located in the territory of the former Austro–Hungarian Empire. Data for 1896 and 1948 were taken from the datasets of later cadastral mappings (stored in archives), and data for 1990, 2000, and 2010 were provided in a database of the Czech Office for Surveying, Mapping, and Cadastre (for a detailed explanation of the data origins, see [43]). The data were provided for administrative cadastral units. To ensure a consistent area of the analyzed units during the whole period of interest (from 1845 until 2010), cadastral units were amalgamated into so-called stable territorial units (STUs) using a geographical information system (GIS). The year 1990 was chosen as a reference, and the maximal size fluctuation among different years was set at 2%. At present, approximately 13,000 cadastral units exist in the national territory and these were amalgamated into 8,832 STUs for research purposes. In some cases, one STU consists of two or more amalgamated cadastral units, usually in areas where changes of administrative boundaries have occurred. Almost 80% of STUs, however, consist of just one cadastral unit. The STU is the minimal mapping unit for analysis. STUs range in size from 24 ha to 8,000 ha (with the exception of several military areas with sizes ranging from 20,000 to 45,000 ha). The average STU area is 800 ha [43].
The LUCC Czechia Database includes data on eight land use classes: arable land, permanent cultures, meadows, pastures, forest areas, built-up areas, water areas, and remaining areas (total areas of the classes in each STU for each year are stored). Agricultural land equates to the combination of arable land, permanent cultures, meadows, and pastures; permanent grassland equates to meadows and pastures; other areas equate to the combination of built-up areas, water areas, and remaining areas. Numerical data (areas of land use classes) for all time horizons come from the cadastral records (databases) and were calculated by cadastral authorities based on cadastral maps. We used numerical data for our analysis provided by these cadastral authorities (Central Land Survey and Cadaster Archive files and Czech Office for Surveying, Mapping, and Cadastre), not the original cadastral maps. Sources of the data, types, and scales of the maps used for the calculation of land use classes areas are summarized in Table 1. At present, land registry records are updated by land owners, who should provide details of all changes in land use to the Czech Office for Surveying, Mapping and Cadastre. In reality, however, many owners do not update these records.

2.2. Methods

2.2.1. Landscape Change Analysis

The analysis of landscape changes was undertaken using the LUCC Czechia database described above. The LUCC Czechia Database is connected to the polygon GIS layer of STUs. STUs ensure time consistency of the database and comparability of the records from individual years. Based on land use data in the database, three complementary parameters were calculated/derived for STUs and visualized in maps (cartograms) to undertake the analysis and evaluate the changes. The parameters were (1) major processes of landscape change, (2) class of highest decrease, and (3) intensity of overall change based on calculation of the index of change. These processes and intensity of landscape change are further discussed in the context of the various types of potential driving forces in the particular periods (see Section 3.1, Section 3.2, Section 3.3, Section 3.4 and Section 3.5).
(1) Major processes of landscape change
This parameter evaluates the major processes of landscape change [44] in particular time periods (in our case, 1845–1896, 1896–1948, 1948–1990, 1990–2010). This method works with four types of major processes based on the territorial increase in four land use classes (partly aggregated): (1) intensification—increase in arable land (crop cultivation) and permanent cultures; (2) grassing over—increase in permanent grasslands; (3) afforestation—increase in forest areas; and (4) urbanization—increase in built-up and remaining areas. First, the change during the examined period was calculated (as the difference in area in the second and first year) for each category to find out if the category increased or decreased. Next, only increases were taken into consideration. STUs were sorted into the abovementioned categories for major processes of landscape change according to the land use class that showed the highest increase.
Each of the abovementioned types can be further sorted into subtypes according to the grade of the increase. Three grades of changes were distinguished: high change (the “prevailing” change accounts for more than 75% of all changes combined), moderate change (50%–75%), and low change (less than 50%). STUs in which land use changes were recorded in less than 1% of the total territory were not examined [43].
(2) Class of highest decrease
The class that showed the highest decrease in the particular period was determined for each STU and visualized in the map as information in addition to the abovementioned typology of major processes of landscape change that is based on increases according to land use classes.
(3) Index of change
The index of change indicates the intensity of landscape changes over a certain period of time in the area of interest (STUs in our case) [43]:
I C A B = 100 i = 1 n | P i B P i A | 2
where ICA–B—index of change between year A and year B; n—number of land use classes; PiA—share of relevant land use class on total area of STU at the beginning of the examined period; PiB—the same share at the end of the examined period.
The index ranges from 0 to 100 and indicates the proportion of area where any change occurred. This is based on the data reflecting the land use at the beginning and end of the examined period (changes that may have occurred during the examined period are not taken into consideration). The higher the index of change, the more intensive the landscape changes in the area when comparing the first and last year of the period. Similar index for landscape change evaluation (landscape change index) was used for example in [45] and [46].

2.2.2. Determination of Driving Forces

Because of the lack of empirical data, the proximate and underlying driving forces for particular periods were determined using methods of qualitative analysis. Specifically, expert assessment was carried out by scientists in our team who are specialists in social science and history, and have long-term experience with the evaluation of land use/land cover changes and their driving forces in Czechia from many case studies at different spatial levels. This approach has been commonly used by other authors [8,9] and can provide valuable information in cases in which appropriate empirical data for statistical analysis are not available. In their review, Plieninger et al. found that 55% of 125 analyzed publications dealing with the driving forces of landscape change in Europe relied on the personal (i.e., expert) interpretation of driving forces [9].
The main driving forces for each period are summarized in Figure A1, Figure A2, Figure A3 and Figure A4 according to the scheme used in [9]. This scheme was adopted for the conditions of the Czech territory. Six types of proximate and five types of underlying driving forces were generally identified and specified for each time period. In addition, new landscape functions based on land use changes are noted for each period. It is also important to evaluate changes in the context of natural conditions. For this purpose, we provide a physical map of Czechia here (Figure 1) and we refer to this map in the chapter 3.

3. Results and Discussion

In the subsections, we provide the results of the evaluation of major processes and the intensity of landscape change determined between the first and last years of the particular period. The results are discussed in the context of historical events and driving forces estimated based on expert assessment. A detailed overview of estimated proximate and underlying drivers, summary of main land use changes, and lists of new functions for all periods (1845–1896, 1896–1948, 1948–1990, and 1990–2010) is presented in the diagrams in Figure A1, Figure A2, Figure A3 and Figure A4.

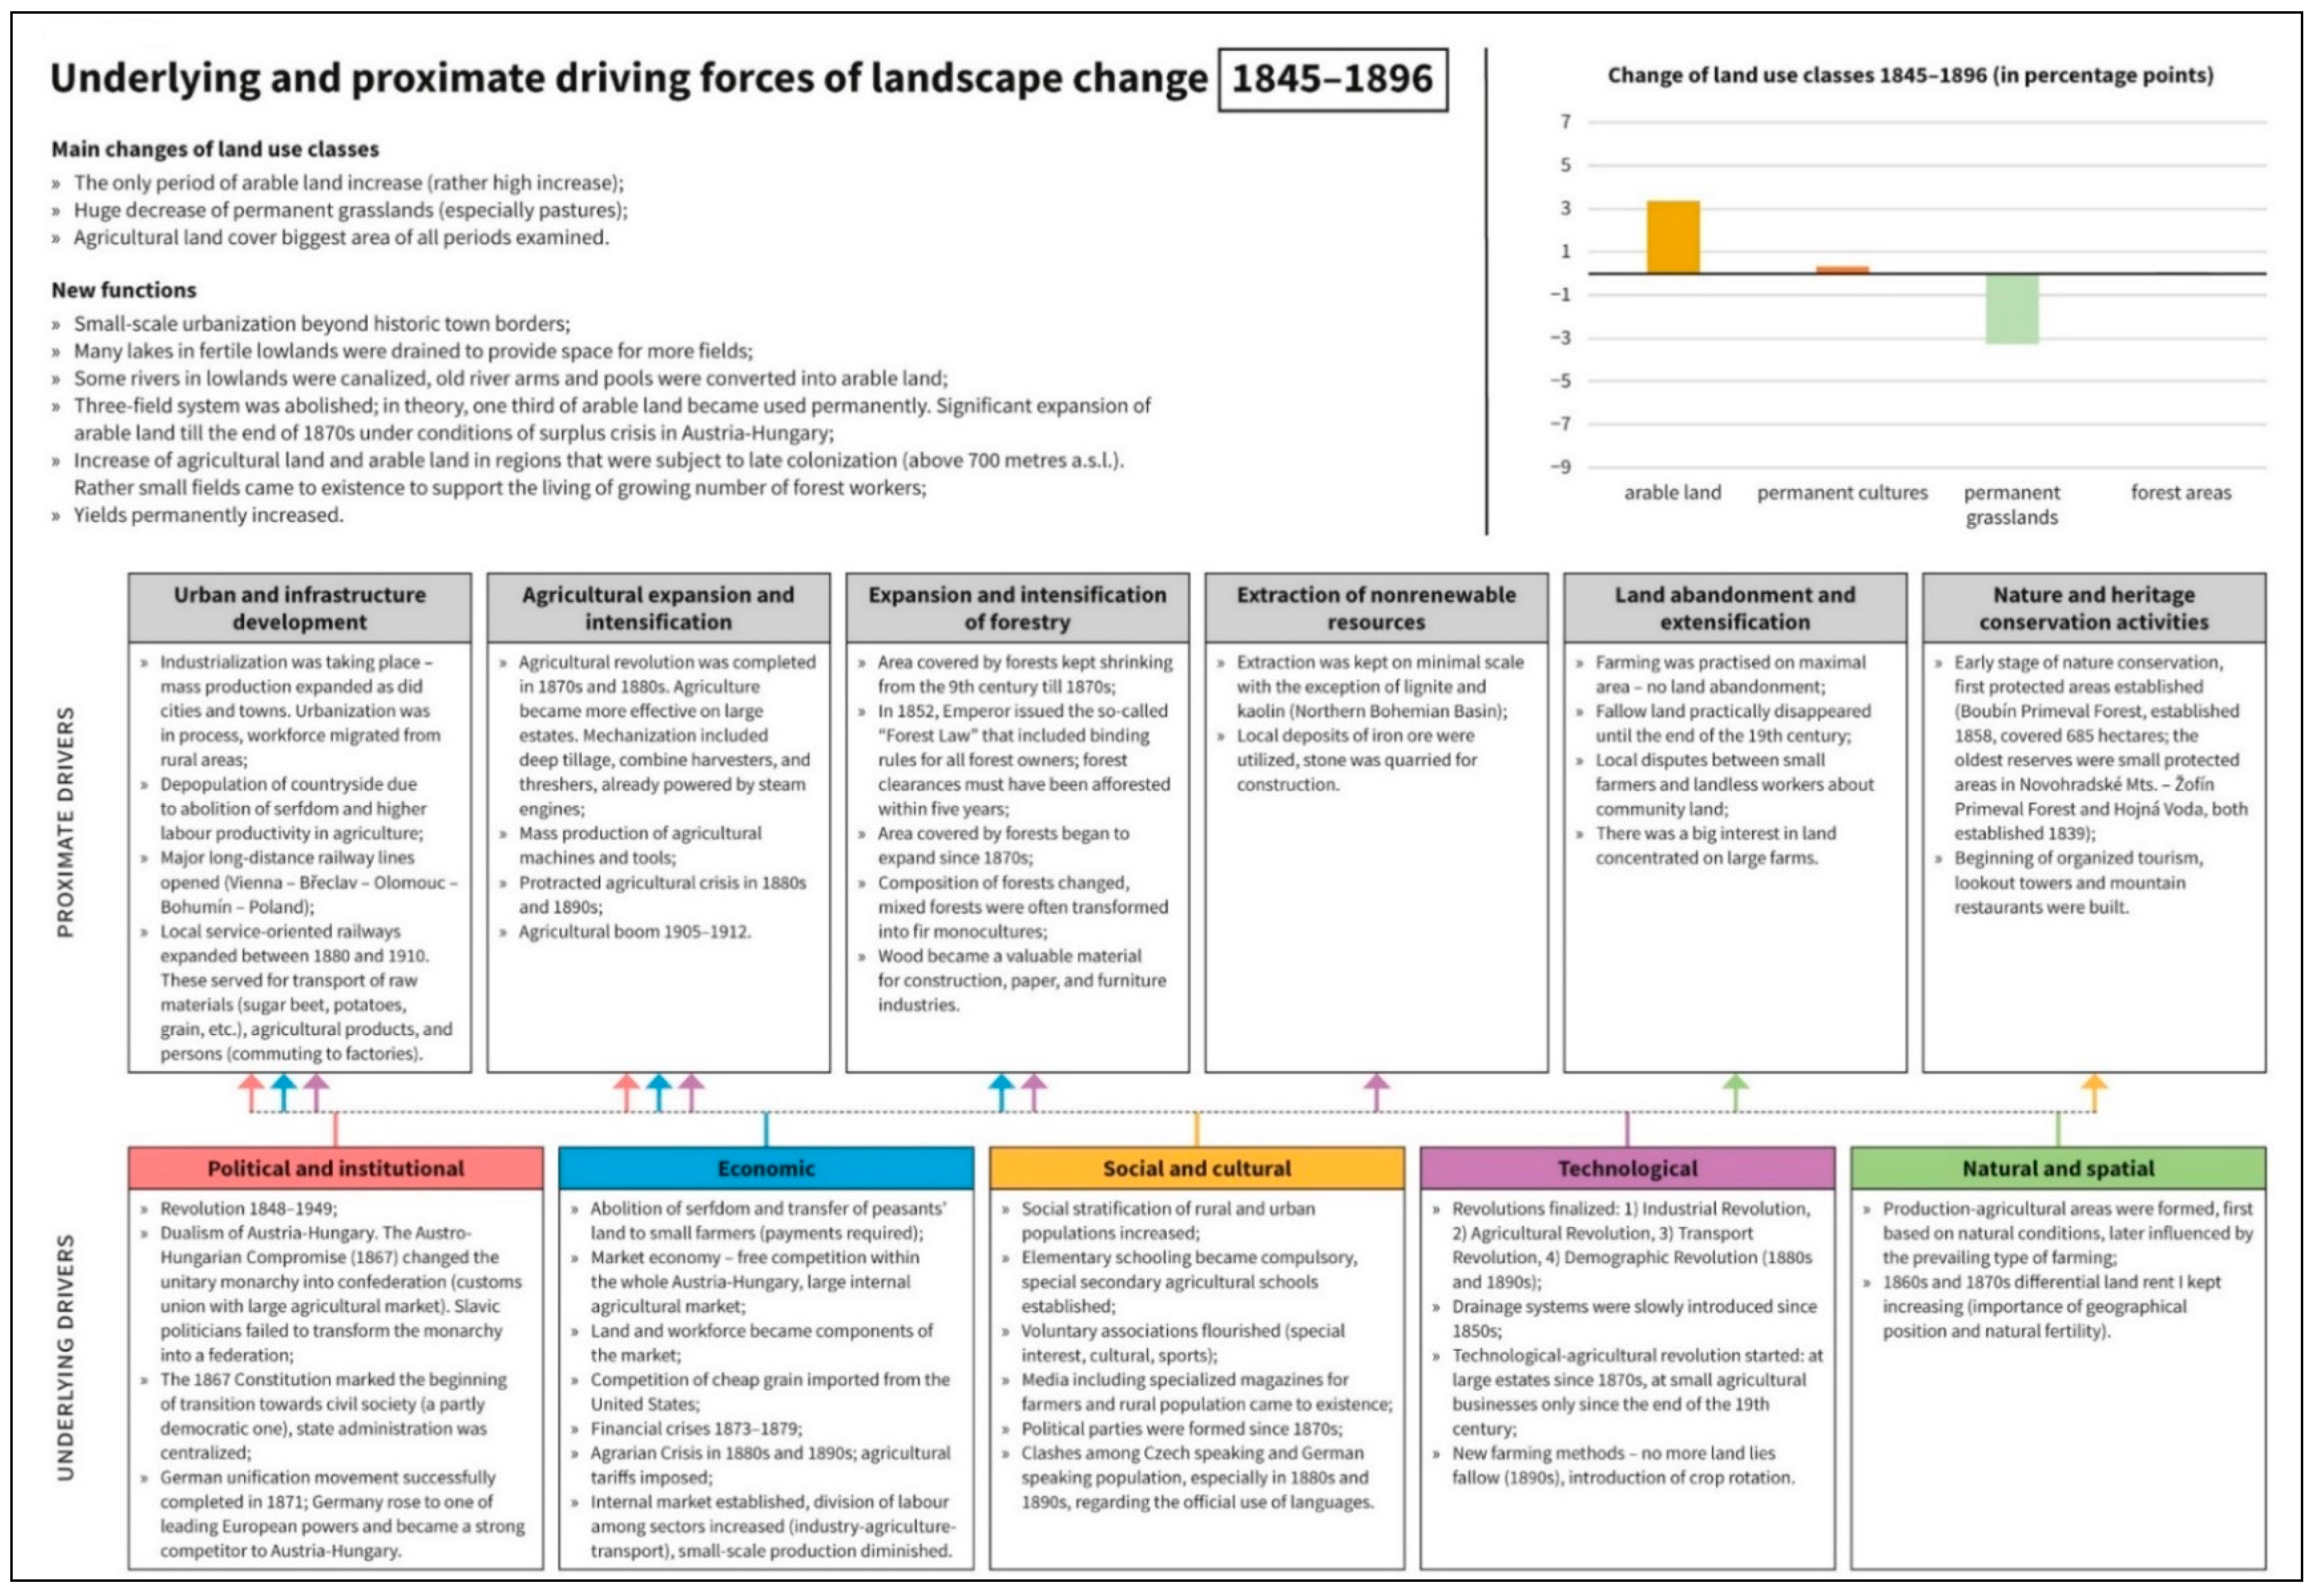
3.1. Driving Forces, Major Processes, and Intensity of Landscape Change in the Period 1845–1896

The first period of the long-term land use change research (1845–1896) was influenced, from the outset, by the revolutionary movement of 1848 that resulted in the abolition of serfdom, which was the key moment leading to social modernization. People could freely move from the countryside to cities and towns, where labor was needed in newly established factories. To secure food supplies, it was important to increase agricultural productivity and create a functional transportation network. These factors constitute the crucial driving forces in the second half of the 19th century (for an overview of proximate and underlying drivers during 1845–1896, see Figure A1), and also led to the agricultural and transportation revolution as part of the complex revolution of the modern era [47,48,49,50,51].
The railway network was practically completed during the final two decades of the 19th century. Regional (local) railway lines were purpose-built: raw material needed for the food processing industry (sugar beet, potatoes, and grain) was transported on trains. Railways also served fast-growing cities and provided a vital transport link for commuters who regularly travelled to cities and towns. This was the first phase of urbanization, during which all towns grew rapidly.
Austria–Hungary collapsed at the end of World War I, and the whole of Central Europe was completely restructured. The agricultural revolution was completed in the period 1870–1880. More effective farming was gradually developed. However, arable land continued to expand in the period 1845–1896 until the beginning of World War I. This was the most important land use change between 1845 and 1896 in STUs that covered 70.5% of the national territory (Figure 2a and Table 2). More effective farming processes first appeared in big farms with sufficient funds that could make use of more advanced methods and tools (fertilizers, cultivars, and basic mechanization). As a result, yields rose, and modern techniques were gradually also adopted by smaller agricultural enterprises, particularly in the fertile plains (Polabská nížina, Central Moravia—Prostějov; see Figure 1).
Thus, the direct influence of natural conditions on landscape changes gradually decreased; on the contrary, technological, economic, and social factors became more important. Regarding the value of soil (seen as a natural resource), the economic aspect was crucial in fertile areas, whereas in the less-favored regions, environmental aspects prevailed.
Between the years 1845 and 1896, the total intensity of landscape changes (see Figure 2c) was high in the fertile plains (Polabská nížina, plains in Southern Moravia; Figure 1) where arable land expanded (as shown by the index of change, changes were recorded in about 10%, and in some places more than 20%, of the cadastral territory). However, the increase in arable land differed by region (while in fertile plains of Polabská nížina and Central Moravia the increase reached more than 5%, in the mountains the share of arable land did not increase). As cattle moved into stables, it became necessary to secure forage for animals that was produced on fields (cereals, potatoes, green beans, and green rests). Permanent grasslands, particularly pastures, shrank significantly (decreasing by 3.3 percentage points; see Figure 2b and Figure 6). The area covered by agricultural land peaked in the 1870s, at almost 70%, which was the largest share for the whole considered period 1845–2010.
The three-field system no longer existed and was replaced by more advanced crop rotation supported by manure, then by sodium nitrate and, from the turn of the 20th century, also by fertilizers. As fallow land practically disappeared, arable land increased by up to 30% in some areas and influenced the surplus crisis. An enduring agrarian crisis appeared in the period 1880–1890. In Austria–Hungary, the competition from cheap cereal imports from the United States was largely reduced by the introduction of tariffs levied on imported products.
The decrease in forest cover was a permanent phenomenon of landscape change in the territory of the present-day Czechia from the early plantation period (9th century) until the 1870s. The Emperor’s decree of 1852 (the so-called “Forest Law”) introduced binding forest management rules that were mandatory for all owners, including nobility. The most important rule stipulated that all areas that were cleared must be reforested within five years. Any change of forest land into another type of land use must also have been approved in advance. As a result, forests started to expand from the 1870s as big landowners introduced afforestation schemes in less fertile areas (nobility owned approximately 50% of the forests at the end of the 19th century). The “Forest Law” can be distinguished as a triggering factor for forest transition (the process introduced by [3]) in Czechia.
Land registry data show (see Figure 2a and Table 2) that afforestation constituted the most important landscape change in many areas of Bohemia and Moravia until 1896 (in STUs that covered 19.3% of the national territory). Forest plantations, however, contributed to the changing composition of forests because fast-growing species, particularly Norway Spruce, were preferred. Thus, desirable stable mixed forests became less frequent. Wood became a valuable material in the construction, furniture, and paper industries.

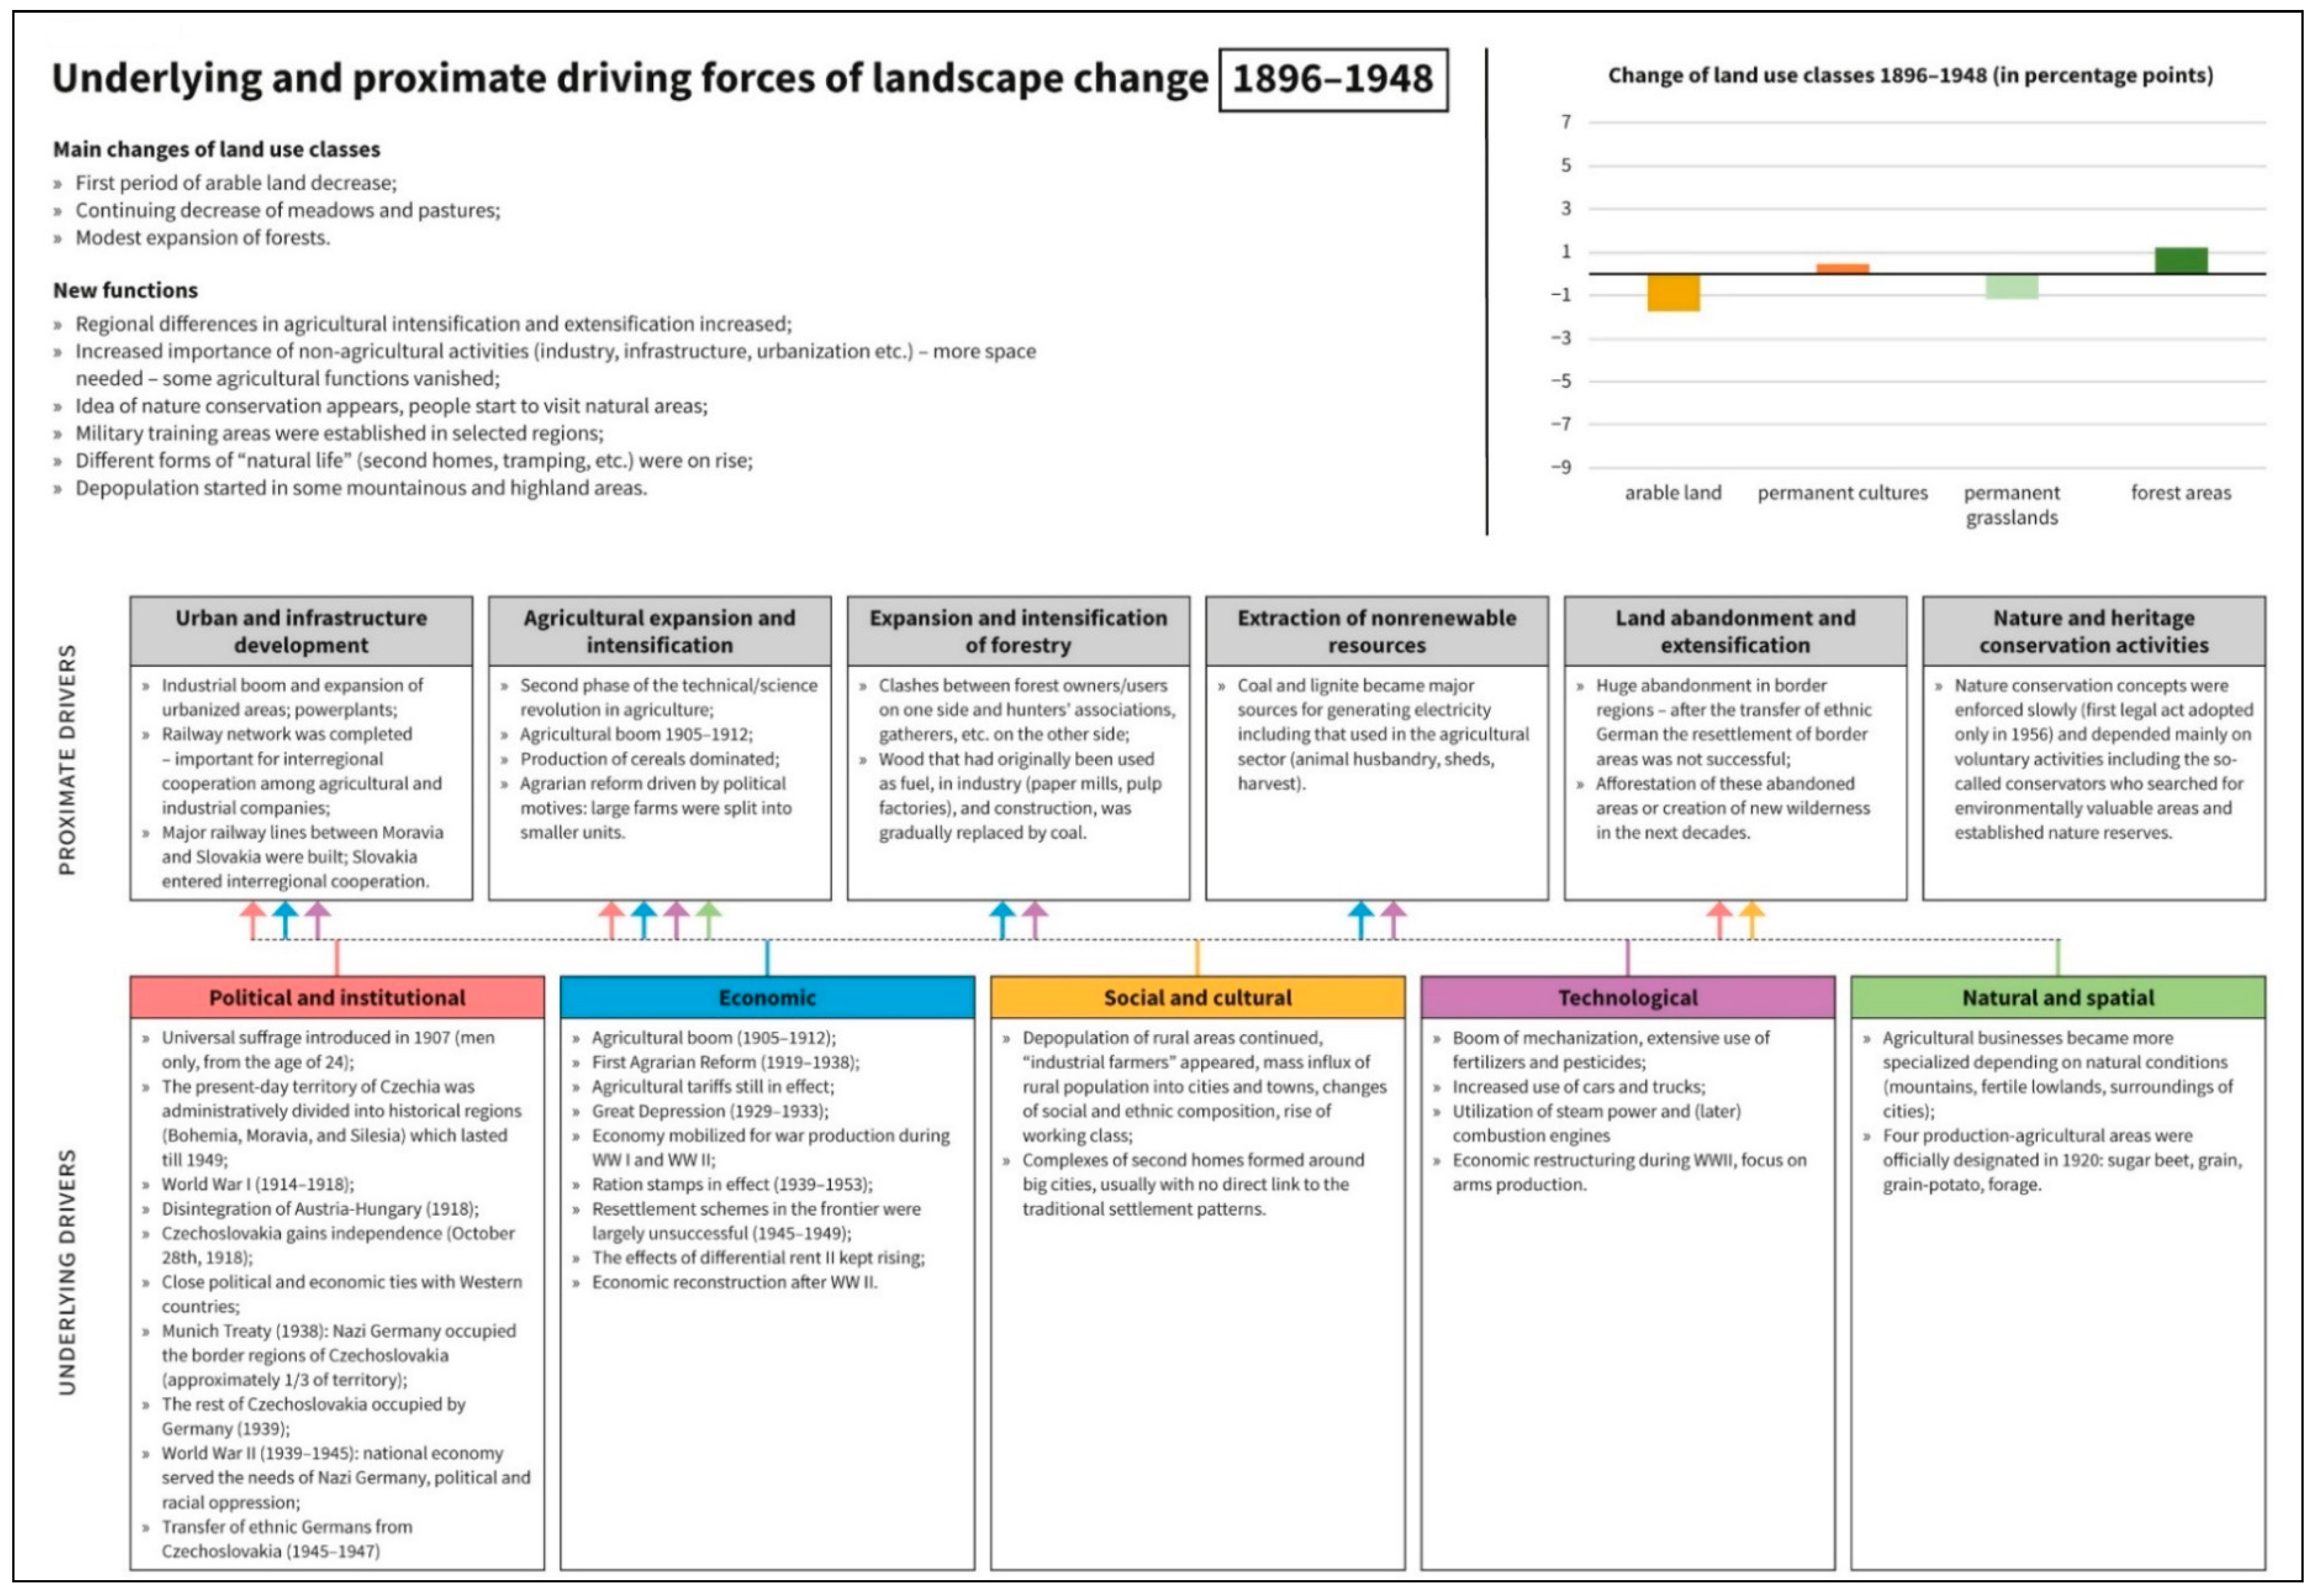
3.2. Driving Forces, Major Processes, and Intensity of Landscape Change in the Period 1896–1948

Political, social, and economic conditions changed fundamentally during the period 1896–1948. This was the period when the territory of present-day Czechia (and the whole of Central Europe) experienced rapid transitions.
Contradictory landscape changes and driving forces of both the proximate and underlying levels can be identified; see Figure A2. Austria–Hungary consolidated after the 1867 Constitution, but other mainly Slavonic “confederation” member nations had much less influence on its administration. After the defeat in World War I, the monarchy disintegrated into new multinational Slavonic states (Czechoslovakia, Hungary, Austria, Yugoslavia).
From the perspective of landscape change, the period before World War I was crucial. Major technological improvements enabled the economic boom at the turn of the 20th century. Thus, the traditional society, which for centuries had been confined to a limited space, was transformed into a modern society with increased mobility and more intensive contacts among producers and consumers (new power plants and power lines, more advanced machines, cars, railway lines, agricultural mechanization, etc.).
World War I had a fundamental impact on the whole of Central Europe and its geopolitical position. These political changes resulted in major economic and social problems. In many cases, economic ties were discontinued—Bohemia and Moravia, formerly the major industrial regions of Austria–Hungary, lost many important markets.
Political and economic turmoil supported aggressive tendencies in Germany. After the Nazis came to power in 1933, Germany started to build an army and made a failed attempt to occupy and govern the whole of Eastern Europe. This attempt came to an end in 1945, when Germany was finally defeated, and the former German territory was occupied according to the agreements made by the victorious Allies. Central and Southeast European states (mostly Slavonic) were (according to the Allies’ agreement at the Yalta Conference in 1945) included in the territory administered by the Soviet Union. The Soviets implemented a different style of political and economic cooperation, and the so-called “socialist” bloc was created. While these changes in the political climate should be viewed from a European perspective (proximate drivers), local driving forces (proximate and underlying) can be analyzed for the territory of present-day Czechia.
The period of 1918–1936 was strongly influenced by the Agrarian party, the strongest political entity. Agrarians enforced land reform. Property belonging to the Hapsburgs, German nobility, and a small part of the property of the Catholic church was confiscated (40,202 km2 in total) and limited the maximum acreage of farms. This was a fundamental change regarding ownership and landscape utilization and structure. Around 60,000 landless rural people became new landowners, farming small plots of land. For a limited period of time after 1920, small farmers expanded the total area covered by arable land to earn a living. The land reform, however, was not enforced in full, and some of the confiscated land was returned to the original owners after the German occupation of Czechia in 1939–1945. Approximately 500,000 of farms were affected by the Great Depression (1929–1933), of which about 20% were forced into bankruptcy. Many manufacturing businesses also closed down [52].
The events of World War II had a significant influence on the period of 1938–1948 and the post-war period. Rations were introduced and remained in effect until 1953; this system limited consumption but supported corruption and the black market. In 1948, Nazism was replaced by Communism.
An initial analysis suggests there were no major differences in land use between 1896 and 1948. According to our dataset, the total area covered by arable land decreased by only 1.7 percentage points during this period—in 1948, arable land still covered 49.9% of the national territory. Meadows and pastures also shrank slightly (by 1.7 percentage points). On the contrary, permanent cultures rose (+0.4 p.p.), as did forests (+1.25 p.p.; in 1948 forests covered 30.2% of the territory) and built-up and remaining areas. As Figure 3a and Table 2 show, various types of landscape change took place between 1896 and 1948. Afforestation constituted the major process of landscape change (the most common change in STUs covering 39% of the national territory; see Figure 3a), followed by urbanization (in STUs covering 32% of the national territory). Figure 3b shows that arable land, meadows, and pastures were the land use classes most likely to shrink. However, changes varied by region—in some fertile areas of Poohří and Polabí and in Southern Moravia (see Figure 1), slight increases of arable land were even recorded. A major expansion of forests can be seen in the southern half of Czechia and in areas adjacent to the Slovak border (Šumava and foothills, Bohemian–Moravian Highlands and, to a certain extent, Krkonoše; see Figure 1).
Figure 3c summarizes the intensity of landscape change. In Prague, Pilsen, Southern Moravia, areas adjacent to the Slovakian border, Liberec, and Jablonec (geographical locations shown in Figure 2), there were changes recorded for more than 10% of the territory; these were areas with the highest intensity of change. By contrast, the peripheral border regions of NW and SW Bohemia, South-Central Bohemia, and the Jeseníky Mountains experienced only modest changes (Figure 1 and Figure 3c).

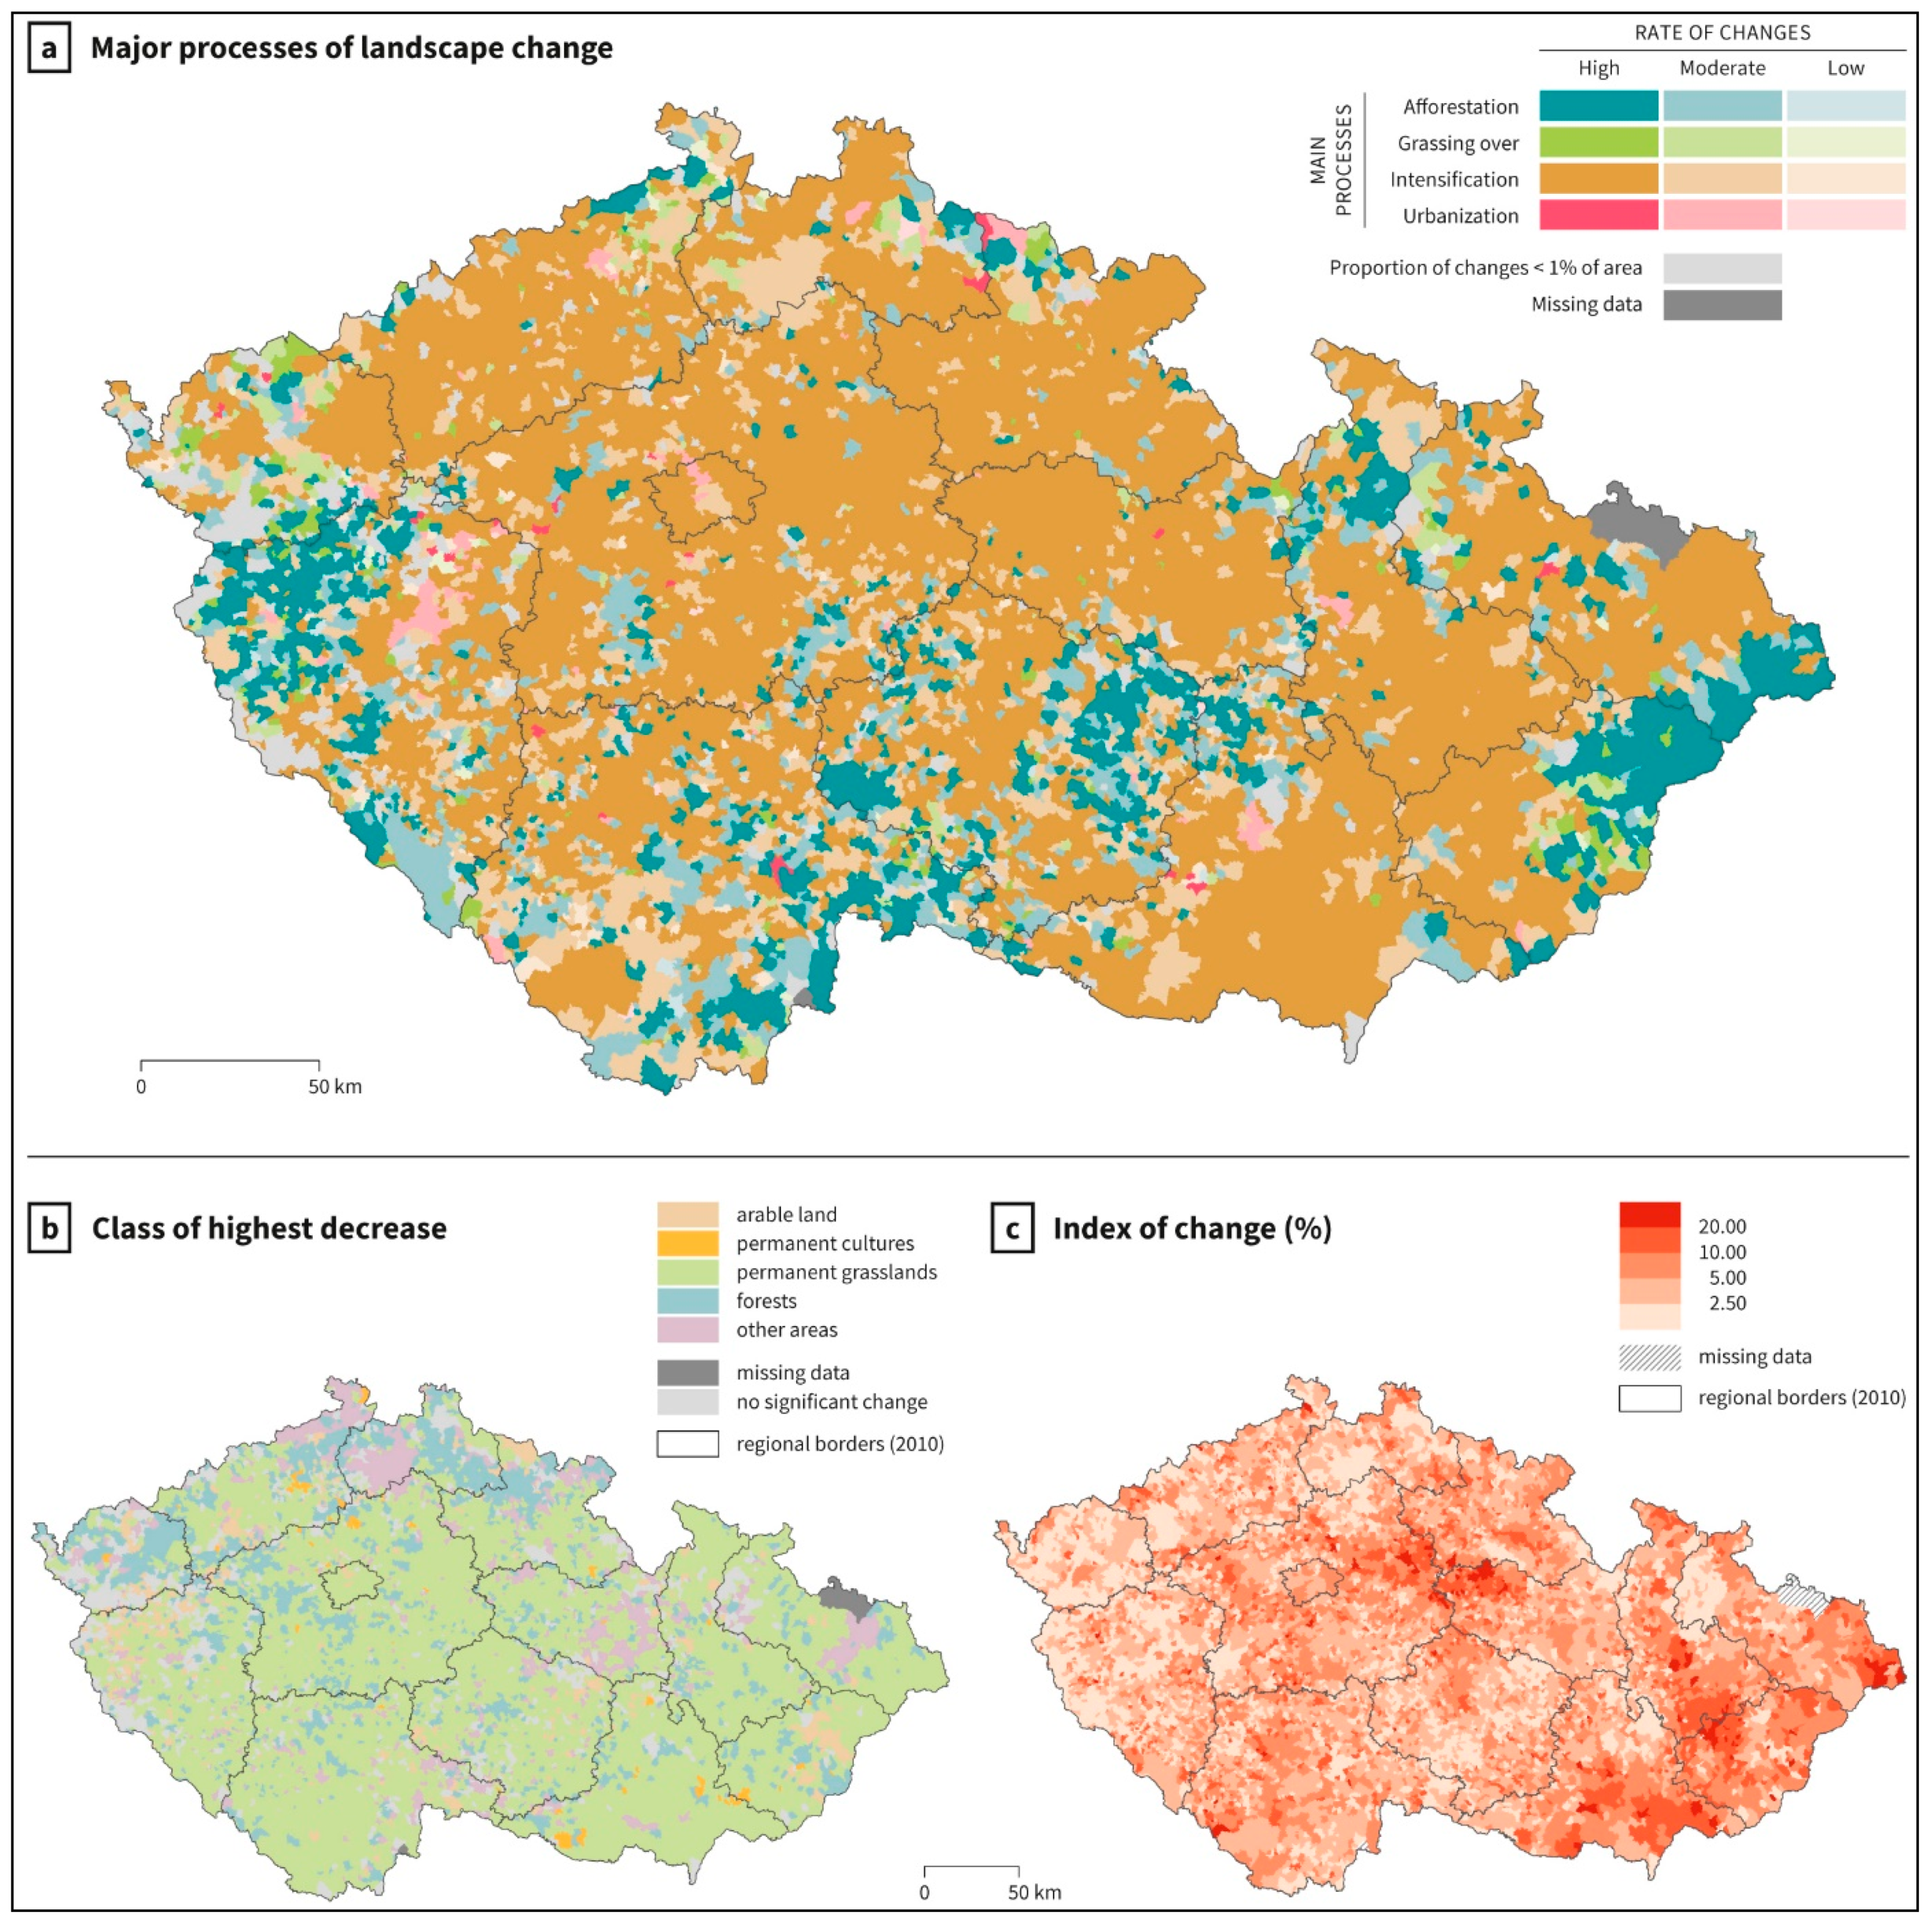
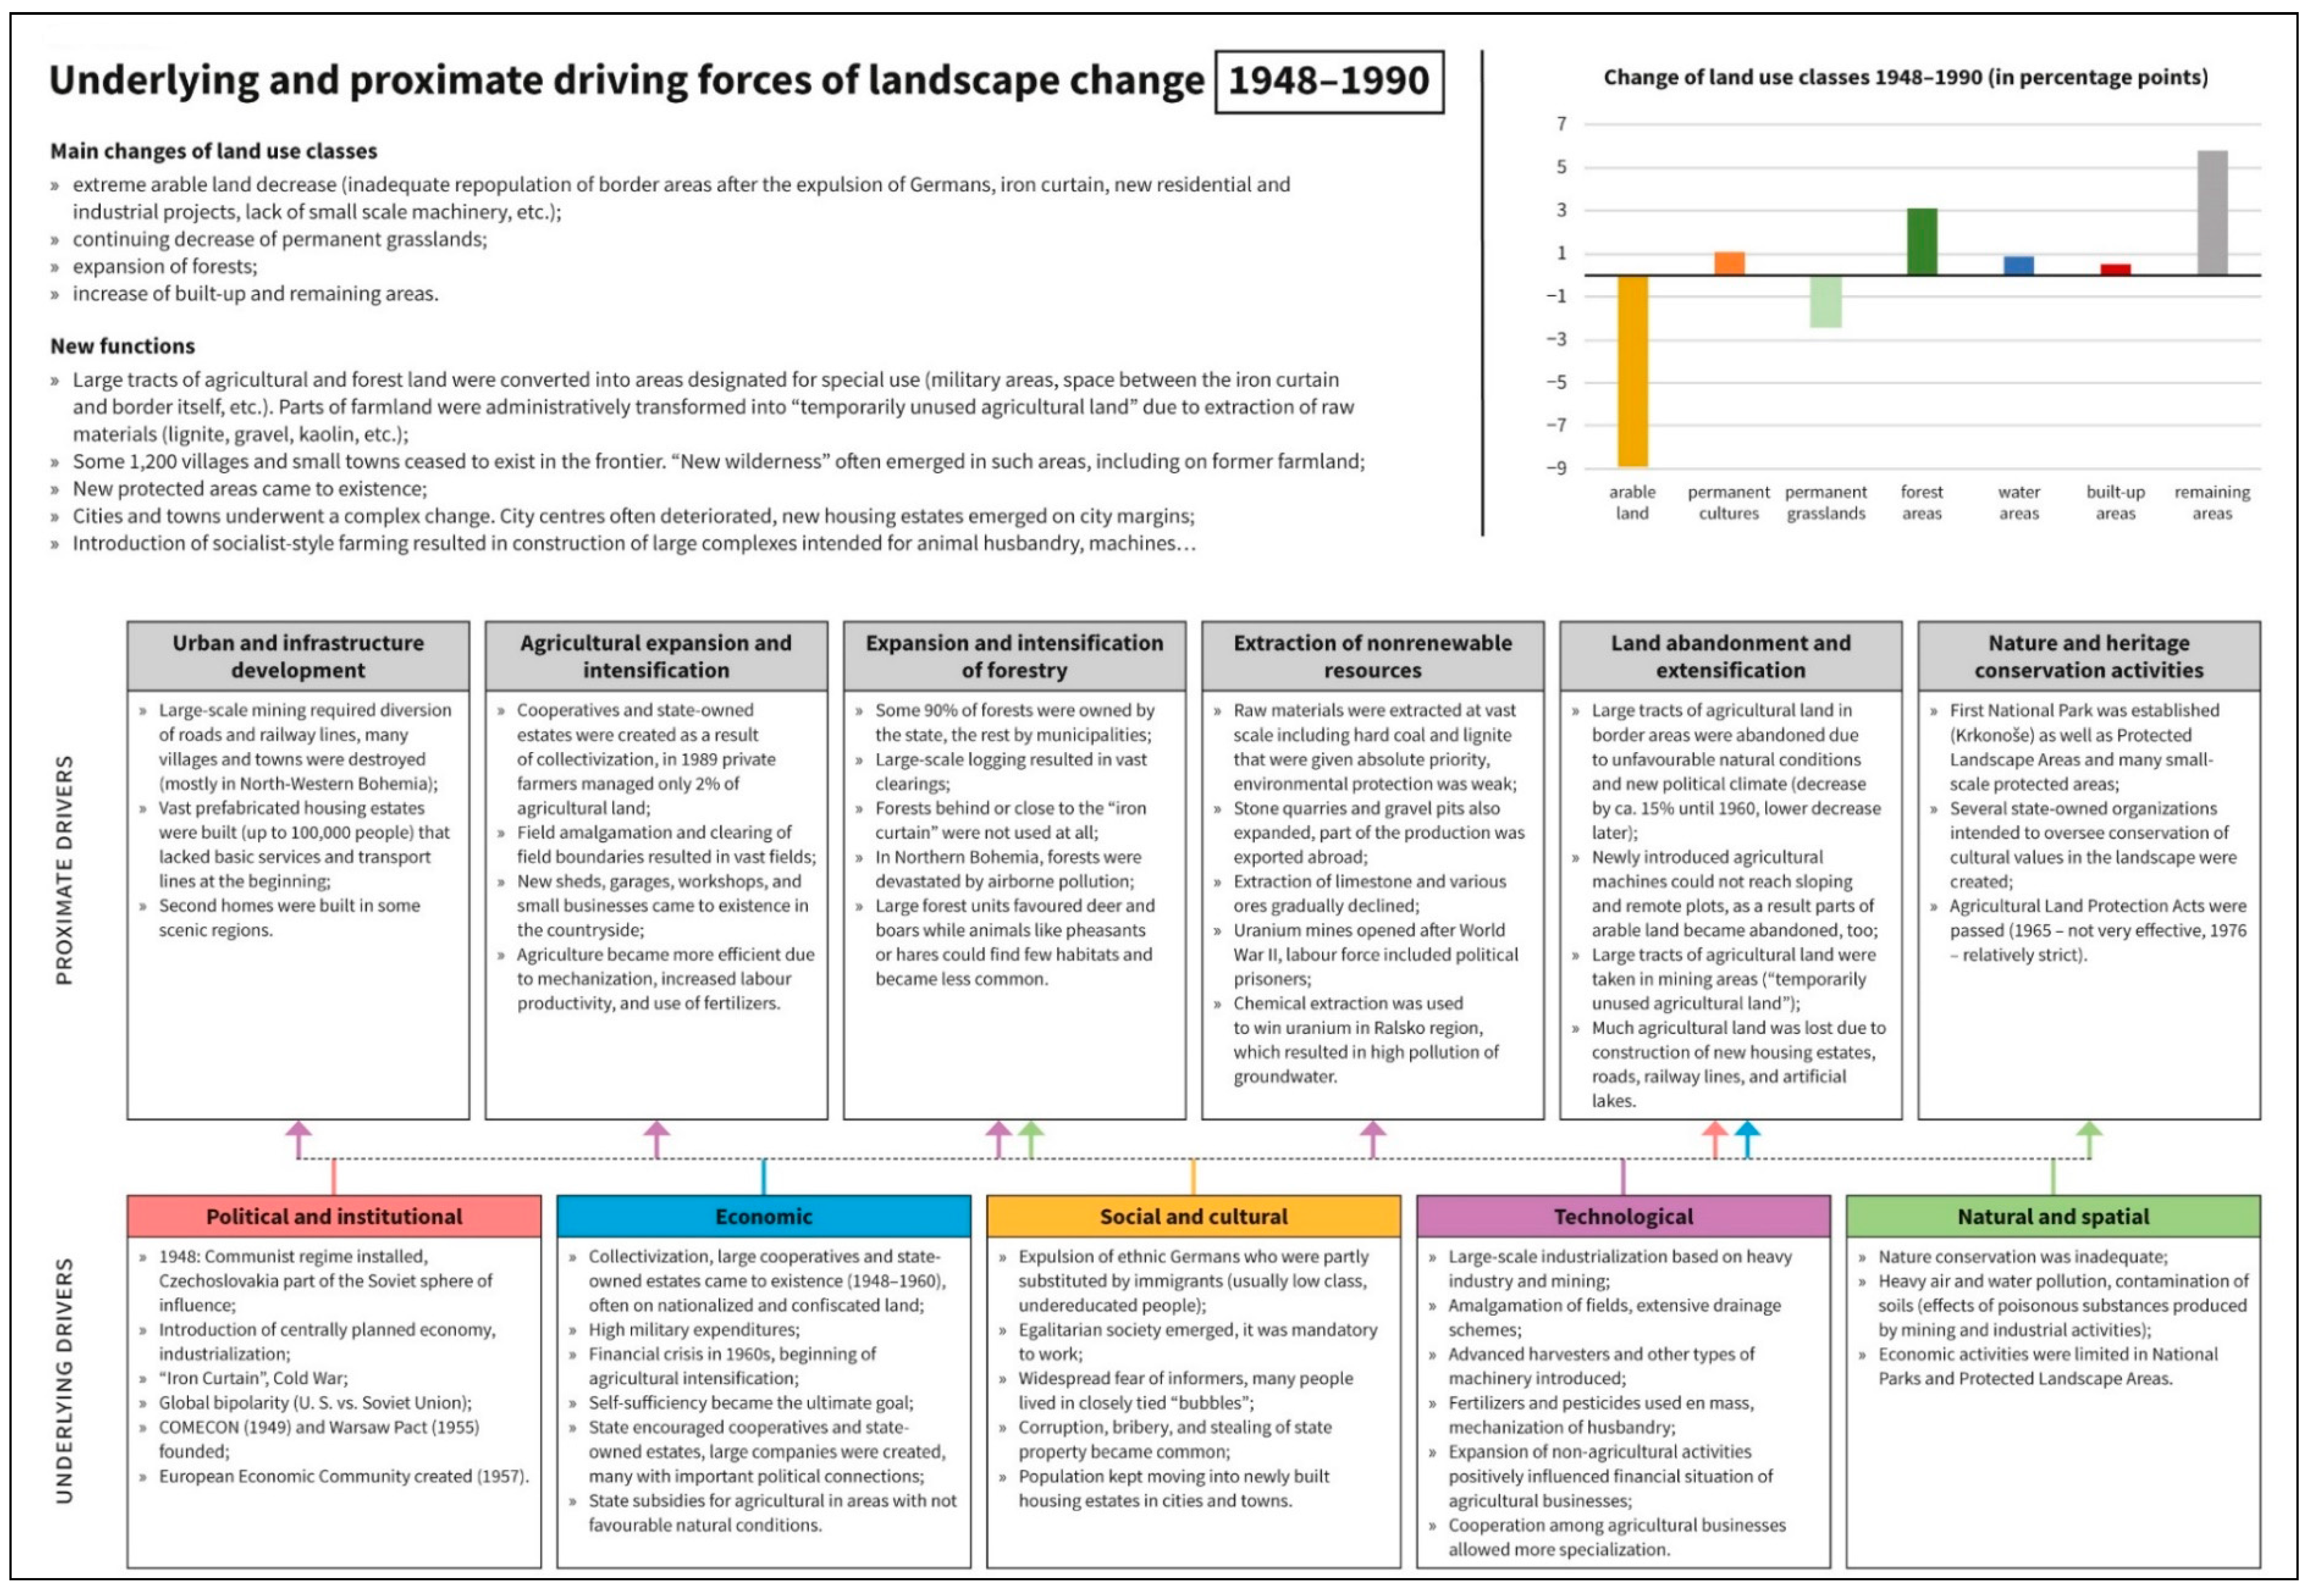
3.3. Driving Forces, Major Processes, and Intensity of Landscape Change in the Period 1948–1990

A centrally planned economy was adopted during the period between the communist coup d’état in 1948 and the collapse of communism in 1989. All of the important strategies were carried out and implemented by the Central Committee of the Communist Party, the dominant political body in the country. This included land use changes.
Urbanization was the dominant process of landscape change in most STUs (67% by area in total) during this period. Afforestation was also important (the most significant change in almost 20% of STUs by area); see Figure 4a and Table 2. In particular, these general trends were closely connected with the transition of agricultural land and arable land (Figure 4b). The total area of arable land decreased by more than 9% (i.e., by 700,000 hectares). These changes resulted from specific driving forces under communism that were primarily of political and institutional natures. A detailed overview of these driving forces (subdivided into proximate and underlying drivers) is shown in Figure A3. It is also important to note that the cornerstones of political and social life were imported from and controlled by the Soviet Union.
From the perspective of landscape change, socialist-style collectivization was very important. Cooperatives and state-owned estates were established from 1948 onwards. At the end of the communist period, private farmers managed only approximately 2% of agricultural land.
People moved in large numbers from rural areas to cities and towns where living conditions were more favorable. Approximately 3 million people lived in the countryside prior to World War II. Due to this rural–urban migration and the post-war transfer of Czech Germans living in the area near the borderland known as Sudetenland (excluding the border region with Slovakia), the population of Czechia after World War II dropped from 10.7 to 8.8 million by 1947 [53]. Naturally, the process of countryside depopulation continued. Thus, collectivization was taking place at the time as when industrialization was already underway and a large number of people were leaving rural areas.
The large fields that were created were more suitable for newly introduced machinery, but the impacts on the landscape were severe: erosion increased, soil (including fertilizers) was easily washed into streams and lakes, and many habitats (particularly those important for hares, pheasants, etc.) vanished. The biological protection of crops also deteriorated because the number of birds preying on insects was reduced. Sloping land (gradients of 7% or more) and small and irregular plots could not be cultivated by large machines. As a result, arable land areas were abandoned or gradually transformed into forests, giving rise to a form of “new wilderness” in some places.
Vast tracts of agricultural land (including arable land) were lost in areas close to the border, especially on higher grounds (border mountain range; Figure 1). The post-war transfer of Czech Germans was an important driving force because repopulation by native Czechs proved to be inadequate. Consequently, many villages ceased to exist in the frontier region, thus reducing the economic activity in such areas [54,55,56,57]. The Iron Curtain, which was installed along the western border, further limited farming and other activities. The space between the Iron Curtain and the border itself became inaccessible.
Industrialization also had a significant impact on post-war landscape changes as many new industrial complexes were built on greenfield sites. Mining was responsible for great losses of agricultural land: many new mines were created in the Ostrava and Kladno regions (see Figure 1). Of greater impact were the large-scale open pits that opened in northwestern Bohemia (coal basins around Most, Chomutov, and Sokolov; geographical locations shown in Figure 1). The combination of these activities led to environmental devastation (heavy water, soil and air pollution, acid rains, and devastation of forests in Northern Bohemia).
From a regional perspective, the general trends are quite clear. A decrease in agricultural land was recorded in more than 90% of STUs over the period 1948–1990. This process was boosted by increased urbanization in the metropolitan areas (Prague, Ostrava, Brno, and the coal basins in northwestern Bohemia; Figure 1) where the index of change often exceeded 20% and occasionally 40%. Figure 4c clearly shows that this index also reached the highest values in coal mining areas.
Subsidies provided by the state that were intended to support agricultural businesses in less favorable natural conditions also constituted an important driving force. The scope of these subsidies depended on natural conditions and could reach 10%–80% of the gross agricultural value. However, agricultural practices in these areas were not beneficial to the landscape. Rather than desirable permanent grasslands, intensive crop production on arable land in mountainous regions, including steep slopes, was undertaken. In addition, cooperatives on fertile land were taxed, and part of these tax revenues was used to subsidize the less-favored areas.

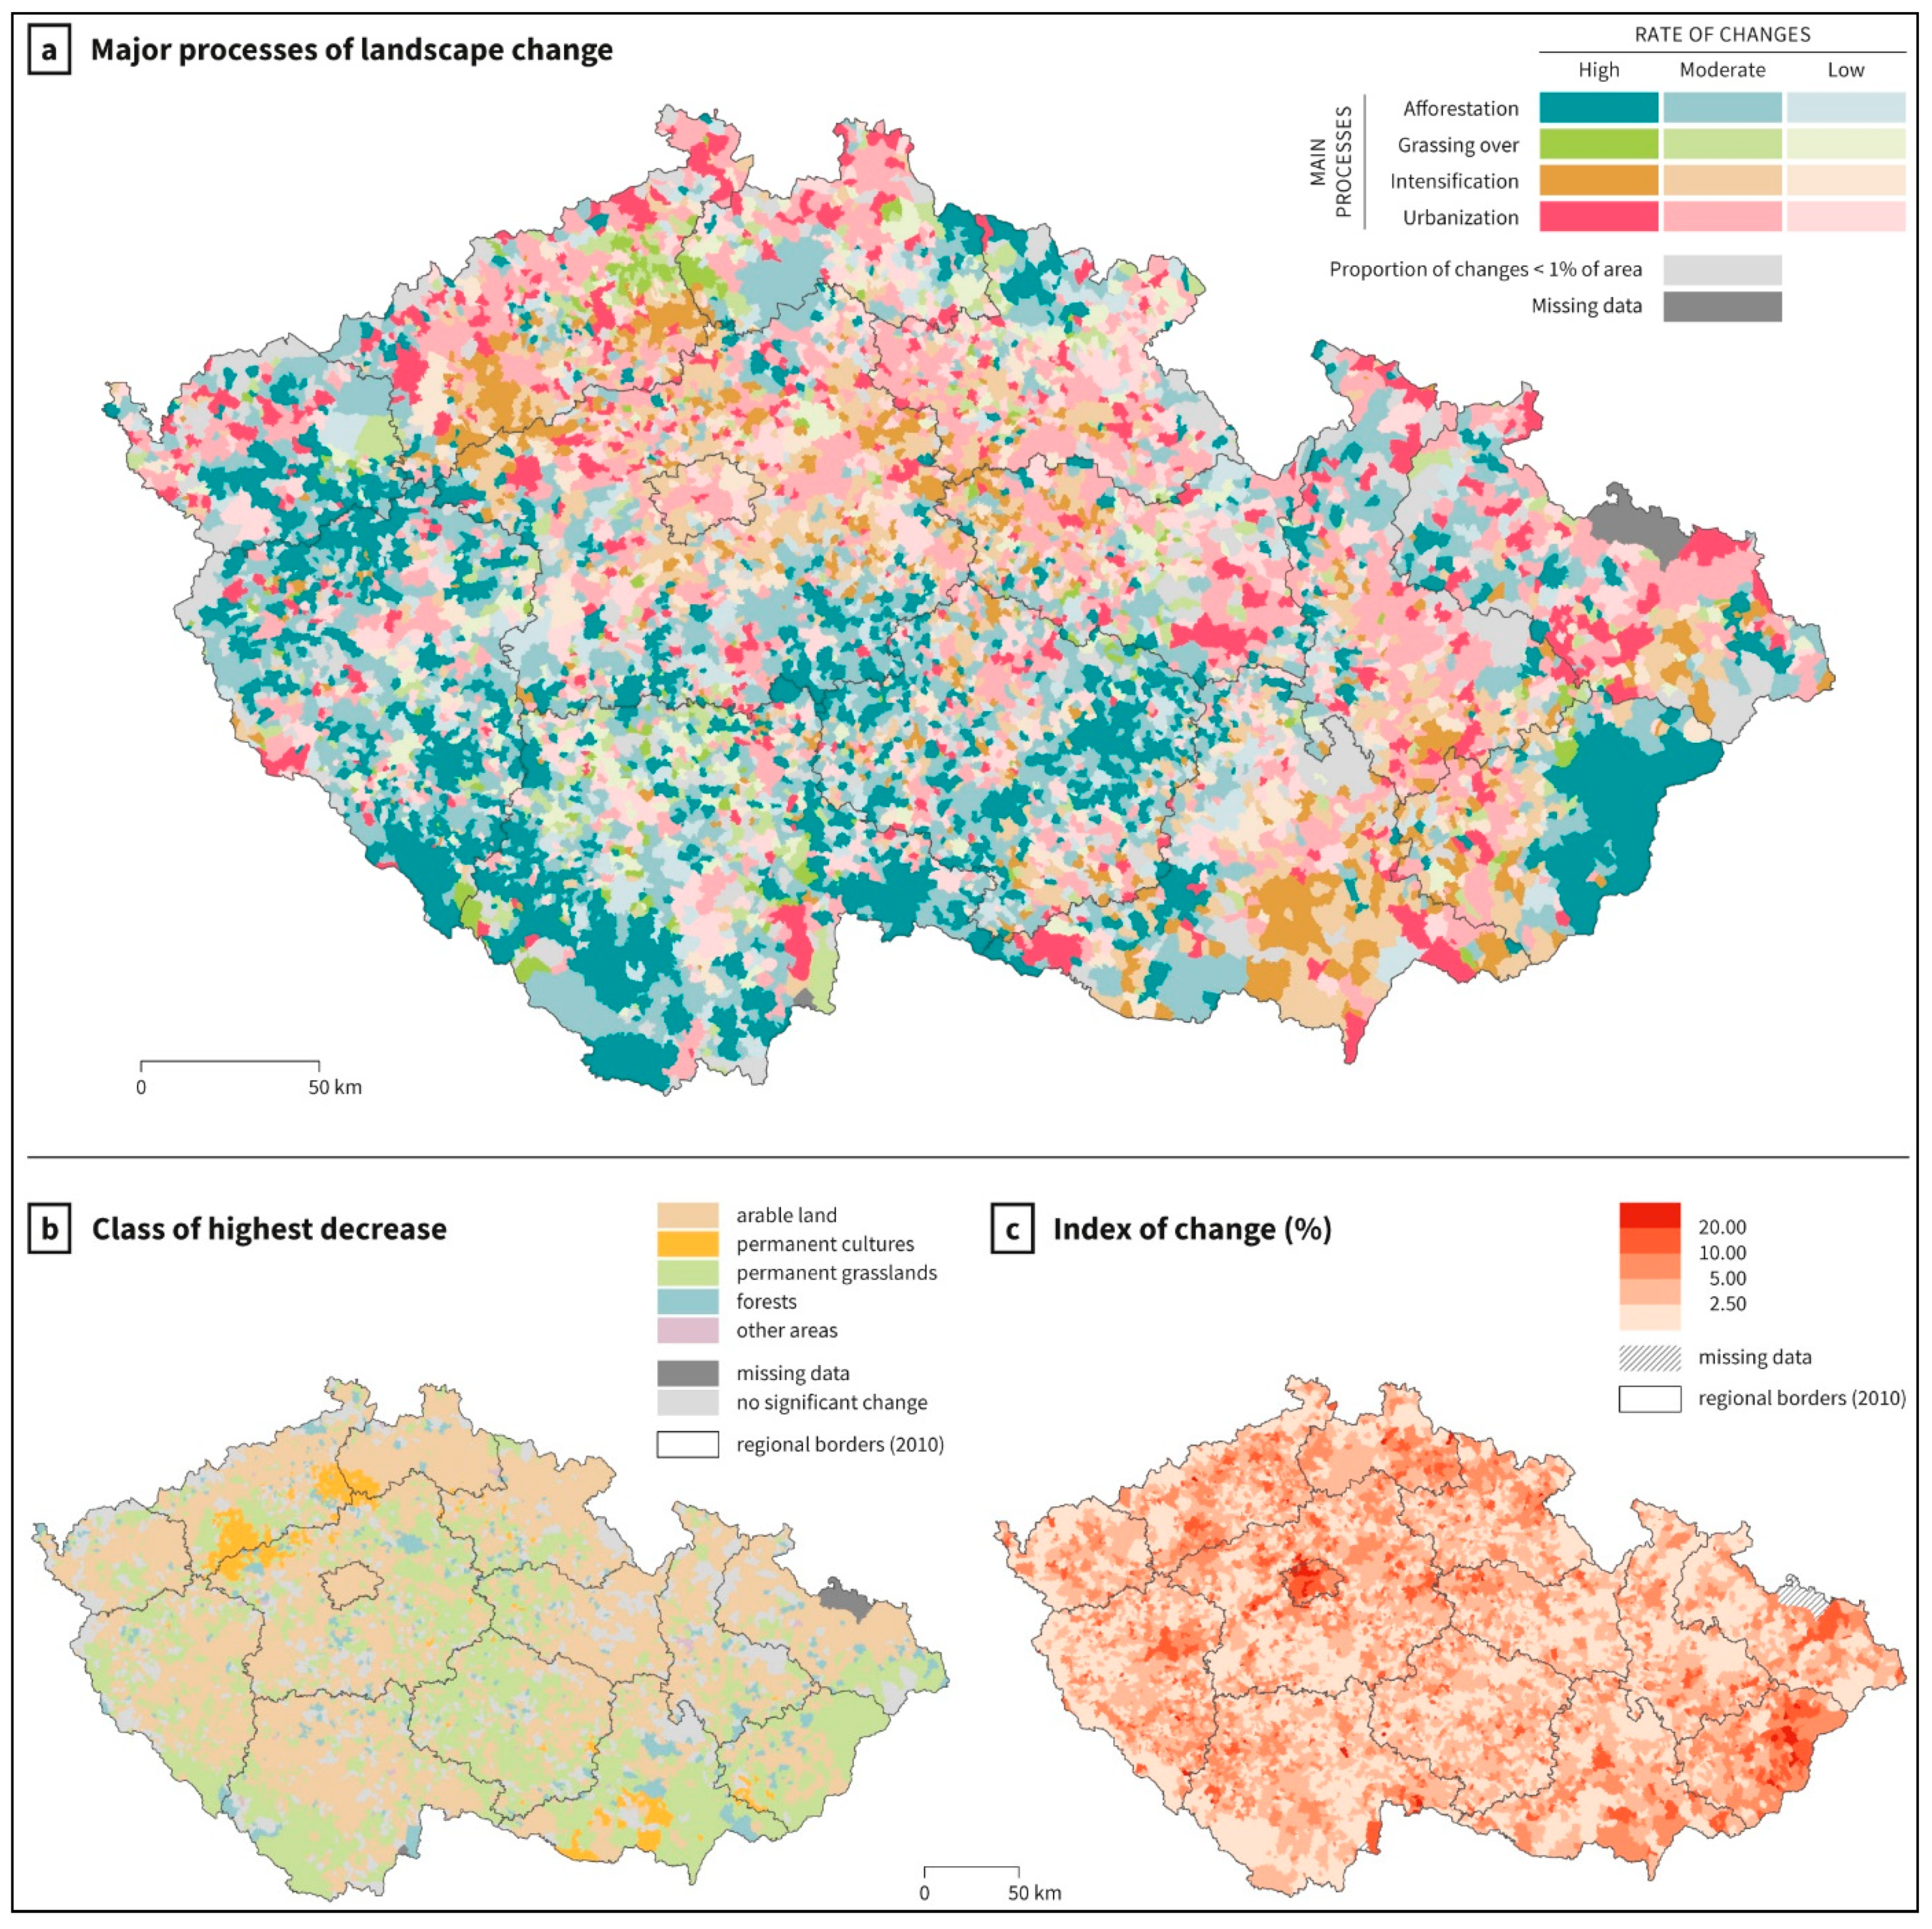
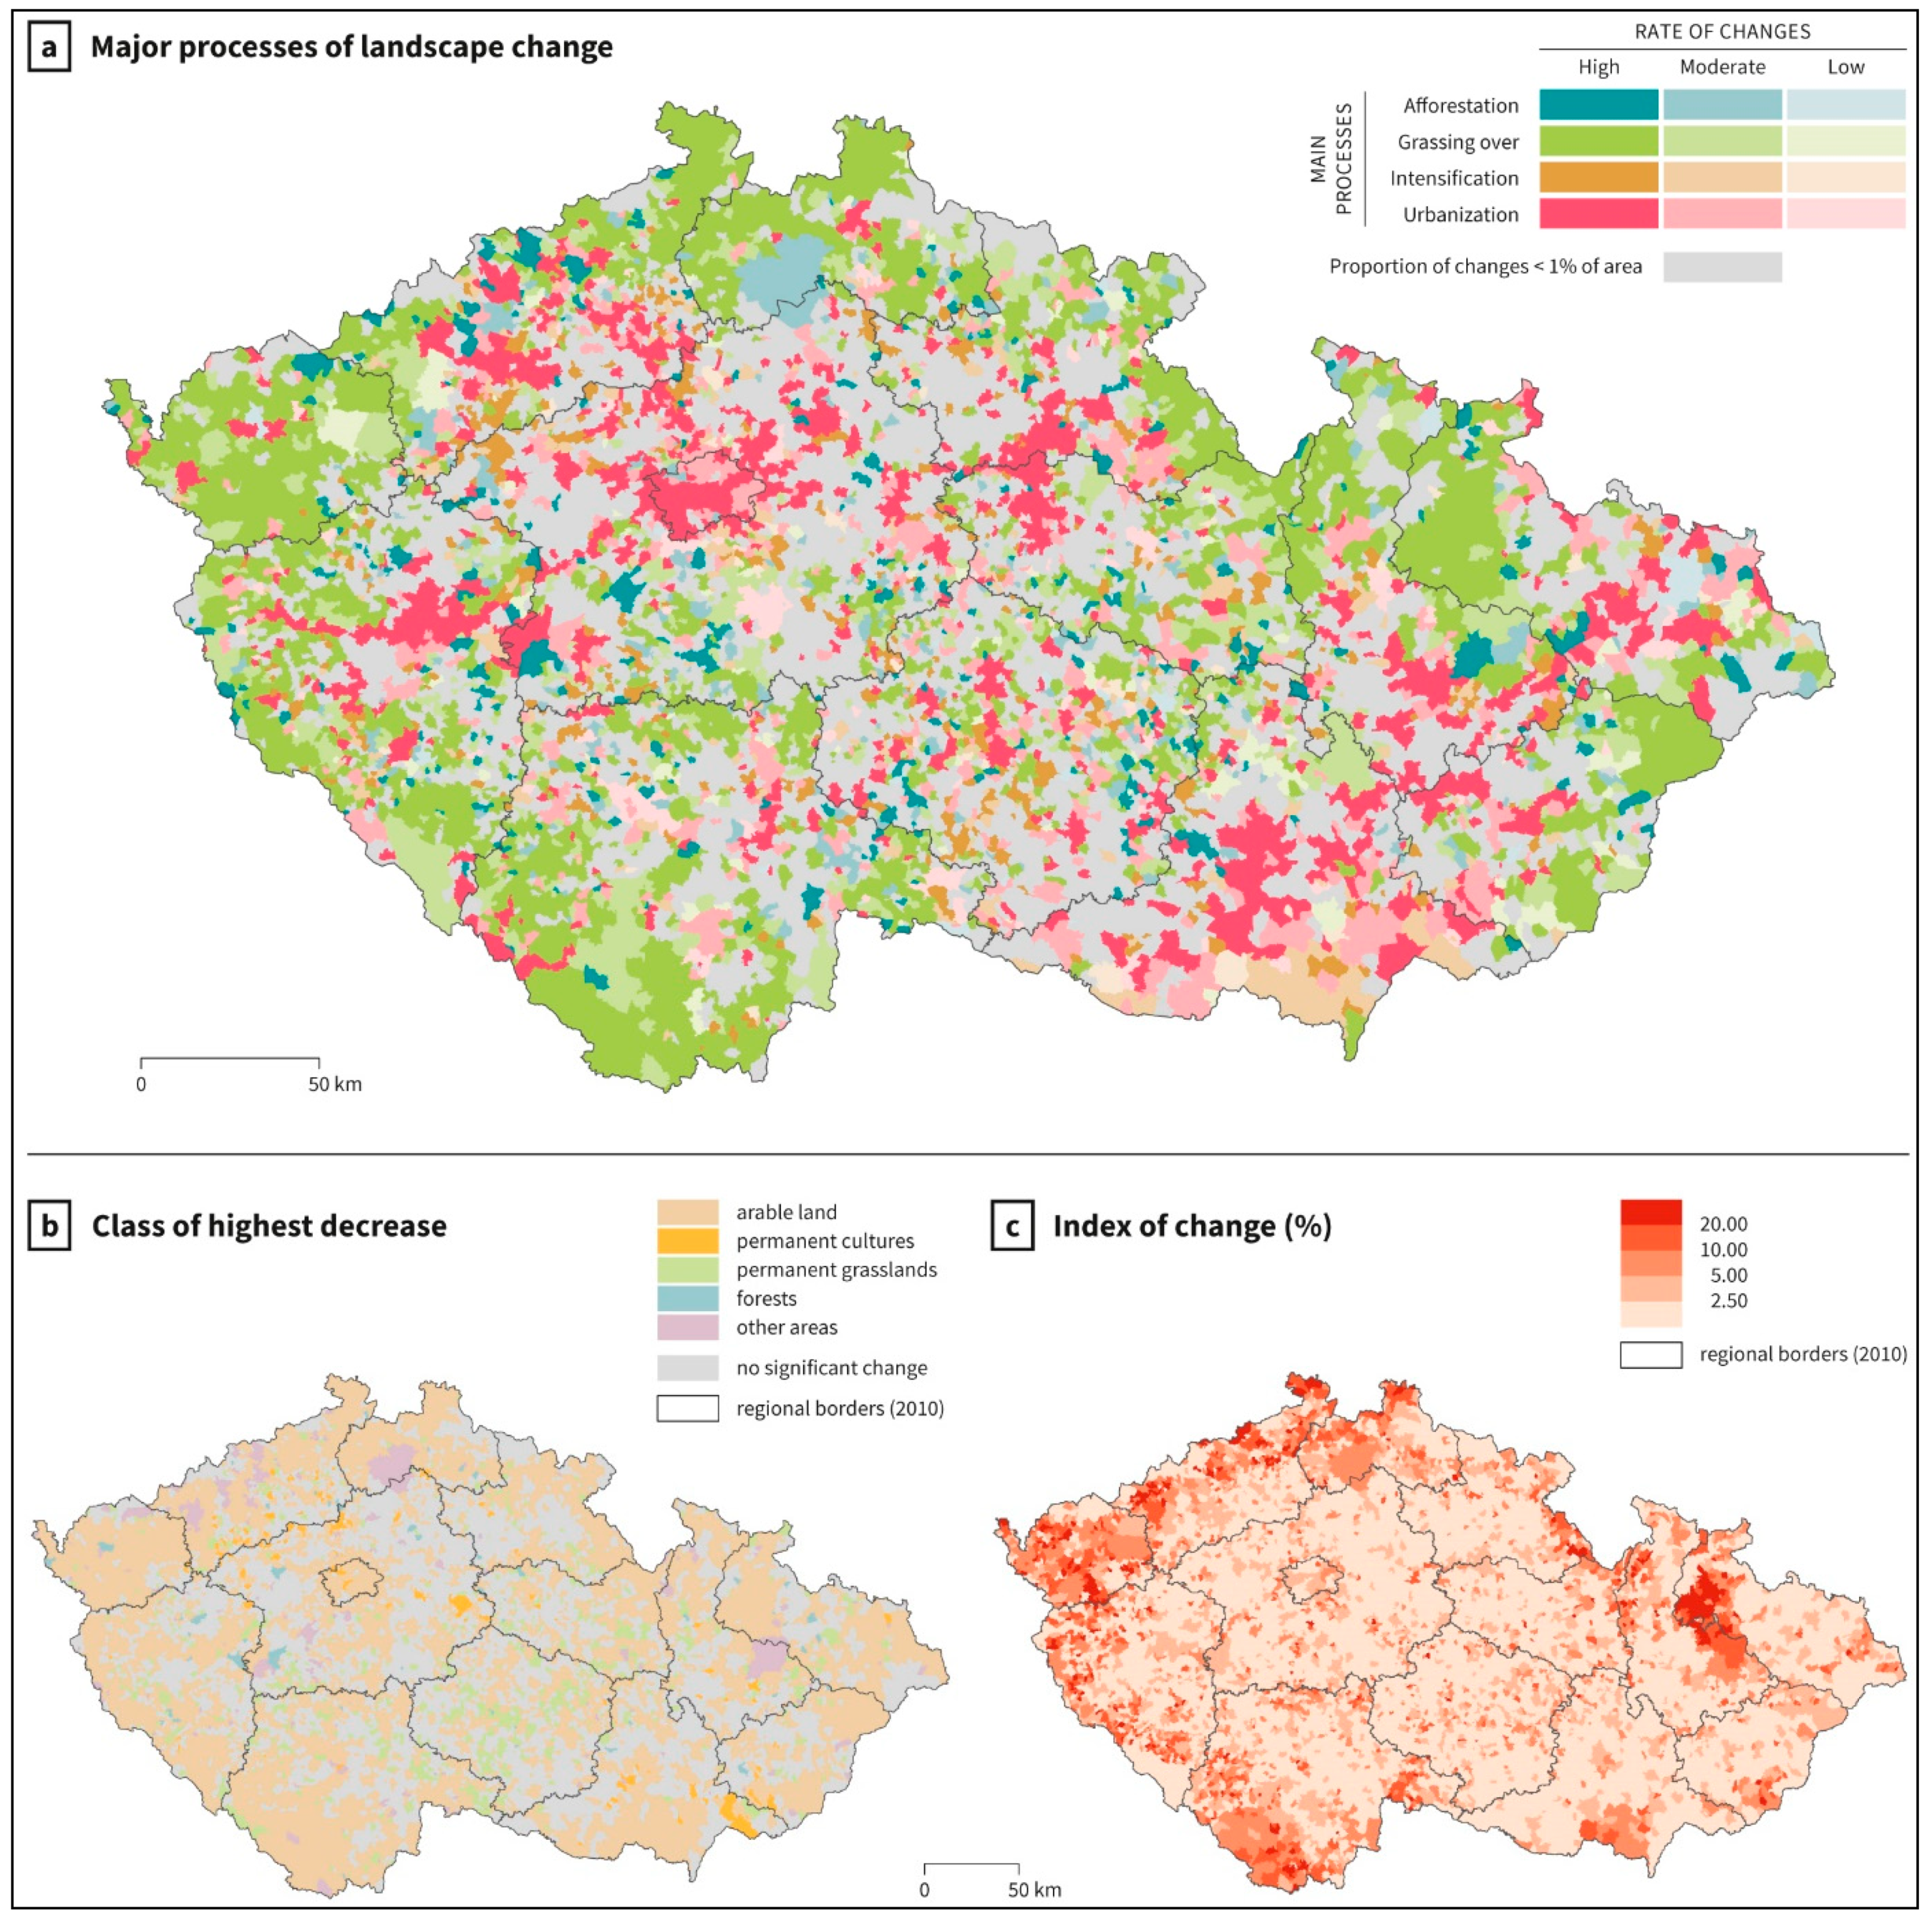
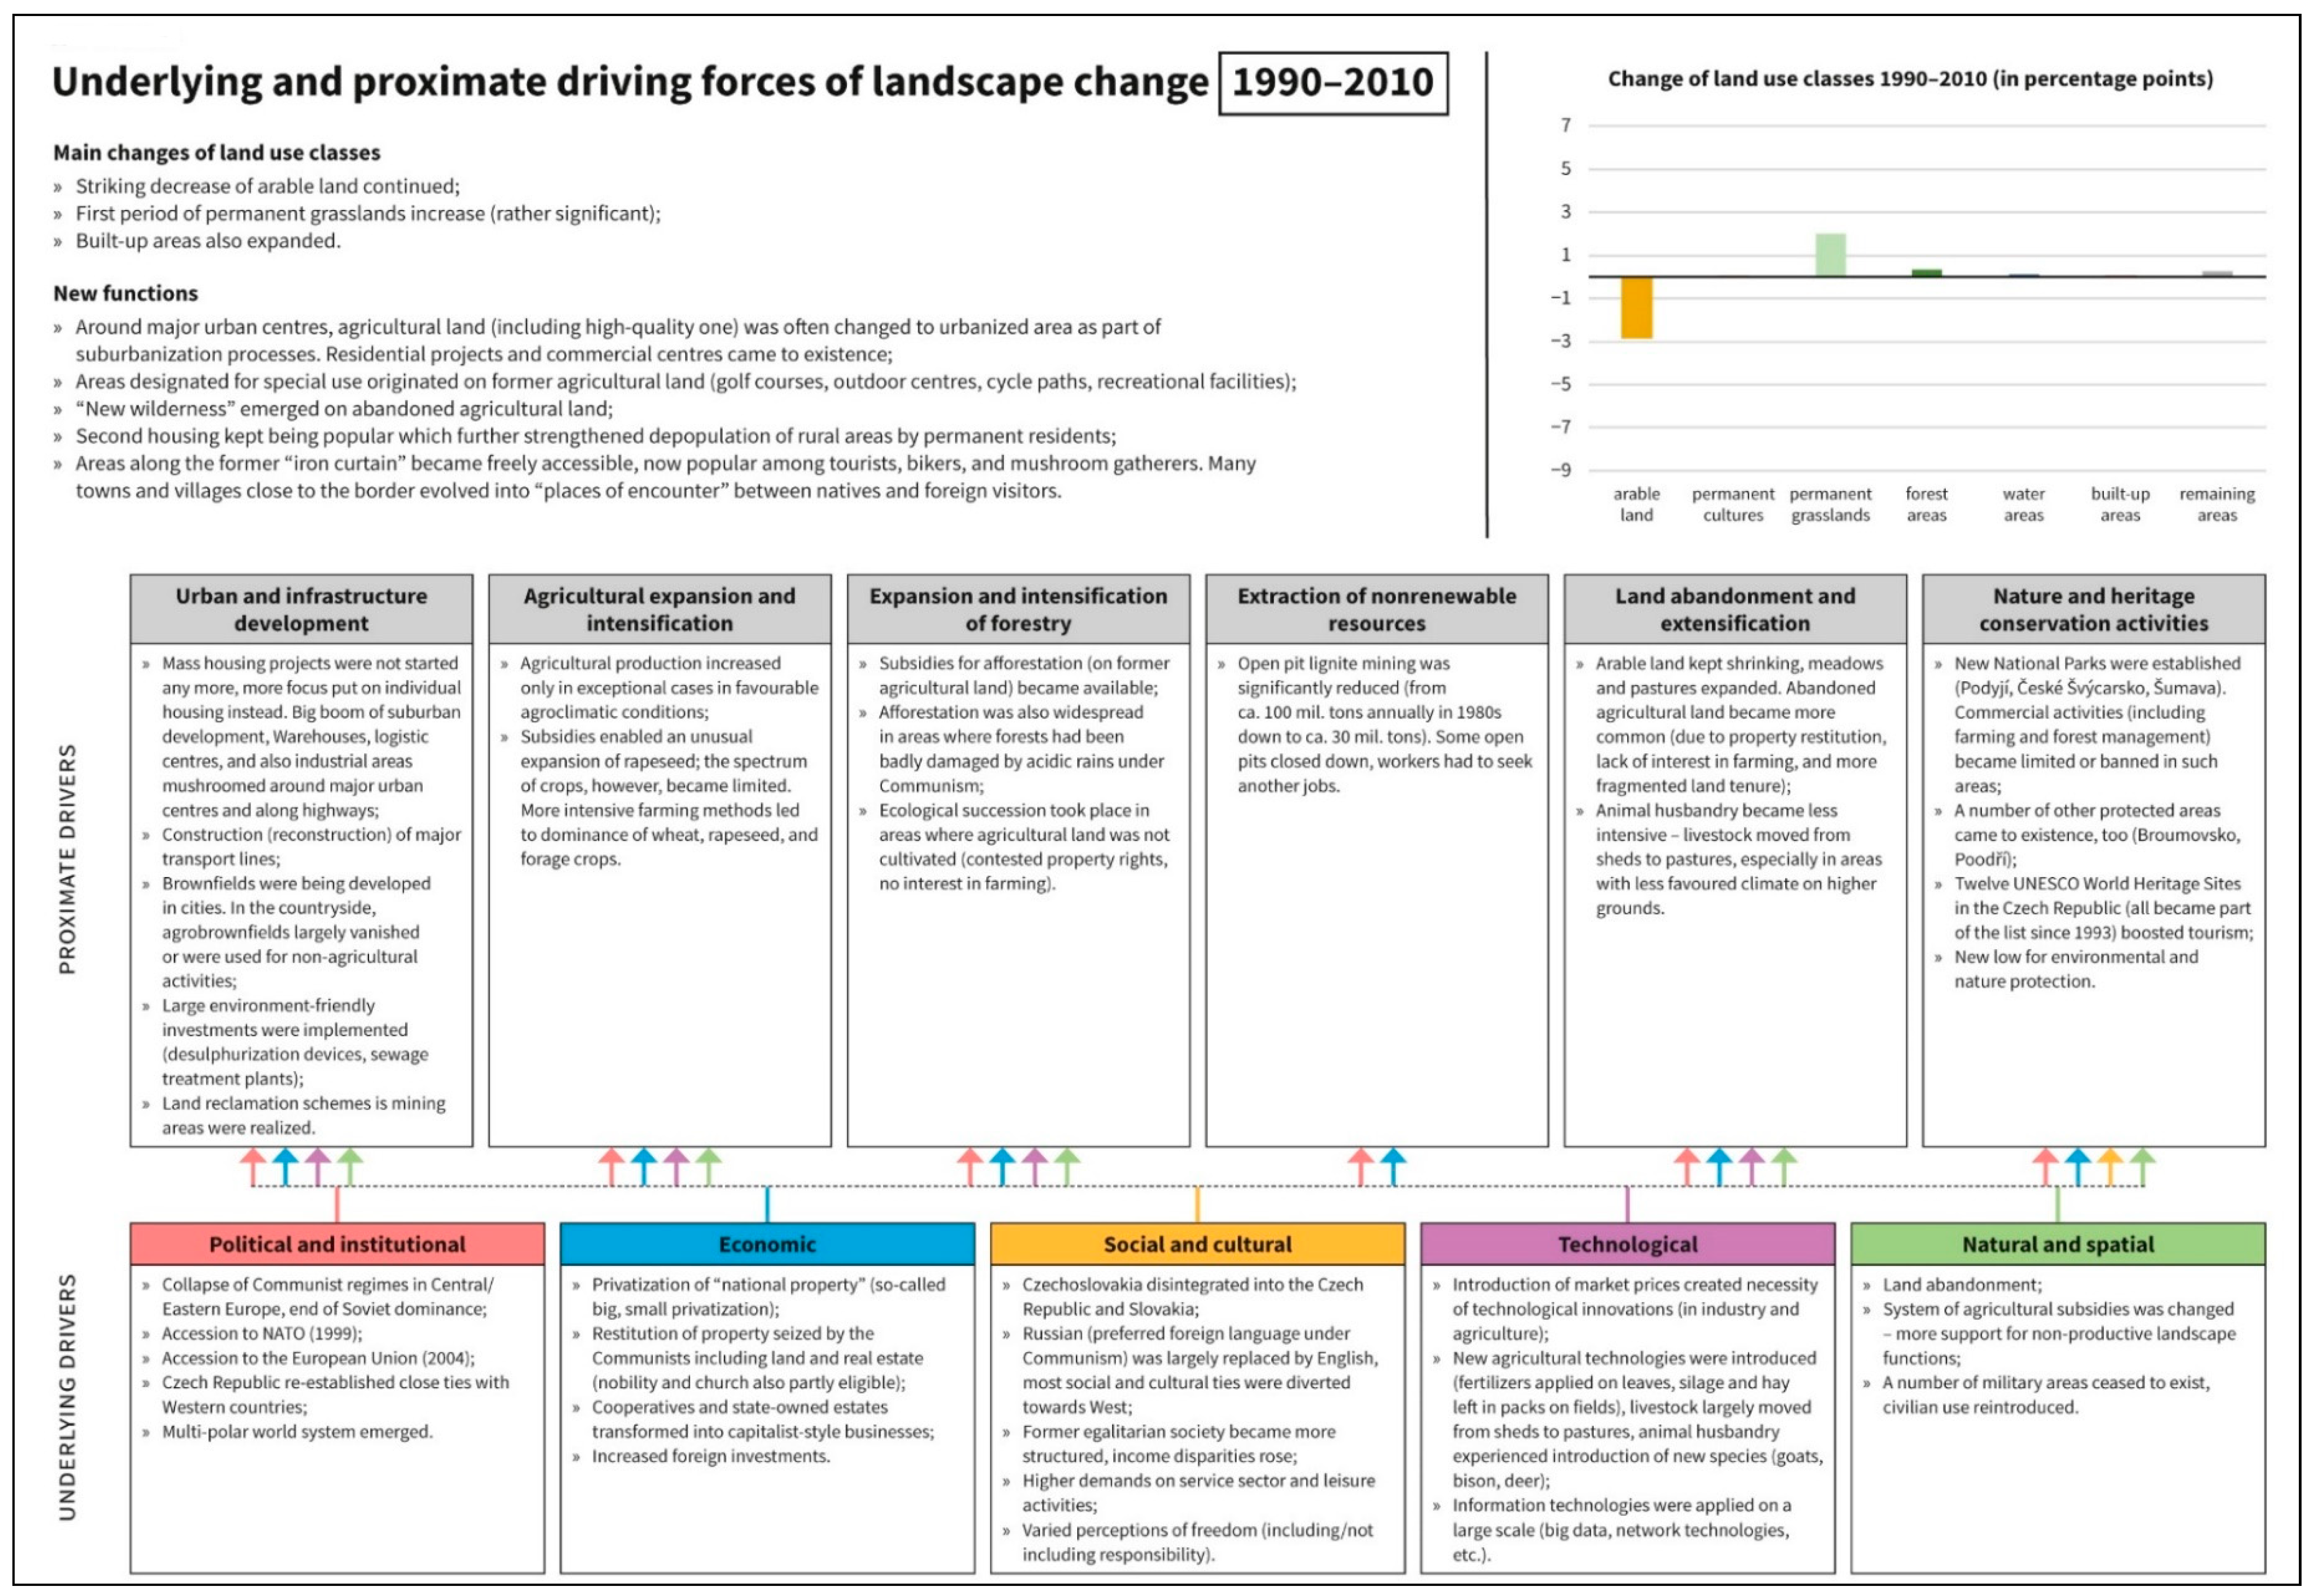
3.4. Driving Forces, Major Processes, and Intensity of Landscape Change in the Period 1990–2010

The laws that enabled privatization and restitution of property seized under communism constituted one of the most important driving forces in this period; for a detailed schematic of the driving forces during this period, see Figure A4. These laws fundamentally changed ownership of agricultural and industrial enterprises. In the agricultural sector, property that had been managed by cooperatives and state-owned estates under communism was returned to approximately 3.5 million previous owners. Most of these property transfers were completed by 1995. As a result, landscape utilization fundamentally changed. Many eligible persons were not interested in the reclaimed property, and only a small fraction began agricultural businesses. Most of the restituted land was leased to cooperatives and other agricultural businesses. Former socialist-style cooperatives were gradually transformed into cooperatives based on property ownership. All of these large-scale property transfers had a substantial impact on landscape changes at local and regional scales.
The accession of Czechia into the European Union (2004) also influenced agricultural business. Foreigners were not allowed to purchase land until 2012. Many Czechs, however, were not interested in purchasing agricultural land because of the long-term nature of the investment. Regarding agricultural subsidies, Czechia was eligible for EU funds prior to 2004; money was allocated mainly for restructuring and environmental projects.
Compared to farmers in the former EU states, Czech farmers were eligible for significantly lower subsidies in the period 2005–2012, when land purchases were restricted. In 2005, these subsidies were only 25% of those in EU-15, and increased by 8% in each successive year. Subsidies provided at the national level were negligible. The resulting lack of funds led to a marked decrease in agricultural production, and to extensification and land abandonment.
In many regions, arable land shrank the most of all of the land use classes (Figure 5b). In the lowlands, particularly in areas close to cities and towns, arable land was subjected to strong pressure from developers. Large parts of arable land were transformed into built-up areas due to intensive suburbanization, particularly from the late 1990s onwards [58,59]. Urbanization was the second major process of landscape change during the examined period (see Figure 5a and Table 2; the most important process occurred in STUs covering 19.7% of the national territory). However, there were marked regional differences regarding changes in agricultural production and the intensity of arable land transformation (arable land was stabilized in lowlands while decreases higher than 5 % were recorded in mountains). On fertile soils, intensive farming, including husbandry (cows, pigs, and poultry), generally continued.
The transition of arable land into meadows and pastures was typical in regions with less favorable natural conditions (supported by subsidies from the EU Common Agricultural Policy and other schemes of both the European Union and the state focused on sustainable landscape management) and constituted the major process of landscape change in STUs covering 33.8% of the national territory (Figure 5a and Table 2). The abovementioned property restitution, in addition to the changing nature of agricultural subsidies, played a major role in this process; subsidies were more intended to secure “landscape maintenance” rather than production per se. The expansion of forests was also important.
The intensity of landscape change differed significantly among regions. The most intensive changes (Figure 5c) were recorded in areas where agriculture declined, and fields were transformed into meadows and pastures (typically in mountainous regions flanking the border). Regions that were subject to strong suburbanization (i.e., around cities and along major highways) also showed higher intensity of change (changes were recorded in many cases on more than 20% of total area of STU). Suburban areas became attractive for people seeking better housing, and new residential projects were often built on arable land.
The decline in mining and related activities should also be mentioned as an important factor. After 1990, three new National Parks (Šumava, Podyjí, and České Švýcarsko; Figure 1) and a number of Protected Landscape Areas were established. In these areas, commercial exploitation of the landscape was severely limited. By contrast, the fall of the Iron Curtain allowed access to areas along the southern and western border and enabled common activities, including agriculture and forestry. In general, the period 1990–2010 is marked by increased implementation and precision of landscape management, including nature conservation. This shift was also reflected by administrative changes: the Ministry of Environment was established in 1989, and the Agency for Nature Conservation in 1995.
Only a portion of the abovementioned landscape changes was recorded in the Land Registry. In many cases, land use changes are not reflected in the files (according to our estimates, before accession to the European Union, there may have been a total of up to 500,000 hectares of such plots). Part of this was former agricultural land (particularly arable land), now abandoned and gradually turned into “new wilderness” without any human intervention. The authors of [60] argue that this could account for 5% of agricultural land in selected cadastres between 1990 and 1997. Delayed input of land use changes into the cadastre is one example of data shortage that must be taken into consideration when assessing the extent of changes [43].
Processes similar to those experienced in Czechia—agricultural extensification, land abandonment, afforestation, and (sub)urbanization—also took place in other post-communist countries [19,61,62,63,64]. However, land abandonment was also recorded in other regions [65,66,67].

3.5. Summary of the Period 1845–2010

In accordance with previous research [6,8,9,10,33,39], it can be summarized that landscape changes are determined by certain combinations of political/institutional, cultural, and natural/spatial drivers, rather than only by a single key driver. It should be highlighted that landscape changes, in general, form part of large-scale changes that are linked to societal modernization. The organization of society has changed from tiny units that relied on a small-scale subsistence economy and were confined to a limited space to a multi-level hierarchical society in which territorial units are interconnected by specific links depending on different functions.
These general changes are also reflected in changing land use patterns. In [68], it is argued that land use changes appear last of all, and only after political, economic, and social changes have taken place. Landscape changes are the most complex and depend on social change.
The key findings of our research are as follows:
(a) Different processes of landscape change prevailed in observed periods of time. The first period, 1845–1896, was the only period during which the arable land area increased, and the most recent, 1990–2010, was the only period during which permanent grasslands increased. The permanent cultures, forests, and remaining area classes increased in all periods. The communist period was characterized by unified types of changes—urbanization, afforestation, and a large decrease in arable land (by almost 9 percentage points) were the dominant processes. By comparison, the period 1896–1946 was characterized by the most variable changes (Table 2 and Figure 2, Figure 3, Figure 4, Figure 5 and Figure 6).
(b) Landscape changes were influenced by a number of different factors over the whole period 1845–2010 (Figure A1, Figure A2, Figure A3 and Figure A4). The driving forces that likely had the most significant impact on landscape change during the different periods were:
  • Revolution of 1848/49: e.g., the end of feudalism, beginning of capitalism, the labor force of peasants formerly living under serfdom (farmers) becoming a commodity in the labor market, the gradual formation of civil society;
  • Industrial Revolution (industrialization, urbanization, railways, etc.) and Agricultural Revolution were completed [48,49,51];
  • 1880s and 1890s: transition into Technological–Scientific Revolution under conditions of protracted agrarian crisis;
  • World War I: war economy, controlled market, lack of male workforce in agriculture;
  • 1918–1948: birth of Czechoslovakia, loss of large markets in former Austria–Hungary, land reform (1920–1937), Great Depression (1929–1933);
  • World War II: war economy, Nazi regime, population decrease;
  • Impacts of World War II: transfer of Czech Germans in 1945–1947, depopulation of borderland, agricultural boom in the Czechia interior;
  • 1948–1989: nationalization, centrally controlled economy, collectivization, industrialization, special system of subsidies (intensive agriculture at high altitudes was encouraged);
  • From 1990 onwards: reintroduction of market economy, property restitution, privatization, accession to the European Union, new system of agricultural subsidies, boom in urbanization.
(c) In accordance with previous research [9,10,39,41], our analysis shows the crucial role of underlying drivers, mainly related to political and institutional factors; particularly in the first two periods, however, technological drivers also played a significant role. Natural conditions played a very important role at the beginning of the examined period (Differential Rent I). Subsequently, social and economic factors became more important (Differential Rent II)—[69])
(d) Regarding the main findings for the development of particular land use classes, we can summarize as follows:
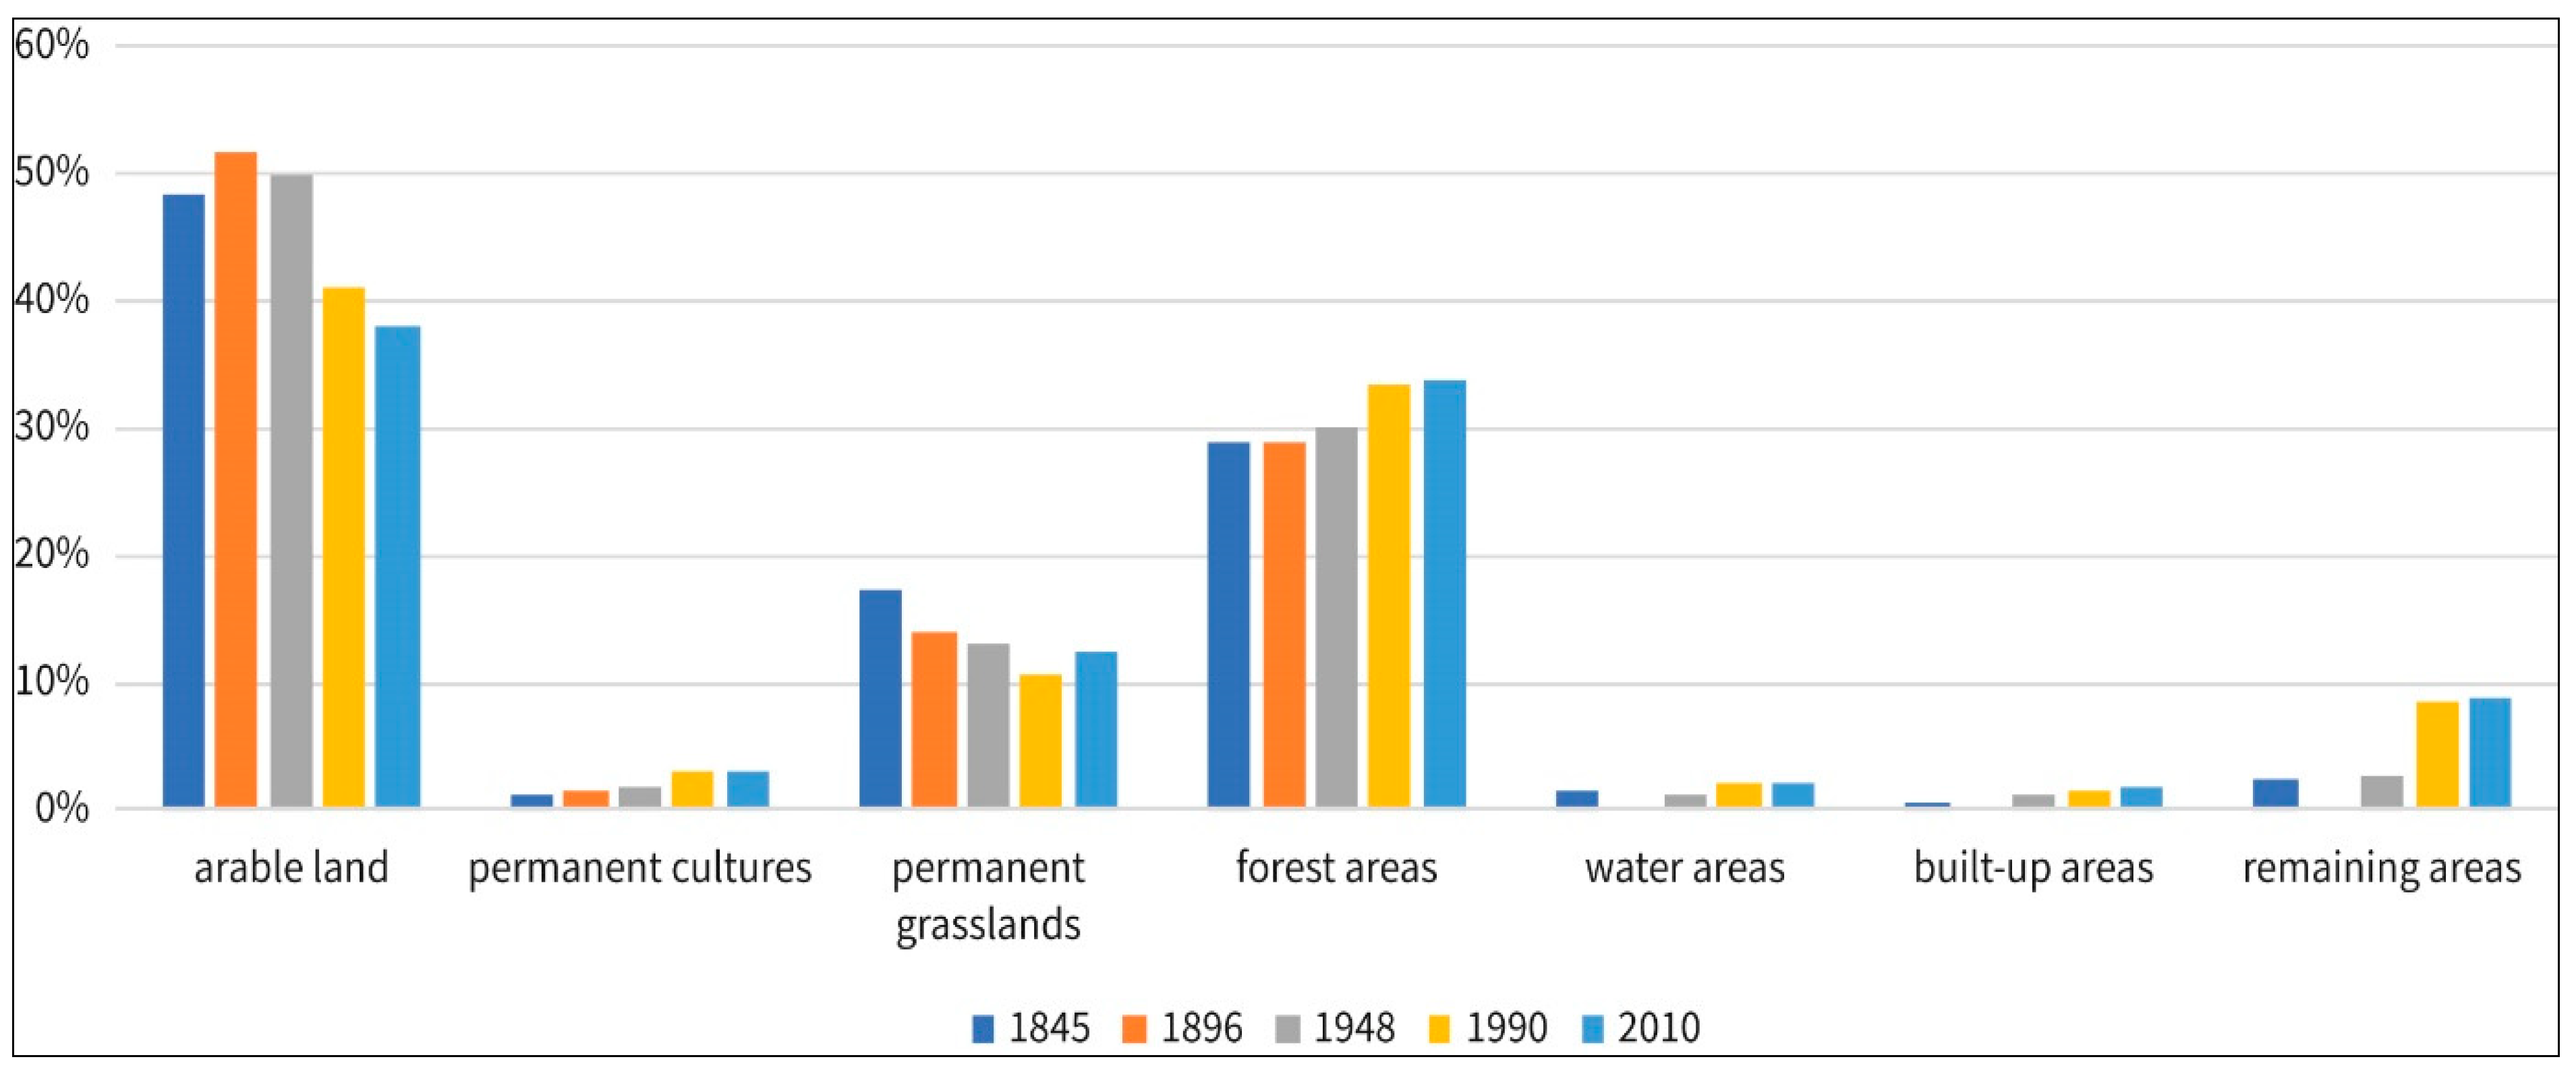
  • Decrease in agricultural land and arable land was an important long-term trend (with the exception of the period 1845–1896). During the same period, agricultural efficiency and production increased.
  • Meadows and pastures continued to decrease until 1990; this process was reversed only recently when grassing over took place. Subsidies provided for sustainable landscape management were the essential driver of this process.
  • Afforestation was also important; in terms of percentage points, the expansion of forests may appear modest (increasing from 29% to almost 34% of forest cover); however, compared to the areas that were developed, forests “invaded” a much bigger space. Such a change reflects trends that are common in economically developed European countries, i.e., the so-called forest transition described by Mather [3].
  • A marked increase in built-up and remaining areas was recorded; these have expanded three- to four-fold. Urbanization was one of the key processes during all subperiods with the exception of the first (1845–1896).
At the national scale, long-term changes (from the middle of the 19th century) can only be compared with publications from the territory of Slovenia, for which a similar dataset was used. According to Petek and Gabrovec [44], the decrease in arable land was the most extensive process during the period 1896–1999 in Slovenia, followed by urbanization. For the shorter period between 1900 and 2010, Fuchs et al. [70] determined the main land-change processes in Europe to be cropland/grassland dynamics and afforestation, and deforestation and urbanization. Based on 144 European studies with different time scales (about 22% studies focused on a period longer than 100 years), Plieninger et al. [9] determined that land abandonment and agricultural extensification were the most prominent proximate drivers. Burgi et al. [10] analyzed six regions across Europe based on historical and contemporary maps from the nineteenth and twentieth centuries. They call attention to polarization of the landscape between intensification and extensification when agricultural land is employed in both settlement growth and afforestation processes. This polarization of the landscape (reported also in [71] and [39]) was also identified in our analysis for the most recent period in Czechia. However, it was also identified, to some extent, from 1896 onwards, when both urbanization and the processes of afforestation, grassing over, and land abandonment were gradually taking place on former arable land (or permanent grasslands).
(e) At the present time, fertile land—the most important natural asset—is facing significant threats. Tens of thousands of hectares of fertile land are lost each year as a result of commercial and housing developments (including related areas, such as parking lots). Most of this land will probably never be recovered for agricultural use. Substantial growth in urbanization leads to an extensive increase in impervious areas and poses a threat to the future, not only because of the loss of quality land but also because of the acceleration of water flow from the landscape [58,72].
(f) The human impact on the environment has grown over 165 years due to technological development. Devastation of the landscape, and the environment in general, was critical during the communist period, due to the synergy of a number of negative factors. We confirmed our hypothesis that the major changes occurred in the period 1948–1990. After the collapse of communism, landscape and environmental protection were improved. Grassing over and afforestation are beneficial processes for landscape and nature preservation. However, land abandonment can also have negative consequences. Lipský [73], among others, mentions the expansion of invasive species or the extinction of some species of plants and animals. According to Reif and Vermouzek [74], the steep decline in bird populations is currently an extremely serious threat in Czechia and is associated with the intensification of agriculture production, which accelerated after Czechia joined the European Union [74]. The decline in the populations of farmland bird species in recent decades has become a significant problem in the European Union, and may be driven by agricultural intensification and other changes in the Common Agricultural Policies [75,76]. It remains to be seen if agri-environmental schemes will be effective in supporting farmland biodiversity [74,77].

3.6. Advantages and Limits of the Used Data

Our analysis and the findings mentioned above are based on historical data from cadastral records. The long-term research presented in our study was made possible mainly by the mapping of the Franciscan Cadastre, which was carried out around the middle of the 19th century. This was crucial to ensuring the consistency of the data during the study period for all of the examined years. As mentioned in the methodology, we used so-called stable territorial units, which were amalgamed from cadastres, and the maximal fluctuation in the size of STUs of different years was set at 2%. Regarding the comparability of land use classes during the study period, we used a simple legend (eight categories) because a more detailed categorization was not available for recent years. As a result, the categorization of the Stable Cadastre, which originally included more than 20 classes, could not be used. There may be some differences in the “quality” of individual land use classes in specific analyzed years because, for example, of the different management practices. However, these potential differences could not be taken into consideration because the appropriate data were inaccessible. Furthermore, the mapping approach/technique may differ (see [43]) in individual years. Regarding the quality and reliability of the data, it should be further noted that partly in 1990 and particularly in 2010, cadastral records were not always updated due to rapid landscape changes after the fall of communism, and some records lagged behind the current state of the landscape. In spite of these possible shortcomings of the data, we must emphasize the value and specificity of the used dataset, which enables the study of landscape changes spanning extensive time and spatial frames. Global research in land use and land cover changes cannot employ such a dataset and is mostly dependent on old maps or aerial photos available for only limited areas or time horizons [10,11,70], or on satellite remote sensing data that are available only from the 1970s [17,18,19,20,21,22,23,24,25].
Considering the potential of the data and methods used for landscape change evaluation in other parts of Europe, one limitation relates to the spatial extent of the Stable Cadastre, which only covers the countries located in the territory of the former Austro-Hungarian Empire. In these countries, our methods can be used for the same time period if data consistency is ensured. Previous comparable studies working with Franciscan Cadastre data were mostly carried out in Slovenia [15,44]. However, the importance of our study carried out for Czechia is mainly in the used methods. Their potential is broader, and the employed parameters can be applied to any area analyzed for any time period at the level of similar administrative units or can be upscaled on the level of districts, regions or countries. Cadastral data for various time horizons or digitized orthophotos are good source for such an analysis.

4. Conclusions

This analysis documents and evaluates major processes of landscape change, including their driving forces, in a large territory of the present-day Czechia over a long period of time (165 years). Our analysis demonstrates that the territory of Czechia represents a crossroads of historical events, drivers, and diverse types and directions of landscape changes in Central Europe.
In our study, it was demonstrated that changes in the landscape of Czechia during the period 1845–2010 reflect key historical events in Europe. The location of Czechia, in Central Europe and on the margin of the former Soviet bloc, played an important role.
Thus, Czechia represents a unique model area. The existence of two fundamentally different political and economic systems had large impacts on the landscape: “traditional” capitalism, which ruled between the mid-19th century and 1948, was replaced by “bureaucratic socialism” or, more precisely, the communist regime (1948–1989). The current period, since 1990, has been dominated by “modern” (global) capitalism.
Czechia is also a unique model area because detailed land use data for a long period of time are available. Land use data covering 165 years were surveyed for the purposes of the Land Registry, i.e., for taxation and market reasons. Few countries of the former Austrian Empire (for example, Austria, Slovenia, Czechia, Moravia, and Silesia) can provide the most valuable data source—the so-called Franciscan Cadastre, which was established in the middle of the 19th century [51,78]—and can use the data for long-term landscape change evaluation in combination with cadastral records from subsequent time horizons [43,44].
In this article, historical landscape changes were described in detail. Future developments, however, remain a mystery. What kind of factors will influence future changes in the landscape? The key factors will be the drivers that have acted at European and national levels since 1990; however, global factors (climatic change, pollution, biodiversity threats, food security, etc.) should also be taken into consideration.
Czechia is positioned “on the roof of Europe”, where water discharges into three different seas. Global warming has caused important changes in precipitation models (regarding volume, structure, and intensity) in recent decades, and this trend is likely to continue in future. Periods of drought appear to be the major challenge for Czech agriculture and forestry (68) [72], and will probably contribute to further diversification among agricultural practices in different regions, thus leading to specific regional impacts on the landscape and its utilization.
External factors are also important. Compared to some other EU countries, natural conditions are less favorable in Czechia and intensification schemes cannot be efficient. However, the trend of global population increase (concentrated particularly in African countries) may soon have opposing effects—increased demand for food and other agricultural products may encourage farmers to cultivate areas that are currently abandoned. Such changes have already occurred in the past [43,70,71]. Whatever changes occur in the future, our findings that contribute for the efficient monitoring of landscape changes in the entire country can be used for an effective management and preservation of valuable natural resources.

Author Contributions

Conceptualization, L.K. and I.B.; data analysis, L.K.; writing—original draft preparation, L.K., I.B., and L.J. All authors have read and agreed to the published version of the manuscript.

Funding

This research received no external funding.

Data Availability Statement

Publicly available datasets were analyzed in this study. This data can be found here: [https://www.lucccz.cz/databaze].

Acknowledgments

This work was supported by the Excellence grant project of the Czech Science Foundation P410/12/G113 “The Historical Geography Research Centre”. Part of the work of Lucie Kupková was supported by the Ministry of Education, Youth and Sports of the Czech Republic: Project [NPUI LO1417].

Conflicts of Interest

The authors declare no conflict of interest.

Appendix A

Figure A1. Underlying and Proximate Driving Forces of Landscape Change 1845–1896.
Land 10 00034 g0a1
Figure A2. Underlying and Proximate Driving Forces of Landscape Change 1896–1948.
Land 10 00034 g0a2
Figure A3. Underlying and Proximate Driving Forces of Landscape Change 1948–1990.
Land 10 00034 g0a3
Figure A4. Underlying and Proximate Driving Forces of Landscape Change 1990–2010.
Land 10 00034 g0a4

References

  1. Turner, B.; Skole, D.; Sanderson, S.; Fischer, G.; Fresco, L.; Leemans, R. Land-Use and Land-Cover Change: Science/Research Plan; IGBP Report No. 35/HDP Report No 7; IGBP: Stockholm, Sweden; Geneva, Switzerland, 1995. [Google Scholar]
  2. Lambin, E.F.; Turner, B.L.; Geist, H.J.; Agbola, S.B.; Angelsen, A.; Bruce, J.W.; Coomes, O.T.; Dirzo, R.; Fischer, G.; Folke, C.; et al. The causes of land-use and land-cover change: Moving beyond the myths. Glob. Environ. Chang. 2001, 11, 261–269. [Google Scholar] [CrossRef]
  3. Mather, A.S. The reversal of land-use trends: The beginning of the reforestation of Europe. In Land Use/Land Cover Changes in the Period of Globalization; Charles University, Faculty of Science: Prague, Czech Republic, 2002. [Google Scholar]
  4. Bürgi, M.; Hersperger, A.M.; Schneeberger, N. Driving forces of landscape change—current and new directions. Landsc. Ecol. 2004, 19, 857–868. [Google Scholar] [CrossRef]
  5. Antrop, M. Why landscapes of the past are important for the future. Landsc. Urban Plan. 2005, 70, 21–34. [Google Scholar] [CrossRef]
  6. Lambin, E.F.; Geist, H. (Eds.) Land-Use and Land-Cover Change: Local Processes and Global Impacts; Springer: Berlin/Heidelberg, Germany; New York, NY, USA, 2006. [Google Scholar]
  7. Aspinall, R.J.; Hill, M.J. (Eds.) Land Use Change: Science, Policy and Management; CRC Press: Boca Raton, FL, USA, 2007. [Google Scholar]
  8. Munteanu, C.; Kuemmerle, T.; Alix-Garcia, J.; Boltiziar, M.; Butsic, V.; Gimmi, U.; Halada, L.; Kaim, D.; Kiraly, G.; Konkoly-Gyuro, E.; et al. Forest and agricultural land change in the Carpathian region—A meta-analysis of long-term patterns and drivers of change. Land Use Policy 2014, 38, 685–697. [Google Scholar] [CrossRef]
  9. Plieninger, T.; Draux, H.; Fagerholm, N.; Bieling, C.; Bürgi, M.; Kizos, T.; Kuemmerle, T.; Primdahl, J.; Verburg, P.H. The driving forces of landscape change in Europe: A systematic review of the evidence. Land Use Policy 2016, 57, 204–214. [Google Scholar] [CrossRef] [Green Version]
  10. Bürgi, M.; Bieling, C.; von Hackwitz, K.; Kizos, T.; Lieskovský, J.; García Martín, M.; Printsmann, A. Processes and driving forces in changing cultural landscapes across Europe. Landsc. Ecol. 2017, 32, 2097–2112. [Google Scholar] [CrossRef] [Green Version]
  11. Cousins, S.A.O. Analysis of land-cover transitions based on 17th and 18th century cadastral maps and aerial photographs. Landsc. Ecol. 2001, 16, 41–54. [Google Scholar] [CrossRef]
  12. Skaloš, J.; Engstová, B.; Podrázský, V.; Šantrůčková, M.; Trpáková, I. Long-term changes in forest cover 1780–2007 in central Bohemia, Czech Republic. Eur. J. For. Res. 2012, 131, 871–884. [Google Scholar] [CrossRef]
  13. Kanianska, R.; Kizeková, M.; Nováček, J.; Zeman, M. Land-use and land-cover changes in rural areas during different political systems: A case study of Slovakia from 1782 to 2006. Land Use Policy 2014, 36, 554–566. [Google Scholar] [CrossRef]
  14. Štych, P.; Bičík, I.; Chromý, P.; Bláha, J.D. Case Study Areas Košťálkov, Klein Taxen: Change of Land Use Patterns 1823–2003. In Land Use/Cover Changes in Selected Regions in the World; Bičík, I., Himiyama, Y., Feranec, J., Štych, P., Eds.; IGU Commission on LUCC: Asahikawa, Japan; Charles University, Faculty of Science: Prague, Czech Republic, 2012; Volume VII. [Google Scholar]
  15. Momirski, L.A.; Gabrovec, M. Changes in land use in the Mediterranean terraced landscapes between 1819 and 2012: The case of two selected villages in Slovenia. In Land Use/Cover Changes in Selected Regions in the World; IGU Commission on LUCC: Asahikawa, Japan; Charles University, Faculty of Science: Prague, Czech Republic, 2014. [Google Scholar]
  16. Bucała-Hrabia, A. Long-term impact of socio-economic changes on agricultural land use in the Polish Carpathians 2017. Land Use Policy 2017, 64, 391–404. [Google Scholar] [CrossRef]
  17. Kuemmerle, T.; Hostert, P.; Radeloff, V.C.; van der Linden, S.; Perzanowski, K.; Kruhlov, I. Cross-border comparison of Post-socialist Farmland abandonment in the Carpathians. Ecosystems 2008, 11, 614–628. [Google Scholar] [CrossRef]
  18. Hansen, M.C.; Loveland, T.R. A review of large area monitoring of land cover change using Landsat data. Remote Sens. Environ. 2012, 122, 66–74. [Google Scholar] [CrossRef]
  19. Griffiths, P.; Müller, D.; Kuemmerle, T.; Hostert, P. Agricultural land change in the Carpathian ecoregion after the breakdown of socialism and expansion of the European Union. Environ. Res. Lett. 2013, 8, 045024. [Google Scholar] [CrossRef]
  20. Lehmann, E.A.; Wallace, J.F.; Caccetta, P.A.; Furby, S.L.; Zdunic, K. Forest cover trends from time series Landsat data for the Australian continent. Int. J. Appl. Earth Obs. Geoinf. 2013, 21, 453–462. [Google Scholar] [CrossRef]
  21. Zhu, Z.; Woodcock, C.E. Continuous change detection and classification of land cover using all available Landsat data. Remote Sens. Environ. 2014, 144, 152–171. [Google Scholar] [CrossRef] [Green Version]
  22. Gómez, C.; White, J.C.; Wulder, M.A. Optical Remotely Sensed Time Series Data for Land Cover Classification: A Review. ISPRS J. Photogramm. Remote Sens. 2016, 116, 55–72. [Google Scholar] [CrossRef] [Green Version]
  23. Feranec, J.; Hazeu, G.; Christensen, S.; Jaffrain, G. Corine land-cover change detection in Europe (case studies of the Netherlands and Slovakia). Land Use Policy 2007, 24, 234–247. [Google Scholar] [CrossRef]
  24. Feranec, J.; Jaffrain, G.; Soukup, T.; Hazeu, G. Determining changes and flows in European landscapes 1990–2000 using CORINE land cover data. Appl. Geogr. 2010, 30, 19–35. [Google Scholar] [CrossRef]
  25. Bontemps, S.; Arino, O.; Bicheron, P.; Brockman, C.C.; Leroy, M.; Vancutsem, C.; Defourny, P. Operational service demonstration for global land cover mapping: The GlobCover and GlobCorine experiences from 2005 and 2009. In Remote Sensing of Land Use and Land Cover: Principles and Applications; Giri, C.P., Ed.; CRC Press: Boca Raton, FL, USA, 2016; pp. 243–264. [Google Scholar]
  26. Kuemmerle, T.; Levers, C.; Erb, K.; Estel, S.; Jepsen, M.R.; Müller, D.; Plutzar, C.; Stürck, J.; Verkerk, P.J.; Verburg, P.H.; et al. Hotspots of land use change in Europe. Environ. Res. Lett. 2016, 11, 064020. [Google Scholar] [CrossRef]
  27. Levers, C.; Müller, D.; Erb, K.H.; Haberl, H.; Jepsen, R.M.; Metzger, M.J.; Meyfroidt, P.; Plieninger, T.; Plutzar, C.; Stürck, J.; et al. Archetypical patterns and trajectories of land systems in Europe. Reg. Environ. Chang. 2018, 18, 715–732. [Google Scholar] [CrossRef]
  28. Turner, B.L., II. The human causes of global environmental change. In Global Change and Our Common Future; Papers from a Forum; DeFries, R.S., Malone, T.F., Eds.; Committee on Global Change, National Research Council, National Academy Press: Washington, DC, USA, 1989. [Google Scholar]
  29. Krausmann, F.; Haberl, H.; Schulz, N.B.; Erb, K.; Darge, E.; Gaube, V. Land-use change and socio-economic metabolism in Austria—Part I: Driving forces of land-use change, 1950–1995. Land Use Policy 2003, 20, 1–20. [Google Scholar] [CrossRef]
  30. Mather, A.S. Driving Forces. In Our Earth’s Changing Land: An Encyclopedia of Land-Use and Land-Cover Change; Geist, H., Ed.; Greenwood Publishing Group: Westport, CT, USA, 2006. [Google Scholar]
  31. DeFries, R.S.; Rudel, T.K.; Uriarte, M.; Hansen, M. Deforestation driven by urban population growth and agricultural trade in the twenty-first century. Nat. Geosci. 2010, 3, 178–181. [Google Scholar] [CrossRef]
  32. Hesperger, A.M.; Gennaio, M.P.; Verburg, P.H.; Bürgi, M. Linking land change with driving forces and actors: Four conceptual models. Ecol. Soc. 2010, 15. Available online: http://www.ecologyandsociety.org/vol15/iss4/art1/ (accessed on 3 September 2018).
  33. Meyfroidt, P.; Lambin, E.F.; Erb, K.H.; Hertel, T.W. Globalization of land use: Distant drivers of land change and geographic displacement of land use. Curr. Opin. Environ. Sustain. 2013, 5, 438–444. [Google Scholar] [CrossRef]
  34. Terres, J.M.; Scacchiafichi, L.N.; Wania, A.; Ambar, M.; Anguiano, E.; Buckwell, A.; Coppola, A.; Gocht, A.; Nordström Källström, H.; Pointereau, P.; et al. Farmland abandonment in Europe:identification of drivers and indicators, and development of a composite indicator of risk. Land Use Policy 2015, 49, 20–34. [Google Scholar] [CrossRef]
  35. Levers, C.; Butsic, V.; Verburg, P.H.; Müller, D.; Kuemmerle, T. Drivers of changes in agricultural intensity in Europe. Land Use Policy 2016, 58, 380–393. [Google Scholar] [CrossRef] [Green Version]
  36. Krajewski, P.; Solecka, I.; Mrozik, K. Forest Landscape Change and Preliminary Study on Its Driving Forces in Ślęża Landscape Park (Southwestern Poland) in 1883–2013. Sustainability 2018, 10, 4526. [Google Scholar] [CrossRef] [Green Version]
  37. Szymura, T.H.; Murak, S.; Szymura, M.; Raduła, M.W. Changes in forest cover in Sudety Mountains during the last 250 years: Patterns, drivers, and landscape-scale implications for nature conservation. Acta Soc. Bot. Pol. 2018, 87, 1–14. [Google Scholar] [CrossRef]
  38. Aspinall, R.J. Basic and Applied Land Use Science. In Land Use Change: Science, Policy and Management; Aspinall, R.J., Hill, M.J., Eds.; CRC Press: Boca Raton, FL, USA, 2007; pp. 3–15. [Google Scholar]
  39. Van Vliet, J.; de Groot, H.L.F.; Rietveld, P.; Verburg, P.H. Manifestations and underlying drivers of agricultural land use change in Europe. Landsc Urban Plan 2015, 133, 24–36. [Google Scholar] [CrossRef] [Green Version]
  40. Meyfroidt, P. Approaches and terminology for causal analysis in land system science. J. Land Use Sci. 2016, 11, 501–522. [Google Scholar] [CrossRef]
  41. Geist, H.J.; Lambin, É.F. Proximate causes and underlying forces of tropical deforestation. BioScience 2002, 52, 143–150. [Google Scholar] [CrossRef]
  42. Erb, K.H.; Haberl, H.; Jepsen, M.R.; Kuemmerle, T.; Lindner, M.; Muller, D.; Reenberg, A. A conceptual framework for analysing and measuring land-use intensity. Curr. Opin. Environ. Sustain. 2013, 5, 464–470. [Google Scholar] [CrossRef] [PubMed] [Green Version]
  43. Bičík, I.; Kupková, L.; Jeleček, L.; Štych, P.; Winklerová, J.; Janoušek, Z. Land Use Changes in the Czech Republic 1845–2010: Socio-Economic Driving Forces; Springer International Publishing AG: Cham, Switzerland, 2015. [Google Scholar]
  44. Petek, F.; Gabrovec, M. A methodology for assessing the change in Land Use in Slovenia from the viewpoint of sustainable development. In Land Use/Land Cover Changes in the Period of Globalization, Proceedings of the IGU-LUCC International Conference Prague, Czech Republic, July 14–20 2001; Charles University: Prague, Czech Republic, 2001; pp. 168–179. [Google Scholar]
  45. Tian, P.; Li, J.; Gong, H.; Pu, R.; Cao, L.; Shao, S.; Shi, Z.; Feng, X.; Wang, L.; Liu, R. Research on Land Use Changes and Ecological Risk Assessment in Yongjiang River Basin in Zhejiang Province, China. Sustainability 2019, 11, 2817. [Google Scholar] [CrossRef] [Green Version]
  46. Cheng, M.; Huang, B.; Kong, L.; Ouyang, Z. Ecosystem Spatial Changes and Driving Forces in the Bohai Coastal Zone. Int. J. Environ. Res. Public Health 2019, 16, 536. [Google Scholar] [CrossRef] [Green Version]
  47. Purš, J. La fifusion asynchronique de la traction ả vapeur dans l’industrie en Europe au XIXe siècle (The asynchronous pull of steam traction in industry in Europe in the nineteenth century). In Colloques internationaux du Centre National de la Recherche Scientifique; No. 538; Centre national de la recherche scientifique: Paris, France, 1973; pp. 75–120. [Google Scholar]
  48. Purš, J. Complex Revolution of the Modern Age and Industrial Revolution. Historica 1980, 19, 135–170. [Google Scholar]
  49. Jeleček, L. Changes in the Production and Techniques in the Agriculture of Bohemia 1870–1945. In Agriculture in the Industrial State; Havinden, M.A., Collins, E.J.T., Eds.; Rural History Centre, University of Reading: Reading, UK, 1995; pp. 126–145. [Google Scholar]
  50. Jeleček, L. Historical development of society and LUCC in Czechia 1800–2000: Major societal driving forces of land use changes. In Land Use/Land Cover Changes in the Period of Globalization; Charles University: Prague, Czech Republic, 2002; pp. 44–57. [Google Scholar]
  51. Jeleček, L. Agricultural Revolution, Cadastre, East Central Europe, Industrial Revolution, Land reforms, Land rent, Southeast Europe, Technological Scientific Revolution (in Agriculture). In Our Earth’s Changing Land: An Encyclopedia of Land-Use and Land-Cover Change; Geist, H., Ed.; Greenwood Publishing Group: Westport, CT, USA, 2006. [Google Scholar]
  52. Přehled Československých Dějin 1848–1918; II/1; Nakladatelství ČSAV: Praha, Czech Republic, 1960.
  53. Historický Lexikon Obcí České Republiky 1869–2005. I. a II. Díl (Historical lexicon of the Municipalities of the Czech Republic 1869–2005. I. and II. Part); Český Statistický Úřad: Praha, Czech Republic, 2016.
  54. Bičík, I.; Kabrda, J. Land use changes in Czech border regions (1845–2000). AUC Geogr. 2007, 42, 23–52. [Google Scholar]
  55. Kučera, Z.; Chromý, P. Depopulation, resettlement and landscape changes in the peripheries of the Czech borderland. In The Political Ecology of Depopulation: Inequality, Landscape, and People; Paniagua, A., Bryant, R., Kizos, T., Eds.; Rolde Foundation, CEDDAR: Zaragoza, Spain, 2012. [Google Scholar]
  56. Kučera, Z.; Kučerová, S. Historical geography of persistence, destruction and creation: The case of rural landscape transformations in Czechia’s resettled borderland. Hist. Geogr. 2012, 38, 165–184. [Google Scholar]
  57. Kupková, L.; Bičík, I.; Najman, J. Land Cover Changes along the “Iron Curtain” 1990–2006. Geografie 2013, 118, 95–115. [Google Scholar] [CrossRef] [Green Version]
  58. Sýkora, L.; Ouředníček, M. Sprawling post-communist metropolis: Commercial and residential suburbanization in Prague and Brno, the Czech Republic. In Employment Deconcentration in European Metropolitan Areas; The GeoJournal Library, Razin, E., Dijst, M., Vázquez, C., Eds.; Springer: Dordrecht, The Netherlands, 2007; Volume 91, pp. 5762–5765. [Google Scholar]
  59. Bičík, I.; Kupková, L.; Kabrda, J. Changes of agricultural land use in Czechia 1990–2010. In Land Use/Cover Changes in Selected Regions in the World; Bičík, I., Himiyama, Y., Feranec, J., Kupková, L., Eds.; IGU Commission on LUCC: Asahikawa, Japan; Charles University, Faculty of Science: Prague, Czech Republic, 2015; Volume XI, pp. 59–70. [Google Scholar]
  60. Lipský, Z. Present land use changes in the Czech cultural landscape: Driving forces and environmental consequences. Morav. Geogr. Rep. 2001, 9, 2–14. [Google Scholar]
  61. Janáč, J.; Jeleček, L.; Chromý, P. LUCC in East Central and Southeast Europe post-communist countries from 1960s to the end of the 20th century and its historic-geographical roots. AUC Geogr. 2010, 2, 9–30. [Google Scholar]
  62. Pazúr, R.; Lieskovský, J.; Feranec, J.; Oťaheľ, J. Spatial determinants of abandonment of large scale arable lands and managed grasslands in Slovakia during the periods of post-socialist transition and European Union accession. Appl. Geogr. 2014, 54, 118–128. [Google Scholar] [CrossRef]
  63. Pazúr, R.; Kopecká, M.; Feranec, J. Changes of artificial surfaces of Bratislava in 2006–2012 identified by the Urban Atlas data. In Land Use/Cover Changes in Selected Regions in the World; Bičík, I., Himiyama, Y., Feranec, J., Kupková, L., Eds.; IGU Commission on LUCC: Asahikawa, Japan; Charles University, Faculty of Science: Prague, Czech Republic, 2015; pp. 37–42. [Google Scholar]
  64. Cegielska, K.; Noszczyk, T.; Kukulska, A.; Szylar, M.; Hernik, J.; Dixon-Gough, R.; Jombach, S.; Valánszki, I.; Filepné Kovács, K. Land use and land cover changes in post-socialist countries: Some observations from Hungary and Poland. Land Use Policy 2018, 78, 1–18. [Google Scholar] [CrossRef]
  65. Gellrich, M.; Baur, P.; Koch, B.; Zimmermann, N.E. Agricultural land abandonment and natural forest re-growth in the Swiss mountains: A spatially explicit economic analysis. Agric. Ecosyst. Environ. 2007, 118, 93–108. [Google Scholar] [CrossRef]
  66. van der Sluis, T.; Pedroli, B.; Kristensen, S.B.P.; Cosor, G.L.; Pavlis, E. Changing land use intensity in Europe—Recent processes in selected case studies. Land Use Policy 2016, 57, 777–785. [Google Scholar] [CrossRef]
  67. Osawa, T.; Kohyama, K.; Mitsuhashi, H. Multiple factors drive regional agricultural abandonment. Sci. Total Environ. 2016, 542, 478–483. [Google Scholar] [CrossRef] [PubMed]
  68. Hampl, M.; Müller, J. Společenská transformace a regionální diferenciace Česka: Příklad vývoje rozmístění pracovních míst a obyvatelstva (Societal transformation and regional differentiation in Czechia: Development in the distribution of job opportunities and population). Geografie 2011, 116, 211–230. [Google Scholar] [CrossRef] [Green Version]
  69. Jeleček, L. Development of modern cadastre and cadastral mapping: Cadastre as major information source of LUCC research in Czechia. Acta Geogr. Univ. Comen. 2006, 49, 37–51. [Google Scholar]
  70. Fuchs, R.; Herold, M.; Verburg, P.H.; Clevers, J.G.P.W.; Eberle, J. Gross changes in reconstructions of historic land cover/use for Europe between 1900 and 2010. Glob. Chang. Biol. 2015, 21, 299–313. [Google Scholar] [CrossRef]
  71. Jepsen, M.R.; Kuemmerle, T.; Muller, D.; Erb, K.; Verburg, P.H.; Haberl, H.; Vesterager, J.P.; Andrivc, M.; Antrop, M.; Austrheim, G. Transitions in European land-management regimes between 1800 and 2010. Land Use Policy 2015, 49, 53–64. [Google Scholar] [CrossRef]
  72. Trnka, M.; Brázdil, R.; Vizina, A.; Dobrovolný, P.; Mikšovský, J.; Štěpánek, P.; Hlavinka, P.; Řezníčková, L.; Žalud, Z. Droughts and Drought Management in the Czech Republic in a Changing Climate. In Drought and Water Crises, 2nd ed.; Wilhite, D.A., Pulwarty, R.S., Eds.; CRC Press, Taylor & Francis: Boca Raton, FL, USA, 2017; pp. 461–480. [Google Scholar]
  73. Lipský, Z. Kam se ubírá česká krajina? Geogr. Cassoviensis 2010, IV, 77–83. [Google Scholar]
  74. Reif, J.; Vermouzek, Z. Collapse of farmland bird populations in an Eastern European country following its EU accession. Conserv. Lett. 2018, 12, e12585. [Google Scholar] [CrossRef]
  75. Donald, P.F.; Sanderson, F.J.; Burfield, I.J.; van Bommel, F.P.J. Further evidence of continent-wide impacts of agricultural intensification on European farmland birds, 1990–2000. Agric. Ecosyst. Environ. 2006, 116, 189–196. [Google Scholar] [CrossRef]
  76. Jerrentrup, J.S.; Dauber, J.; Strohbach, M.W.; Mecke, S.; Mitschke, A.; Ludwig, J.; Klimek, S. Impact of recent changes in agricultural land use on farmland bird trends. Agric. Ecosyst. Environ. 2017, 239, 334–341. [Google Scholar] [CrossRef]
  77. Batary, P.; Dicks, L.V.; Kleijn, D.; Sutherland, W.J. The role of agri-environment schemes in conservation and environmental management. Conserv. Biol. 2015, 29, 1006–1016. [Google Scholar] [CrossRef] [Green Version]
  78. Kain Roger, J.P.; Baigent, E. The Cadastral Map in the Service of the State. A History of Property Mapping; University of Chicago Press: Chicago, IL, USA, 1992. [Google Scholar]
Figure 1. Physical map of Czechia.
Land 10 00034 g001
Figure 2. Major processes and intensity of landscape change between 1845 and 1896.
Land 10 00034 g002
Figure 3. Major processes and intensity of landscape change between 1896 and 1948.
Land 10 00034 g003
Figure 4. Major processes and intensity of landscape change between 1948 and 1990.
Land 10 00034 g004
Figure 5. Major processes and intensity of landscape change between 1990 and 2010.
Land 10 00034 g005
Figure 6. Area of land use classes in Czechia in years 1845, 1948, 1990, and 2010 (in %).
Land 10 00034 g006
Table 1. Data sources used, type and scale of original cadastral maps for the land use calculations.
YearSource of the Numerical Land Use DataType and Scale of the Cadastral Maps Used for the Calculation
of Land Use Classes Areas
1845Stable Cadaster records stored by Central Land Survey and Cadaster Archive filesStable Cadaster maps
1:2880
1896Cadastral records stored by Central Land Survey and Cadaster Archive filesRevised maps of Stable Cadaster
1:2880
1948Cadastral records stored by Central Land Survey and Cadaster Archive filesLand Cadaster maps
1:2000
1990Computerized database of cadastral records stored by the Czech Office for SurveyingReal Estate Cadaster maps
1:1000
2010Computerized database of cadastral records stored by the Czech Office for SurveyingReal Estate Cadaster maps
1:1000
Table 2. Major processes of landscape change in Czechia during 1845–2010.
Period1845–18961896–19481948–19901990–2010
Process of Landscape
Change
Total Number of STUsArea (%)Total Number of STUsArea (%)Total Number of STUsArea (%)Total Number of STUsArea (%)
Agricultural intensification610970.5105810.34963.44703.4
Increase in permanent grasslands3763.58097.012659.6282533.8
Afforestation175919.3353139.0185919.85956.9
Urbanization1171.5239532.0517967.0130519.7
Stability (less than 1% of STU area changed)4515.2101911.8330.2363736.3
Publisher’s Note: MDPI stays neutral with regard to jurisdictional claims in published maps and institutional affiliations.

