Article

Urban Green Fabric Analysis Promoting Sustainable Planning in Guatemala City

by
Fernando Castillo-Cabrera
1,2,*,
Thilo Wellmann
1,3 and
Dagmar Haase
1,3
1
Landscape Ecology Lab, Department of Geography, Humboldt-Universität zu Berlin, 10099 Berlin, Germany
2
Centro de Estudios Conservacionistas-CECON-, Facultad de Ciencias Químicas y Farmacia, Universidad de San Carlos de Guatemala, 01010 Ciudad de Guatemala, Guatemala
3
Department of Computational Landscape Ecology, Helmholtz Centre for Environmental Research—UFZ-, 04318 Leipzig, Germany
*
Author to whom correspondence should be addressed.
Land 2021, 10(1), 18; https://doi.org/10.3390/land10010018
Submission received: 30 October 2020 / Revised: 22 December 2020 / Accepted: 24 December 2020 / Published: 29 December 2020

Abstract

:
Urbanization rate in Central America is the second fastest worldwide and its major cities face challenges regarding urban sustainability. Urban Green Fabric (UGF) is an important material condition for the urban quality of life and, therefore, key to planning processes. We performed an analysis of the UGF of Guatemala City including the identification and classification of UGF, their spatial pattern analysis, construction of ensembles of districts (zones) and revealing citizen’s interactions with UGF. We used remote sensing and land use mapping techniques, spatial metrics and a questionnaire survey. Main results are the UGF map of Guatemala City and six ensembles of zones based on a set of indicators. We further revealed citizens’ recognition of green spaces, their perceptions about green space amount and availability as well as their support for UGF future interventions. Finally, we discuss the implications for planning promoted by our results and suggest three actions for UGF sustainability: Creation of new green spaces, protecting existing green spaces and enhancing the mosaic with different green spaces types. UGF is an essential decision support tool for a diversity of actors.

1. Introduction

The rate of urbanization in Central America is the second fastest in the world [1]. At present, Central American nations exhibit an increase in urban population reflected in positive average annual rate of change for the period 2015–2020. According to the United Nations [2] the lowest are Nicaragua (1.45%), El Salvador (1.57%) and Costa Rica (1.95%), followed by Panamá (2.06%) and Belize (2.32%) and the highest, Guatemala (2.68%) and Honduras (2.75%). These cities face challenges such as overcoming social exclusion, minimizing vulnerability to extreme natural events and boosting economic opportunities [1].
Historically, urbanization processes created capitals in this region as urban agglomerations with three characteristics: (1) the urban economy is very important for each nations GDP (78%), (2) a negative impact on the nations’ environments and (3) a high degree of concentration of political decisions [3]. This pattern could be explained because capitals can provide better job opportunities and living conditions, as well as better access to basic services [4]. However, they have also experienced extreme social inequalities and violence between civilians since the end of 20th century [5].
Studies show that Central America, including the Caribbean, is one of the most hazard-prone areas in the world [6] and, with changes in global climate patterns, its economy and environment will continue to affect and exacerbate socioeconomic and ecological vulnerabilities in the region [7]. Therefore, as urbanization processes continue to expand, the region will face an increase in threats to its environment, which suggests the need for land planning as a priority issue [8]. As such, urban green is fundamental for steering urbanization processes away from valuable ecosystems that provide multiple benefits while at the same time improving the quality of life of urban dwellers.
Cites of the Global South face challenges with contrasting paths [9] regarding urban green. These paths include the preservation and expansion of urban green in the face of new housing developments and transport infrastructures that influence important aspects of quality of life such as recreation and public health. Thus, acknowledging the role of urban green in the city is central to treading these paths and better urban living.

1.1. Urban Green

The term “urban green” can have multiple definitions and it is important to define it clearly in order to allow for a better understanding between disciplines without sacrificing a situated perspective [10]. Here we recognize that urban settlements can be represented by three components: urban grey, defined as all built objects, urban blue representing water bodies and urban green, which describes vegetation in general. Urban green is worldwide recognized as key to address urban resilience and sustainability [11,12]. There is evidence that urban green contributes to quality of life in a variety of ways including health and social wellbeing [13,14,15], boosting economic activities [16,17] and reducing environmental burdens [18,19].
One recent concept derived from urban green is urban green infrastructure (UGI). This ambiguous concept [20] with advantages and criticisms, is widely used and is gaining momentum predominantly in cities of the global North [21,22]. It either describe a design or landscape planning approach [21,23] that helps guiding urban development [24] from a network and systems perspective [25].
Criticisms of the UGI terminology include the western idea of modernization, progress and a sense that this engineered type of nature may be neither needed nor suitable for an inclusive sustainable development [26,27]. UGI may not pay attention to hearing voices from citizens because is considered a universal and expert-driven management solution or device for tackling environmental problems [28,29]. The concept still presents nature in the city as decoupled from social production of space [30,31]. All the above can potentially lead planning astray by assuming that any intervention is sustainable if it looks green or smart, does not appear as dangerous wilderness and can be brought to the city; creating an illusion of urban green nature [32]. Nevertheless, advantages of UGI comprise its multifunctionality, multiscale and connectivity purposes [24,33] used as a tool for urban sprawl control [34] climate change mitigation and adaptation [35,36] and health promotion [37]. It can also include technological approaches in cities to address specific challenges related to water [38]. From an urban planning perspective, it reinforces collaborative work between social agents because of its integrative and strategic character [39,40]
In Latin America, the use of UGI happens in many fields [41,42]. The concept probably circulated through institutional discourses, paradigms or academic channels similar to other urban ideas, as has been suggested by scholars [43,44]. This show how widespread this concept is although there is still a void in the use of UGI in the tropical and equatorial areas of the world [45]. Throughout Latin America, urban green elements are synonyms with green areas, green zones, green spaces and open spaces, even being considered urban services [46,47].
Practices and concepts from the global North, such as UGI, should be contested before being adopted in other parts of the planet because each city has its own values and knowledge dynamics regarding urban green [48] because urbanization processes are not universal [49]. Therefore, before adopting UGI as a “taken-for-granted idea” [50] that can become a “simplification syndrome” [51] in the understanding of the relationships between urban green and the different urbanization processes around the planet, we must take local specificities into account in order to adapt concepts and categories of urban green to specific cities. This is in line with the call to use a provincialized or situated perspective of urban ideas [52,53]. With this, we follow what one Central American scholar has called “the false mirror of the Latin American city” in which ideas about what the urban is are legitimized not by a comparison with global North cities but rather from a plurality of ideas derived from different internal collectivities and knowledges [44].

1.2. Urban Green Fabric of Guatemala City

In Spanish, the word “infrastructure” has two meanings. One meaning is related to the unseen work that supports other work while the other meaning refers to the set of elements that allow for the functioning of any kind of organization [54]. The latter has a more horizontal or relational dimension that aligns with the concept of fabric. Fabric in urban studies is conceptualized as the material element and environment that enables transportation styles to function. It also refers to the street network that influences the development of land uses [55]. Urban green can be a fabric [56] that allows for the circulation of biodiversity and interactions between humans and nature in the city. It can be made of different wefts, material ones like vegetated surfaces in streets, blocks, plots or even built-up objects and ecological cycles but also of non-material as the relationships established between urban green elements and the citizens.
In this paper, we use “Tejido Verde Urbano” or Urban Green Fabric (UGF) from the Guatemalan context. This concept is a metaphor from the textile world that reveals how enmeshed urban green is within the social fabric and how it allows the city to be thought of as a system of encounters, material interactions and communications [57]. Since urban green fabric is co-produced with the social fabric, its spatial representation corresponds with social processes as well. By using urban land-use patterns, we can partially understand these processes. By understanding citizens’ perceptions, values or knowledges regarding urban green, we can show a non-material weft of this fabric. Furthermore, many stakeholders from different organizations in Guatemala City have adopted the concept recently, including urban blue for the metropolitan area [58].
We suggest UGF main material weft are urban green spaces (UGS). They are types of spaces in the city that have vegetation with human dimension through design, management, planning and use. As such, they are socio-ecological outcomes of historical land use practices, planning approaches but also of citizens’ engagement, concerns and struggles. Recently, obtaining a detailed dataset of UGF is considered necessary for the adequate management of cities [59], especially in ones with sparse public environmental data.
This need for detailed data leads to the use of high-resolution remote sensing images and land-use maps as a logical approach for mapping and classifying UGF in detail. High-resolution images that improve the detail of mapped urban features are important as tools for studying the land cover of urban areas [60]. On the other hand, land use reveals the motives behind land cover manipulation [61] and reflects human intentions and influences on the land. Combining form and function through land cover and land use [62] is a promising path for assessing urban green in cities from a socio-ecological and multiscale perspective.
Comprehensive spatial information on UGF is incomplete in the spatial information records of Guatemala City. Therefore, this study conducted an analysis of the UGF of Guatemala City at the city and zones scales to support recent planning efforts of the city like the ongoing process for a new Plan Director 2040 and the zones’ local plans [63]. Additionally, residents’ insights regarding matters of UGF are seldom taken into account, although residents in Central American cities long ago acknowledged two main issues of interest: citizen security and environmental degradation [3] which in Guatemala City, both are related to the UGF. By revealing residents insights or interactions with UGF we are dealing with the non-material weft of the green fabric.
The analysis of UGF presented in this paper was based on the following guiding research questions: Which are the UGF elements of Guatemala City? What is the distribution, amount, configuration and composition spatial pattern of the UGF elements? Which interactions of citizens exist regarding UGF? Finally, we engage into the implications of these outcomes for promoting sustainable urban planning in Guatemala City and beyond.

2. Materials and Methods
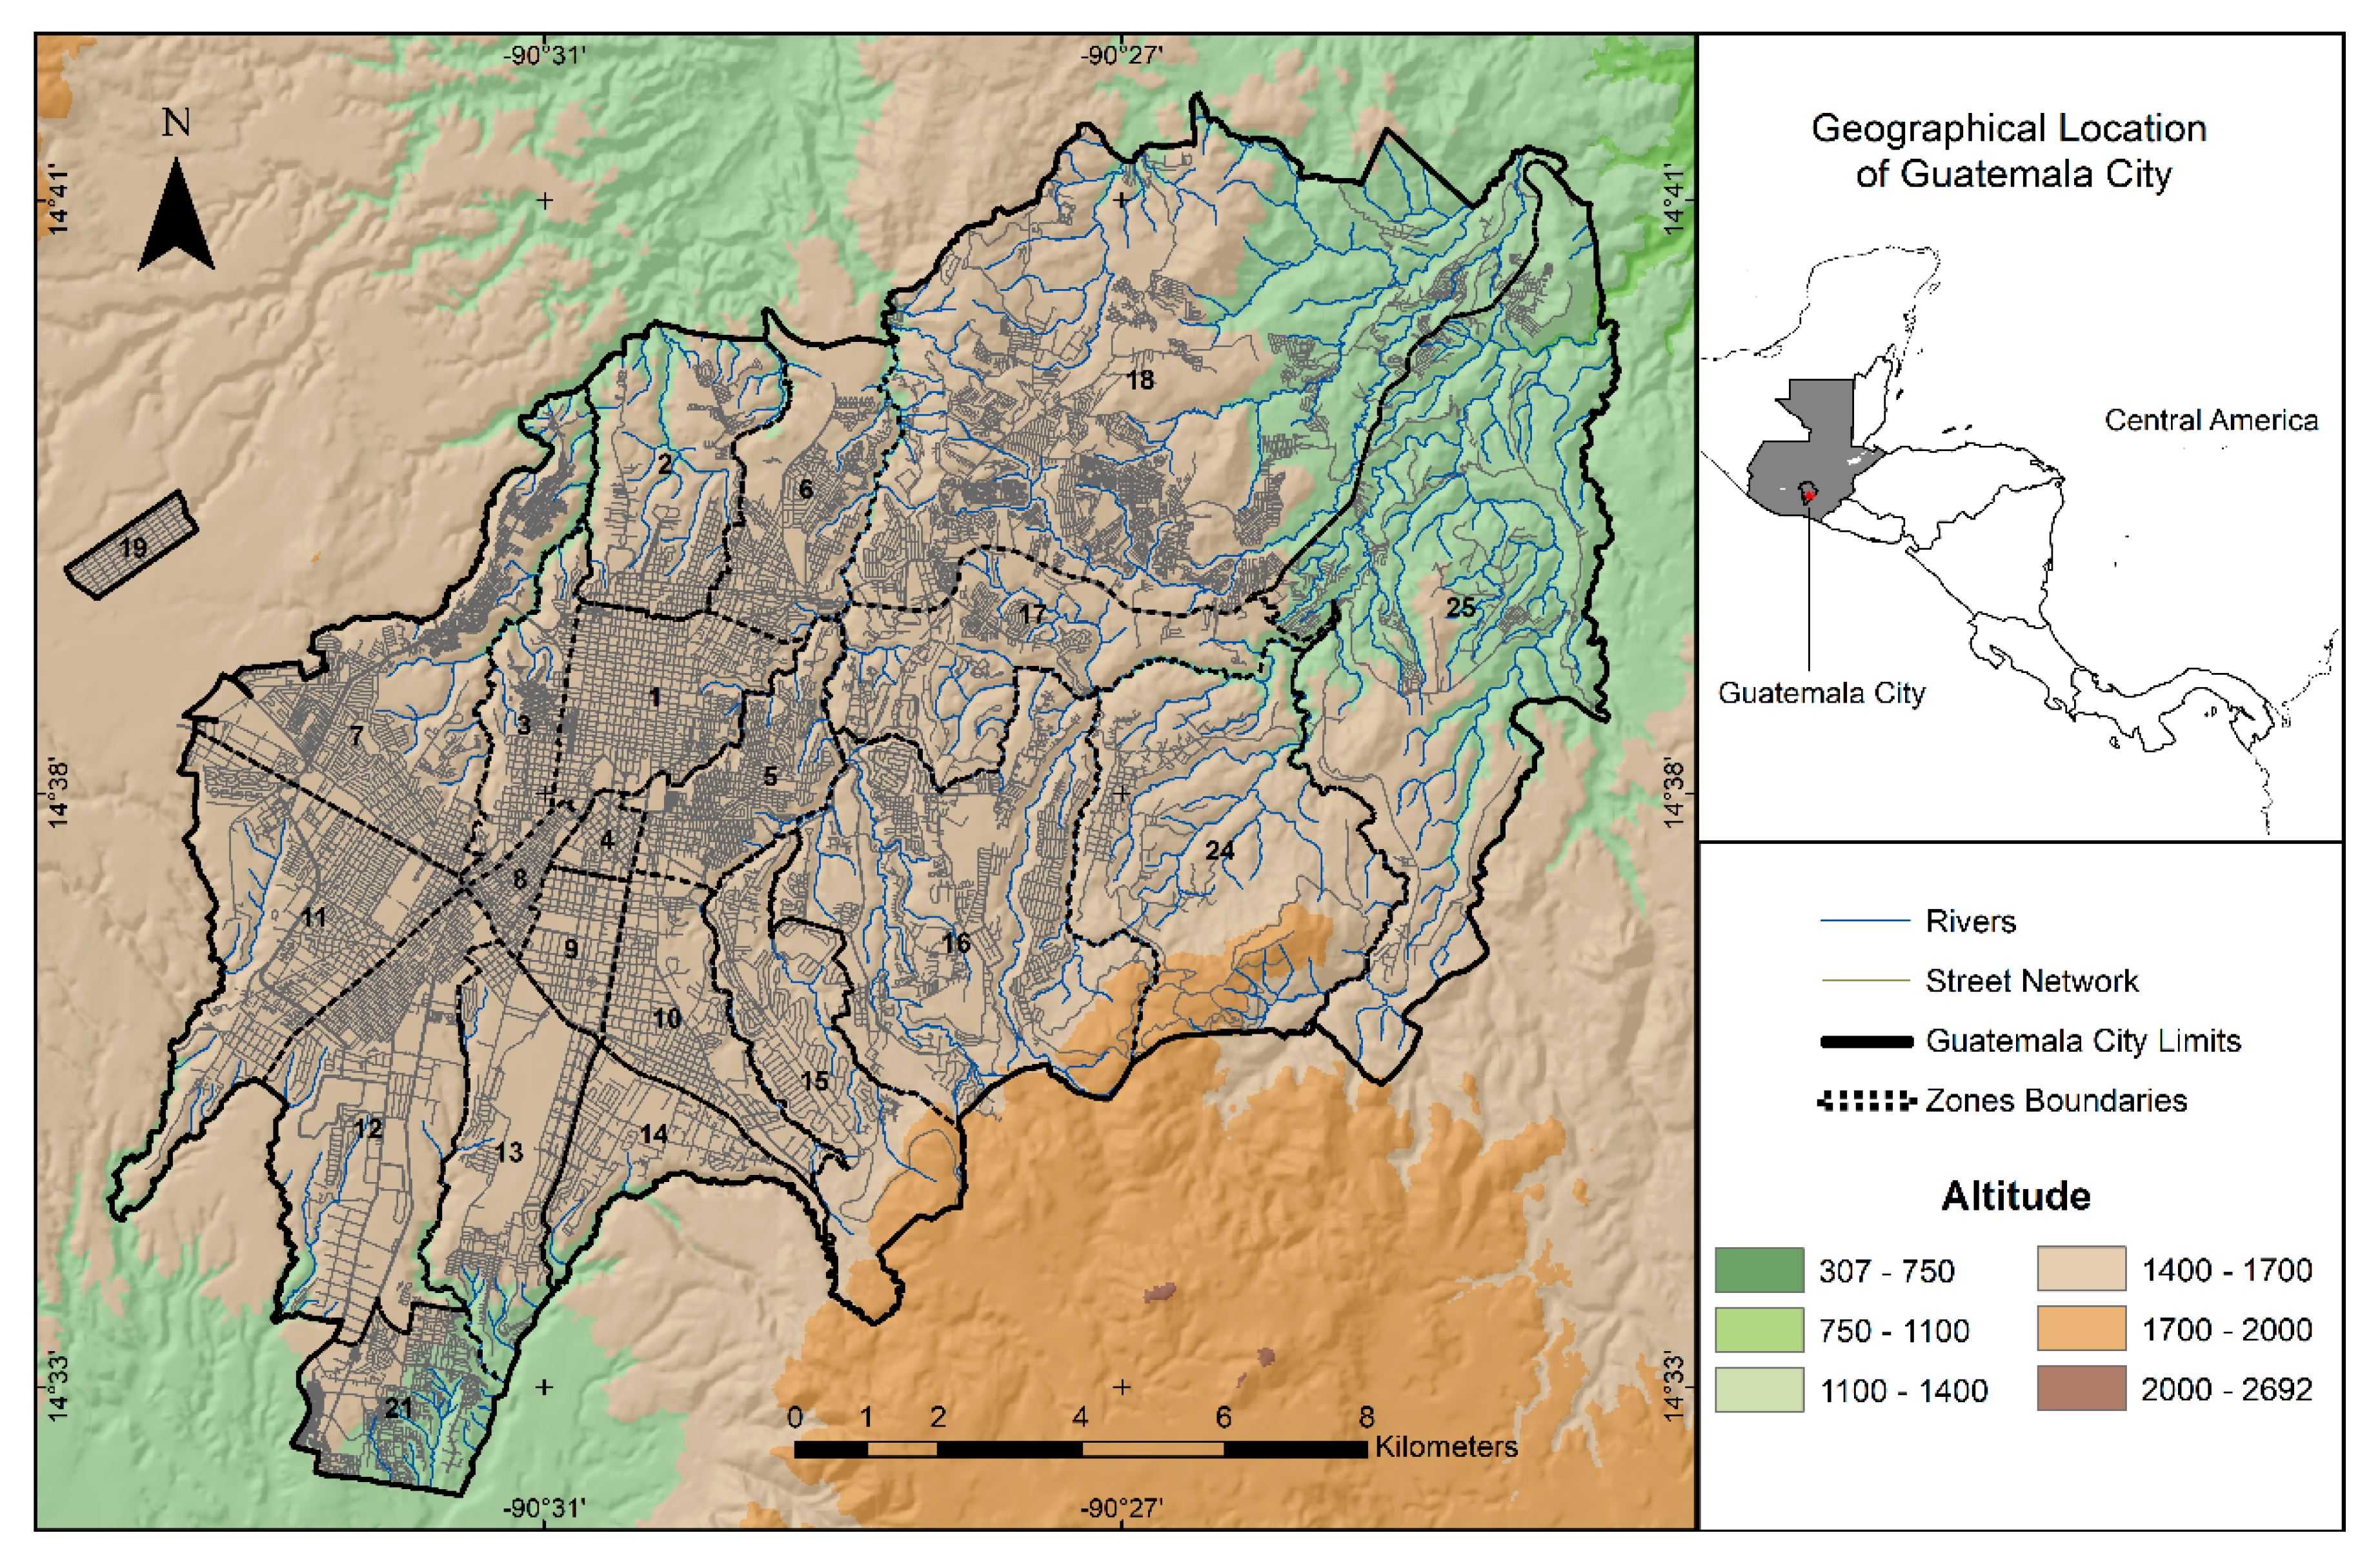
2.1. Study Area

Guatemala City is located at 14°37′ N and 90°30′ W in the Central Highlands. The city features a temperate and humid climate with dry and rainy seasons (Figure 1), an average of 1266 mm of precipitation and an annual mean temperature of 18.8 °C [64]. The city has 21 zones and has a population of approximately 1 million residents [65]. Although the city has been considered a metropolitan area since the 1970s [66,67], in this study Guatemala City is included only within the borders of the Municipality of Guatemala because urban planning happens at this level.

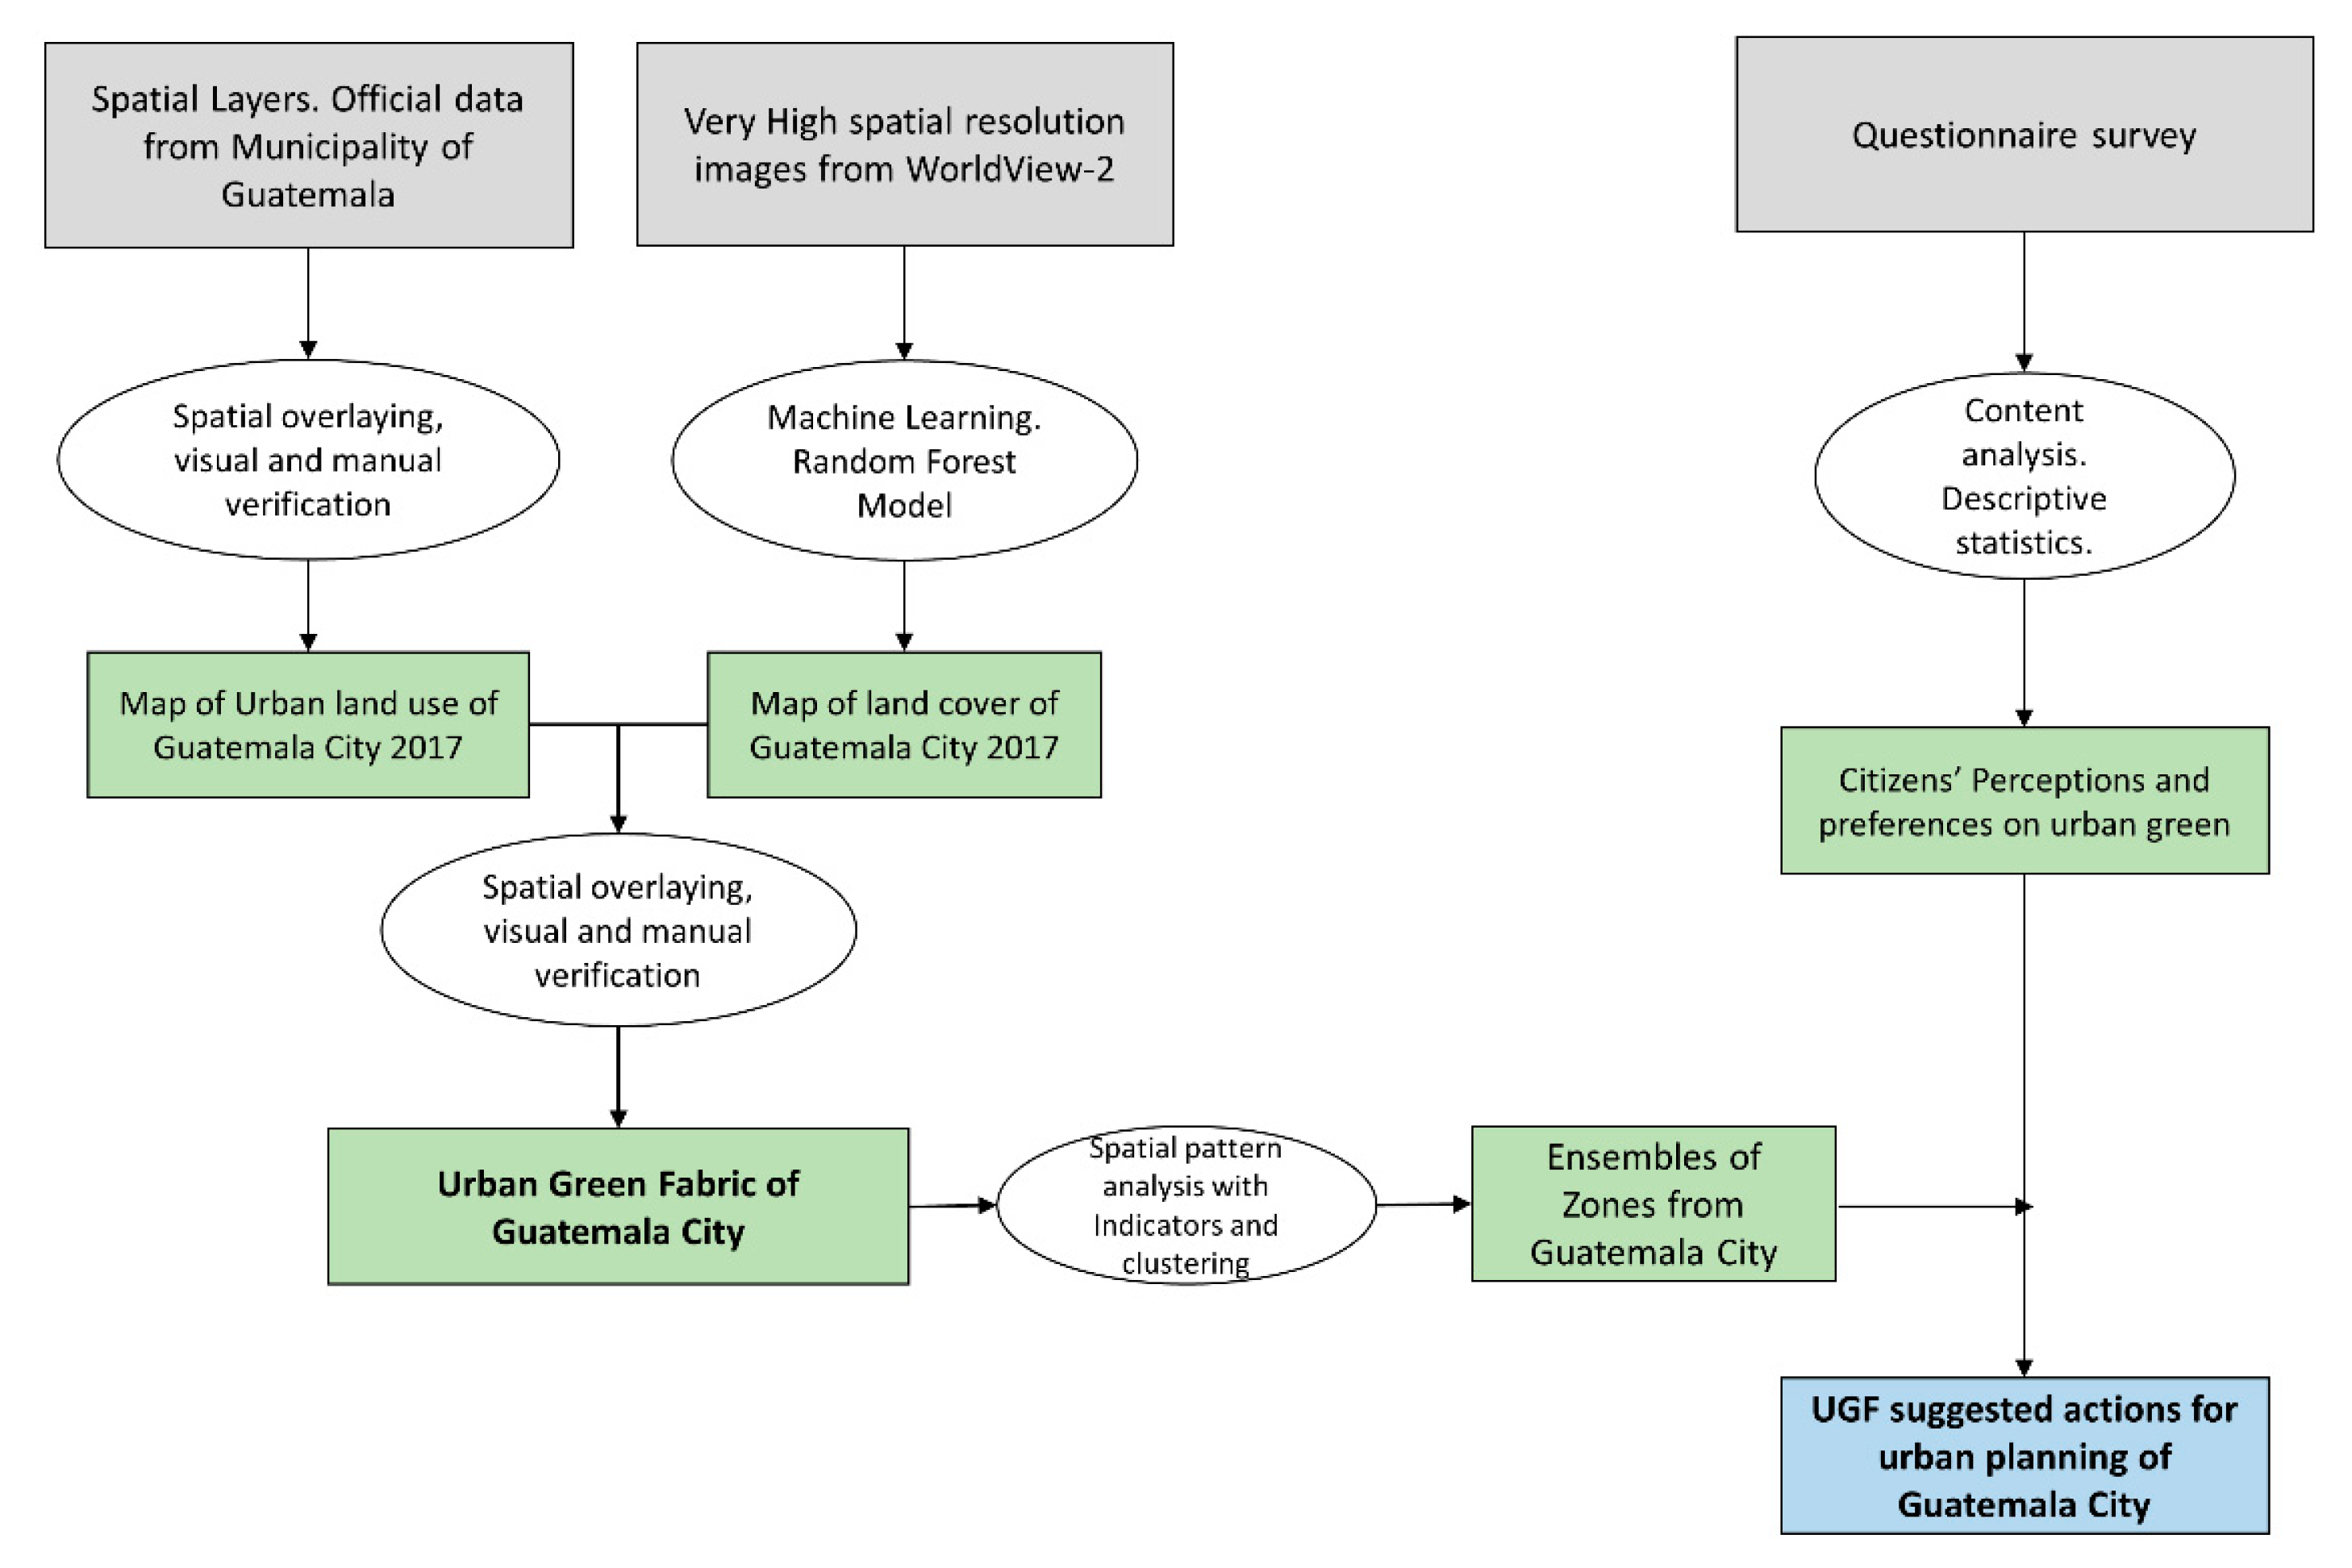
2.2. Methodological Approach

Our methodological approach used a combination of remote sensing, urban land mapping, spatial analysis and a social quantitative method. We identified and classified UGF in the city. We calculated indicators that enabled us to group diverse ensembles of zones with similar UGF spatial characteristics. Finally, we analyzed citizen’s interactions with UGF through perceptions and preferences using a questionnaire survey (Figure 2).

2.2.1. Urban Green Fabric Analysis

We started by mapping land cover using remote sensing data. Then, we mapped urban land use using official data of the Municipality of Guatemala. Then, we combined both layers via spatial overlaying [68] and identified the main material weft of the green fabric of the city, that is: urban green spaces.
For the land cover map, we employed very high-resolution data from the satellite WorldView-2. These images are valuable for a detailed identification of urban covers because of their high spatial resolution (1.8m) [69], which makes them suitable for big-scale urban green detection [70]. We used two radiometrically corrected images from February 27, 2017. We applied a random forest (RF) model, a machine learning algorithm in which an ensemble of decision trees perform a majority vote to find the most probable class membership [71]. This model provides robust results for different types on input data while at the same time need low computation time and few tuning parameters [72] (See Figure S1).
We trained the RF model with 339 reference points using the eight spectral bands plus two indices that express plant photosynthetic capacity [73,74]: the normalized difference vegetation index (NDVI) and the soil-adjusted vegetation index (SAVI). The latter has advantages in contrasting soil backgrounds like urban areas [75,76]. We used 500 trees for the model using RF module in the EnMAP-Box [77]. Four target classes were classified: woody vegetation (bushes and trees), herbaceous vegetation (irrigated grass that is natural or designed, some crops from herbaceous or vine species), soil (agricultural soil as well as dry grasses) and built-up areas (concrete, streets, asphalt, buildings, mines). In order to differentiate between shadows caused by trees over soil and shadows caused by buildings, we did a manual reclassification of the urban cover in shadowed areas and derived a shadow mask by training a separate RF model for all urban areas. For validation, we randomly distributed 550 points over the study area. We manually assessed these points with the panchromatic worldview images, imagery available from Google Earth, as well as on site when class membership was unclear.
For the land use map, we updated existing land-use map at the block and plot levels based on spatial layers provided by the Municipality of Guatemala; we used also online resources and our knowledge of the city (see Figure S2).
Finally, to identify and classify UGS we combined both layers of land cover and land map. The classification consisted of 13 types (see Table 1) which are based on modifications and adaptations of international typologies [47,78,79,80]. For this study, urban wetlands are not present in the city and it is not possible to identify vertical green spaces with the approach used and described here. First, we did not include plots with less than 10m2 of tree cover and 10m2 of herbaceous cover and that this combination was less than 1% of share of the total plot area. This was to avoid overestimation of green spaces area due to pixel green cover misclassification. Second, we selected any land use that followed the FAO definition of forest and classified those spaces as urban forested spaces. Third, we manually and visually reviewed the result of the overlay and assigned these pixels an UGS type. Some spaces were identified manually due to lack of information on land use or lack of information on the plot size.

2.2.2. Spatial Pattern Characteristics of Urban Green Fabric

We assessed spatial characteristics of UGF at the city level based solely on UGS. We calculated the Moran’s I index, to look for the spatial pattern using ArcGIS 10.5 [81]. At the zone level, we calculated a bundle of comprehensive indicators for quantifying the amount, distribution, configuration and composition of UGS. Then, based on these indicators, we constructed ensembles of zones with similar characteristics.
First, we calculated population density, which represents the relationship between an area and the population. This gives us a nuanced idea of the use of an urban area [82]. Further, street density indicates the ratio of the total length of a street to an area. Denser street networks can suggest variable ways to access different spaces [83]. Total green space express the amount of urban space used for green or how much urban space have designed and managed vegetated surfaces. Green space per capita represents the ratio between total green space area and total population.
Then, we estimated indicators of configuration and composition based on spatial metrics, considering the build-up areas as the matrix and UGS as the patches in between [84]. Using Fragstats 4.2 [85], we chose the metrics according to previous studies, which successfully describe the physical characteristics of green spaces in the city [86,87,88]. We applied a principal component analysis to the spatial metrics in order to reveal which metrics were redundant. The selected metrics in each zone were, according to composition: Largest Patch Index, Relative Patch Richness, Shannon Diversity Index, Modified Simpson’s Evenness Index; and according to configuration: Number of Patches, Perimeter-Area Fractal Dimension, Contagion, Effective Mesh Size and Aggregation Index. Later, we performed a min-max transformation to all indicators and then we calculated the Euclidean dissimilarity matrix. Finally, we constructed the ensembles of zones by grouping them using clustering techniques with all the indicators described before applying the Ward distance for the implemented cluster analysis in R [89].

2.2.3. Citizens’ Interactions with the Urban Green Fabric

UGF main elements –UGS- are spaces of encounter, recreation and political and festival activities [91]. Therefore, we understood interactions between citizens and UGF in terms of how they experienced the cities’ green spaces with their bodies and senses. This experience can be revealed through questions about preferences and perceptions [92] and thus can be thought of as part of the non-material dimension weft of the UGF.
We used five items from a questionnaire survey conducted in June 2017 in Guatemala City. We implemented a stratified random sampling design using total population of zones as a stratification variable using the 2002 official census, which was also valid for the 2018 census [65,93]. The estimated sample size with a 95% level of confidence and ± 5 confidence interval was 385. The final sample was of 434. The strategy for reaching households was a combination of random measures and the technique was face to face. Potential respondents included citizens above 15 years old.
The items in the questionnaire related to urban green spaces were part of the second section of the instrument. The first item referred to knowledge and recognition of UGS. From a list of 11 types and with an option of “open answer,” citizens recognized the ones they considered to be spaces where they had contact with nature.
The second and third items were related to the amount and number of green spaces, we asked: which zone, according to them, had more green spaces. The number of times a zone was mentioned was recorded and counted. Then we compared this frequency to actual green space amount in each zone (we included only visible and public green: parks, plazas and street green). Data were standardized using a min-max procedure. Third item asked citizens if they believed that they had enough green space in the zone where they lived. We calculated the percentage of yes/no answers.
The fourth and fifth items relate to preferences and willingness to support planning interventions in some UGS and are thus, linked to ongoing processes of planning [63]. Both used a Likert type response with a follow up open question regarding the reasons for their answers. We used MAXQDA 2020 [94] to analyze open questions results.

3. Results

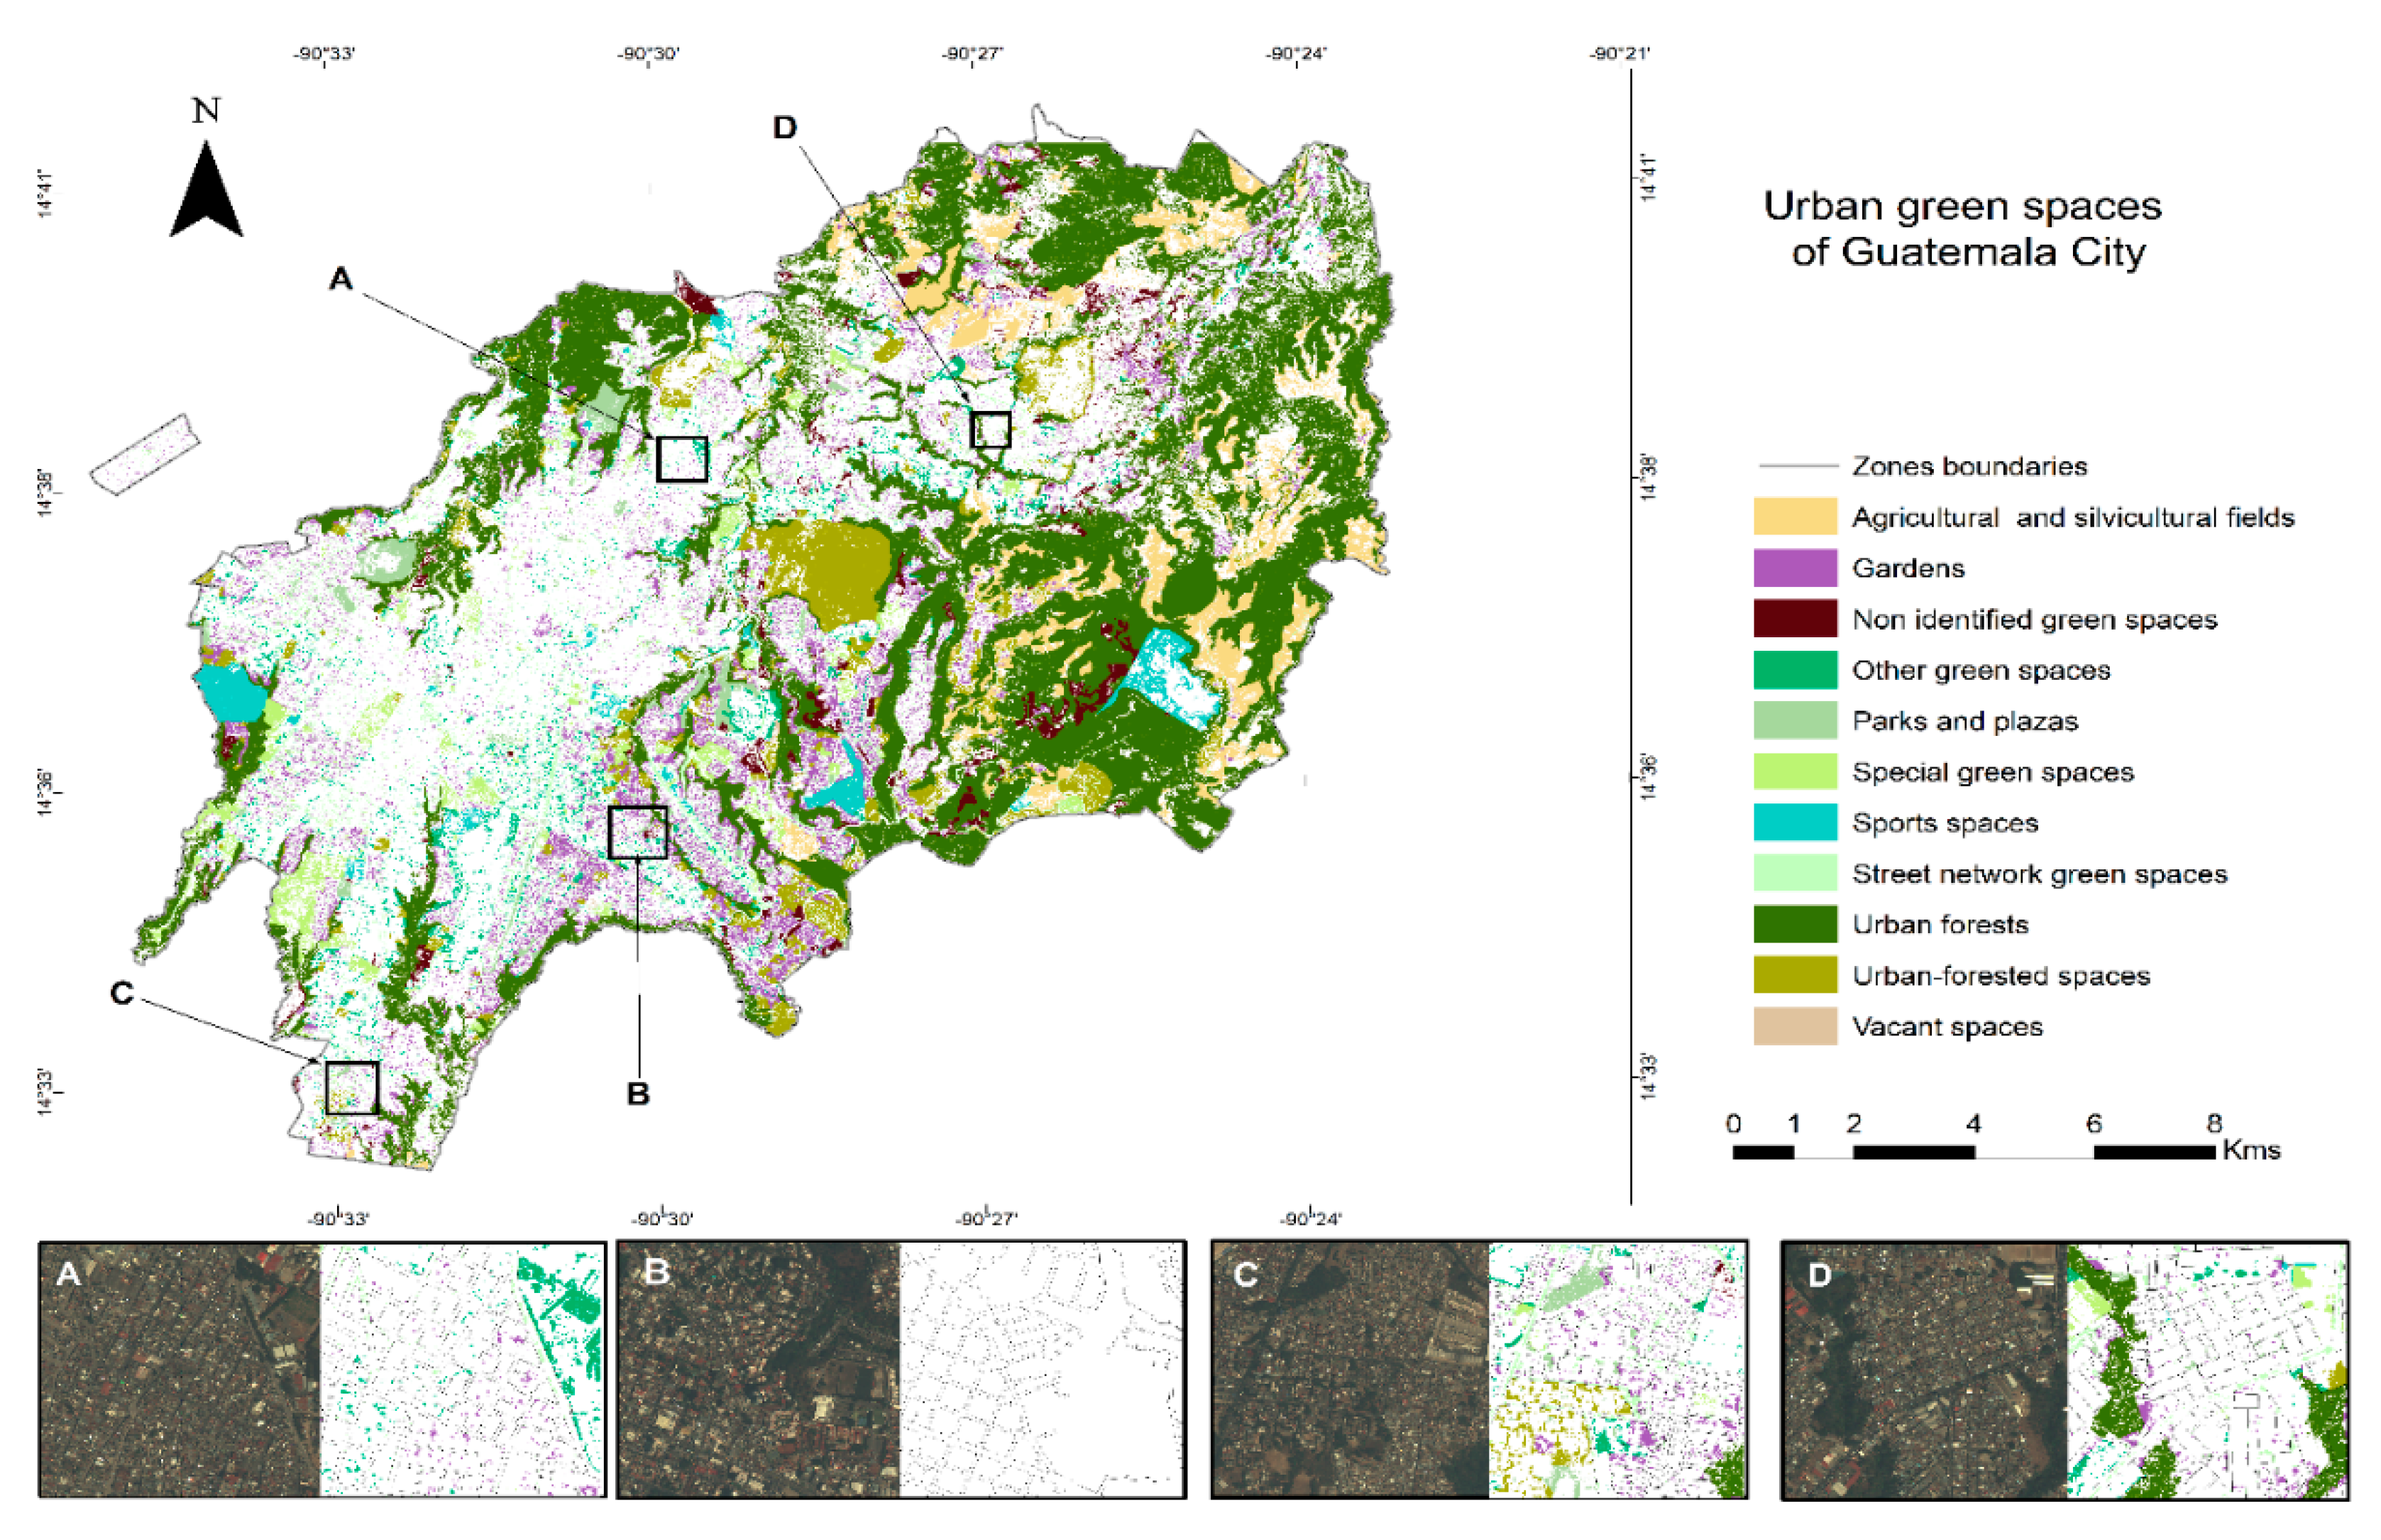
3.1. Classification of Urban Green Fabric in Guatemala City

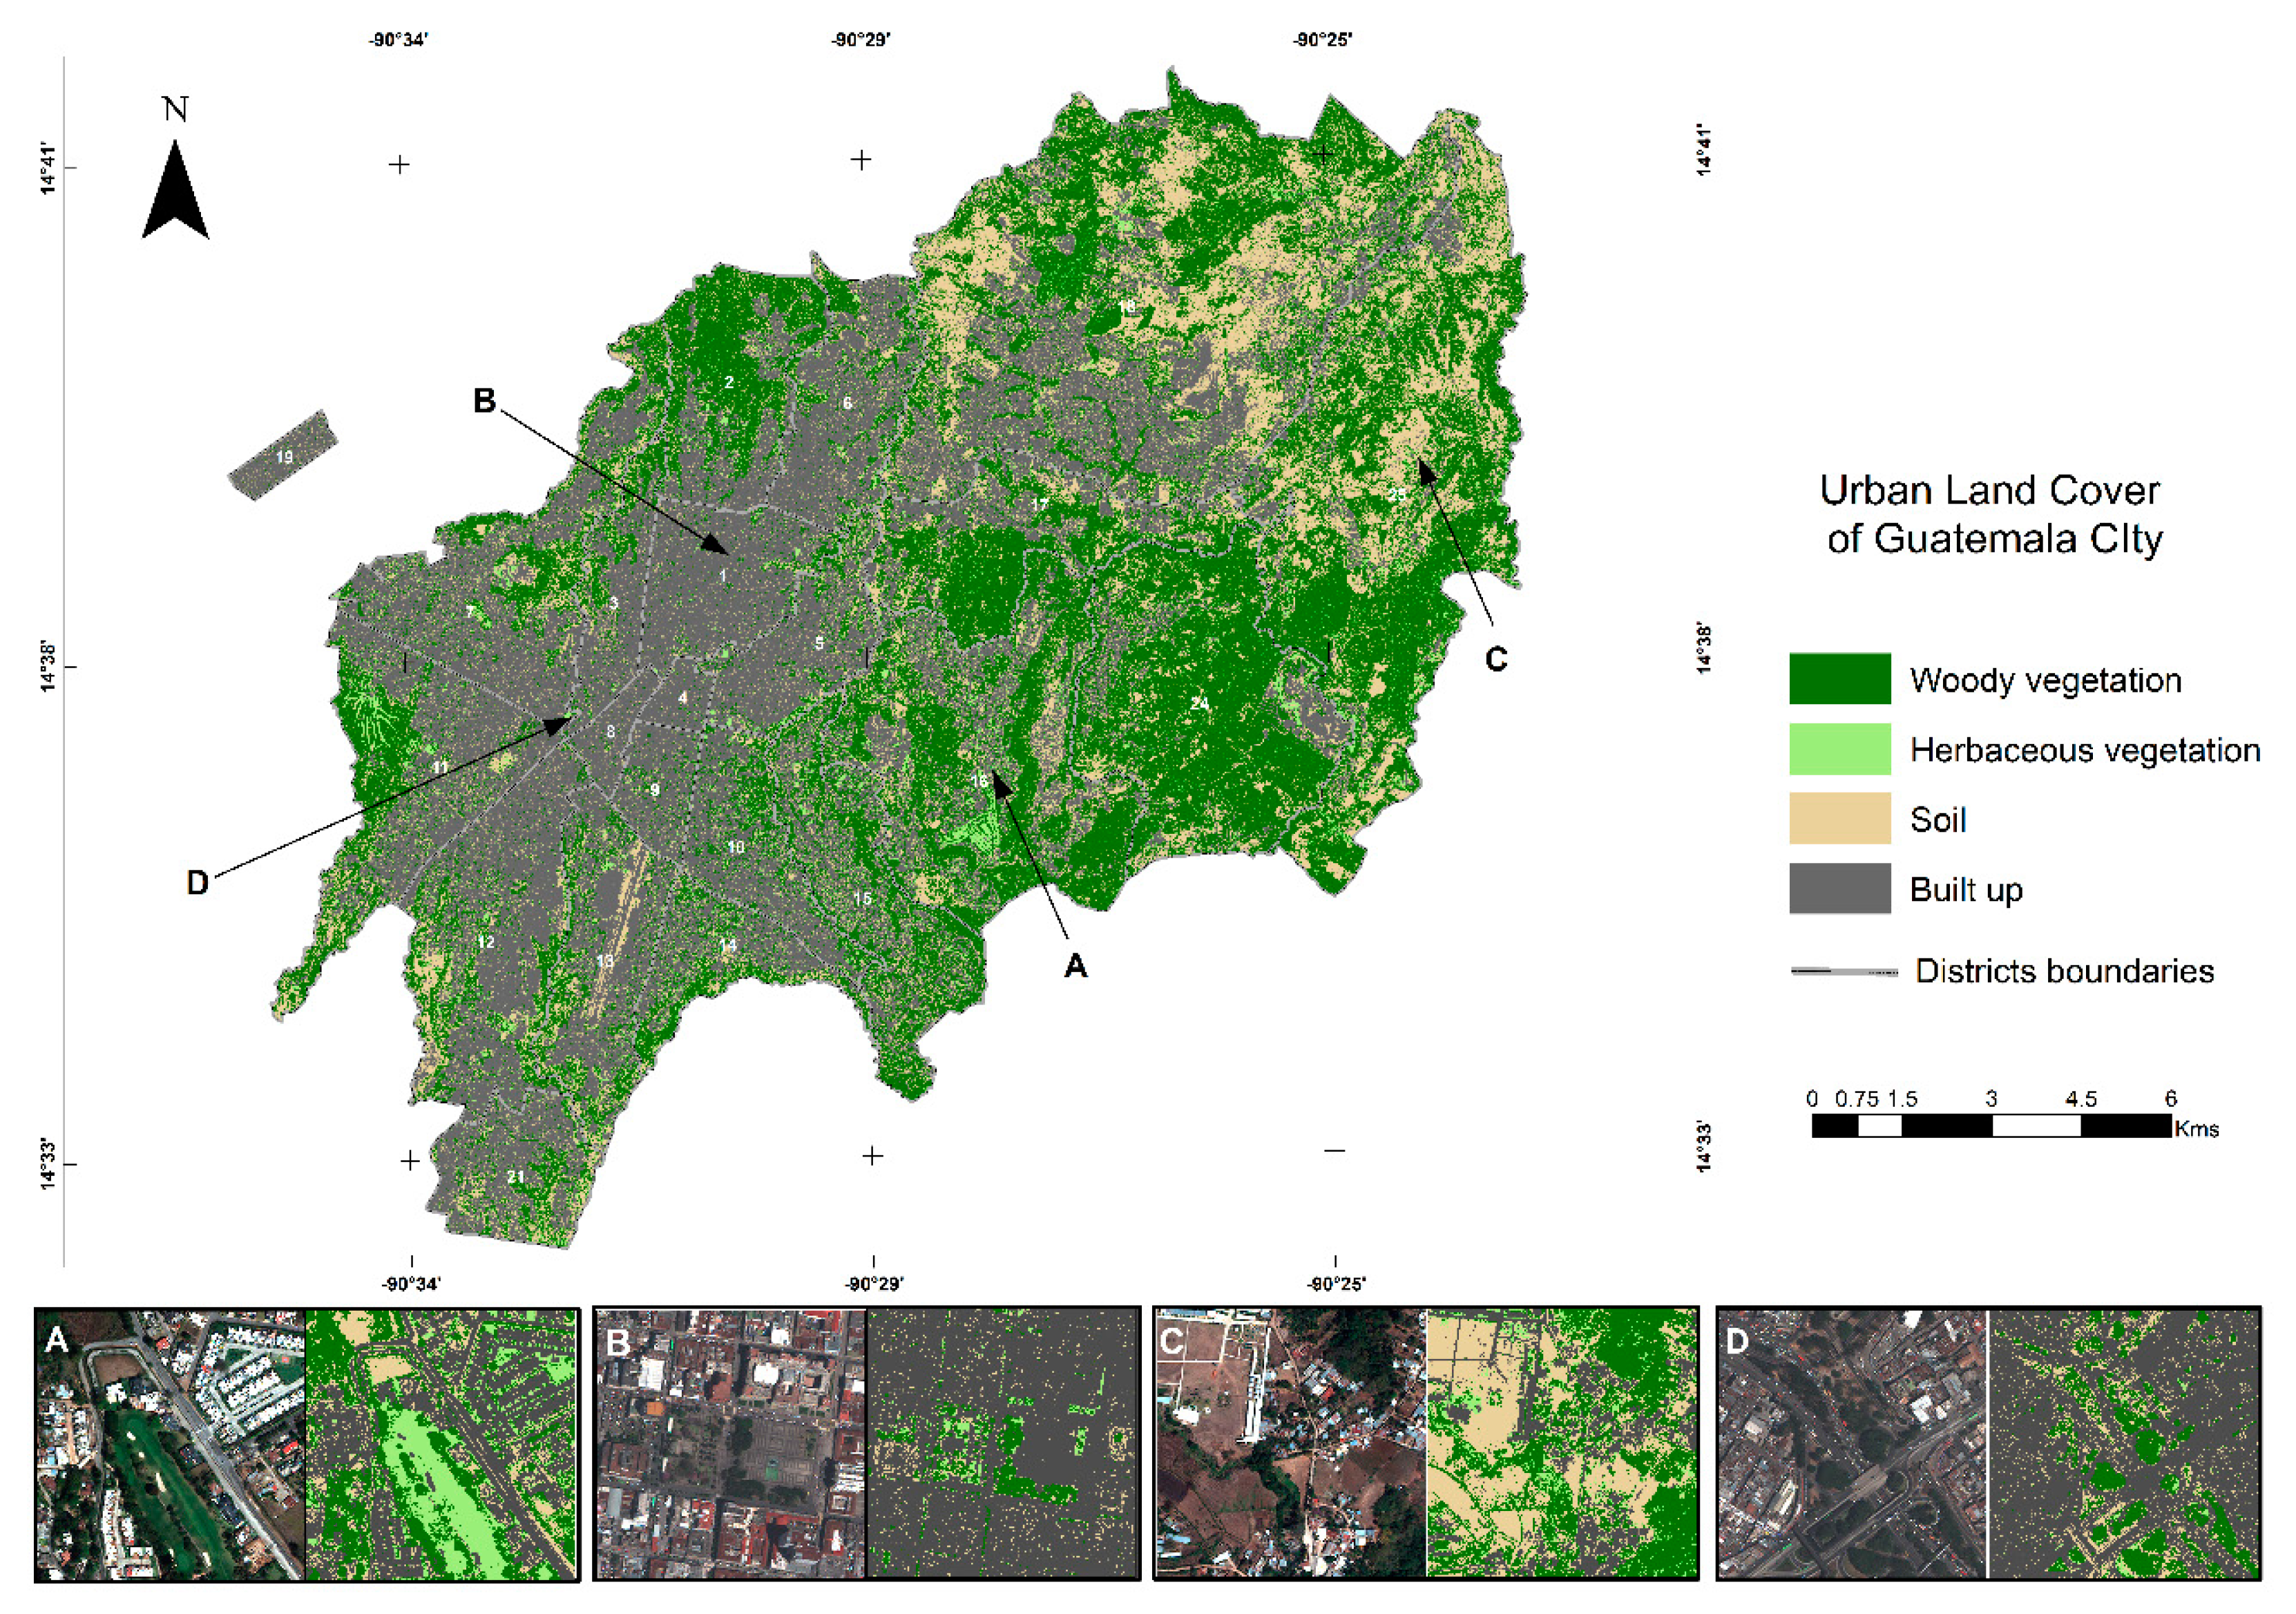
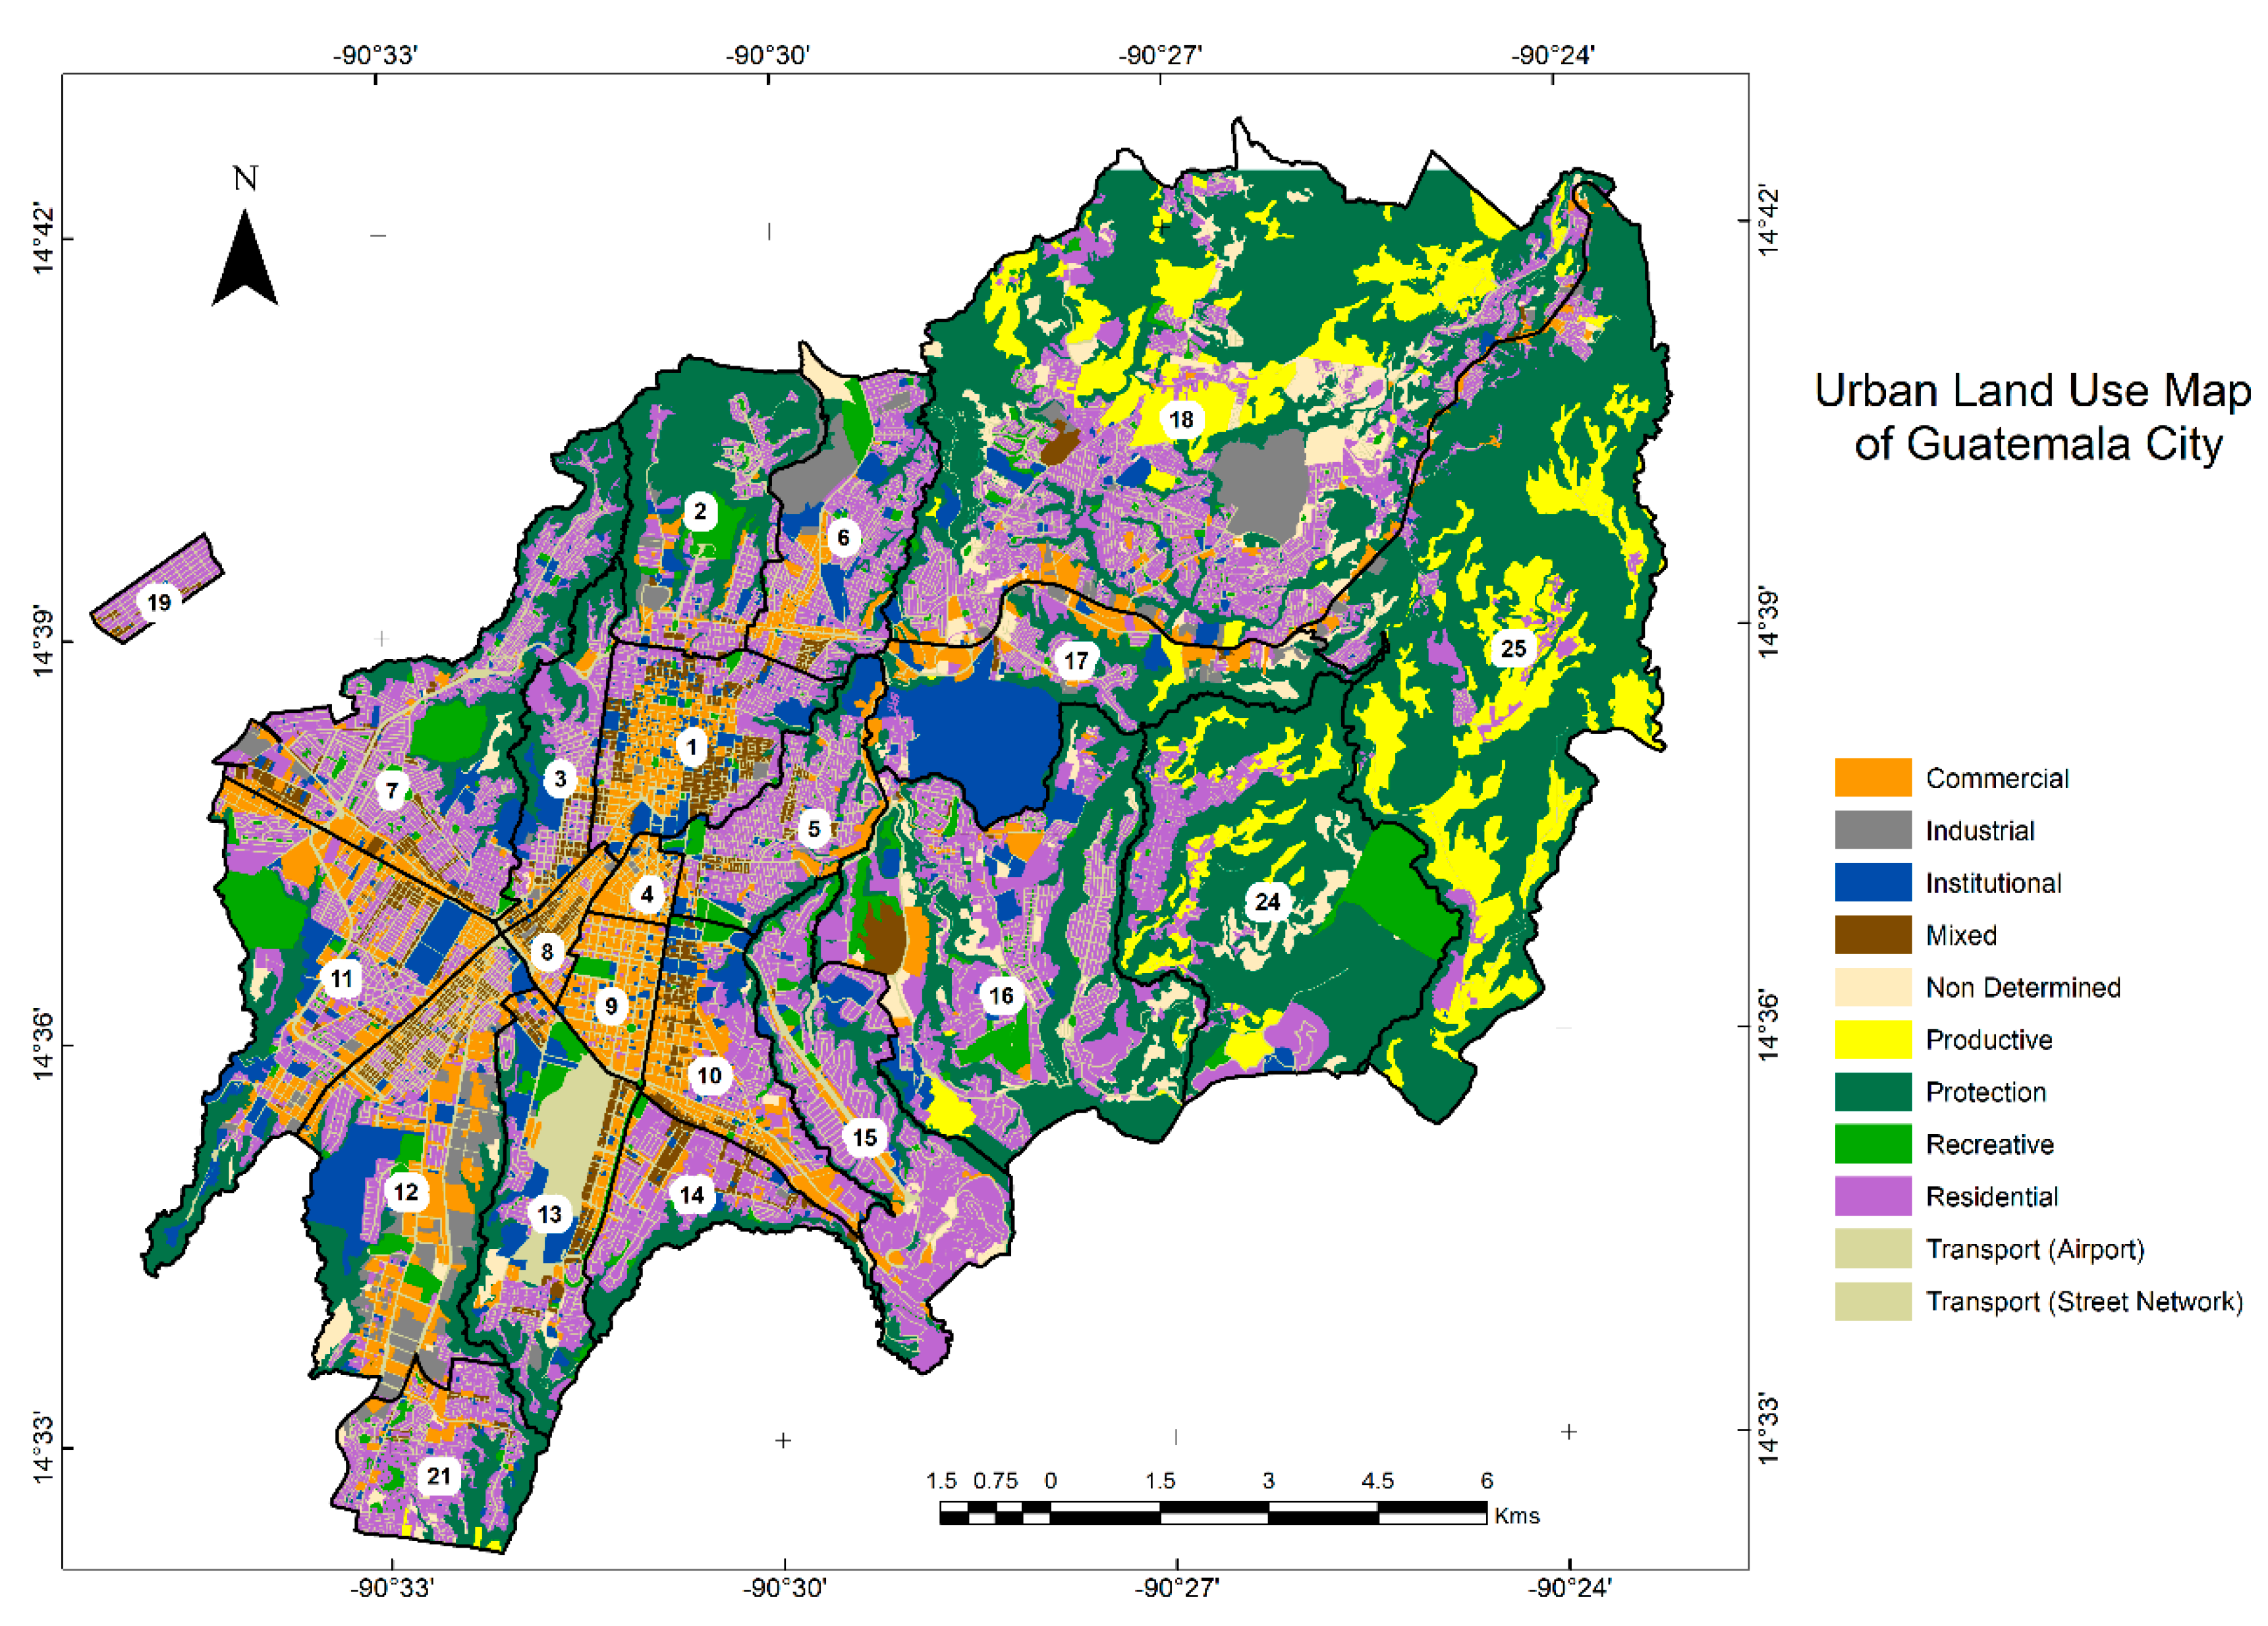
Land Cover and Land Use Map of Guatemala City

The land cover classification features an overall accuracy of around 97%. Guatemala City land cover is comprised predominantly of wood and shrub (40%), followed by built up (36%), soil (20%) and 4% is herbaceous. Green cover is concentrated in certain zones to the north, northeast and east of the city (Figure 3). Zones 2, 16, 17, 24 and 25 have more than half of their surface areas covered with green. Constrastingly, zones 1, 4, 8 and 19 of which the first three zones are central, have high built-up cover (>80%), The rest of the zones have different ratios green/gray cover (see Figure S2 and Table S1). Soil cover is present in all of the zones. Nevertheless, two stand out because they have one third of their area covered by soil. These are zones 18 and 25, which are located towards the east and northeast of the city.
We created an urban land use map of Guatemala City (Figure 4) in which we identified ten primary land uses at the block level and thirty-three specific land uses at the plot level when possible (see Table S2). Each land use distribution pattern and total area can be seen in Figure 4 and Table 2. The share of each urban land use per zone are shown in Figure S3 and Table S3 of Supplementary Materials.
Urban land use map represents the socioeconomic forces physical manifestation in the city. The largest primary land use of Guatemala City is Protection with almost one third of its territory under the Municipal Ecological Belt. Zones 2, 24 and 25 are the largest shares of this use.
Residential use is one fifth of all city area. It is predominantly present in zones 15 and 19 with more than half of their extent used for this purpose. Zones between 20%–40% with residential use include 1, 3, 5, 6, 7, 10, 11, 14, 16 and 21. Other zones with less residential use (10%–20%) are 2, 12, 13, 17, 24 and finally we have zones 4, 8, 9, 25 with less than ten percent of residential use. The city has Transport Use (street network and airport) as the third major use and for zones 4, 8, 9 it covers one third of their total area. The rest of the zones show similar transport use share values except for zones 17, 18, 24 and 25 with lowest shares.
Commercial, Institutional and Productive land uses share similar percentage values at the city level. For Commercial use, only zones 4 and 9 stand out with almost half of their areas with this use. Zones 1, 8, 10 and 12 have between 15%–35% of their area with commercial use and the rest of the zones less than 10%. Institutional use is present mainly in zone 17 followed in descent order by zones 1, 13, 11, 12, 3 and 10. The rest of zones have less than 10% of this use. Regarding Productive use only six zones have this use, from them, 18, 24 and 25 have the larger share and the others, 16, 17 and 21 less than 2%.
Recreative use is almost 4%, The zones with the largest share of this use are 11 and 24 with approximately one tenth of their extension. Zone 7 is next with almost 8% and then, twelve zones have values between 2%–7%. Zones with less than 2% include 3, 4, 8, 17, 18, 19 and with no area of this use, zone 25.
Industrial and Mixed land uses represent less than 3% of the total city surface. The former is located mainly in zones 12 and 6. Other zones with presence of this use between 2%–5% of their area include 2, 4, 17 and 18. Zones with less than this amount of industrial use in their area are 1, 3, 5, 7, 10, 11, 13, 14, 16, 21 and 25. Zones 9, 15, 19 and 24 do not have this use. Regarding Mixed land use zones 1 and 8 have the largest share of this use. Followed by zones 10, 14 and 19. The rest have less than 5% of their surface with this land use.

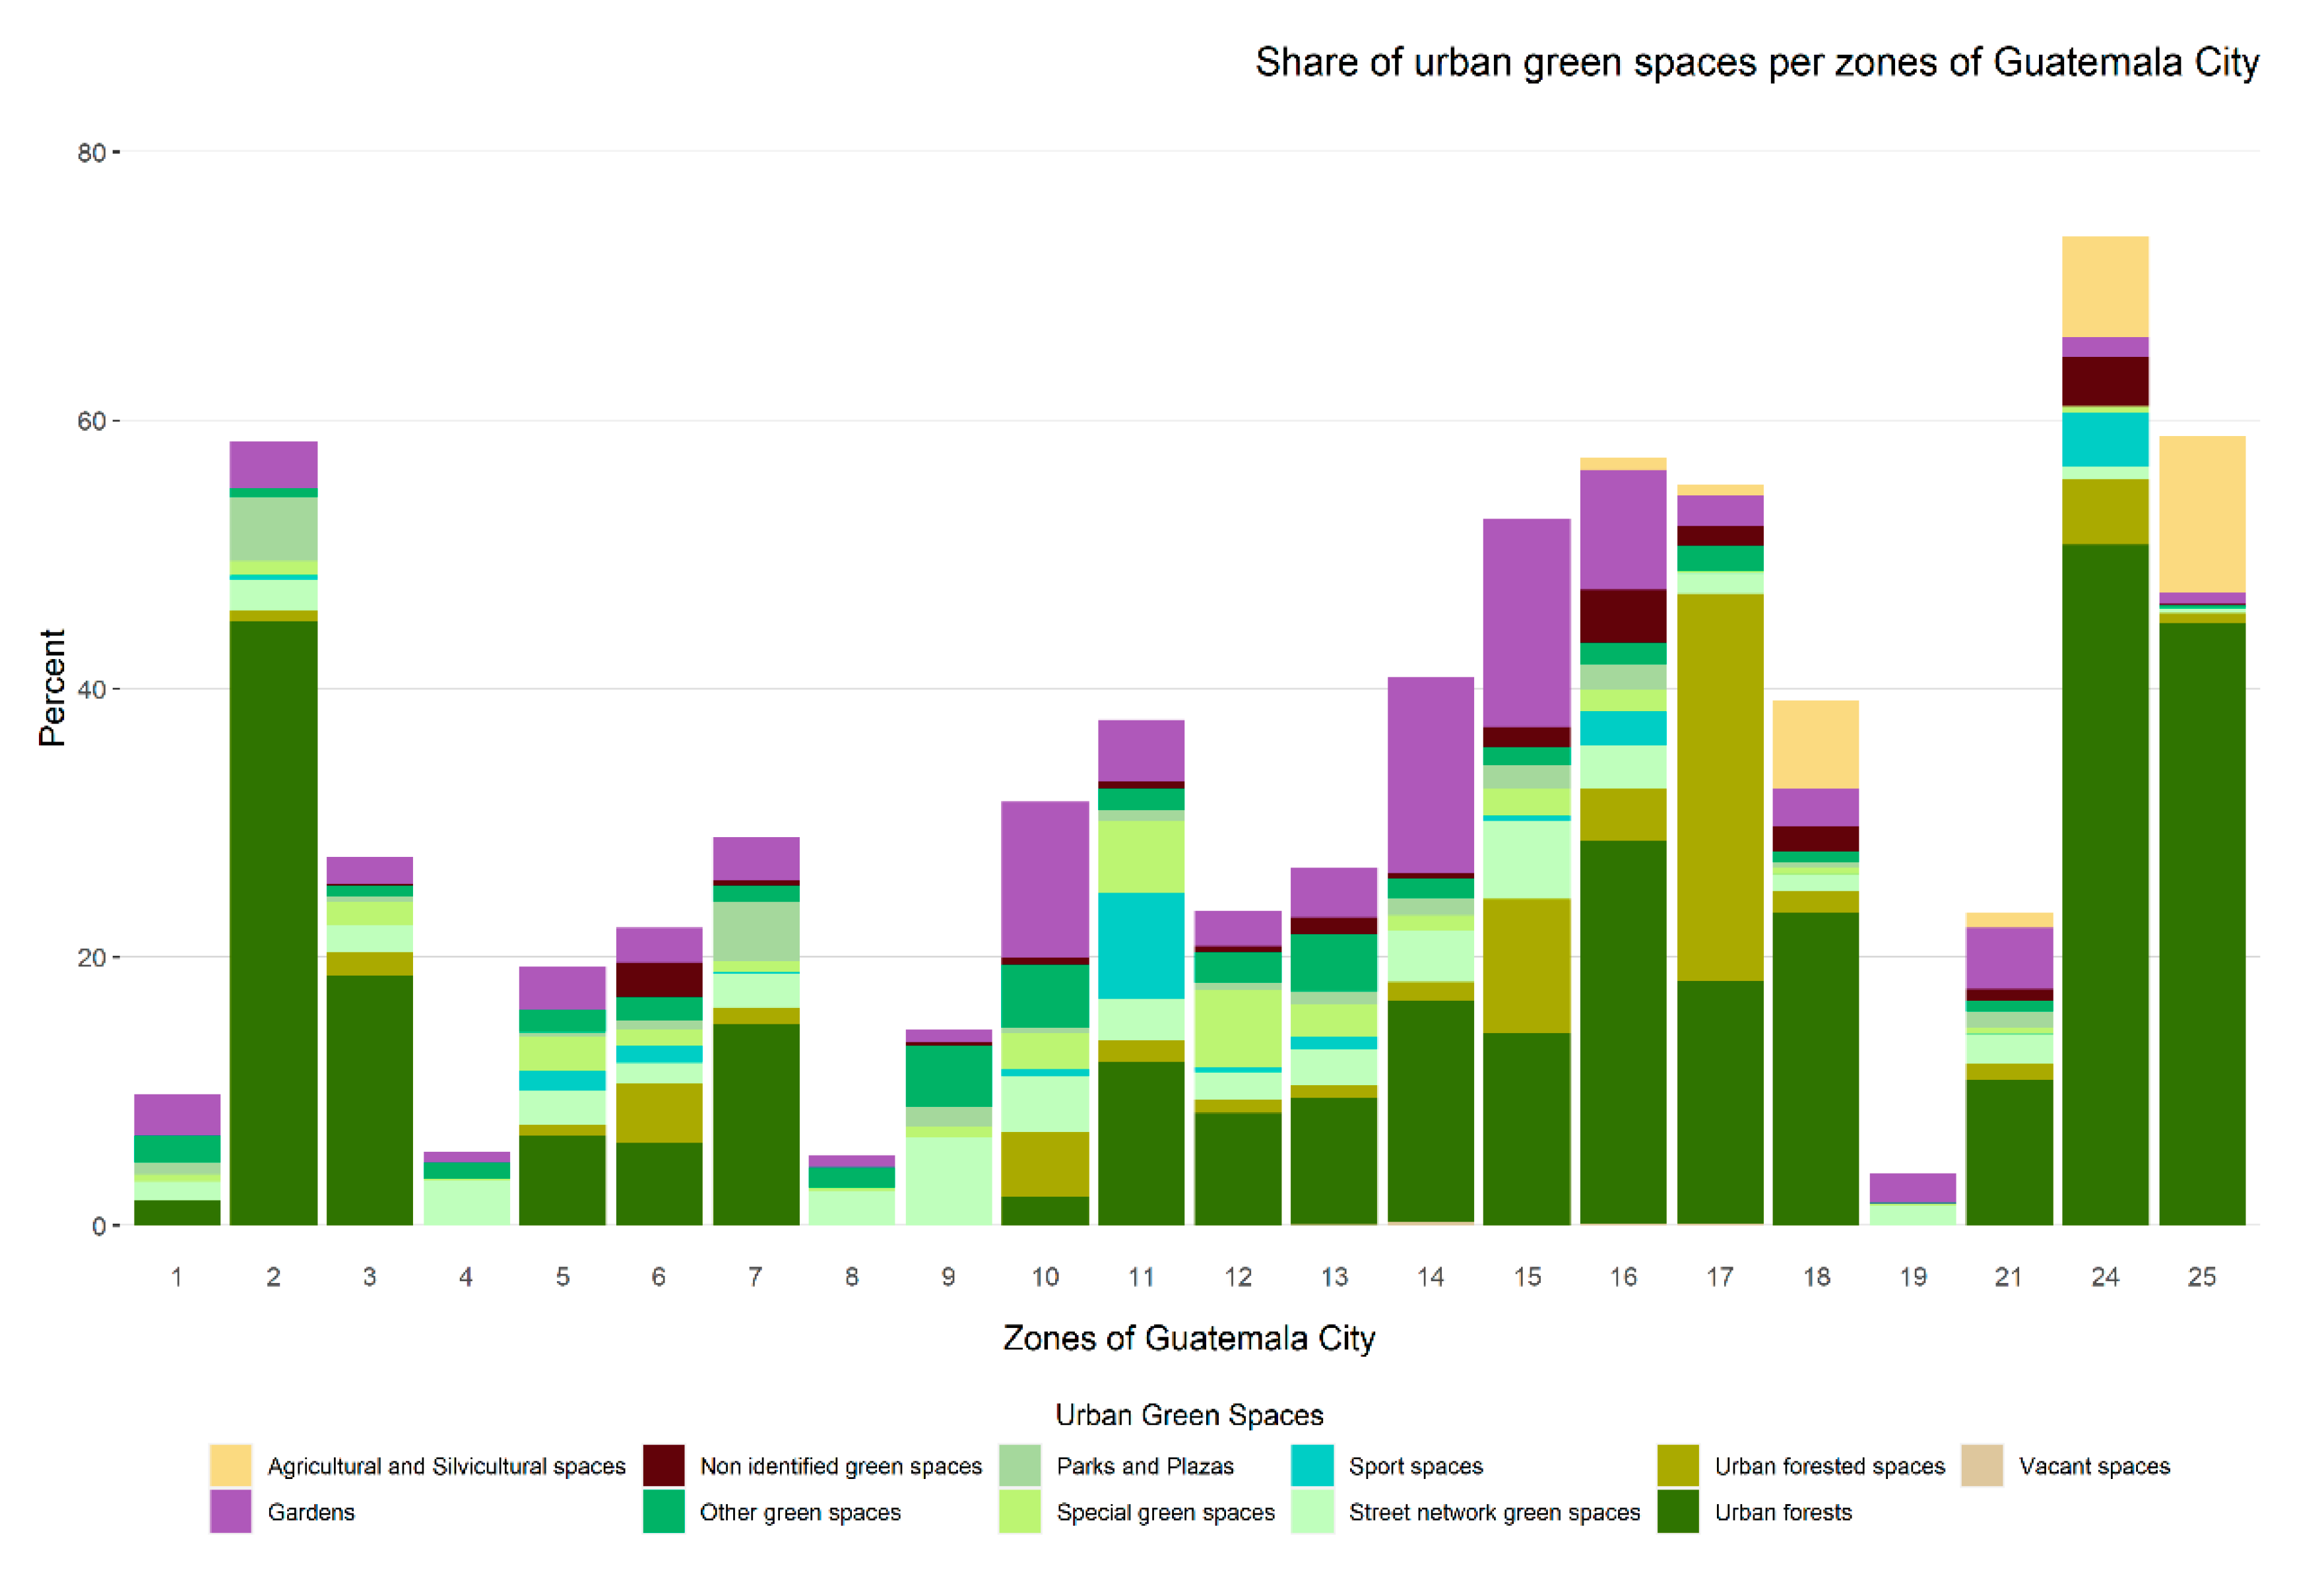
3.2. Urban Green Fabric Material Weft

The main material weft of the city are the urban green spaces. There are eleven UGS types in the city (see Figure 5) with a total area of 9782.67 ha equivalent to 42.77% of the total surface of Guatemala City. Estimated UGS area per capita for the city is about 105.94 m2. When we consider only public green spaces (parks, plazas and street network green) this amount is 7.49 m2.
The largest UGS are urban forests, which amount to half of the total UGS surface in the city (see Table S4). Other types with considerable surface share are gardens (9.55%), agricultural spaces (8.27%) and forested urban spaces (8.00%). Street network green spaces encompass 4.80%. Among the UGS with lower share are special spaces (3.19%), other green spaces (3.01%) and sport spaces (2.64%). Parks and plazas have 2.2% and vacant spaces 0.06% of total area. Green spaces without identification make up 3.25% of the total area.
The zones where more than half of its territory are UGS, are 2, 15, 16, 17, 24 and 25. Zones with approximately one third with UGS are 7, 10, 11, 14 and 18. Zones with one fifth UGS are 3, 5, 6, 12, 13 and 21. The rest of zones have less than fifteen percent of their territory with UGS. (see Table S5).
Inside the zones, shares of UGS are distinct (see Figure 6). Agricultural and silvicultural spaces are abundant in zones 18, 24 and 25. There are many vacant spaces in zones 14, 16, 17 and 25. Gardens predominate in zones 15 and 16. Urban-forested spaces are more prevalent in zones 15, 17 and 24, while parks and plazas make up a high percentage of zones 2, 16 and 17 (Table S6).
Zones 11 and 24 have the highest share of sports spaces, while 11 and 12 have the highest share of special green spaces. There are more street network green spaces in zones 15, 16 and 18. Other green spaces are high in 13, 16 and 18. The highest share of urban forests can be found in zones 18, 24 and 25. Finally, there were a high number of non-identified green spaces in zones 16, 18 and 24.

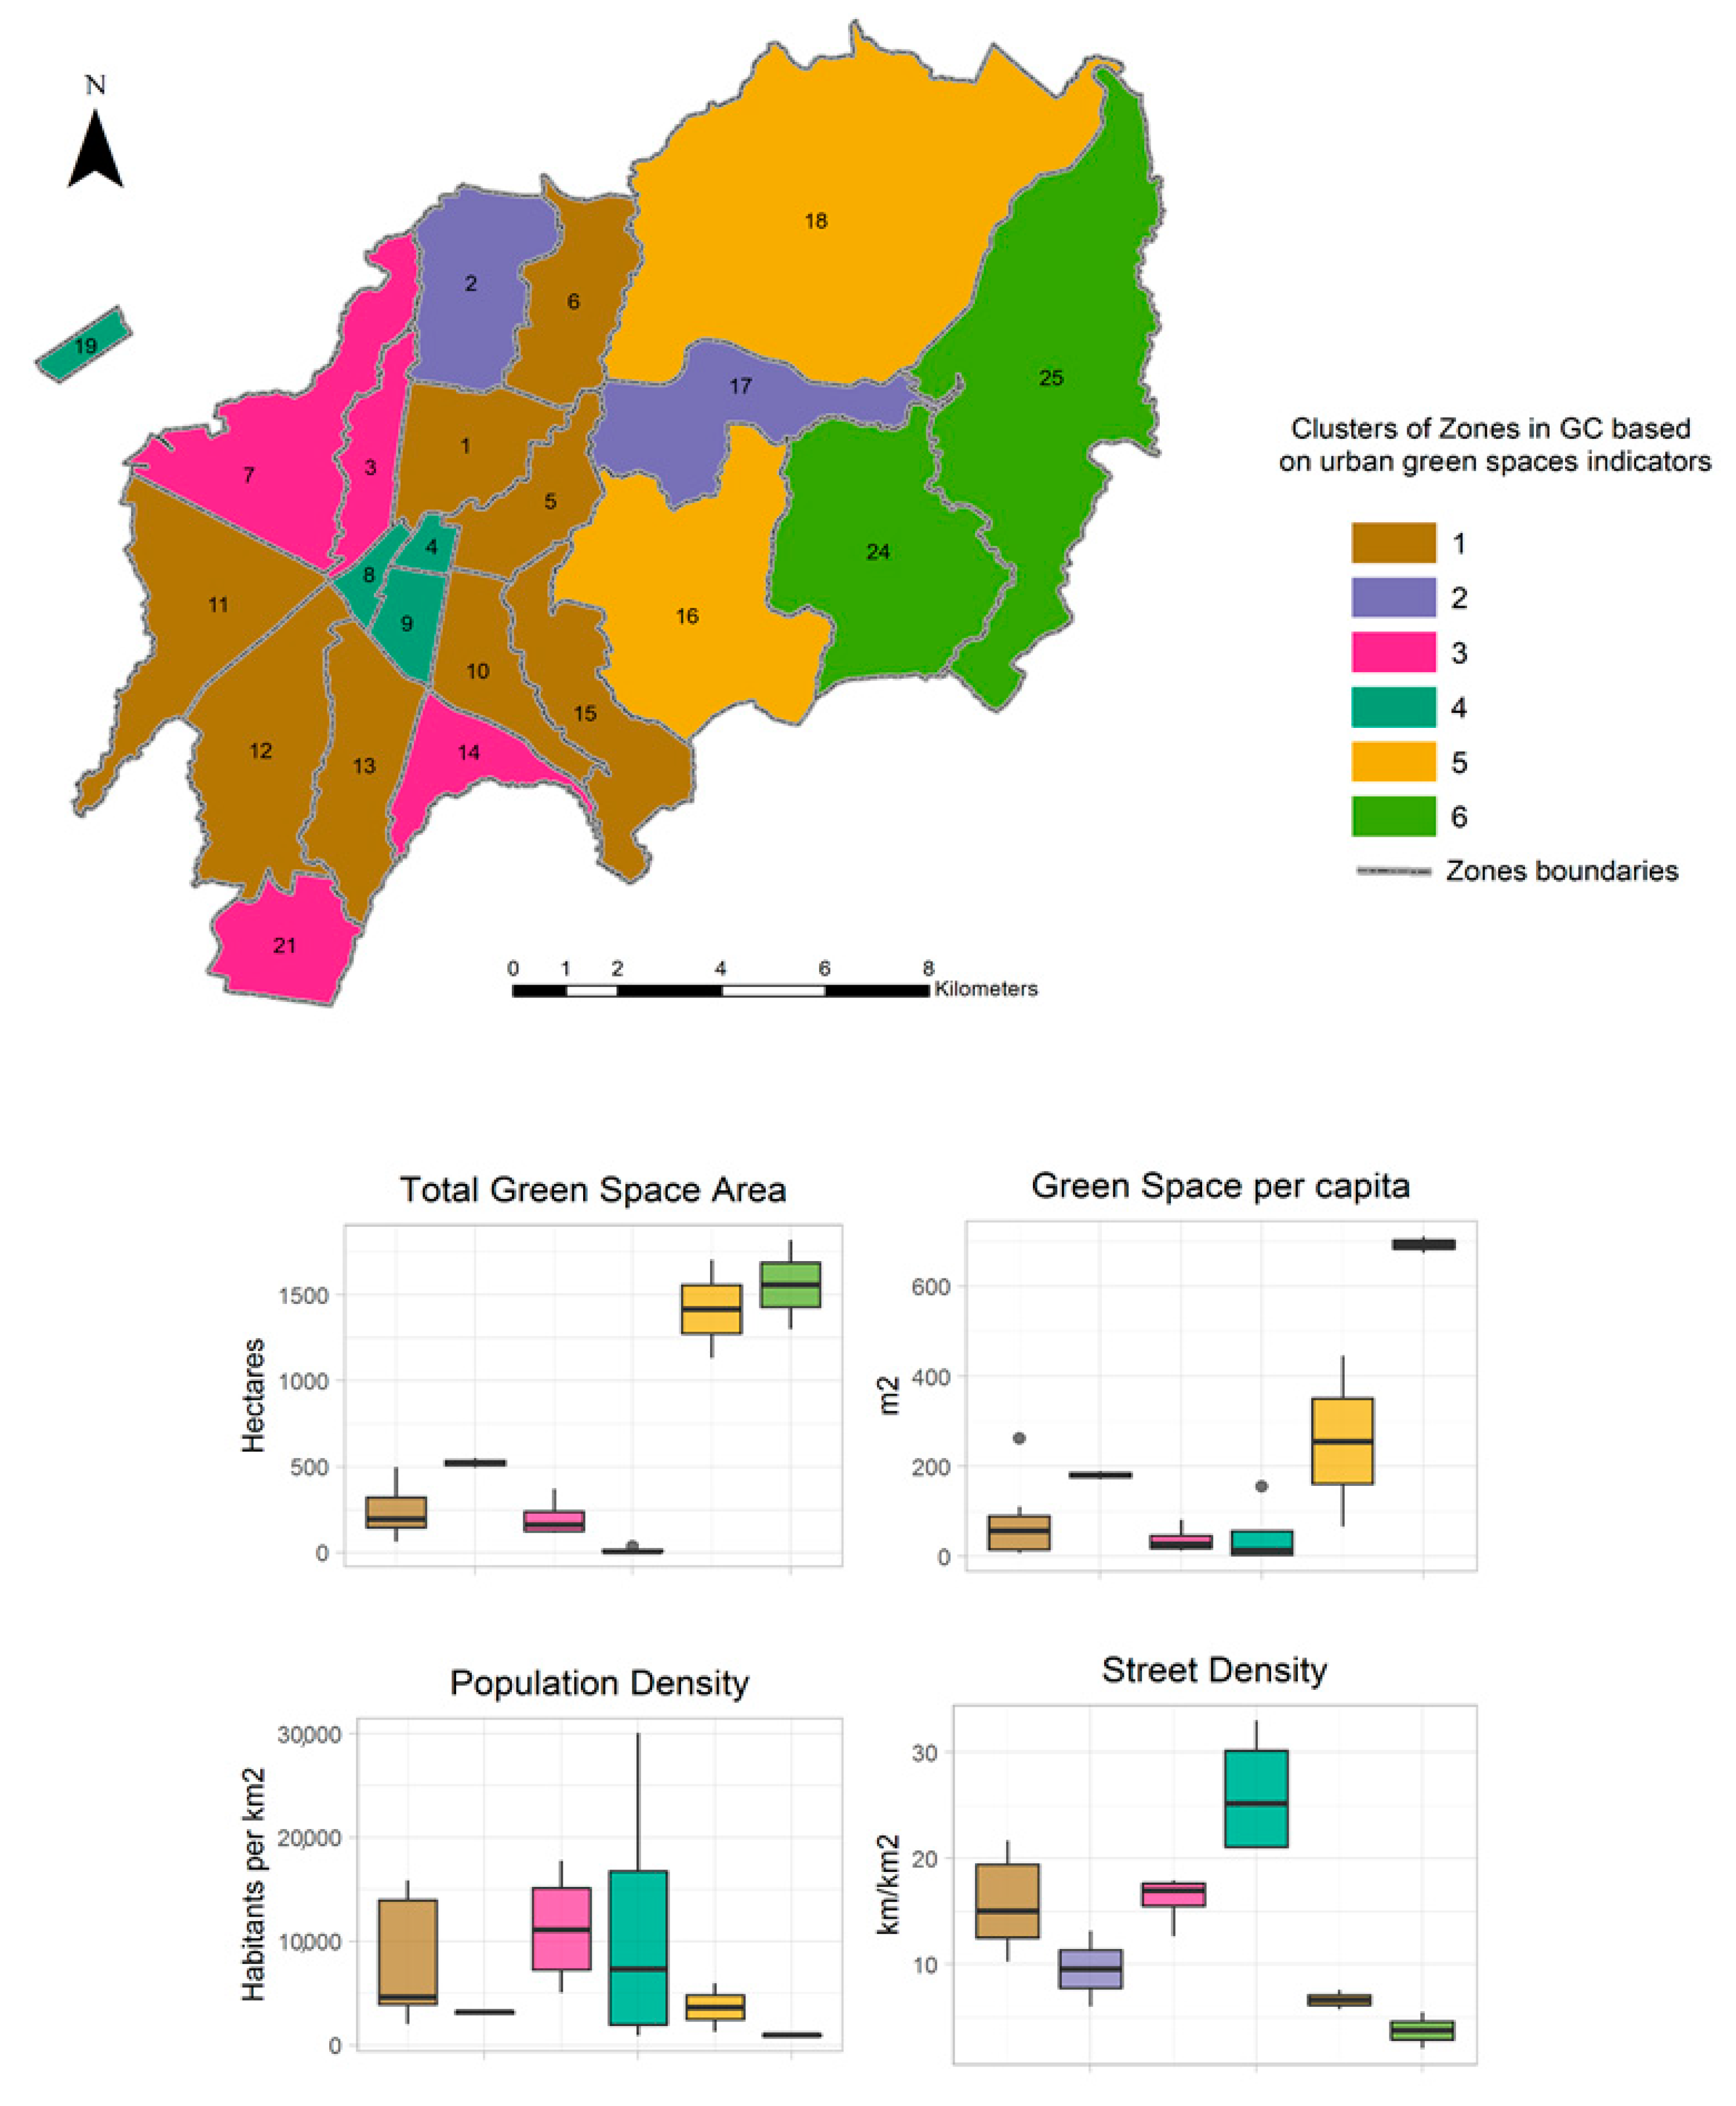
3.2.1. Urban Green Spaces Spatial Pattern and Zones Ensembles

The spatial pattern of UGS is clustered as evidence of spatial autocorrelation measured by Moran’s Index of 0.73, z = 335.14 and p > 0.001 (Figure S4). The cluster analysis was based on indicators of UGS and identified six ensembles of zones (Figure S5). These ensembles are shown in Figure 7. For all indicators see Supp. Mat. Table S7 and Figure S6. The description of the ensembles follows:
  • Cluster 1: Scant, disaggregated, disconnected and heterogeneous green ensemble
This cluster is the largest, including eight zones: 1, 5, 6, 10, 11, 12, 13 and 15. It shows a variable population density, similar to other clusters and a varying mean street density. This cluster exhibits low levels of green space per capita and area with some variation between zones. The configuration consists of a low number of green spaces, moderate levels of shape complexity and aggregation with the lowest levels of the contagion index. Regarding UGF composition, it presents moderate UGS variability with low values of the largest patch index (low dominance of a patch) and high values on both diversity and evenness. It is one of the clusters that show the lowest connectivity levels among UGS.
  • Cluster 2: Scant, aggregated, moderate connected and homogenous green ensemble
This is one of the clusters with only two zones: 2 and 17. This cluster’s urban form has low population and street density, as well as moderate levels of total green space area per capita. UGF configuration shows low levels of green spaces, medium values of form complexity and high values in contagion and aggregation indexes. The composition exhibits a high variability value and low diversity and evenness values while, at the same time, having the highest value of patch dominance. This cluster also has moderate levels of connectivity in the city.
  • Cluster 3: Scant, moderate aggregated, disconnected and moderate heterogeneous green ensemble
The first cluster contains four zones: 3, 7, 14 and 21. Urban form in this cluster exhibits moderate levels of street and population density with the former being more homogenous and the latter showing high variability. Green space per capita and total green space are both low. Configuration of UGF in this cluster is moderate in terms of the number of green spaces, form complexity and contagion index. The cluster ranks low on the aggregation index. Regarding composition, this cluster shows moderate levels of patch dominance and low values of variability, diversity and evenness. It also has a low connectivity.
  • Cluster 4: Scant, moderate clumped, disconnected and homogenous green ensemble
This is the second cluster comprised of four zones: 4, 8, 9 and 19. This cluster displays the highest variability in population density and has highest street density while exhibiting the lowest green space per capita. Its configuration has the lowest number of green spaces and a low aggregation index, moderate form complexity and medium contagion index. Its composition has the lowest variability and patch dominance. It also exhibits moderate values on the evenness index and low values on the diversity index. Similar to other clusters, it has low connectivity.
  • Cluster 5: Abundant, moderate aggregated, disconnected and moderate heterogeneous green ensemble
This is the second cluster with two zones: 16 and 18. This cluster exhibits low street and population densities, high levels of total green space and moderate green space per capita. Concerning configuration it contains the highest number of green spaces, high levels of form complexity, high aggregation index and a moderate contagion index. UGF composition shows low patch dominance, the highest level of green space variability and moderate levels of diversity and evenness. Connectivity is also low.
  • Cluster 6: Moderate abundant, aggregated, connected and homogenous green ensemble
This is the last cluster and includes two zones: 24 and 25. It has the lowest street and population density while also the highest level of green space per capita and amount of space used as green. Configuration of UGF shows a moderate number of green spaces and the highest complexity form. Indexes of contagion and aggregation are high. Concerning composition, patch dominance and variability are high while indexes of diversity and evenness are the lowest. Connectivity is the highest among the clusters.

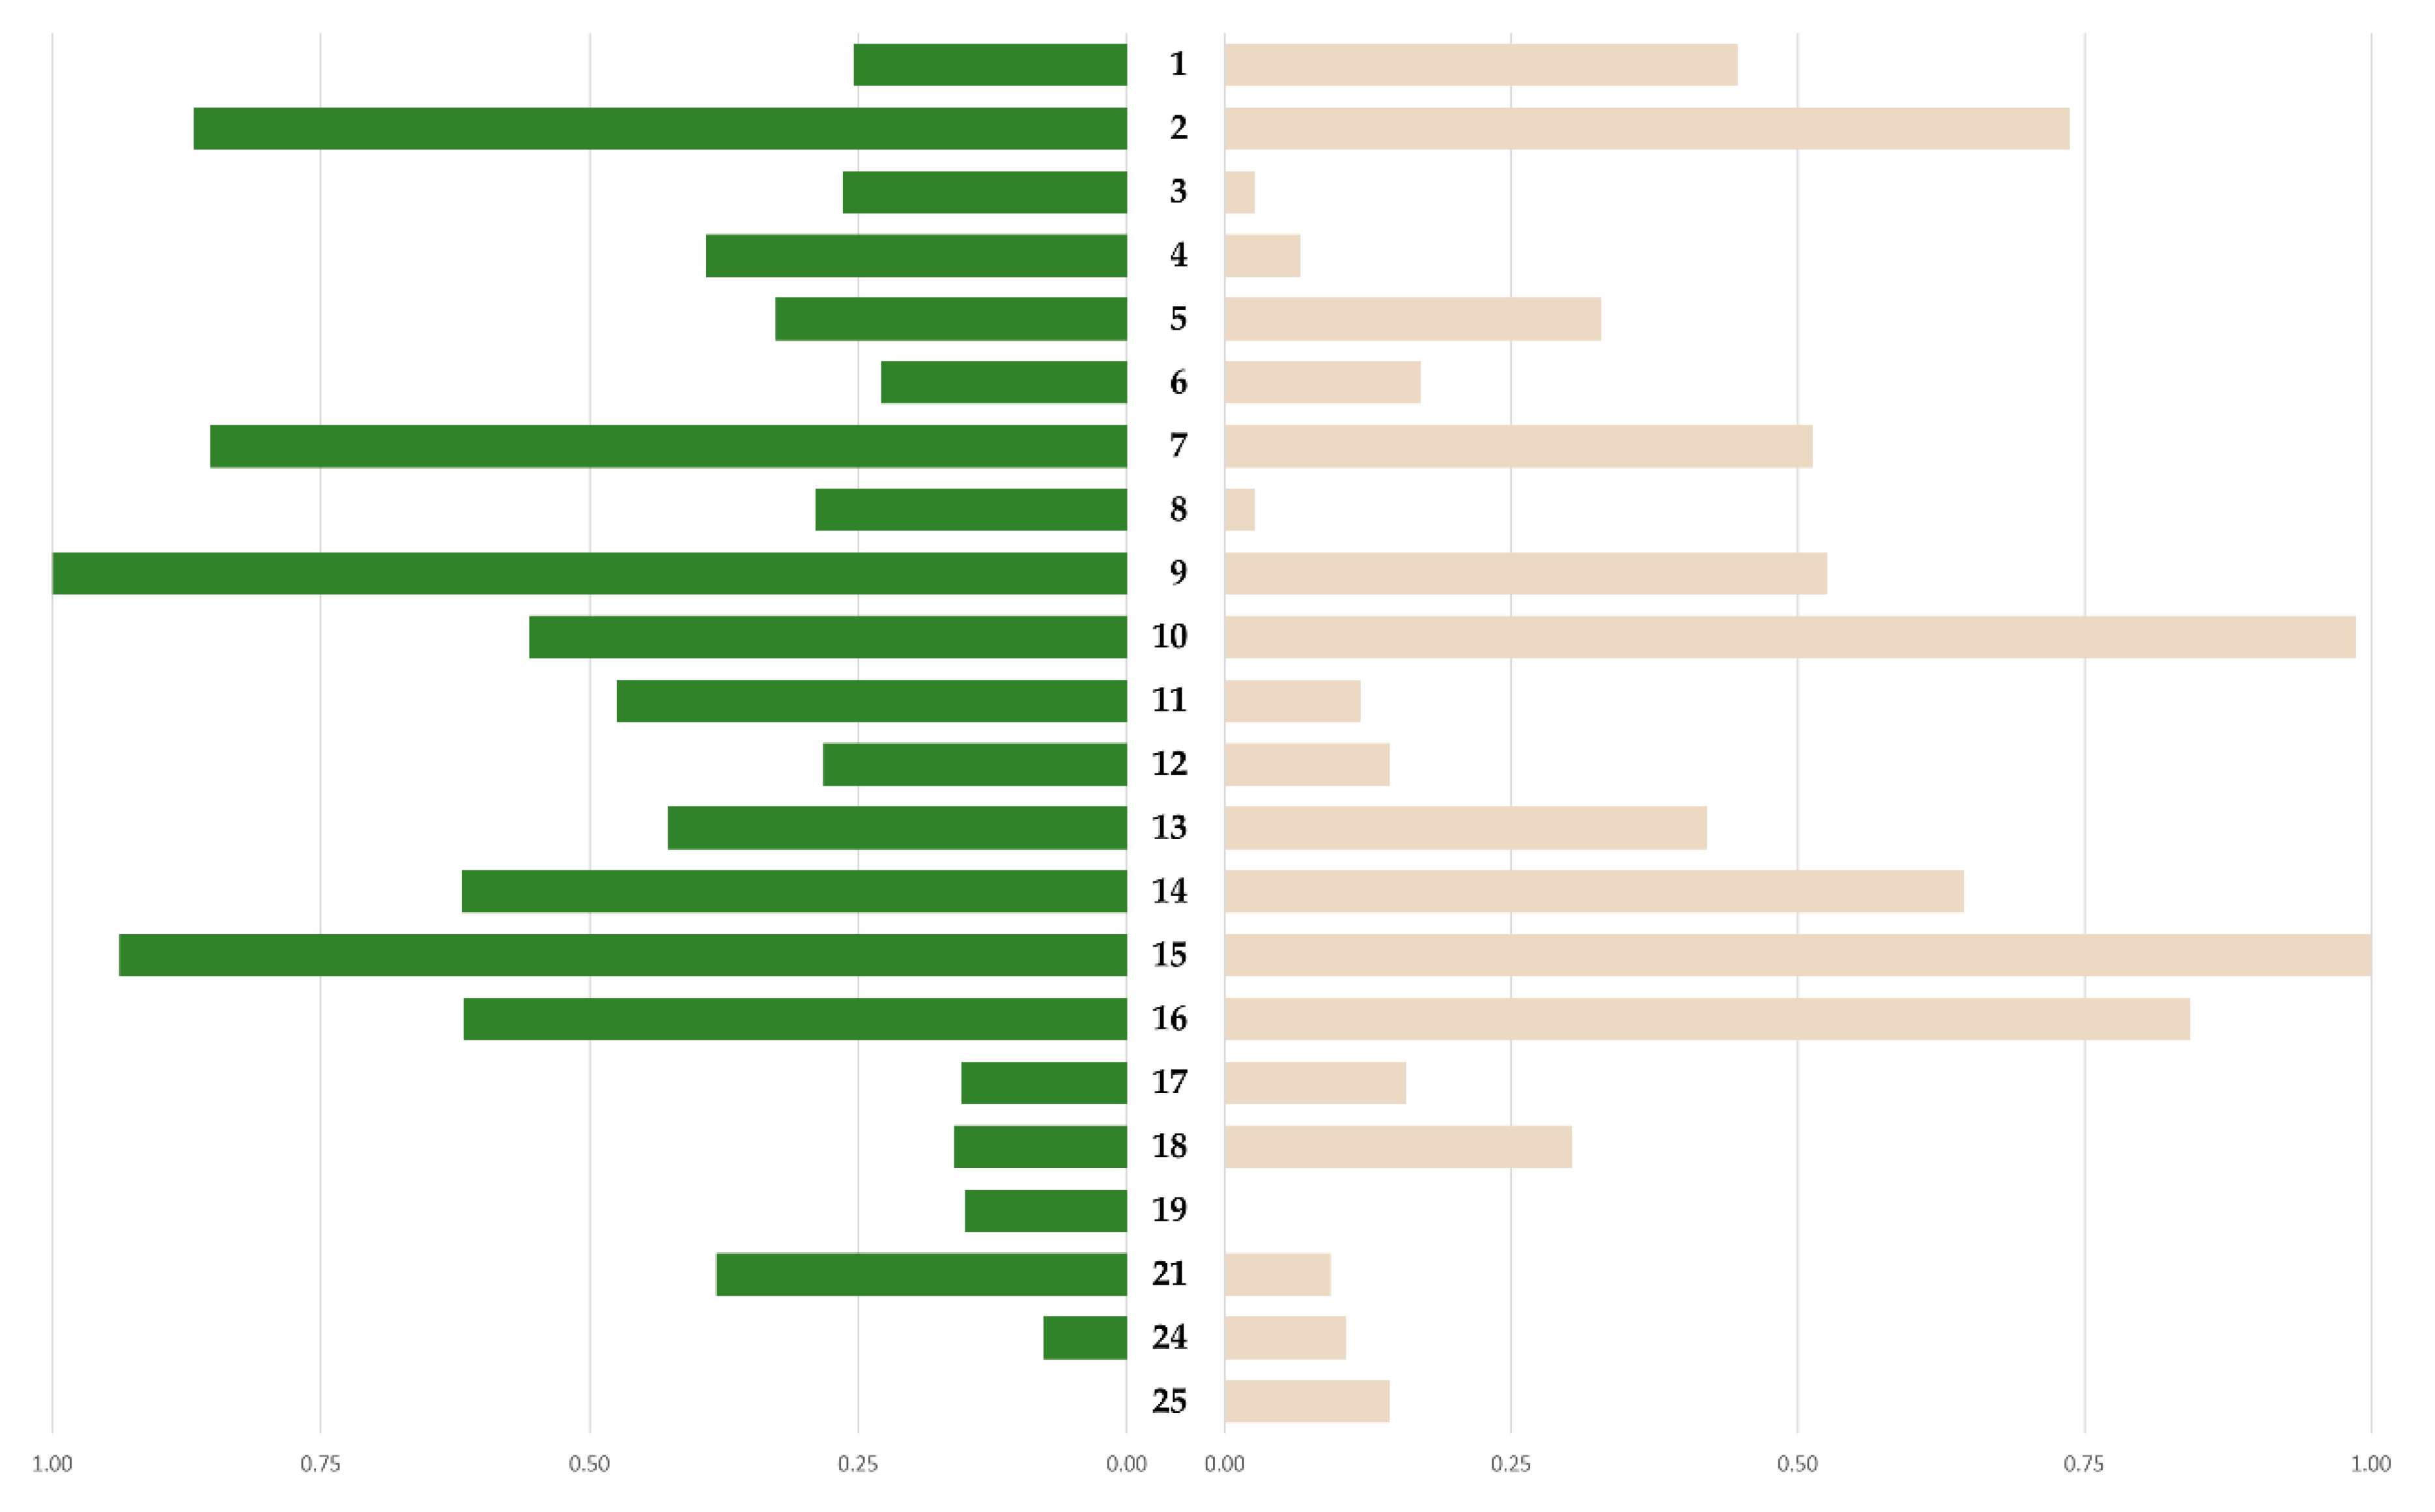
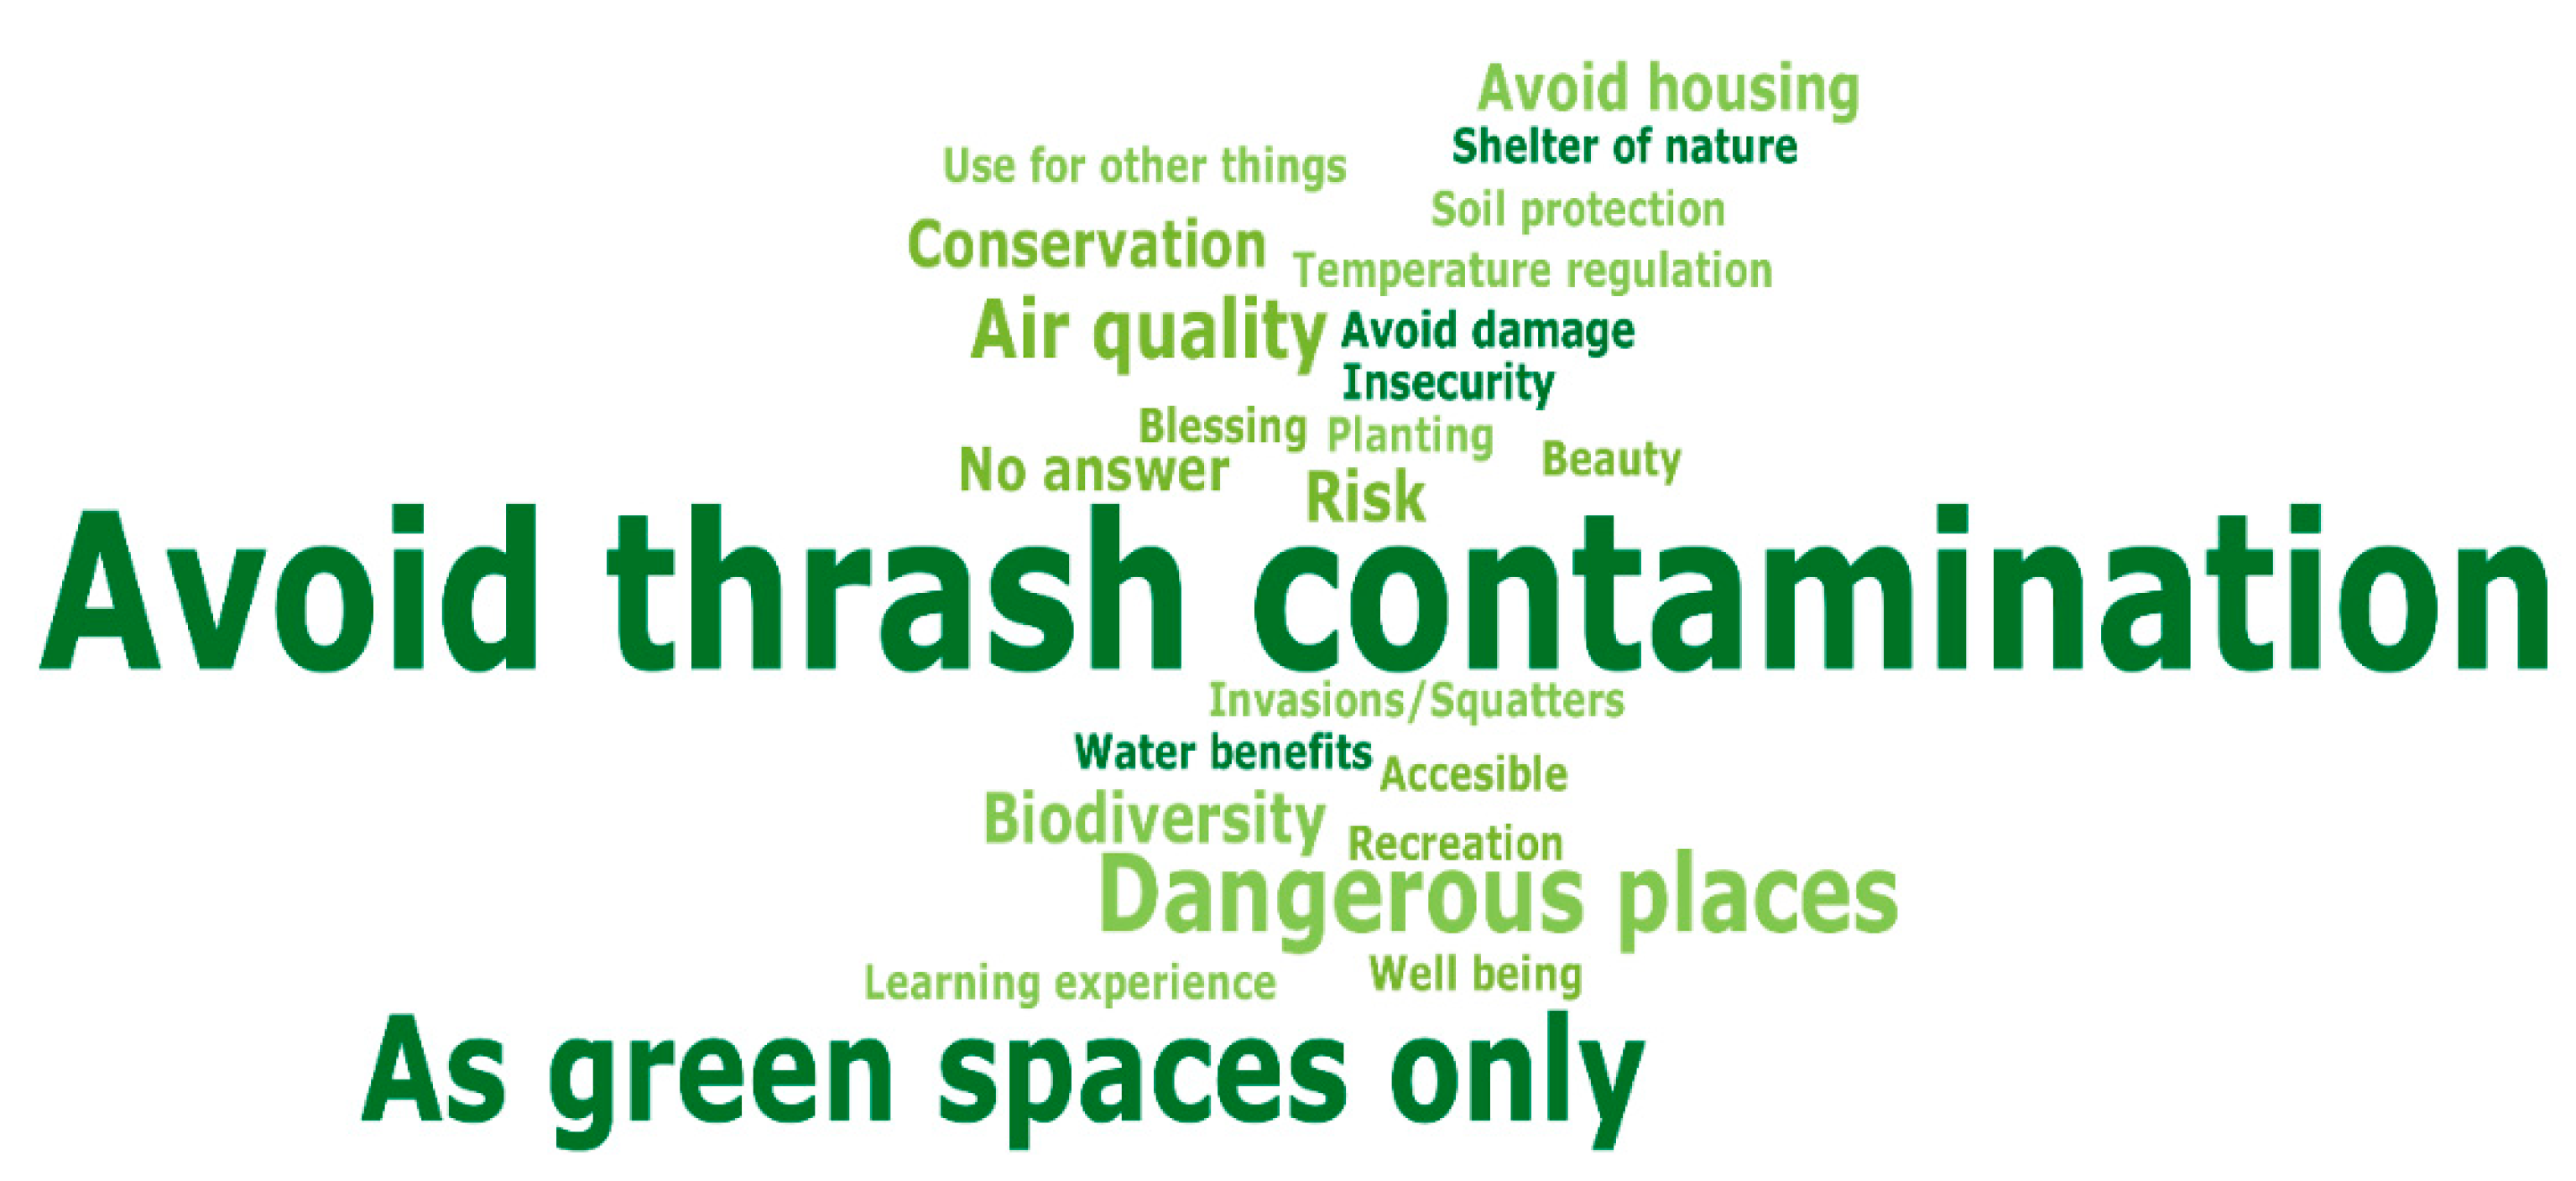
3.2.2. Citizens’ Perceptions and Preferences on Urban Green Spaces

On the possibility of encountering nature in certain urban spaces and thus identifying UGS, Guatemala City citizens recognized three (≥60%) UGS types more than the rest of the options, with the exception of vacant lots, which had a moderate value (50%).
Regarding the amount of public UGS in the city (parks, plazas and street green), 72% of the citizens reported that there are not enough public green spaces in their zones. Correspondence between citizens’ perception and actual UGS area is shown in Figure 8. For example, in zones with high amount of public green spaces like 2, 15 and 16, perception is similarly high. This correspondence is also similar for zones with low amount of public green spaces and perceived as such like 5, 6, 17 and 24.
The preferences of citizens related to future planning interventions like implementing a new large urban park, reached an agreement of 98% of respondents. The reasons behind this are diverse and, according to our categories, the most frequent reason is recreation, followed by a sense of necessity for this area. Recognition of the areas as one that will provide benefits and enhance wellbeing was another reason given. (See Figure S7).
Concerning the possibility of using Urban Forests (locally known as “Barrancos”) for uses other than green ones, 86% of citizens preferred to let these spaces remain green. Many of the motives registered to support this were included in diverse categories. The most frequently stated motivation was the recognition of the importance of green spaces followed by the danger of this spaces and their use as dumps. Other answers referred to avoiding damages and the recognition of some ecosystem services provided, such as air quality, biodiversity and recreation (see Figure 9).

4. Discussion

4.1. Urban Green Fabric Analysis

4.1.1. Urban Land Cover and Urban Land Use of Guatemala City

Our use of WorldView-2 satellite images in combination with random forest modeling allowed us to map the urban land cover in Guatemala City with high spatial detail as in other cities [95] and a high level of accuracy. The high resolution of the images in combination with the robustness, efficiency and the random forest algorithm’s insensibility to outliers [96,97] enabled us to reveal vegetation cover inside the built-up matrix that previous maps did not show like street green spaces, which are key to citizens’ quality of life [98,99].
In some areas vegetation and soil cover area is greater than sealed surface area. This means that there is still room for ecological processes to thrive. The pattern of cover in this map could be explained by two conditions. On the one hand, the central zones (which are also the older zones) [100] are the ones in which consolidated urban processes are represented by a higher density of built-up structures. Accordingly, these zones have less vegetation cover and more built-up areas. On the other hand, the presence of ravines reduces the possibility of construction due to their geomorphic restrictions. However, these ravines are the sites of self-constructed homes for low-income residents and, partially, for migrants to the city [101]. In spite of this, zones with ravines still show a large share of vegetation cover.
Following the former conditions, consolidated urban processes in zones without ravines can explain their lower vegetation cover such as zones 1, 4, 8, 9 and 19. They are also the smallest zones, with the exception of zone 1. In zones similar as the former, with ravines and consolidated urbanization such as 3, 5, 6, 7, 10, 11, 12, 13 and 21, show different vegetation cover (20%–40%). Zones 2 and 17 are exceptions. The first has larger area of ravines and the latter includes a military facility. This would also explain why zone 17 has a high vegetation share in spite of its size.
Zones 14 and 15, exhibit a higher share in vegetation cover due to the presence of ravines. The eastern-most and largest zones, such as 16, 18, 24 and 25, are less consolidated and have ravines. These zones have vegetation shares of over 40% and the soil cover is between 14% and 30% suggesting the presence of agricultural areas. All of these zones are undergoing urbanization processes towards residential, commercial and industrial land uses, with varying intensities. This could also signal a future trade-off between urban development and vegetation loss.
Regarding land use in Guatemala City, we can see a Protective-Residential pattern (55% approx. of total land uses) due in part of the Municipal Ecological Belt zoning that under current land management plan restricts development [102] and single house developments. Representatives of this are zones 2 and 15 in which almost 70% of their surfaces have these uses. In other areas, this could be changing toward zones of the Aurora-Cañas corridor [102], which include 13, 9, 4, 1 and 2 that are being oriented towards densification via multi-story and mixed use high rise buildings.
Zones like 4 and 9 are mainly Economic zones due to their commercial and transport largest share (Approx. is 80% combined in both zones). On the other side zones 24 and 25 are Productive-Protection zones with residential states large and related to agriculture, low density street network values and large areas protected by the municipal ecological belt [102]. Institutional use comprise both private and government institutions, in this regard, zone 17 have a high value due to a large military brigade. Zone 1 share is due to the high diversity of institutional uses with high number of spaces for education, administrative, religious, health, cultural and services.
Recreative use has a low share compared to others, zones 11 and 24 have more area of this use due to large sport facilities like golf courses. Zone 7 share is related to a large park and sports space near the ravine. Industrial use share is low in the city, it is probably due to the establishing of industries in nearby municipalities. Zone 12 and 6 still have higher shares, since the former zone was occupied by larger industries since decades ago and the latter have a historical use of mining for cement [103,104]. Both zones are going to change and probably diminish the area of industrial use in the future.

4.1.2. Urban Green Spaces of Guatemala City

Land-use and land-cover maps were key to identifying the UGF main elements of the city. It also aid to spotlight green cover not recognized in national former studies due to their coarse spatial resolution [105]. Guatemala City’s urban green spaces comprise about 43% of its total area, which translates into approximately 106 m2 per capita. To have a better estimate we need to take into account accessibility because in the prevailing neoliberal logic in the region’s cities [106], real estate firms lead urbanization processes [107] that enforce the disappearance of public spaces [108]. Ongoing privatization of urban space is occurring in Guatemala City [109], which affects environmental justice regarding accessibility of green spaces [110].
In an initial cautious approximation, Guatemala City urban green percentage are higher than other nearby cities like México City, with 11%, San Salvador, with 23%, San José, with nearly 24%. They are also similar to Tegucigalpa, with 46% but lower than Managua, with 50% [111,112,113,114,115]. These numbers are not yet comparable since the measurements that they are based on used metropolitan or municipal boundaries and, accordingly, their extent is variable. To explain this regional pattern and current green per capita, availability, accessibility and distribution of UGF needs to be evaluated together [116,117].
UGS distribute over many urban land uses, like gardens which can be found in commercial, institutional and others. It was possible to classify these using detailed urban land-use maps and green cover. This allowed us to identify UGS that are difficult to find in the literature because of its size [118]. Citizens’ most frequent perceptions recognized UGS types such as: urban forests, gardens and parks. They were less likely to identify street green spaces and vertical green as examples of UGS. We can conjecture that the reason for this is that the most frequently recognized are easily seen, perceived or experienced as public or domestic urban space while, in contrast, the less frequently recognized are smaller or not green enough to be considered a type of green space.
The spatial pattern of UGS have a historical dimension that is linked to property size, architectural design and ravine presence, which vary across zones. As examples, in central zones, fragmentation of residential space occurred during the 20th century, leading to smaller places. This led to a decline in space for gardens, which can be seen today in these zones. In other zones like zone 15, larger plots were planned intended for citizens with higher financial income at that time [100]. These plots had more areas designed to become green spaces and they have not suffered subdivision, therefore this zone still has more garden surface.
Urban forests are common in zones that have ravines because of natural restrictions on construction. Nevertheless, precarious settlements have managed to settle in these areas [119] together with approved urban developments for higher income citizens. This has resulted not only in different patterns of vegetation loss among zones but also in an increase of population at risk.
Sport space patterns derive from two distinct vectors. Firstly, a private vector targets high-income citizens by building large equestrian and golf courses, which are located in zones 11, 16 and 24. Secondly, a mixed vector in which government, municipal and small business actions build spaces like the Olympic Stadium, different sports federations and small football fields throughout zones 5, 6 and 13. Regarding parks and plazas–the public green par excellence–the city’s small amount of park area suggest that, combined to the prevailing neoliberal logic, public stakeholders lacked power to enforce the creation of more of this type [108]. A similar pattern of these spaces and possible inequality in their distribution occurs in Honduran cities [120] and Panamá City [121]. This is in a large part explained by the privileges afforded to private urban development. Agricultural and silvicultural spaces, vacant spaces and forested spaces are localized in the less urbanized parts in zones like 18, 24 and 25. This pattern in the north east of the city can be described as a rur-urbanization process [122].

4.2. Urban Planning Implications of Green Fabric Analysis

In this section, we discuss the zones ensembles with results from citizens’ interactions with UGS. We extend the discussion towards the Metropolitan area as important planning processes and instruments are presently happening, like Plan Director 2040, Zones local plans and Tejido Verdeazul Metropolitano [58,63].
Activities here aim at promoting urban sustainability and are embedded in expertise pluralism and gaps as well as in power relations between stakeholders. In Guatemala City, local and municipal planning navigate a matrix of market-based real estate and areas with precarious living conditions. Therefore, we consider acquiring information on UGF, as an essential support tool for more inclusive and less unilateral decisions on environmental policies in the city. Urban planning of UGF must consider three important aspects: First, it must avoid the reinforcement of segregation and inequalities of citizens and households regarding access and use of UGF. Second, it must protect citizens against spatial displacement due to elitist green gentrification and limit push effects by social housing proportions [123]. Third, urban space is socially constructed and there is a need to balance power between different stakeholders, resulting in a more participatory urbanism [124].
As a new territorial plan is currently in process called “Plan Director 2040” and local plans for zones [63] there is room available to incorporate actions in Guatemala City urban planning taking into account the UGF even at the neighborhood level [125]. Having in mind the aspects reflected before and with this opportunity window, we propose three actions specific for Guatemala City zones ensembles: 1) the creation of new elements, 2) the protection of elements and 3) the enhancement of the mosaic of elements. These actions are framed within the United Nations Sustainable Development Goal 11 and the Quito Declaration of the New Urban Agenda [126].

4.2.1. Creation of New UGF Elements

This action is urgently needed for clusters 1, 3 and 4. As is revealed by our results, citizens are not satisfied with the amount of green space in their zones. We recommend using the street network in other zones, taking as an example the greening of the streets in the historic center of the city as other examples suggest for areas with no available space [125]. Ensuring a diversity of species is required so the use of a single species of trees should be avoided [127]. Recognizing the configuration of new spaces can enhance connectivity. Thus, the arrangement of new spaces is key. The distribution is even for UGS, however, a neighborhood analysis can show which of them have less green spaces and where the priorities to intervene are, as was also the case in San Luis Potosí, México [128].
Cluster 4 has a low amount of UGF and no available space for it. It is the densest cluster. The use of streets spaces is a clear option but, fundamentally, the use of buildings for vertical green like green façades and green roofs can overcome this lack of horizontal space. Cluster 3 can also consider vertical green installation and make use of vacant or disputed land to enhance the amount of UGF. Adding vertical green and green roofs can significantly improve temperatures and reduce runoff [129]. For both clusters, special attention should be paid to the distribution and types of UGS patterns. This can improve levels of aggregation, connectivity and evenness.
In clusters 5 and 6, there is a possibility of designing large urban parks because of land availability. A participatory urbanism is recommended to implement these green spaces since, as our results show, this would guarantee support from the citizens. There is a perception that the city needs UGS mainly for recreation.

4.2.2. Protection of UGF Elements

This action is suggested for clusters 2 and 6. Nevertheless, every cluster with urban forests must embrace a protective approach to their UGF. The protection of the Ecological Municipal Belt is officially recognized [102] but it is not an official protected area and their management regime needs to be elaborated. As our results show, the UGS in this belt has been widely recognized by citizens as very important. This has implications for management because 98% of people claim these spaces should not be used for other purposes. It highlights the worries of citizens to overcome the use of these spaces for illegal dumpsites as recognized time ago [130] contributing to a major socioecological problem of the city [48].
We also propose two complementary practices. First, the use of urban forests (ravines) with high diversity and better ecological conditions should be restricted and monitored taking morphology into account [131]. Second, Local UGF Management Plans should be started that include the restoration of degraded areas and a proposal for the recreational use of some others.
Another protection measure concerns gardens, special green and other green spaces, since they will become crucial for adaptation to the effects of climate change [132]. These comprise almost 16% of total UGS. Protection of these spaces through incentives for owners may also foster care of these spaces. Here we also include clusters 1 and 5, which show an important presence of gardens. So far, these spaces have been neglected in Guatemala City but they are crucial for urban biodiversity and ecosystem services [133]. In some cities, such as in Nicaragua, Costa Rica and Panama [134,135,136], private green spaces account for a large share of green spaces and provide important space for biodiversity. This could be the case for Guatemala City as well. Efforts to deepen our knowledge of these private spaces of green can reveal important aspects of UGF and their specific contribution to wellbeing [137].

4.2.3. Enhancing the Mosaic of UGF

Action is suggested for clusters 5 and 6. These clusters with more UGF are well connected and, at the same time, are suitable to experiencing land-use change in the future. Thus, this signals a potential conflict between urban uses and calls for urgent planning in order to create a balance between new developments in commercial and residential land and maintaining at least 50% of areas under UGF.
Agricultural green space is important since it provides goods for the city but unfortunately, no estimate of production exists. These spaces also need protection and be promoted in other areas to strength the establishment of urban farming in the city [138]. Enhancing also means regenerating the ecological dimension by recovering degraded land [139]. This action requires innovation and creativity in designing a mosaic of UGS of various sizes and forms. This will maintain a high diversity of UGF and, at the same time, maintain connectivity, distribution and evenness. By using a land mosaic we extend the limits towards the nearby municipalities and their green spaces.

4.2.4. Urban Expansion and the Metropolitan Area

Guatemala City’s urban area and population is growing beyond its municipal borders since the 1960‘s [67]. Since then, delimiting the borders of a metropolitan area were proposed based on functional links between nearby municipalities or in the expansion of the urban area [103,140]. The necessity to declare officially the Metropolitan Area of Guatemala City has been postponed several times but is urgent in order to do better planning and overcome problems collectively [66].
One problem is vegetation cover loss and disconnection of green spaces in metropolitan municipalities due to land use change in favor of built-up infrastructures steered by private interests [141]. Nevertheless, there is still time to address the control of urban sprawl by strengthening Urban Green Fabrics in these municipalities as has been suggested in other contexts [34].
The three actions suggested here for specific ensembles of zones in Guatemala City can be thought and expand to a metropolitan scale in which new green spaces types will be identified. We share views in processes and outcomes currently occurring like the proposal of a Metropolitan blue and green fabric that enforce our suggestions to protect, connect and restore green spaces at the metropolitan level with a collaborative view [58]. We should add the need to enhance the metropolitan land mosaic via different types of green spaces and land uses in which peri-urban green areas are key to connectivity [142].

4.3. Uncertainties

Sources of uncertainties in the results relate to the origin of the datasets and the different resolutions of the datasets. With the high resolution of the remote sensing images, some pixels were misclassified, due to shadows and mixed spectral reflectance. There were mismatches between official Municipality datasets and between the remote sensing images. In order to fix this, we made a careful and exhaustive manual and visual evaluation of all layers from the Municipality using Google Earth and other available internet information. There are plots with unidentified used and all these maps are a snapshot in time, possible changes have occurred since and therefore they can be improved.

5. Conclusions

The analysis of the Urban Green Fabric of Guatemala City shows that 44% of the city is covered with vegetation and the main primary land uses are Protective and Residential. This analysis also revealed the main material weft of this fabric, which are 11 urban green spaces types. Combining remote sensing images and land use were key in obtaining our results. We contribute to the increasing use of these technologies for ecologically sound policies in regions with scarce published studies [143].
Guatemala City UGS spatial pattern is clustered. Six ensembles of zones were identified based on indicators about distribution, amount, configuration and composition characteristics of green spaces. We also contributed with information about preferences and perceptions of UGF, which are also scant in the region [92]. This is relevant when thinking about the non-material dimension of UGF and opens the possibility to understand citizens and improve urban planning of UGF in the city. To promote sustainable urban planning of UGF we suggested three actions for the zones ensembles: (1) the creation of new UGF, (2) the protection of existing UGF and, (3) the enhancement of existing UGF.
The data and information generated by this study will be handed over to stakeholders to contribute to strengthening the planning efforts of Guatemala City. Obtaining reliable information on urban material conditions like UGF is critical to decision making and for a dignified urban life. As urban expansion occurs in nearby municipalities, the paradox of urban growth and loss of ecosystems [144] can be tackled with UGF incorporated into planning. The way is clear for further analysis of the complexity of the UGF in Guatemala City and beyond.
In order to create an in-depth understanding of the UGF and their benefits we suggest engaging in assessments both at the metropolitan and at the neighborhood level. Other important aspects of human nature interactions like values of urban nature can be revealed. Using a critical view exploring whom and where UGF benefits occur. That is addressing environmental justice or injustices and current socio-environmental vulnerabilities. These paths aim toward supporting better decision making in urban planning and improving the environmental conditions of the city and its metropolitan area.

Supplementary Materials

The following are available online at https://www.mdpi.com/2073-445X/10/1/18/s1, Figure S1: Methodological flux of high-resolution image processing for land cover mapping. Figure S2: Share of Urban Land Cover per zones in Guatemala City. Table S1: Urban Land Cover estimations for Guatemala City zones. Table S2: Urban land use classes of Guatemala City. Figure S3: Share of Urban Land Uses per zones in Guatemala city. Table S3: Urban land uses area (%) per zones in Guatemala City. Table S4: Green spaces of Guatemala City’s Urban green fabric. Table S5: Share of total urban green spaces per zones total area in Guatemala City. Table S6: Zones’ share of UGS in Guatemala City. Figure S4: Local Moran’s I results for urban green spaces in Guatemala City. Figure S5: Dendrogram Agglomerative Hierarchical Clustering of Zones in Guatemala City based on indicators. Table S7: Indicators for Guatemala City zones. Figure S6: boxplots of indicators in each cluster of zones in Guatemala City. Figure S7: Code cloud of reasons to support the creation of a large urban park in Guatemala City.

Author Contributions

Conceptualization, F.C.-C. and D.H.; methodology, F.C.-C., T.W. and D.H.; formal analysis, F.C.-C. and T.W.; investigation, F.C.-C.; data curation, F.C.-C. and T.W.; writing—original draft preparation, F.C.-C.; writing—review and editing, F.C.-C., T.W. and D.H.; visualization, F.C.-C.; supervision, D.H. All authors have read and agreed to the published version of the manuscript.

Funding

This research was funded by Deutsche Akademische Austausch Dienst DAAD grant to Fernando Castillo. The Deutsche Bundesstiftung Umwelt DBU [German Federal Environmental Foundation] scholarship to Thilo Wellman. Project ENABLE, funded through the 2015-2016 BiodivERsA COFUND, with the national funders The Swedish Research Council for Environment, Agricultural Sciences and Spatial Planning, Swedish Environmental Protection Agency, German Aeronautics and Space Research Centre, National Science Centre [Poland], The Research Council of Norway and the Spanish Ministry of Economy and Competitiveness. In addition, Dagmar benefited from the GreenCityLabHue Project [FKZ 01LE1910A] and the CLEARING HOUSE [Collaborative Learning in Research, Information-sharing and Governance on How Urban forest-based solutions support Sino-European urban futures] Horizon 2020 project [No 1290/2013]. Dagmar contributed to this paper also as part of the EU Horizon 2020 project CONNECTING Nature–COproductioN with NaturE for City Transitioning, Innovation and Governance [Project Number: 730222].

Informed Consent Statement

Informed consent was obtained from all subjects involved in the questionnaire survey.

Acknowledgments

We thank Jessica Jache, Sofia Salas and Patricia Calderón for their contribution in reviewing and making helpful suggestions to improve the paper. We thank Digital Globe Foundation for the kindly donation of the WorldView-2 satellite images to Fernando Castillo. Also to the Municipality of Guatemala, in which offices collaborated in the review of urban green types and supplying important spatial information: Dirección de Planificación Urbana, Urbanística, Dirección de Medio Ambiente y Dirección de Información Geográfica Municipal. We thank Genesis Quiñónez for the city illustration in the graphical abstract.

Conflicts of Interest

The authors declare no conflict of interest. The funders had no role in the design of the study; in the collection, analyses, or interpretation of data; in the writing of the manuscript, or in the decision to publish the results.

References

  1. María, A.; Acero, J.L.; Aguilera, A.; García Lozano, M. Central America Urbanization Review. Making Cities Work for Central America. Directions in Development; World Bank: Washington, DC, USA, 2017; pp. 27–63. [Google Scholar] [CrossRef] [Green Version]
  2. United Nations, Department of Economic and Social Affairs, Population Division. World Urbanization Prospects: The 2018 Revision; (ST/ESA/SER.A/420); United Nations, Department of Economic and Social Affairs, Population Division: New York, NY, USA, 2018; 126p. [Google Scholar]
  3. Lungo, M. Ciudad grande, país pequeño: Los desafíos de la gestión metropolitana en. Centroamérica. In Repensando la experiencia urbana de América Latina: Cuestiones, Conceptos y Valores; Ribeiro, T., Ed.; CLACSO: Buenos Aires, Argentina, 2000; pp. 125–142. [Google Scholar]
  4. Aguilera, A. How Urbanization is transforming Central America. In Central America Urbanization Review. Making Cities Work for Central America; Maria, A., Aguilera, G., Eds.; World Bank Group: Washington, DC, USA, 2017; Chapter 1; pp. 27–64. [Google Scholar] [CrossRef] [Green Version]
  5. Calderón, R. Violence and social exclusion in urban contexts in Central America. In Social Theories of Urban Violence in the Global South. Toward Safe and Inclusive Cities; Salahub, J.E., Gottsbacher, M., De Boer, J., Eds.; Routledge: Abingdon, UK; New York, NY, USA, 2018; Chapter 6; pp. 99–120. [Google Scholar] [CrossRef]
  6. Gencer, E. An Overview of Urban Vulnerability to Natural Disaster and Climate Change in Central America & the Caribbean Region; Working Paper 78; Enrico Mattei Foundation: Milan, Italy, 2013; 25p. [Google Scholar] [CrossRef] [Green Version]
  7. ECLAC (Economic Commission for Latin America and the Caribbean). Climate Change in Central America: Potential Impacts and Public Policy Options (LC/MEX/L.1196/Rev.1); Central American Agricultural Council (CAC); Council of Ministers of Health of Central America (COMISCA); Central American Commission for Environment and Development (CCAD); Council of Ministers of Finance/Treasury of Central America and Dominic Republic (COSEFIN); Secretariat of Central American Economic Integration (SIECA); Central American Integration System (SICA); United Kingdom Department of International Development (UKAID); Danish International Development Agency (DANIDA); United Nations Publication: Mexico City, Mexico, 2015; 176p, Available online: https://repositorio.cepal.org/bitstream/handle/11362/39150/S1800827_en.pdf?sequence=7&isAllowed=y (accessed on 10 November 2020).
  8. Lungo, M. Expansión urbana y regulación de la tierra en Centroamérica: Antiguos problemas, nuevos desafíos. In El Rostro Urbano de América Latina; Ribeiro, T., Ed.; CLACSO: Buenos Aires, Argentina, 2003; pp. 257–272. [Google Scholar]
  9. Parnell, S.; Elmqvist, T.; McPhearson, T.; Nagendra, H.; Sörlin, S. Introduction: Situating knowledge and action for an urban planet. In The Urban Planet. Knowledge towards Sustainable Cities; Elmqvist, T., Bai, X., Frantzeskaki, N., Griffith, C., Maddox, D., McPhearson, T., Parnell, S., Romero-Lankao, P., Simons, D., Watkings, M., Eds.; Cambridge University Press: Cambridge, UK, 2018; pp. 1–16. [Google Scholar] [CrossRef] [Green Version]
  10. Taylor, L.; Hochuli, D.F. Defining greenspace: Multiple uses across multiple disciplines. Landsc. Urban Plan. 2017, 158, 25–38. [Google Scholar] [CrossRef] [Green Version]
  11. Gomez-Baggethun, E.; Gren, A.; Barton, D.; Langemeyer, J.; McPhearson, T.; O’Farrell, P.; Andersson, E.; Hamstead, Z.; Kremer, P. Urban ecosystem services. In Urbanization, Biodiversity, And Ecosystem Services: Challenges and Opportunities. A Global Assessment; Elmqvist, T., Fragkias, M., Goodness, J., Güneralp, B., Marcotulio, P., McDonald, R., Parnell, S., Schewenius, M., Sendstad, M., Seto, K., Wilkinson, C., Eds.; Springer: Dordrecht, The Netherlands, 2013; Chapter 11; pp. 175–251. [Google Scholar] [CrossRef] [Green Version]
  12. Benton-Short, L.; Keeley, M.; Rowland, J. Green infrastructure, green space, and sustainable urbanism: Geography’s important role. Urban Geogr. 2019, 40, 330–351. [Google Scholar] [CrossRef]
  13. Kim, J.; Kaplan, R. Physical and Psychological Factors in Sense of Community. Environ. Behav. 2004, 36, 313–340. [Google Scholar] [CrossRef]
  14. Wood, E.; Harsant, A.; Dallimer, M.; De Chavez, A.C.; McEachan, R.R.C.; Hassall, C. Not All Green Space Is Created Equal: Biodiversity Predicts Psychological Restorative Benefits from Urban Green Space. Front. Psychol. 2018, 9, 2320. [Google Scholar] [CrossRef]
  15. Jennings, V.; Bamkole, O. The Relationship between Social Cohesion and Urban Green Space: An Avenue for Health Promotion. Int. J. Environ. Res. Public Health 2019, 16, 452. [Google Scholar] [CrossRef] [Green Version]
  16. Wu, J.; Wang, M.; Li, W.; Peng, J.; Huang, L. Impact of Urban Green Space on Residential Housing Prices: Case Study in Shenzhen. J. Urban Plan. Dev. 2014, 141, 05014023. [Google Scholar] [CrossRef]
  17. Engström, G.; Gren, Å. Capturing the value of green space in urban parks in a sustainable urban planning and design context: Pros and cons of hedonic pricing. Ecol. Soc. 2017, 22, 21. [Google Scholar] [CrossRef] [Green Version]
  18. Bowler, D.E.; Buyung-Ali, L.; Knight, T.M.; Pullin, A.S. Urban greening to cool towns and cities: A systematic review of the empirical evidence. Landsc. Urban Plan. 2010, 97, 147–155. [Google Scholar] [CrossRef]
  19. Nowak, D.J.; Hirabayashi, S.; Doyle, M.; McGovern, M.; Pasher, J. Air pollution removal by urban forests in Canada and its effect on air quality and human health. Urban For. Urban Green. 2018, 29, 40–48. [Google Scholar] [CrossRef]
  20. Lindholm, G. The Implementation of Green Infrastructure: Relating a General Concept to Context and Site. Sustainability 2017, 9, 610. [Google Scholar] [CrossRef] [Green Version]
  21. Mell, I. Green infrastructure: Reflections on past, present and future praxis. Landsc. Res. 2017, 42, 135–145. [Google Scholar] [CrossRef] [Green Version]
  22. Finewood, M.H.; Matsler, A.M.; Zivkovich, J. Green Infrastructure and the Hidden Politics of Urban Stormwater Governance in a Postindustrial City. Ann. Am. Assoc. Geogr. 2019, 109, 909–925. [Google Scholar] [CrossRef]
  23. Ahern, J. Green infrastructure of cities: The spatial dimension. In Cities of the Future towards Integrated Sustainable Water and Landscape Management; Novotny, V., Brown, P., Eds.; IWA Publishing: London, UK, 2007; Chapter 17; pp. 267–283. [Google Scholar]
  24. Pauleit, S.; Ambrose, B.; Endersson, E.; Anton Buijs, A.; Haase, D.; Elands BHansen, R.; Kowarik, I.; Kronenburg, J.; Mattijssen, T.; Stahl, A.; et al. Advancing urban green infrastructure in Europe: Outcomes and reflections from the GREEN SURGE project. Urban For. Urban Green. 2019, 40, 4–16. [Google Scholar] [CrossRef]
  25. Benedict, M.A.; McMahon, E.T. Green Infrastructure: Linking Landscapes and Communities; Island Press: Washington, DC, USA, 2006; 320p. [Google Scholar]
  26. Larkin, B. The Politics and Poetics of Infrastructure. Annu. Rev. Anthr. 2013, 42, 327–343. [Google Scholar] [CrossRef] [Green Version]
  27. Lennon, M. Green infrastructure and planning policy: A critical assessment. Local Environ. 2015, 20, 957–980. [Google Scholar] [CrossRef] [Green Version]
  28. Evans, J. Ecology in the Urban Century: Power, Place and the Abstraction of Nature. In Grounding Urban Natures. Histories and Futures of Urban Ecologies; Ernstson, H., Sörlin, S., Eds.; MIT Press: Cambridge, MA, USA, 2019; pp. 303–322. [Google Scholar] [CrossRef]
  29. Allen, A. Peri-urbanization and the Political Ecology of Differential Sustainability. In A Routledge Handbook on Cities of the Global South; Parnell, S., Oldfeld, S., Eds.; Routledge: London, UK, 2014; pp. 522–538. [Google Scholar] [CrossRef]
  30. Smith, N. Uneven Development: Nature, Capital and the Production of Space; Blackwell: Oxford, UK, 1984; p. 344. [Google Scholar]
  31. Harvey, D. Justice, Nature and the Geography of Difference; Blackwell: Oxford, UK, 1996; p. 480. [Google Scholar]
  32. Wachsmuth, D.; Angelo, H. Green and Gray: New Ideologies of Nature in Urban Sustainability Policy. Ann. Am. Assoc. Geogr. 2018, 108, 1038–1056. [Google Scholar] [CrossRef]
  33. Davies, C.; Lafortezza, R. Urban Green infrastructure in Europe: Is grenspace planning and policy compliant? Land Use Policy 2017, 69, 93–101. [Google Scholar] [CrossRef]
  34. Gavrilidis, A.A.; Niță, M.R.; Onose, D.A.; Badiu, D.L.; Năstase, I.I. Methodological framework for urban sprawl control through sustainable planning of urban green infrastructure. Ecol. Indic. 2017, 96, 67–78. [Google Scholar] [CrossRef]
  35. Saaroni, H.; Amorim, J.; Hiemstra, J.; Pearlmutter, D. Urban Green Infrastructure as a tool for urban heat mitigation: Survey of research methodologies and findings across different climatic regions. Urban Clim. 2018, 24, 94–110. [Google Scholar] [CrossRef]
  36. Sturiale, L.; Scuderi, A. The role of Green infrastructures in Urban Planning for climate change adaptation. Climate 2019, 7, 119. [Google Scholar] [CrossRef] [Green Version]
  37. Tzoulas, K.; Korpela, K.; Venn, S.; Yli-Pelkonen, V.; Kaźmierczak, A.; Niemelä, J.; James, P. Promoting ecosystem and human health in urban areas using Green Infrastructure: A literature review. Landsc. Urban Plan. 2007, 81, 167–178. [Google Scholar] [CrossRef] [Green Version]
  38. Environmental Protection Agency—EPA. 2020. Available online: https://www.epa.gov/green-infrastructure/what-green-infrastructure (accessed on 10 November 2020).
  39. Breuste, J. The Green City: General Concept. In Making Green Cities; Breuste, J.H., Artmann, M., Ioja, C., Qureshi, S., Eds.; Springer: Cham, Swtizerland, 2020; Chapter 1; pp. 1–15. [Google Scholar]
  40. Gobierno de España. Estrategia Nacional de Infraestructura Verde y de la Conectividad y Restauración Ecológicas; Vicepresidencia Cuarta del Gobierno, Ministerio para la Transición Ecológica y el Reto Demográfico: Madrid, España, 2020; 250p, Available online: https://www.miteco.gob.es/es/biodiversidad/temas/ecosistemas-y-conectividad/conectividad-fragmentacion-de-habitats-y-restauracion/Infr_verde.aspx (accessed on 25 November 2020).
  41. Echavarría, M.; Zavala, P.; Coronel, L.; Montalvo, T.; Aguirre, L.M. Infraestructura Verde en el Sector de Agua Potable en América Latina y el Caribe: Tendencias, Retos y Oportunidades; ADERASA: Asunción, Paraguay; EcoDecision: Cumbayá, Ecuador; The Nature Conservancy: Arlington, VA, USA; Forest Trends: Washington DC, USA, 2015; 40p. [Google Scholar]
  42. Vásquez, A.L.; Giamnotti, E.; Galdámez, E.; Velásquez, P.; Devoto, C. Green Infrastructure planning to tackle Climate Change in Latin American Cities. In Urban Climates in Latin America; Henríquez, C., Romero, H., Eds.; Springer: Cham, Switzerland, 2019; Chapter 13; pp. 329–354. [Google Scholar] [CrossRef]
  43. Navarrete, D. Formas y conceptos de la urbanización planetaria para una lectura de la ciudad latinoamericana. Andamios 2013, 10, 69–90. [Google Scholar] [CrossRef] [Green Version]
  44. Cuervo, L.M. El Falso Espejo de la Ciudad Latinoamericana; Serie Gestión Pública No. 52; IILPES, CEPAL: Santiago, Chile, 2005; p. 43. Available online: https://www.cepal.org/ilpes/noticias/paginas/2/40352/FalsoEspejo-sgp52.pdf (accessed on 10 November 2020).
  45. Parker, J.; De Baro, M.E.Z. Green infrastructure in the Urban Environment: A systematic quantitative review. Sustainability 2019, 11, 3182. [Google Scholar] [CrossRef] [Green Version]
  46. Rojas, C.; Páez, A.; Barbosa, O.; Carrasco, J.A. Accessibility to urban green spaces in Chilean cities using adaptive thresholds. J. Transp. Geogr. 2016, 57, 227–240. [Google Scholar] [CrossRef]
  47. Macedo, S.S.; Queiroga, E.F.; Campos, A.C.; Galender, F.; Custódio, V. Os Sistemas de Espaços Livres e a Constituição da Esfera Pública Contemporânea no Brasil; EDUSP: Sao Paulo, Brazil, 2018; 415p. [Google Scholar]
  48. Cabrera, F.C.; Haase, D. Guatemala City: A socio-ecological profile. Cities 2018, 72, 379–390. [Google Scholar] [CrossRef]
  49. Brenner, M. Debating planetary urbanization: For an engaged pluralism. Environ. Plan. D Soc. Space 2018, 36, 570–590. [Google Scholar] [CrossRef] [Green Version]
  50. Lawhon, M.; Ernstson, H.; Silver, J. Provincializing Urban Political Ecology: Towards a Situated UPE through African Urbanism. Antipode 2014, 46, 497–516. [Google Scholar] [CrossRef] [Green Version]
  51. Ernstson, H.; Sörlin, S. (Eds.) Toward Comparative Urban Environmentalism: Situating Urban Natures in an Emerging “World of Cities”. In Grounding Urban Natures. Histories and Futures of Urban Ecologies; MIT Press: Cambridge, MA, USA, 2019; pp. 3–53. [Google Scholar] [CrossRef]
  52. Sheppard, E.; Leitner, H.; Maringanti, A. Provincializing Global Urbanism: A Manifesto. Urban Geogr. 2013, 34, 893–900. [Google Scholar] [CrossRef]
  53. Lawhon, M. Situated, Networked Environmentalisms: A Case for Environmental Theory from the South. Geogr. Compass 2013, 7, 128–138. [Google Scholar] [CrossRef]
  54. Dictionary of the Real Academy of the Spanish Language. Available online: https://dle.rae.es/ (accessed on 24 June 2020).
  55. Newman, P.; Kosonen, L.; Kenworthy, J. Theory of urban fabrics: Planning the walking, transit/public transport and automobile/motor car cities for reduced car dependency. Town Plan. Rev. 2016, 87, 429–458. [Google Scholar] [CrossRef]
  56. Duque, L.H. Mallas Urbanas Desplazadas; Editorial Pontificia Universidad Javeriana: Bogotá, Colombia, 2013; p. 141. [Google Scholar]
  57. Netto, V.M. The Social Fabric of Cities; Routledge: London, UK, 2017; p. 250. [Google Scholar] [CrossRef]
  58. MCC—Metrópolis Central Colaborativa. El tejido verdeazul metropolitano. In Reflexiones Sobre la Red de Infraestructuras Ambientales y su Papel en el Ordenamiento Territorial de la Metrópolis Central de la Ciudad de Guatemala; FUNDAECO: Ciudad de Guatemala, Guatemala; Apoyo Urbano: Ciudad de Guatemala, Guatemala; Municipalidad de Guatemala: Ciudad de Guatemala, Guatemala, 2019; p. 59. [Google Scholar]
  59. Feltynowski, M.; Kronenberg, J.; Bergier, T.; Kabisch, N.; Łaszkiewicz, E.; Strohbach, M.W. Challenges of urban green space management in the face of using inadequate data. Urban For. Urban Green. 2018, 31, 56–66. [Google Scholar] [CrossRef]
  60. Thomas, N.; Hendrix, C.; Congalton, R.G. A comparison of urban mapping methods using high-resolution digital imagery. Photogramm. Eng. Remote Sens. 2003, 69, 963–972. [Google Scholar] [CrossRef]
  61. Lambin, E.; Geist, H.; Rindfuss, R. (Eds.) Local Processes with Global Impacts. Introduction. In Land-Use and Land-Cover Change. Local Processes and Global Impacts; Springer: Heidelberg, Germany, 2006; Chapter 1; pp. 1–8. [Google Scholar] [CrossRef]
  62. Dennis, M.; Barlow, D.; Cavan, G.; Cook, P.A.; Gilchrist, A.; Handley, J.; James, P.; Thompson, J.; Tzoulas, K.; Wheater, C.P.; et al. Mapping Urban Green Infrastructure: A novel Landscape-Based approach to incorporating Land Use and Land Cover in the mapping of human-dominated systems. Land 2018, 7, 17. [Google Scholar] [CrossRef] [Green Version]
  63. Municipalidad de Guatemala. Memoria de Labores 2019 de la Dirección de Planificación Urbana; Municipalidad de Guatemala: Guatemala City, Guatemala, 2020; 51p.
  64. MAGA. Atlas Temático de la República de Guatemala; Serie Recursos Naturales, Amenazas y Vulnerabilidad; Ministerio de Agricultura, Ganadería y Alimentación, Gobierno de Guatemala: Guatemala City, Guatemala, 2005. [Google Scholar]
  65. Instituto Nacional de Estadística—INE. XII Censo Nacional de Población. Guatemala. 2020. Available online: www.ine.gob.gt (accessed on 24 May 2020).
  66. AVANCSO. El proceso de Desarrollo Metropolitano de la Ciudad de Guatemala; Cuadernos de Investigación No. 18; AVANCSO: Guatemala City, Guatemala, 2003; 308p. [Google Scholar]
  67. Martínez, F. El proceso de Urbanización en Guatemala. Un Enfoque Demográfico 1950–2002; CEUR; Universidad de San Carlos de Guatemala: Guatemala City, Guatemala, 2014; 266p. [Google Scholar]
  68. McHarg, I. Design with Nature, 25th Anniversary ed.; John Wiley & Sons: Hoboken, NJ, USA, 1995; 208p. [Google Scholar]
  69. DigitalGlobe®. The Benefits of the Eight Spectral Bands of WorldView-2; DigitalGlobe® White Papers; 2010; Available online: https://dg-cms-uploads-production.s3.amazonaws.com/uploads/document/file/35/DG-8SPECTRAL-WP_0.pdf (accessed on 26 January 2018).
  70. Small, C.; Okujeni, A.; van der Linden, S.; Waske, B. Remote Sensing of Urban Environments. In Comprehensive Remote Sensing; Liang, S., Ed.; Elsevier: Oxford, UK, 2018; Volume 6, Chapter 6; pp. 96–127. [Google Scholar]
  71. Breiman, L. Random Forests. Mach. Learn. 2001, 45, 5–32. [Google Scholar] [CrossRef] [Green Version]
  72. Pal, M. Random forest classifier for remote sensing classification. Int. J. Remote Sens. 2005, 26, 217–222. [Google Scholar] [CrossRef]
  73. Carlson, T.N.; Ripley, D.A. On the relation between NDVI, fractional vegetation cover, and leaf area index. Remote Sens. Environ. 1997, 62, 241–252. [Google Scholar] [CrossRef]
  74. Huete Alfredo, R. A soil-adjusted vegetation index (SAVI). Remote Sens. Environ. 1988, 25, 295–309. [Google Scholar] [CrossRef]
  75. Xu, H. Extraction of urban built-up land features from Landsat imagery using a thematic oriented index combination technique. Photogramm. Eng. Remote. Sens. 2007, 73, 1381–1391. [Google Scholar] [CrossRef] [Green Version]
  76. Fernández, I.C.; Wu, J.; Simonetti, J.A. The urban matrix matters: Quantifying the effects of surrounding urban vegetation on natural habitat remnants in Santiago de Chile. Landsc. Urban Plan. 2019, 187, 181–190. [Google Scholar] [CrossRef]
  77. Van Der Linden, S.; Rabe, A.; Held, M.; Jakimow, B.; Leitão, P.J.; Okujeni, A.; Schwieder, M.; Suess, S.; Hostert, P. The EnMAP-Box—A toolbox and application programming interface for EnMAP data processing. Remote Sens. 2015, 7, 11249–11266. [Google Scholar] [CrossRef] [Green Version]
  78. Ballesteros-Olmo, J.; Morata Carrasco, A. Normas para la Clasificación de los Espacios Verdes; Editorial Universidad Politécnica de Valencia: Valencia, España, 2001; 193p. [Google Scholar]
  79. Stanley, B.W.; Stark, B.L.; Johnston, K.L.; Smith, M.E. Urban open spaces in historical perspective: A transdisciplinary typology and analysis. Urban Geogr. 2012, 33, 1089–1117. [Google Scholar] [CrossRef] [Green Version]
  80. Pauleit, S.; Hansen, R.; Lorance Roll, E.; Zölch, T.; Andersson, E.; Luz, A.K.; Szaraz, L.; Tosics, I.; Vierikko, K. Urban Landscapes and Green Infrastructure. In Oxford Research Encyclopedia of Environmental Science; Oxford University Press: Oxford, UK, 2017. [Google Scholar] [CrossRef]
  81. ESRI Inc. ArcGIS Desktop (Version 10.5); Software; Environmental Systems Research Institute: Redlands, CA, USA, 2016. [Google Scholar]
  82. Churchman, A. Disentangling the concept of Density. J. Plan. Lit. 1999, 13, 389–411. [Google Scholar] [CrossRef]
  83. Bourdic, L.; Salat, S.; Nowacki, C. Assessing cities: A new system of cross-scale spatial indicators. Build. Res. Inf. 2012, 40, 592–605. [Google Scholar] [CrossRef]
  84. Forman, R.T.T. Urban Ecology. Science of Cities; Cambridge University Press: Cambridge, UK, 2014; 462p. [Google Scholar]
  85. McGarigal, K.; Cushman, S.A.; Ene, E. FRAGSTATS v4: Spatial Pattern Analysis Program for Categorical and Continuous Maps. Computer Software Program Produced by the Authors at the University of Massachusetts, Amherst. 2012. Available online: http://www.umass.edu/landeco/research/fragstats/fragstats.htm) (accessed on 24 May 2020).
  86. Aguilera, F.; Valenzuela, L.M.; Botequilha-Leitão, A. Landscape metrics in the analysis of urban land use patterns: A case study in a Spanish metropolitan area. Landsc. Urban Plan. 2011, 99, 226–238. [Google Scholar] [CrossRef]
  87. Grafius, D.R.; Corstanje, R.; Harris, J.A. Linking ecosystem services, urban form and green space configuration using multivariate landscape metric analysis. Landsc. Ecol. 2018, 33, 557–573. [Google Scholar] [CrossRef] [PubMed] [Green Version]
  88. Mears, M.; Brindley, P.; Jorgensen, A.; Ersoy, E.; Maheswaran, R. Greenspace spatial characteristics and human health in an urban environment: An epidemiological study using landscape metrics in Sheffield, UK. Ecol. Indic. 2019, 106, 105464. [Google Scholar] [CrossRef]
  89. R Development Core Team. R: A Language and Environment for Statistical Computing; R Foundation for Statistical Computing: Vienna, Austria, 2008; ISBN 3-900051-07-0. Available online: http://www.R-project.org (accessed on 24 May 2020).
  90. FAO. Global Forest Resources Assessment 2020. In Terms and Definitions 2020; Forest Resources Assessment Working Paper 188; FAO: Rome, Italy, 2018; p. 32. [Google Scholar]
  91. Custodio, V. Reestruturação Técnico Produtiva, Forma Urbana e Espaços Livres. In Reflexoes Sobre Espacos Livres na Forma Urbana; Macedo, S., Custodio, V., Garcia, V., Eds.; Universidad de Sao Paulo: Sao Paulo, Brazil, 2018; pp. 55–64. [Google Scholar]
  92. Farahani, L.M.; Maller, C.J. Perceptions and Preferences of Urban Greenspaces: A Literature Review and Framework for Policy and Practice. Landsc. Online 2018, 61, 1–22. [Google Scholar] [CrossRef] [Green Version]
  93. Instituto Nacional de Estadística—INE. XI Censo Nacional de Población y VI de Habitación; INE: Ciudad de Guatemala, Guatemala, 2003.
  94. VERBI Software. MAXQDA 2020 [Computer Software]; VERBI Software: Berlin, Germany, 2019; Available online: maxqda.com (accessed on 24 May 2020).
  95. Alvarez, I.; Gallo, B.; Garcon, E.A.; Oshiro, O. Street Tree Inventory of Campinas, Brazil: An Instrument for Urban Forestry Management and Planning. AUF 2015, 41, 233–244. [Google Scholar]
  96. Rodriguez-Galiano, V.; Ghimire, B.; Rogan, J.; Chicaolmo, M.; Rigol-Sanchez, J. An assessment of the effectiveness of a random forest classifier for land-cover classification. ISPRS J. Photogramm. Remote Sens. 2012, 67, 93–104. [Google Scholar] [CrossRef]
  97. Maxwell, A.E.; Warner, T.A.; Fang, F. Implementation of machine-learning classification in remote sensing: An applied review. Int. J. Remote Sens. 2018, 39, 2784–2817. [Google Scholar] [CrossRef] [Green Version]
  98. Long, Y.; Liu, L. How green are the streets? An analysis for central areas of Chinese cities using Tencent Street View. PLoS ONE 2017, 12, e0171110. [Google Scholar] [CrossRef] [PubMed] [Green Version]
  99. Wu, J.; Feng, Z.; Peng, Y.; Liu, Q.; He, Q. Neglected green street landscapes: A re-evaluation method of green justice. Urban For. Urban Green. 2019, 41, 344–353. [Google Scholar] [CrossRef]
  100. Valladares, R. Infraestructura vial, Barreras naturales y población: Municipio de Guatemala 1994–2005. In El Crecimiento de la Ciudad de Guatemala 1944–2005; Valladares, R., Morán, A., Eds.; Centro de Estudios Urbanos y Regionales, Universidad de San Carlos: San Carlos, CA, USA, 2006; pp. 29–181. [Google Scholar]
  101. Gellert, G. Ciudad de Guatemala: Factores determinantes en su desarrollo urbano (1775 hasta la actualidad). Mesoamérica 1994, 27, 1–68. [Google Scholar]
  102. Municipalidad de Guatemala. Plan de Ordenamiento Territorial. In Municipal Resolution 30-2008 of the Municipal Council of Guatemala City; Municipalidad de Guatemala: Guatemala City, Guatemala, 2008. [Google Scholar]
  103. Municipalidad de Guatemala. EDOM 1972–2000. In Plan de Desarrollo Metropolitano; Dirección de Planificación, Municipalidad de Guatemala: Guatemala City, Guatemala, 1972; 398p. [Google Scholar]
  104. Dosal, P. The political economy of Guatemalan industrialization, 1871–1948: The career of Carlos P. Novella. Hisp. Am. Hist. Rev. 1988, 68, 321–358. [Google Scholar] [CrossRef] [Green Version]
  105. GIMBOT. Mapa de Bosques y Uso de la Tierra 2012; El Grupo Interinstitucional de Monitoreo de Bosques y Uso de la Tierra—GIMBOT: Guatemala City, Guatemala, 2014. [Google Scholar]
  106. Brites, W.F. La ciudad en la encrucijada neoliberal. Urbanismo mercado-céntrico y desigualdad socio-espacial en América Latina. URBE Rev. Bras. Gest. Urbana 2017, 9, 573–586. [Google Scholar] [CrossRef] [Green Version]
  107. Irrazával, F. El Imaginario “Verde” y el Verde Urbano como instrumento de consumo Inmobiliario: Configurando las condiciones ambientales del Área Metropolitanad de Santiago. Revista INVI 2012, 15, 73–103. [Google Scholar] [CrossRef] [Green Version]
  108. Cabrera, M. Donde la ciudad pierde su esencia: Lucha de las clases medias por el espacio público y el derecho a la ciudad en Ciudad de Panamá. In El Derecho a la Ciudad en America Latina. Visiones Desde la Política; Carrion, F., Erazo, J., Eds.; UNAM: Ciudad de México, México; IDRC/CRDI: Ottawa, ON, Canada; CLACSO: Buenos Aires, Argentina, 2016; pp. 91–108. [Google Scholar]
  109. Bravo, M.A. Proceso de Urbanización, Segregación Social, Violencia Urbana y “Barrios Cerrados” en Guatemala 1944–2002; CEUR; Universidad de San Carlos: San Carlos, CA, USA, 2007; 231p. [Google Scholar]
  110. Kronenberg, J.; Haase, A.; Łaszkiewicz, E.; Antal, A.; Baravikova, A.; Biernacka, M.; Dushkova, D.; Filčak, R.; Haase, D.; Ignatieva, M.; et al. Environmental justice in the context of urban green space availability, accessibility, and attractiveness in postsocialist cities. Cities 2020, 106, 102862. [Google Scholar] [CrossRef]
  111. Procuraduría Ambiental y del Ordenamiento Territorial Del D.F.—PAOT. Presente y Futuro de las Áreas Verdes y del Arbolado de la Ciudad de México; Procuraduría Ambiental y del Ordenamiento Territorial Del D.F.—PAOT: Ciudad de México, México, 2010; p. 261.
  112. Escalante, A.; Grande, C. Análisis de estructuras verdes en la ciudad capital de El Salvador. In Proceedings of the XV Conferencia de Ordenamiento Territorial y Urbanismo, La Habana, Cuba, 9–13 November 2015. [Google Scholar]
  113. Municipality of San Jose—MSJ. Áreas Verdes, Deportivas y Recreativas del Cantón San José; Municipality of San Jose—MSJ: San José, Costa Rica, 2014; p. 40.
  114. Angel, S.; Bartley, K.; Derr, M.; Malur, A.; Mejía, J.; Nuka, P.; Perlin, M.; Sahai, S.; Torrens, M.; Vargas, M. Rapid Urbanization in Tegucigalpa, Honduras Preparing for the Doubling of the City’s Population in the Next Twenty-Five Years; Report; Woodrow Wilson School of Public and International Affairs, Princeton University: Princeton, NJ, USA, 2004; p. 74. [Google Scholar]
  115. Japan International Cooperation Agency—JICA. Proyecto del Plan Maestro para el Desarrollo Urbano del Municipio de Managua en la República de Nicaragua; Final Report; JICA: Tokyo, Japan, 2017; p. 472.
  116. Quesada, G.; Arias, J. Análisis Geográfico de la segregación socio-ambiental de la Ciudad de San José. Revista Geográfica América Central 2013, 51, 101–123. [Google Scholar]
  117. Pérez Paredes, E.; Martínez, M.C. La planeación de las áreas verdes como una expresión del derecho a la ciudad: Análisis de caso de Atizapán de Zaragoza, Estado de México. In El Derecho a la Ciudad en America Latina. Visiones Desde la Política; Carrion, F., Erazo, J., Eds.; UNAM: Mexico City, Mexico; IDRC/CRDI: Ottawa, ON, Canada; CLACSO: Buenos Aires, Argentina, 2016; pp. 431–450. [Google Scholar]
  118. Hernández-Moreno, A.; Reyes-Paecke, S. The effects of urban expansion on green infrastructure along an extended latitudinal gradient (23° S–45° S) in Chile over the last thirty years. Land Use Policy 2018, 79, 725–739. [Google Scholar] [CrossRef]
  119. Morán, A. Segregación, Vulnerabilidad y Exclusión Social en la Ciudad de Guatemala; CEUR, Universidad de San Carlos de Guatemala: Guatemala City, Guatemala, 2011; 160p. [Google Scholar]
  120. Sosa, C.M. Descripción de la infraestructura cultural y recreativa enl a ciudad del Distrito Central de Honduras. Revista Ciencias Espaciales 2012, 5, 34–46. [Google Scholar] [CrossRef]
  121. Municipality of Panamá—MUAP; Interamerican Development Bank—BID. Plan de Acción. Panamá Metropolitana. Sostenible, Humana y Global; Municipalidad de Panamá—MUPA: Ciudad de Panamá, Panamá; Banco Interamericano de Desarrollo—BID: Washington DC, USA, 2015; 288p. [Google Scholar]
  122. Mateo, J.M. El Medio Ambiente Urbano y La Sostenibilidad Ambiental desde una perspectiva espacial. El Cable Revista Arquitectura 2004, 3, 55–70. [Google Scholar]
  123. Anguelovsky, I.; Irazábal-Zurita, C.; Connolly, J. Grabbed Urban Landscapes: Socio-spatial. Tensions in Green Infrastructure Planning in Medellín. IJURR 2018, 43, 133–156. [Google Scholar] [CrossRef]
  124. Cámara, C. Las iniciativas de participación ciudadana en el urbanismo. El urbanismo participativo, una nueva forma de entender la ciudad y la ciudadanía en la configuración de espacios públicos. Revista Estudios Urbanos Ciencias Sociales 2014, 2, 19–32. [Google Scholar]
  125. Apud, A.; Faggian, R.; Sposito, V.; Martino, D. Suitability analysis and planning of Green infrastructure in Montevideo, Uruguay. Sustainability 2020, 12, 9683. [Google Scholar] [CrossRef]
  126. Reyes, J.A.; Villanueva, M.C.; Garcia, A. Green Areas and Environmental Justice: Toward the Urban Sustainability of León, Guanajuato. In Sustainable Development Research and Practice in Mexico and Selected Latin American Countries; Leal Filho, W., Noyola-Cherpitel, R., Medellín-Milán, P., Ruiz-Vargas, V., Eds.; World Sustainability Series; Springer: Cham, Switzerland, 2018. [Google Scholar] [CrossRef]
  127. Miller, R.; Hauer, R.; Werner, L. Urban Forestry. In Planning and Managing Urban Greenspaces, 3rd ed.; Waveland Press: Long Grove, IL, USA, 2015. [Google Scholar]
  128. Moreno-Mata, A. Urban Sprawl, Environmental Justice and Equity in the Access to Green Spaces in the Metropolitan Area of San Luis Potosí, Mexico. In Sustainable Development Research and Practice in Mexico and Selected Latin American Countries; Leal Filho, W., Noyola-Cherpitel, R., Medellín-Milán, P., Ruiz-Vargas, V., Eds.; World Sustainability Series; Springer: Cham, Switzerland, 2018. [Google Scholar] [CrossRef]
  129. Gill, S.E.; Handley, J.F.; Ennos, A.R.; Pauleit, S. Adapting cities for climate change: The role of green infrastructure. Built Environ. 2007, 33, 115–133. [Google Scholar] [CrossRef] [Green Version]
  130. Monterroso, R.; Villatoro, J.; Mazariegos, E. Análisis Estratégico de Potencialidad y Economía Territorial de los Barrancos del Municipio de Guatemala Como Herramienta para la Sostenibilidad en los Asentamientos Humanos; Final Report DIGI; USAC: Guatemala City, Guatemala, 2014. [Google Scholar]
  131. Lausch, A.; Schaepman, M.E.; Skidmore, A.K.; Truckenbrodt, S.C.; Hacker, J.M.; Baade, J.; Bannehr, L.; Borg, E.; Bumberger, J.; Dietrich, P.; et al. Linking the Remote Sensing of Geodiversity and Traits Relevant to Biodiversity—Part II: Geomorphology, Terrain and Surfaces. Remote Sens. 2020, 12, 3690. [Google Scholar] [CrossRef]
  132. Loram, A.; Tratalos, J.; Warren, P.H.; Gaston, K.J. Urban domestic gardens (X): The extent & structure of the resource in five major cities. Landsc. Ecol. 2007, 22, 601–615. [Google Scholar] [CrossRef]
  133. Farahani, L.M.; Maller, C.J.; Phelan, K. Private Gardens as Urban Greenspaces: Can They. Compensate for Poor Greenspace Access in Lower Socioeconomic Neighbourhoods? Landsc. Online 2018, 59, 1–18. [Google Scholar] [CrossRef] [Green Version]
  134. González-García, A.; Gómez, A. Private Urban Greenspaces or “Patios” as a Key Element. in the Urban Ecology of Tropical Central America. Hum. Ecol. 2008, 36, 291–300. [Google Scholar] [CrossRef]
  135. Cerdas, V.M.; Castro, L.P.; Vargas, M.R.; Rojas, T.B. Indicadores ambientales de áreas verdes urbanas para la gestión en dos ciudades de Costa Rica. Revista Biología Tropical 2018, 66, 1421–1435. [Google Scholar] [CrossRef] [Green Version]
  136. BID—Interamerican Development Bank. Estudios Base para Ciudad de Panamá. Estudio de Crecimiento Urbano; Municipalidad de Panamá—MUPA: Ciudad de Panamá, Panamá; Banco Interamericano de Desarrollo—BID: Washington DC, USA, 2016; 288p. [Google Scholar]
  137. Haase, D.; Jänicke, C.; Wellmann, T. Front and back yard green analysis with subpixel vegetation fractions from earth observation data in a city. Landsc. Urban Plan. 2019, 182, 44–54. [Google Scholar] [CrossRef]
  138. FAO. Growing Greener Cities in Latin America and the Caribbean; FAO Report on Urban and Peri-Urban Agriculture in the Region; FAO: Rome, Italy, 2014; 51p. [Google Scholar]
  139. Thomson, G.; Newman, P. Urban fabrics and urban metabolism—From sustainable to regenerative cities. Resour. Conserv. Recycl. 2018, 132, 218–229. [Google Scholar] [CrossRef]
  140. Alvarado, L. El proceso de urbanización en Guatemala; Centro de Estudios Urbanos—CEUR, Universidad de San Carlos de Guatemala: Guatemala City, Guatemala, 1983; 35p. [Google Scholar]
  141. CEUR. Gestión Metropolitana. In Un Acercamiento a las Problemáticas Municipales de la Nueva Guatemala de la Asunción, Quetzaltenango y La Antigua Guatemala; Universidad de San Carlos de Guatemala: Guatemala City, Guatemala, 2012; pp. 25–103. [Google Scholar]
  142. Verdú-Vázquez, A.; Fernández-Pablos, E.; Lozano-Diez, R.V.; López-Zaldívar, Ó. Green space networks as natural infrastructures in peri-urban areas. Urban Ecosyst. 2020, 1–18. [Google Scholar] [CrossRef] [PubMed]
  143. Wellmann, T.; Lausch, A.; Andersson, E.; Knapp, S.; Cortinovis, C.; Jache, J.; Scheuer, S.; Kremer, P.; Mascarenhas, A.; Kraemer, R.; et al. Remote sensing in urban planning: Contributions towards ecologically sound policies? Landsc. Urban Plan. 2020, 204, 103921. [Google Scholar] [CrossRef]
  144. Vásquez, A. Infraestructura verde, servicios ecosistémicos y sus aportes para enfrentar el cambio climático en ciudades: El caso del corredor ribereño del río Mapocho en Santiago de Chile. Revista Geografía Norte Grande 2016, 63, 63–86. [Google Scholar] [CrossRef]
Figure 1. Guatemala City geographical location. Upper panel to the right shows Guatemala City inside the Republic of Guatemala and the rest of Central American countries. Map illustrates Guatemala City situation in the Central Highlands [1533 m]. Numbers indicate the city’s zones. Own sketch.
Land 10 00018 g001
Figure 2. Analysis of Urban Green Fabric (UGF) in Guatemala City Methodological approach. Gray boxes represent initial information and data. White ovals show methods and techniques used for analysis. Green boxes, results and Blue box the discussed actions to inform urban planning in Guatemala City.
Land 10 00018 g002
Figure 3. Urban Land Cover for Guatemala City. Left images are true color composition of WorldView-2 image and right images show the random forest (RF) classification result. Images in A show a detail from zone 16 with low built up area and new housing near a golf course. B Detail from zone 1, in this case “Plaza de la Constitución” [Main square]. C Rural area with more soil cover of agricultural fields. D Vegetation in a dense built up area known as “El Trébol.” (WorldView-2 images courtesy of Digital Globe Foundation).
Land 10 00018 g003
Figure 4. Urban land use in Guatemala City. This map represents distribution pattern of primary land use classes in the city. Ten primary uses were identified at the block level. Numbers represent the zones of the city.
Land 10 00018 g004
Figure 5. Urban green spaces (UGS) in Guatemala City. The visual representation of the distribution of green spaces types is shown here. Boxes below show detail of four zones of the city. To the left is a true color composition of WorldView-2 image and the right represent UGS. A depicts part of zone 6, B represents a piece of zone 15, C shows a zone 21 portion and D reveals part of zone 18.
Land 10 00018 g005
Figure 6. Percentage of Urban Green Spaces types per zones in Guatemala City. Each bar represents total green spaces in the zone and each color the share of each type. Description of each urban green space type is in Table 1.
Land 10 00018 g006
Figure 7. The use of indicators based on green spaces and their spatial characteristics measured by selected metrics allow identification of six ensembles of zones. Upper is the spatial representation of the clusters. Lower graphs show quantitative data of ensembles based on four indicators used for the clustering are shown. (The rest are in Figure S6).
Land 10 00018 g007
Figure 8. Comparison between citizen’s perception and actual amount of public green spaces in zones of Guatemala City. In the center the zones of Guatemala City. To the left the bars show the proportion of public green spaces area from each zone total area. To the right, bars show the proportion of mentions of each zone, which the citizens perceived with more amount of green spaces. Data was standardized using min-max normalization.
Land 10 00018 g008
Figure 9. Code cloud of Guatemala City citizens’ answers to an intervention in green spaces. The majority support using urban forests (ravines) only as green spaces. All the reasons come from responses that agreed with this use.
Land 10 00018 g009
Table 1. Urban green spaces types of Guatemala City.
TypesDescription
Urban forestsUsually located in the municipal green belt on the ravines. Have a continuous cover of trees and shrubs. Include secondary succession. Can be private or public spaces. FAO conditions for forest were followed [90].
Urban-forested spacesRemnants of natural tree cover or designed cover with trees. Can be present in different urban land uses and built-up areas but not inside ravines boundaries. Can be private or public. FAO conditions for forest were followed [90].
Urban wetlandsSpaces with permanent water or prone to flooding with natural vegetation. Usually near rivers, lakes, lagoons and deltas. Includes spaces in peri-urban areas also. They are mainly public.
Agricultural and silvicultural fieldsSpaces with a prevalence of soil cover/grass cover [also some tree/shrub cover] and mainly used for different type of agriculture, animal husbandry and forest plantations. Predominantly private spaces.
Vacant spacesSpaces with vegetation/soil cover mixing. Present in abandoned lots or not yet built. Commonly near built-up areas and in different urban land uses. Mainly private.
Street network
green spaces
Spaces with tree/shrub/herbaceous vegetation cover in street network elements. These green spaces include single trees, aligned street trees, flowerbeds, spontaneous vegetation and so forth. Mainly public spaces
GardensSpaces with mixed vegetation cover in residential, commercial, mixed and institutional areas [government spaces]. Mainly ornamental or managed vegetation. Includes courtyards, front yards, backyards and lawns. Can be private and in less extent, public.
Parks and SquaresSpaces designated as such by the municipality. Found in any urban land use. Includes small [pocket], neighborhood and big [metropolitan] parks. Ecological and archaeological parks. Squares and Garden squares. Mainly public.
Sports spacesGreen spaces for physical activities. They include stadiums and fields for different sports. Elements of recreational land use. Can be private or public.
Special green spacesSpaces with special function within institutional and recreational uses like Botanical and Zoological gardens, Amusement parks and Clubs. University campuses. Cemeteries. Include institutional spaces: Churchyards, Schoolyards. Health facilities green spaces. Public or private.
Vertical green spacesGreen facades, vertical gardens inside different type of buildings within different land uses. Mainly private spaces. Green walls or facades outside of buildings in both private and public spaces.
Other green spacesIncludes gardened spaces like small squares, accompanying green and similar.
Usually of small to medium size, rarely large. Found in different land uses. Mainly private and some public.
Non-determined green spacesGreen spaces with not enough information on urban land use plot for classification purposes.
Table 2. Primary Urban Land Uses of Guatemala City.
Primary Land UseSurface Area (ha)% from Total City Area
Protection7677.133.63
Residential5016.9621.98
Transport2850.8512.5
Productive1559.866.83
Commercial1545.426.77
Institutional1477.446.47
Recreative903.573.96
Non identified701.163.07
Industrial588.812.58
Mixed506.822.22
Total22828.04100
Publisher’s Note: MDPI stays neutral with regard to jurisdictional claims in published maps and institutional affiliations.

